 Investor Presentation November 2012 Exhibit 99.3 |
 1 Forward-Looking Statements This presentation and statements made by representatives of Matador Resources Company (“Matador” or the “Company”) during the course of this presentation include “forward-looking statements” within the meaning of Section 27A of the Securities Act of 1933, as amended, and Section 21E of the Securities Exchange Act of 1934, as amended. “Forward-looking statements” are statements related to future, not past, events. Forward-looking statements are based on current expectations and include any statement that does not directly relate to a current or historical fact. In this context, forward-looking statements often address expected future business and financial performance, and often contain words such as “could,” “believe,” “would,” “anticipate,” “intend,” “estimate,” “expect,” “may,” “should,” “continue,” “plan,” “predict,” ��potential,” “project” and similar expressions that are intended to identify forward-looking statements, although not all forward-looking statements contain such identifying words. Actual results and future events could differ materially from those anticipated in such statements. These forward-looking statements involve certain risks and uncertainties and ultimately may not prove to be accurate, including, but not limited to, the following risks related to our financial and operational performance: general economic conditions; Matador’s ability to execute its business plan, including the success of its drilling program; changes in oil, natural gas and natural gas liquids prices and the demand for oil, natural gas and natural gas liquids; our ability to replace reserves and efficiently develop our current reserves; our costs of operations, delays and other difficulties related to producing oil, natural gas and natural gas liquids; our ability to make acquisitions on economically acceptable terms; availability of sufficient capital to Matador to execute its business plan, including from our future cash flows, increases in our borrowing base, joint venture partners and otherwise; weather and environmental conditions; and other important factors which could cause actual results to differ materially from those anticipated or implied in the forward looking statements. For further discussions of risks and uncertainties, you should refer to Matador’s SEC filings, including the “Risk Factors” section of Matador’s Annual Report on Form 10-K for the year ended December 31, 2011. Matador undertakes no obligation and does not intend to update these forward-looking statements to reflect events or circumstances occurring after the date of this presentation, except as required by law. You are cautioned not to place undue reliance on these forward-looking statements, which speak only as of the date of this presentation. All forward-looking statements are qualified in their entirety by this cautionary statement. |
 Company Summary |
 Founded by Joe Foran in 1983 Foran Oil funded with $270,000 in contributed capital from 17 friends and family members Foran Oil & Matador Petroleum 3 Matador History Matador Resources Company Founded by Joe Foran in 2003 with a proven management and technical team and board of directors Grown through the drill bit, with focus on unconventional reservoir plays, initially in Haynesville In 2008, sold Haynesville rights in approximately 9,000 net acres to Chesapeake for approximately $180 million; retained 25% participation interest, carried working interest and overriding royalty interest Relatively early in the play, redeployed capital into the Eagle Ford, acquiring over 30,000 net acres for approximately $100 million, most in 2010 and 2011 IPO in February 2012 (NYSE: MTDR) had net cash proceeds of approximately $136.6 million Predecessor Entities (1) Tom Brown purchased by Encana in 2004 Matador Today Capital spending focused on developing Eagle Ford and transition to oil Sold to Tom Brown, Inc. in June 2003 for an enterprise value of $388 million in an all-cash transaction (1) |
 4 Investment Highlights Strong Growth Profile with Increasing Focus on Oil / Liquids Oil production up almost five-fold in 2011 and projected to increase 8x to 9x in 2012 2012E capital expenditure program focused on oil and liquids exploration and development High Quality Asset Base in Attractive Areas Eagle Ford provides immediate oil-weighted value and upside Expanding acreage position in Delaware Basin in West Texas Other key assets provide long-term option value on natural gas, with Haynesville, Bossier and Cotton Valley assets all essentially HBP Significant Multi-year Drilling Inventory Strong Financial Position and Prudent Risk Management Proven Management, Technical Team and Active Board of Directors Management averaging over 25 years of industry experience Board with extensive industry experience and expertise as well as significant company ownership Strong record of stewardship for over 28 years Active Exploration Effort Using Science and Technology Ongoing pipeline of new oil and natural gas opportunities, with strong emphasis on science and technology to create value |
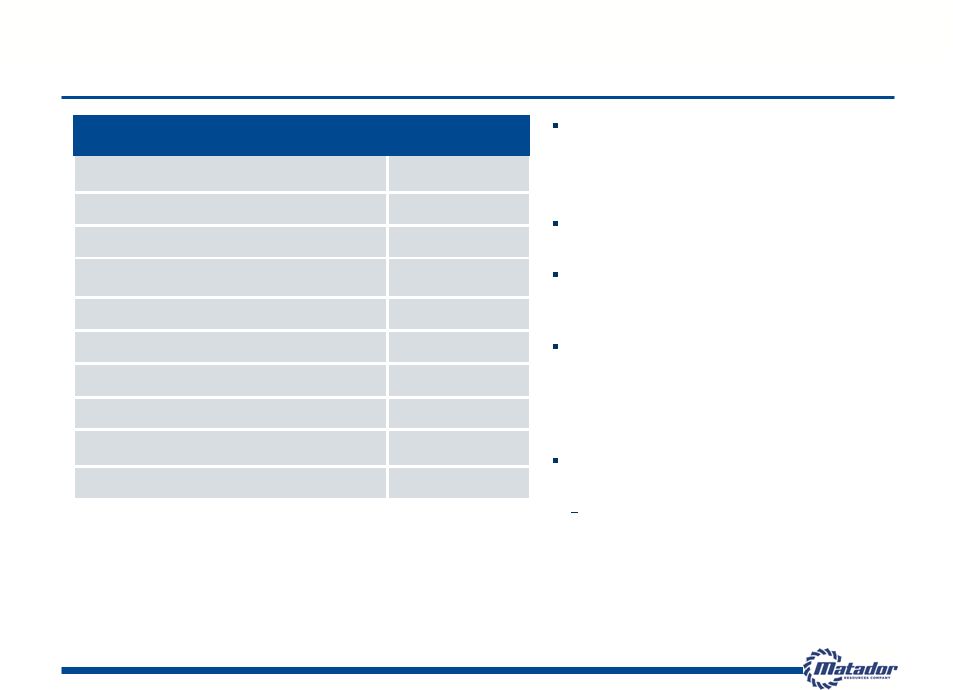
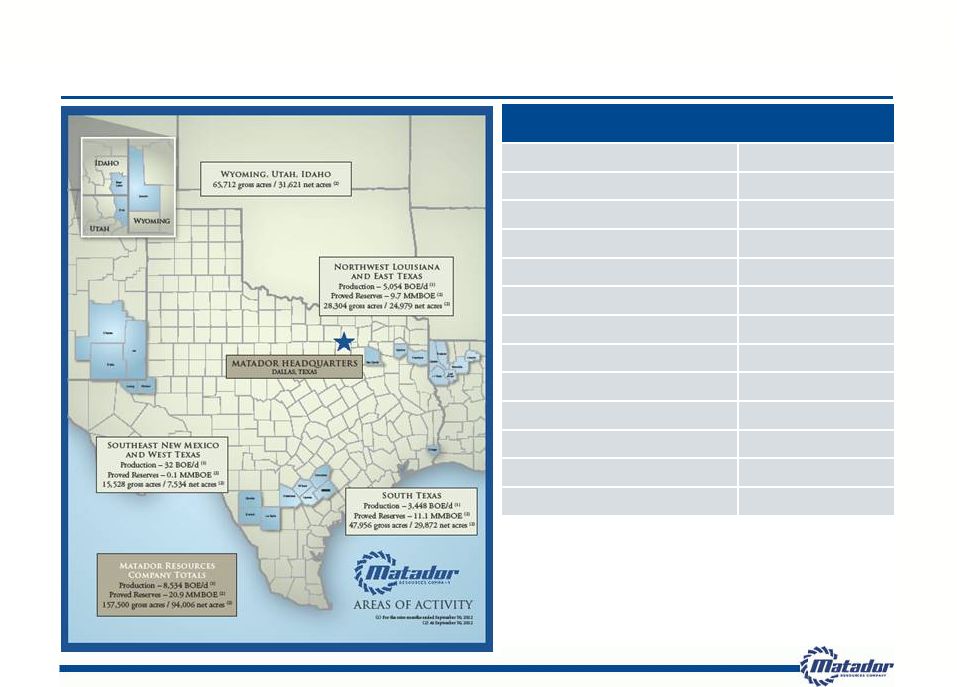 5 Daily Production (1) 8,534 BOE/d Oil Production (% total) 2,876 Bbl/d (34%) Proved Reserves @ 9/30/12 20.9 Million BOE % Proved Developed 61% % Oil 40% (and growing) 2012E CapEx $313 million % Eagle Ford 84% % Oil and Liquids 94% 2012E Anticipated Drilling 29.5 net wells Eagle Ford / Austin Chalk 27.6 net wells Haynesville 1.5 net wells Gross Acreage (2) 157,500 acres Net Acreage (2) 94,006 acres Matador Resources Snapshot Average daily production for the nine months ended September 30, 2012 At September 30, 2012 (1) (2) |
 Eagle Ford South Texas |
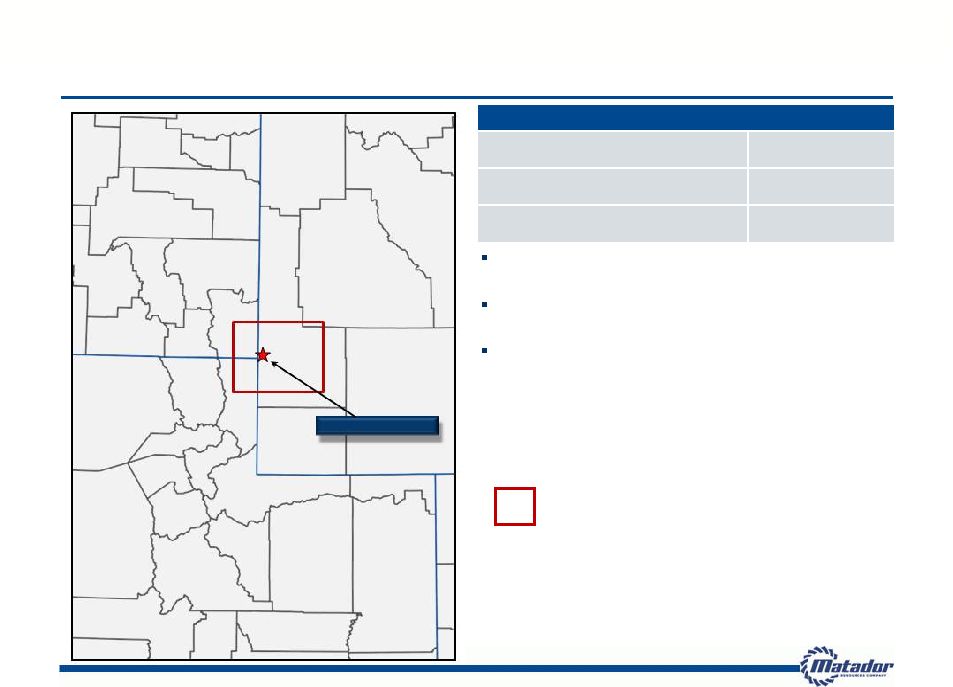
 7 Eagle Ford and Austin Chalk Overview Acreage positioned in some of the most active counties for Eagle Ford and Austin Chalk (including “Chalkleford”) Two rigs running, primarily focused on oil and liquids 2012E capital expenditure program focused on oil and liquids exploration and development Anticipate oil production to constitute approx. 35-40% of total production volume and oil revenues to constitute approx. 75-80% of total oil and natural gas revenues in 2012 Drilling locations are based on 120 acre spacing Currently testing 80-acre spacing on one Eagle Ford property and plan additional tests on other properties before end of 2012 Proved Reserves @ 9/30/12 11.1 Million BOE % Proved Developed 46% % Oil / Liquids 75% Daily Oil Production (1) 3,448 BOE/d Gross Acres (2) 47,956 acres Net Acres (2) 29,872 acres Eagle Ford (2),(3) 29,872 acres Austin Chalk (2),(3) 17,191 acres 2012E Anticipated Drilling 27.6 net wells 2012E CapEx Budget $268.5 million Average daily oil production for the nine months ended September 30, 2012 At September 30, 2012 Some of the same leases cover the net acres shown for Eagle Ford and Austin Chalk. Therefore, the sum for both formations is not equal to the total net acreage (1) (2) (3) |
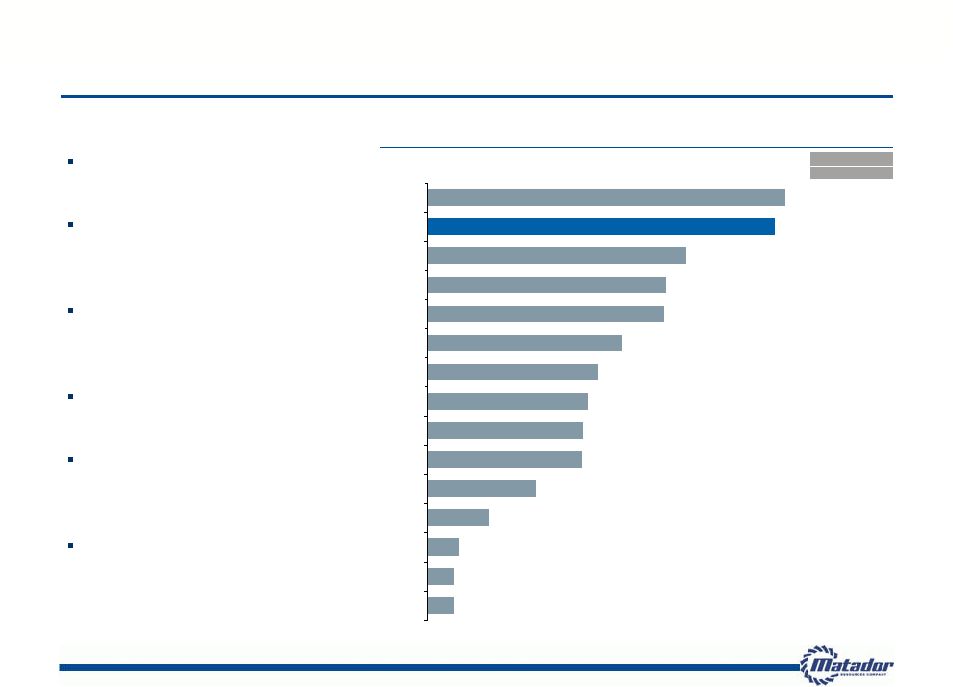 Leverage to Eagle Ford (Net Eagle Ford Acres / EV) (Net Acres / $mm) 8 Leading Eagle Ford Exposure Matador offers significant leverage and focus to the Eagle Ford Approximately 90% of Eagle Ford acreage is in the prospective oil and liquids window All 2012E Eagle Ford drilling focused in the prospective oil and liquids window 84% of 2012 estimated CapEx allocated to Eagle Ford One rig running in the eastern and one in the western portions of the Eagle Ford play Eagle Ford acreage well- positioned throughout the play 2012E Capex (1) % Eagle Ford 53.4 51.8 38.6 35.5 35.3 28.9 25.5 23.9 23.1 23.0 16.1 9.1 4.6 4.0 4.0 SFY MTDR FST NFX GDP SM CRZO PVA CHK ROSE MHR PXD APA PXP APC 64% 84% 45% 30% 57% 63% 36% 7% 40% 93% 92% N/A N/A N/A N/A Note: Reflects companies with greater than 50 Bcfe of proved reserves. Data sourced from public filings; stock price data as of November 7, 2012 close (1) Per operational guidance |
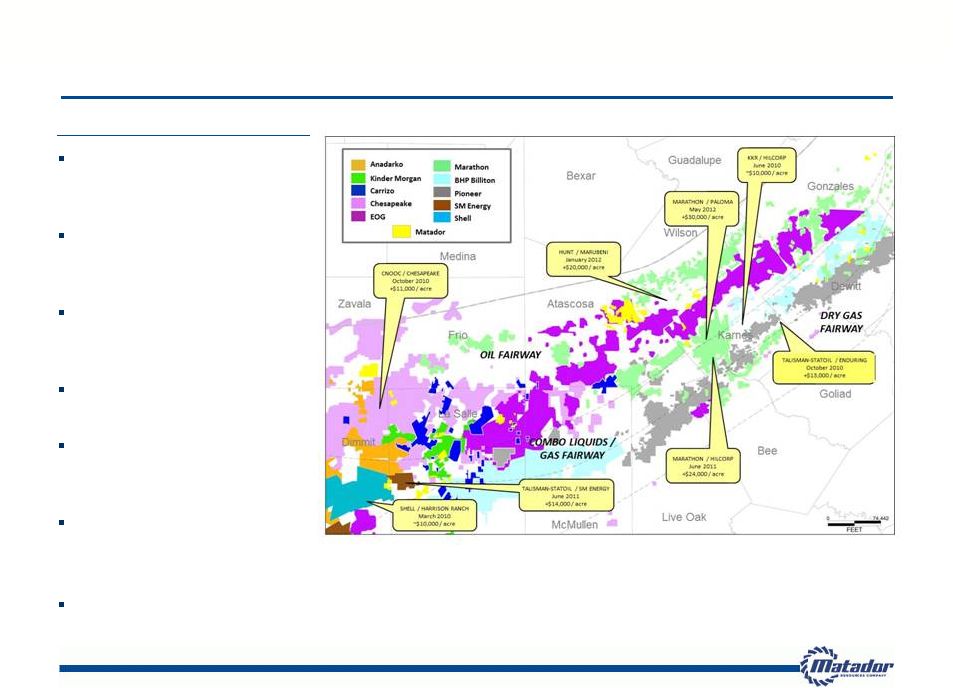 Highlights 9 Eagle Ford Properties are in Good Neighborhoods MTDR acreage in counties with robust transaction activity – “good neighborhoods” Transaction values ranging from $10,000 to $30,000 per acre Our Eagle Ford position has grown to approximately 30,000 net acres Acreage in both the eastern and western areas of the play Approximately 90% of acreage in prospective oil and liquids windows Acreage offers potential for Austin Chalk, Buda, Pearsall and other formations Good reputation with land and mineral owners Note: All Matador acreage at September 30, 2012 and all other acreage based on public information |
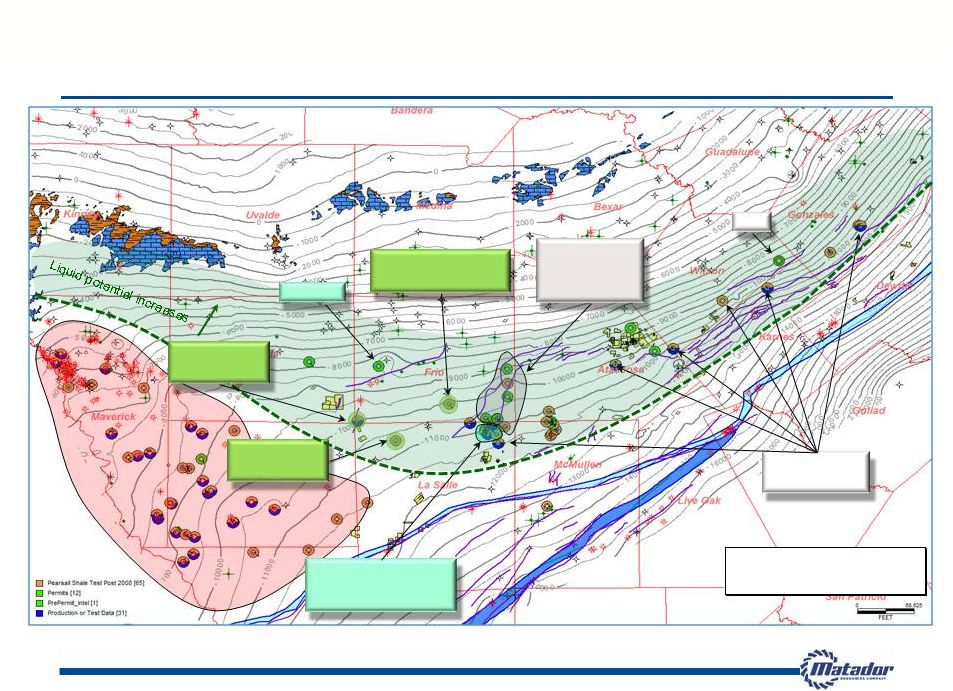
 10 San Antonio Uvalde Medina Zavala Frio Dimmit La Salle Webb Bexar Atascosa McMullen Live Oak Bee Goliad Dewitt Gonzales Wilson COMBO LIQUIDS / GAS FAIRWAY DRY GAS FAIRWAY OIL FAIRWAY Eagle Ford and Austin Chalk Properties GLASSCOCK (WINN) RANCH 8,891 gross / 8,891 net acres EAGLE FORD WEST 14,242 gross / 11,409 net acres EAGLE FORD EAST 7,567 gross / 6,170 net acres EOG OPERATED, MTDR WI ~21% 17,256 gross / 3,402 net acres Note: All acreage at September 30, 2012 EAGLE FORD ACREAGE TOTALS 47,956 gross / 29,872 net acres Karnes Glasscock Ranch Shelton Newman ZLS Martin Ranch Northcut Affleck Troutt Sutton MRC/EOG Pawelek Danysh Sickenius Lyssy Repka RCT Wilson Love Cowey Keseling Finney Lewton Hennig Nickel Ranch Matador Resources Acreage |
 Eagle Ford 24-Hour Stabilized Rates 11 Well Name County Completion Date Perforated Length (1) Frac Stages Oil IP (2)(3) Gas IP (2)(3) Oil Equiv IP (4) Choke Pressure Total (ft.) (Bbl/day) (Mcf/day) (BOE/day) (inch) (psi) 2011 Wells JCM Jr. Minerals 1H La Salle 11/10/2010 3,774 15 164 3,648 772 15/64 3,365 Martin Ranch A 1H La Salle 1/20/2011 4,201 17 1,129 2,821 1,599 34/64 1,550 Affleck 1H Dimmit 2/22/2011 4,711 16 456 5,247 1,331 36/64 1,435 Frances Lewton 1H DeWitt 11/16/2011 5,041 17 1,021 2,574 1,450 13/64 5,000 Martin Ranch A 2H La Salle 11/19/2011 6,772 22 1,318 1,845 1,626 26/64 1,800 Martin Ranch A 3H La Salle 11/26/2011 4,476 15 802 510 887 26/64 1,510 Martin Ranch A 5H La Salle 12/17/2011 4,518 15 893 545 984 26/64 1,250 2012 Wells Martin Ranch A 8H La Salle 1/28/2012 6,092 21 1,089 831 1,228 26/64 1,750 Martin Ranch A 6H La Salle 2/8/2012 6,509 22 689 1,714 975 26/64 1,650 Martin Ranch A 7H La Salle 2/12/2012 4,902 17 609 481 689 26/64 1,040 Martin Ranch B 4H La Salle 2/18/2012 3,551 13 595 968 756 26/64 1,320 Matador Sickenius Orca 1H Karnes 3/16/2012 5,712 19 785 540 875 26/64 820 Northcut A 1H La Salle 3/23/2012 4,446 15 583 592 682 26/64 1,000 Matador Danysh Orca 1H Karnes 4/1/2012 4,962 17 1,012 1,126 1,200 26/64 1,175 Northcut A 2H La Salle 5/1/2012 4,503 15 758 761 885 24/64 950 Matador Pawelek Orca 1H Karnes 6/5/2012 6,103 20 670 739 793 16/64 2,510 Matador Pawelek Orca 2H Karnes 6/7/2012 6,202 28 861 755 987 16/64 2,460 Matador Danysh Orca 2H Karnes 6/10/2012 5,115 17 750 746 874 16/64 2,675 Glasscock Ranch 1H Zavala 6/27/2012 5,352 18 307 0 307 pump 140 Matador K. Love Orca 1H DeWitt 8/10/2012 5,077 17 1,793 2,171 2,155 16/64 5,280 Matador K. Love Orca 2H DeWitt 8/11/2012 4,871 17 1,757 2,126 2,111 16/64 5,900 Average 5,090 18 859 Bbl/day 1,464 Mcf/day 1,103 BOE/day (1) Total length of perforated lateral from the first perforation to the last perforation (2) Rates as reported to the Texas Railroad Commission via W-2 or G-1 form (3) Rates are based on actual, stabilized, 24-hour production on a constant choke size (4) Oil equivalent rates are based on a 6:1 ratio of six Mcf gas per one Bbl oil |
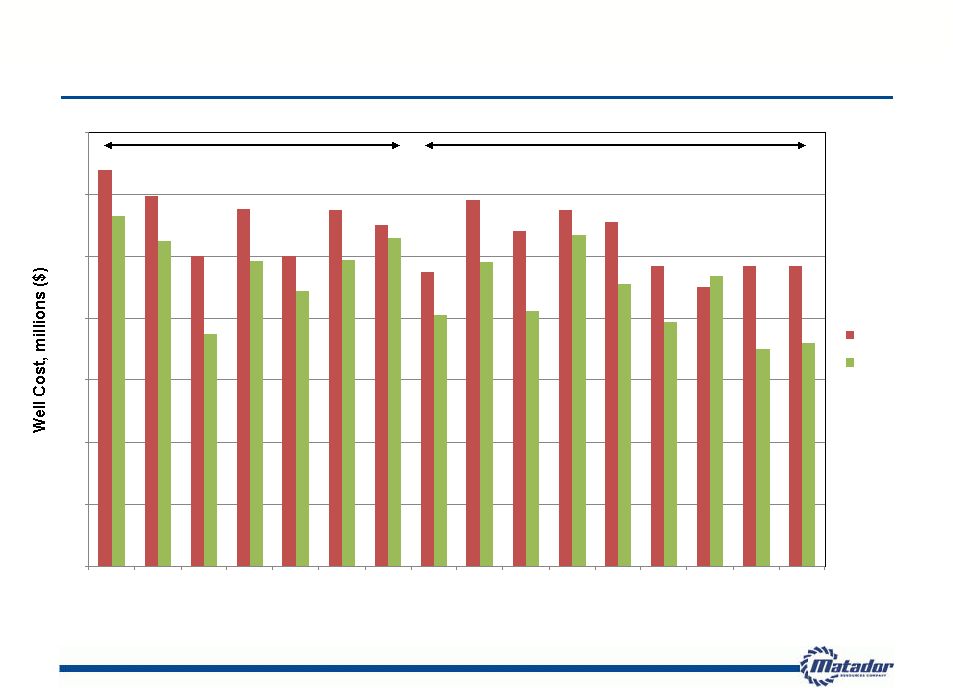 0.0 2.0 4.0 6.0 8.0 10.0 12.0 14.0 1 2 3 4 5 6 7 8 9 10 11 12 13 14 15 16 Budgeted Cost Actual Cost Eagle Ford Well Costs Averaging 15% Less than 2012 Budget Estimates 12 Western Acreage Eastern Acreage Note: 2012 Eagle Ford well drilling and completions costs only compared to budget estimates; costs do not include pipelines and lease facilities |
 Average Frac Stage Cost per Well 13 Note: Wells are displayed in chronological order $0 $50,000 $100,000 $150,000 $200,000 $250,000 $300,000 $350,000 $400,000 1 2 3 4 5 6 7 8 9 10 11 12 13 14 15 16 17 18 19 20 Bauxite White Sand Resin Coated Sand |
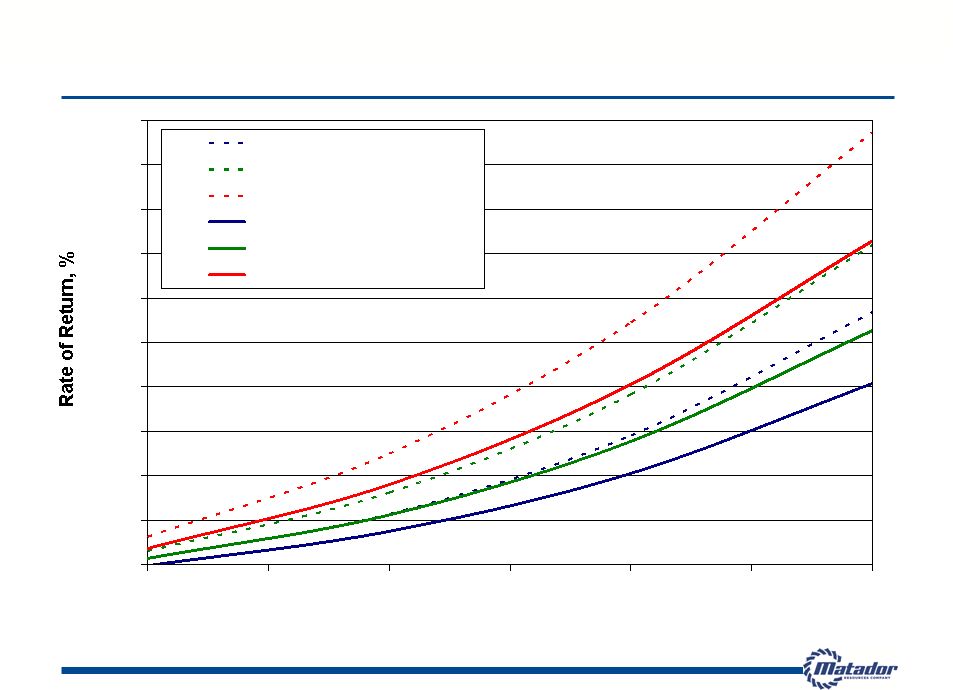
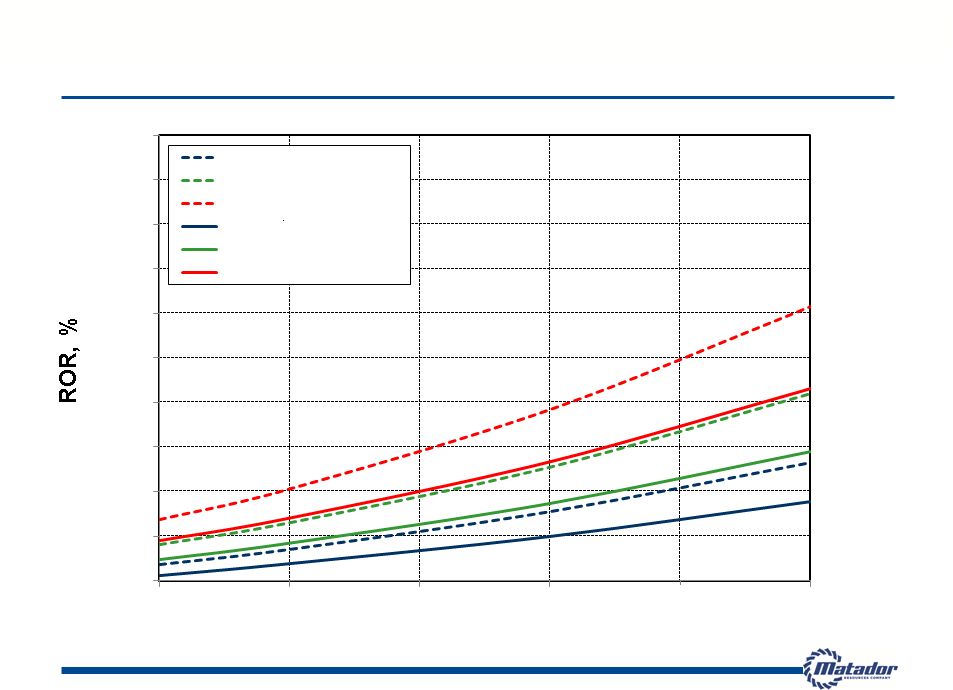
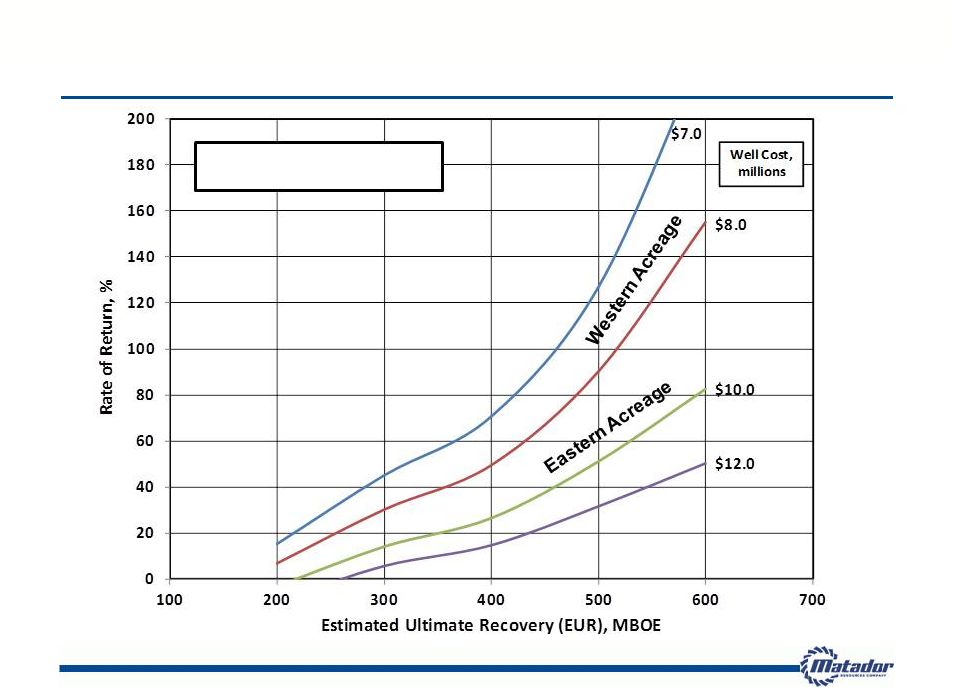 Eagle Ford Well Estimated ROR as a Function of EUR and Well Cost 14 Note: Individual well economics only. NGL price differential +$2.50/Mcf. Oil price differential +$4.30/Bbl. $90.00/Bbl NYMEX oil; $3.00/Mcf NYMEX natural gas |
 15 Technical Advancements in the Eagle Ford Rotary Steerable Tools Drilling time in curve and lateral reduced by 2 days Measurement While Drilling (MWD) telemetry closer to drill bit Improves ability to stay in “sweet-spot” Removes sumps and high-angle curves Improved frac design Increases Stimulated Rock Volume (SRV) Tighter fracture spacing (25% more created fractures than previous design) 35 Bbl/ft. frac fluid (75% increase from previous design) Zipper Fracs (simultaneous frac operations) Daily fixed cost reduced by 20% Increases drainage efficiency Choke size reduction Delays effects of pressure-dependent formation permeability Increases Estimated Ultimate Recovery (EUR) Delays installation of artificial lift Lowers bottom-hole pressure differential Mitigates damage to proppant pack Artificial lift Pumping Units with pump-off controllers on low-gas/oil ratio (GOR) wells Gas-lift valves on high-gas/oil ratio (GOR) wells Electric Submersible Pumps (ESP) to accelerate unloading frac fluids |
 Zavala Eagle Ford & Pearsall Trend |
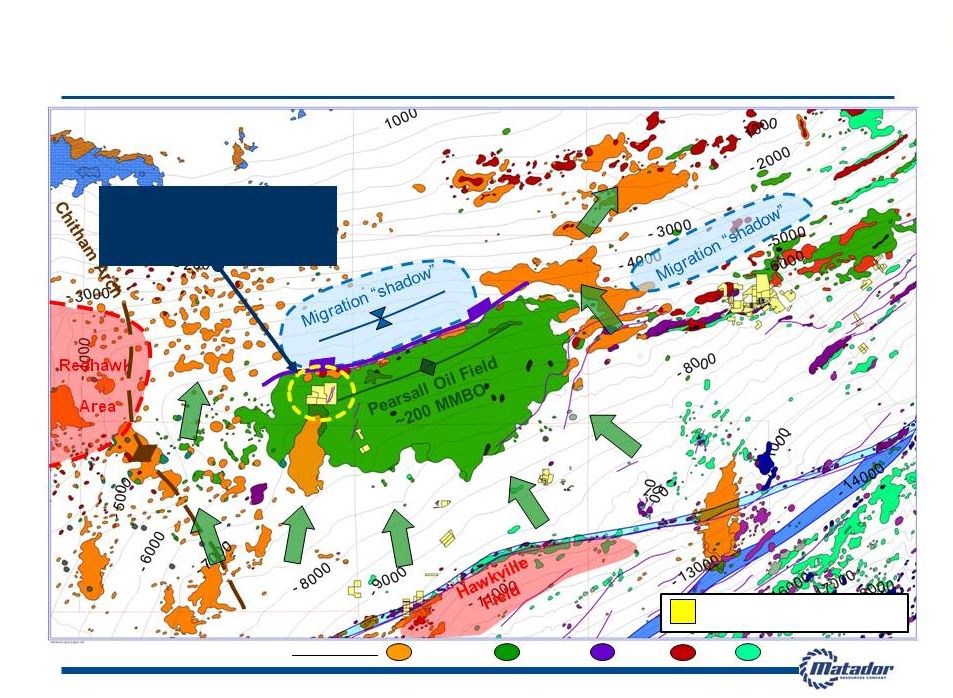 17 South Texas Multi-Pay Petroleum Systems: Upside Potential in Zavala County Note: Information for Pearsall Oil Field sourced from public information Note: All acreage at September 30, 2012 Olmos/Navarro Austin Chalk Oil and Gas Fields: Buda Wilcox 8,891 gross / 8,891 net acres 100% Held By Production (HBP) All Rights, All Depths Matador Resources Acreage Edwards |
 18 Multi-Pay Fairway: Productive and Prospective Pay Zones Austin Chalk Eagle Ford Buda Georgetown Del Rio Edwards Glen Rose Rodessa Pearsall Olmos Navarro ANCC Sligo Historic Conventional Zones Olmos-Navarro Gas and oil fields in shallow section Austin Chalk Upper Austin horizontal drilling Fractured reservoir Buda Primarily productive on structure Fractured reservoir Edwards Productive on structure “New” Unconventional Zones “Chalkleford” (Eagle Ford / Austin Chalk transition zone) Recent results in Pearsall Field from other operators are positive Eagle Ford Lower costs combined with better completion techniques have improved initial results in northern oil window Horizontal Buda Drilling Exploratory play developing to exploit fracturing within the Buda both on and off structure Pearsall Shale Exploratory play, initial test wells now being drilled |
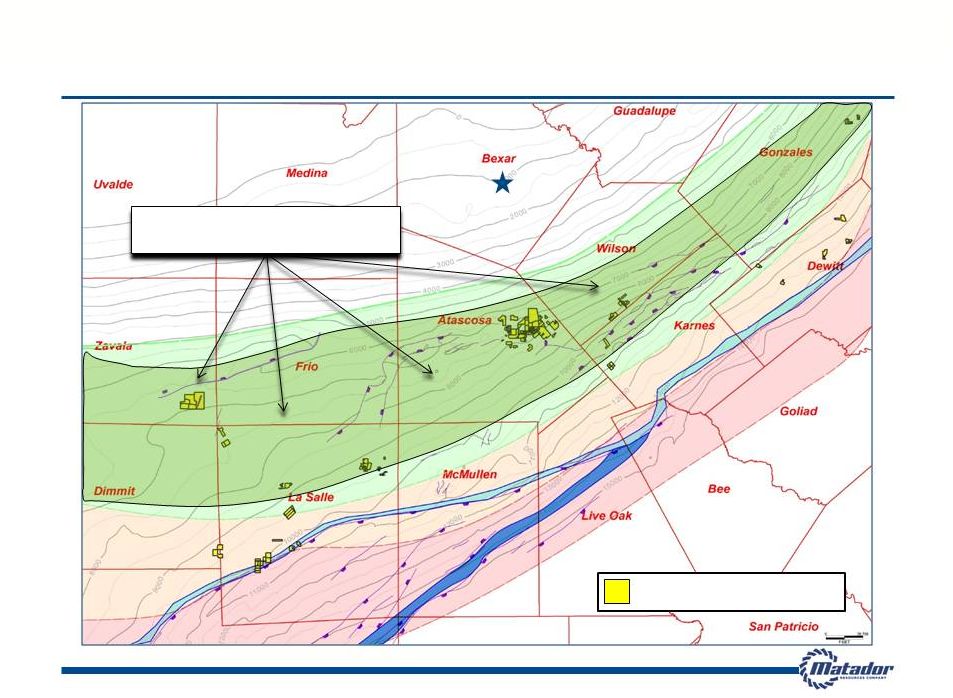 19 San Antonio Emerging Multi-Pay Area in Eagle Ford Oil Fairway and MTDR Acreage OIL FAIRWAY OIL FAIRWAY DRY GAS FAIRWAY DRY GAS FAIRWAY Note: All acreage at September 30, 2012 Multi-Pay Fairway with Pearsall, Austin Chalk and Buda potential Matador Resources Acreage |
 20 South Texas Pearsall Play: Activity & Liquids to Dry Gas Distribution Model EOG Tests Condensate belt 500 – 2000 BC/mo. Top Pearsall Depth Map CI = 500’ Cheyenne Indio Tanks Horiz. program 4 horizs w/ 700 to 450 BCPD plus 4-6 MMCFGPD Chesapeake Wilson C#1HP IP 250 BCPD/ 3 MMCFPD Chesapeake Brownlow #3H Abandoned Test Chesapeake Avant D#1HP 300 BC/mo. Cheyenne Cabot Drilling first Horiz’s after pilot program Showed Encouraging Cond yield (30% stream) PXP Note: Well data available through public sources and interpretation by Matador Resources Anadarko Newfield Chesapeake Shell Gas Activity |
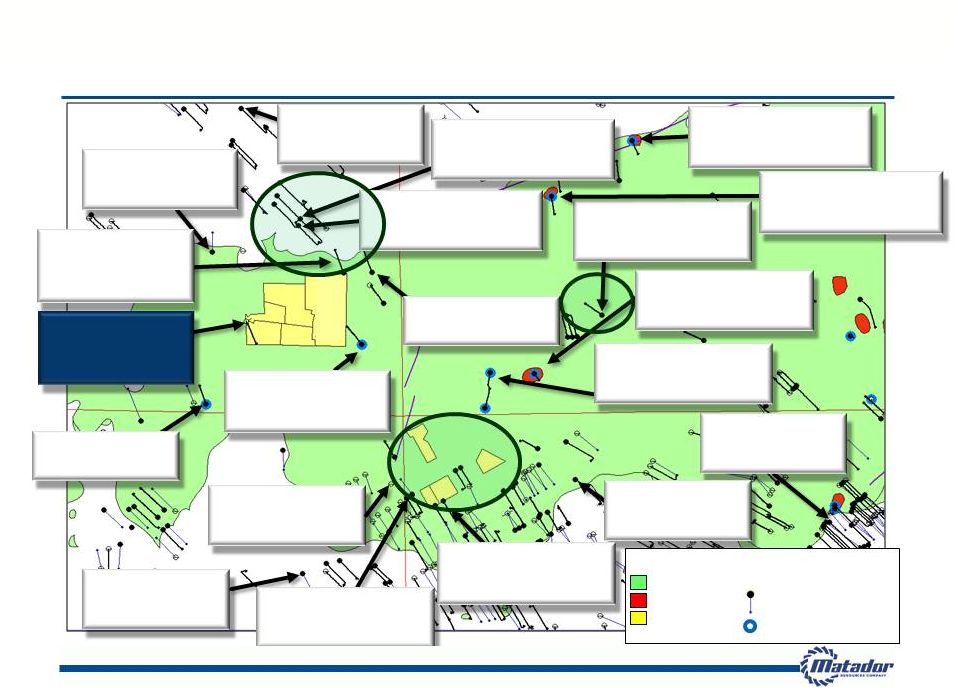 Zavala, Frio, La Salle and Dimmit Counties: Important Matador and Competitor Eagle Ford Wells Since 2011 21 Note: Well data available through public sources and interpretation by Matador Resources (ZaZa) Cenizo Ranch B 3H OIL IP: 208; GAS IP: 260 17/64” choke Best 3 Oil - 8,460 (CHK) Rogers B 2H OIL IP: 560; GAS IP: 175 12/64” choke Best 3 Oil – 31,184 (MTDR) GR 1H 6,125’ Lateral On pump @ 60 BOPD Best 3 Oil – 9,827 Est. EUR = 100,000 BOE (Buffco) Howett 1H OIL IP: 243; GAS IP: 152 22/64” choke Best 3 Oil – 13,991 (Crimson) K M Ranch 2H OIL IP: 457; GAS IP: 326 Last Act. Date – 09/2012 (CHK) Traylor North 2H OIL IP: 405; GAS IP: 78 14/64” choke Best 3 Oil - 19,476 (CHK) Winterbotham A 4H OIL IP: 909 13/64” choke Best 3 Oil – 25,344 (CHK) Winterbotham A 1H OIL IP: 1,448 13/64” choke Best 3 Oil – 37,870 (US Enercorp) Rally Eagle 1H OIL IP: 756 ; GAS IP: 943 48/64” choke Best 3 Oil - 25,138 (Goodrich) Burns A 35H OIL IP: 736; GAS IP: 589 49/64” choke Best 3 Oil – 16,766 (CHK) Brownlow 1H OIL IP: 764; GAS IP: 437 30/64” choke Best 3 Oil – 21,853 (Crimson) K M Ranch 1H Plug back 3076’ Lateral OIL IP: 200; GAS IP: 275 20/64” choke Best 3 Oil – 8,038 (Hughes) LANG 1H OIL IP: 165; GAS IP: 200 18/64” choke Last Act. Date – 09/2012 (Hughes) Heitz 1H OIL IP: 200; GAS IP: 150 26/64” choke (CHK) Bohannam Dim C 1H OIL IP: 466; GAS IP: 174 10/64” choke Best 3 Oil – 18,031 (CHK) Yarbrough B 2H OIL IP: 776; GAS IP: 81 14/64” choke Marketing Issues (BBOG) Coppadge 1H OIL IP: 19; GAS IP: 271 19/64” choke Best 3 Oil - 655 (BBOG) Nickolson 1H OIL IP: 218; GAS IP: 2167 19/64” choke Best 3 Oil - 6,927 (BBOG) Oppenheimer A1 OIL IP: 273; GAS IP: 1400 38/64” choke Best 3 Oil – 9,725 (BBOG) Calvert 1H OIL IP: 170; GAS IP: 1812 28/64” choke Best 3 Oil – 14,292 LEGEND AUSTIN CHALK BUDA/DEL RIO Matador Acreage Buda Wells Wells Spudded Since 1/2011 |
 Haynesville & Cotton Valley Northwest Louisiana and East Texas |
 Highlights 23 Haynesville Positioning Approximately 12,500 gross and 5,800 net acres in Haynesville Tier 1 core area Almost all prospective Haynesville acreage is HBP – provides “natural gas bank” for future development MTDR active as both operator and non-operator in Haynesville play Approximately 1,700 net acres with Bossier potential Haynesville acreage also prospective for shallower targets – Cotton Valley, Hosston – in many areas Approximately 10,000 net HBP acres prospective for Cotton Valley Horizontal play at Elm Grove / Caspiana Note: Matador operates two sections, including the LA Wildlife and the BLM sections, in Tier 1; all other acreage in Tier 1 is non-operated. Note: All acreage at September 30, 2012; HBP = Held by production TIER 3 TIER 2 TIER 1 Bossier Caddo Webster De Soto Red River Bienville Southwest Pine Island Central Pine Island Fee Minerals Rudd #1H Samson Petrohawk Shell Encana Petrohawk Petrohawk Shell Encana Questar Petrohawk Petrohawk -W Tigner Walker H#1 Alt (CV) LA Wildlife H#1 Alt. (HV) Williams 17 H#1 (HV) LA Wildlife (MPC) BLM (MPC) J |
 24 Haynesville Well Economics – Tier 1 Area Natural Gas Price, $/Mcf Note: Individual well economics only. D&C cost = drilling and completion cost. Natural gas price differential = $(0.85)/Mcf. 0 25 50 75 100 125 150 175 200 225 250 3 3.5 4 4.5 5 5.5 6 8 Bcf - $8.5 MM D&C Cost 9 Bcf - $8.5 MM D&C Cost 10 Bcf - $8.5 MM D&C Cost 8 Bcf - $9.5 MM D&C Cost 9 Bcf - $9.5 MM D&C Cost 10 Bcf - $9.5 MM D&C Cost |
 25 Cotton Valley Horizontal Well Economics Note: Individual well economics only. D&C cost = drilling and completion cost. Natural gas price differential = -6% 0.0 10.0 20.0 30.0 40.0 50.0 60.0 70.0 80.0 90.0 100.0 $3.50 $4.00 $4.50 $5.00 $5.50 $6.00 Natural Gas Price, $/Mcf 4.0 Bcf - $6 MM D&C Cost 5.0 Bcf - $6 MM D&C Cost 6.0 Bcf - $6 MM D&C Cost 4.0 Bcf - $7 MM D&C Cost 5.0 Bcf - $7 MM D&C Cost 6.0 Bcf - $7 MM D&C Cost |
 Delaware Basin Southeast New Mexico and West Texas |
 27 Matador Today Gross Acres (1) 15,528 acres Net Acres (1) 7,534 acres Southeast New Mexico / West Texas Foothold of existing production and reserves On August 10, 2012, acquired approx. 4,900 gross and 2,900 net acres prospective for the Wolfbone play in the Delaware Basin in Loving County, Texas. (1) At September 30, 2012 RANGER- QUERECHO WOLF INDIAN DRAW |
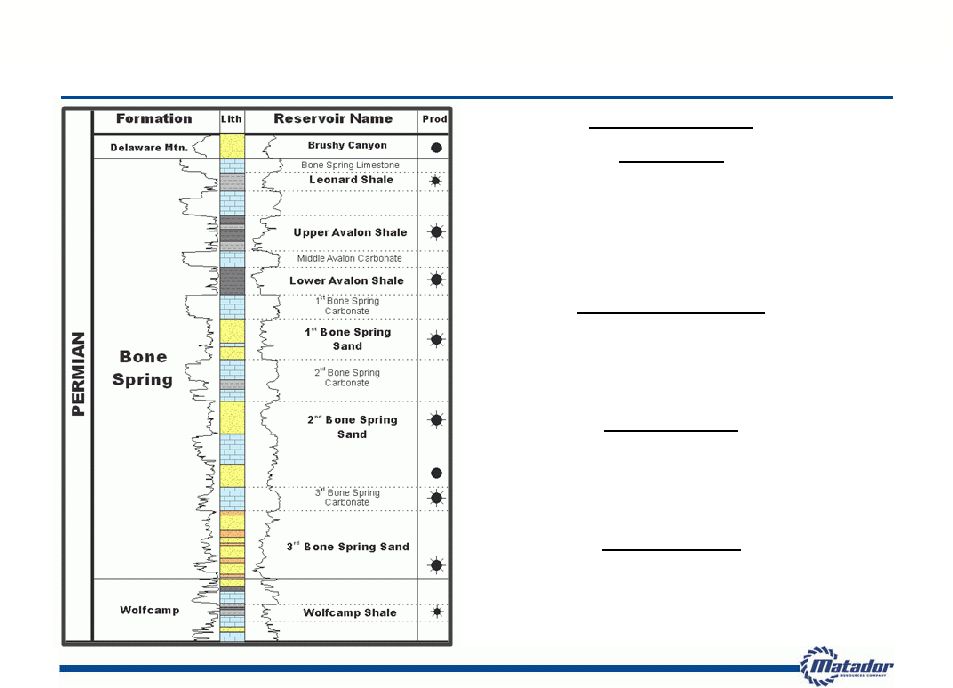 28 Wolfbone Play in the Delaware Basin (West Texas) Stratigraphic Column Note: Information from public sources Avalon Shale Depth: 7,900’ – 8,300’ (Oil Window) Density Porosity: 12-14% Thickness: 300-500 ft. Normal Pressure (0.45 psi/ft.) Total Organic Carbon (TOC) 5-8% XRD: 15-20% clay and 40-60% silica IP: 100-270 Bbl/d 200-1,200 Mcf/d Middle Wolfcamp Depth: 11,500’ – 12,000’ Thickness: 200-300 ft. Total Organic Carbon (TOC) 2-4% Density Porosity: 12-15% Geopressure (0.7psi/ft.) Upper Wolfcamp Depth: 10,500’ – 10,600’ (Oil Window) Density Porosity: >10% Gross Thickness: 280-350 ft. IP: 121-900 Bbl/d 250-3,300 Mcf/d Geopressure (0.7psi/ft.) Horizontal Targets 1 st 2 nd 3 rd Bone Spring Depth: 8,500’ – 10,600’ (Oil Window) Density Porosity: >10% Thickness: 10-100 ft. Normal Pressure (0.45 psi/ft.) IP: 10-600 Bbl/d 500-2,500 Mcf/d |
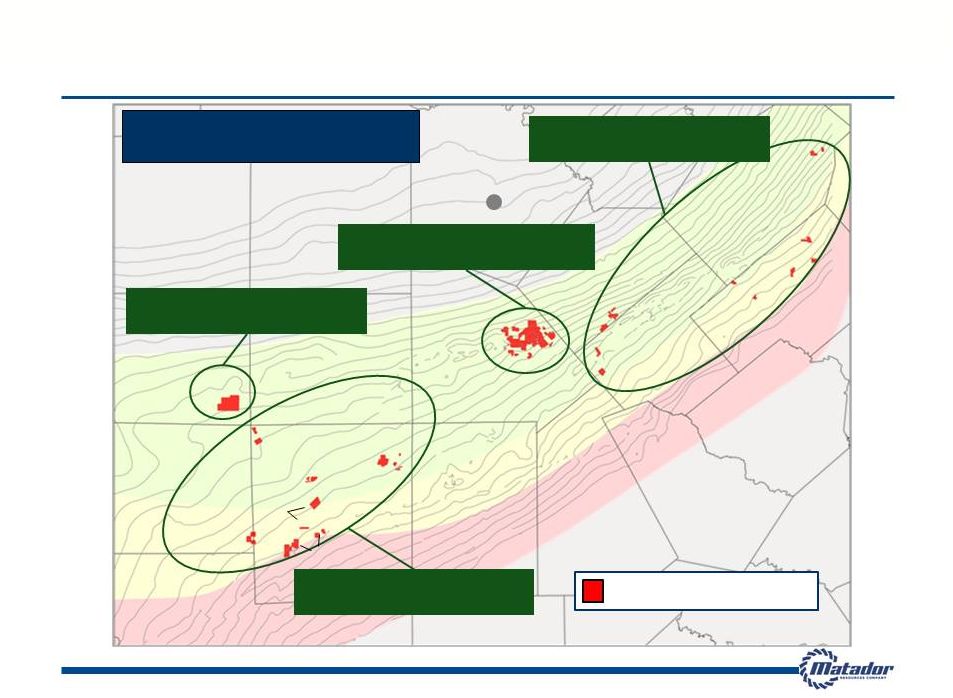
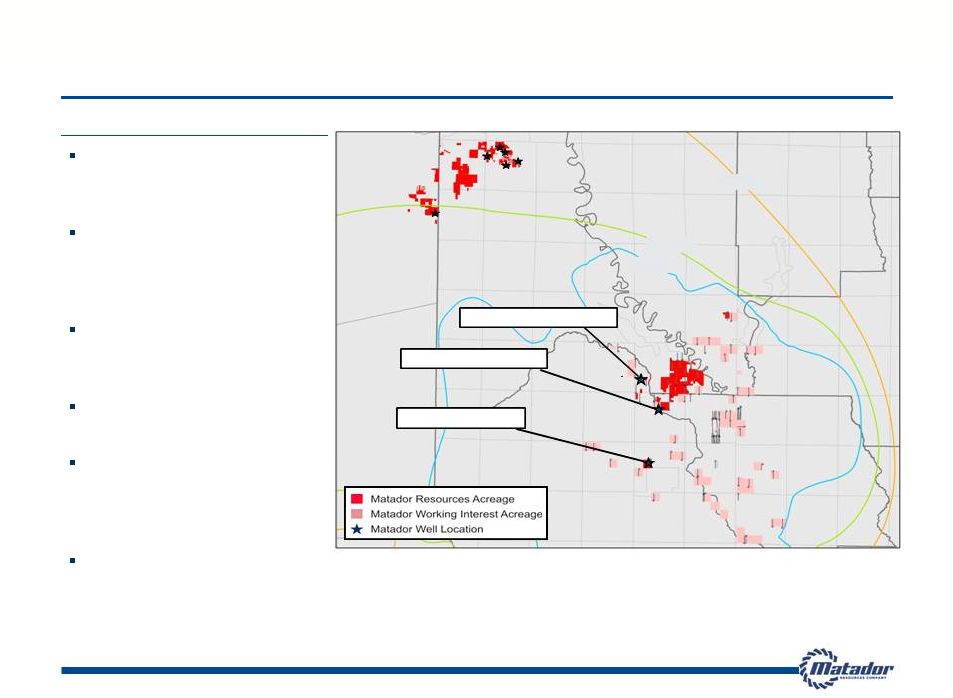
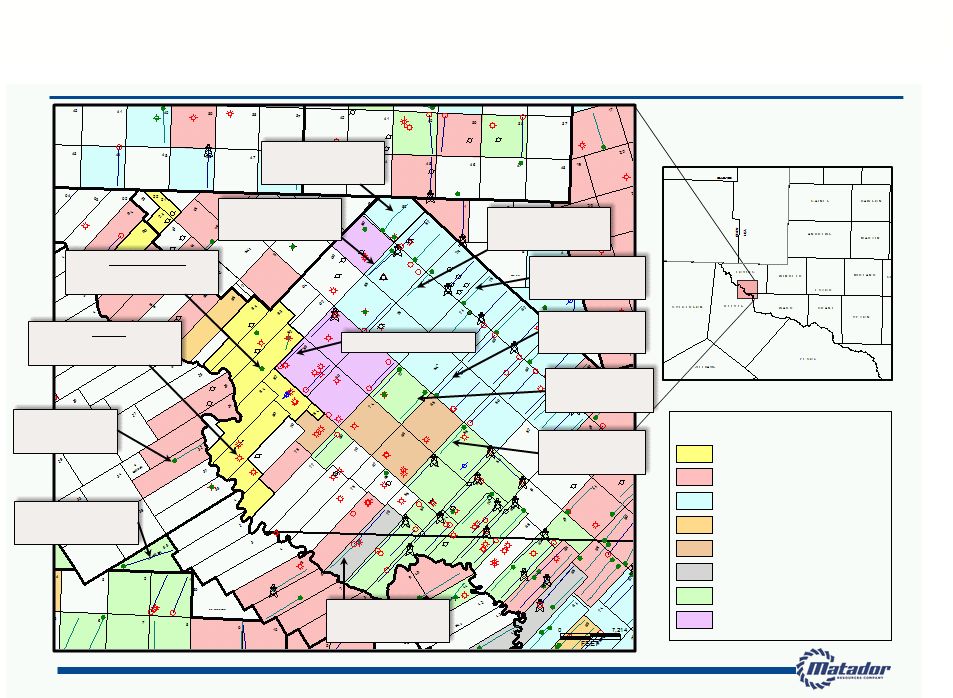 29 Wolfbone Play in the Delaware Basin (West Texas) Major Operator Index Matador Resources Anadarko Petroleum Corp. SWEPI LP Cimarex Energy Clayton Williams Energy Devon Energy Production Energen Resources Corp. Oxy USA Inc. Matador Resources ~4,900 gross / ~2,900 net acres Wolfcamp 17 mo.cum: 122 MBO, 344 MMcf Wolfcamp 22 mo.cum: 140 MBO, 475 MMcf Wolfcamp 4 mo.cum: 27 MBO, 100 MMcf OXY – Currently drilling. 3 Bonespring 12 mo.cum: 12 MBO, 20 MMcf Wolfcamp cum: 23 MBO, 80 MMcf Wolfcamp 6 mo.cum: 51 MBO, 120 MMcf Wolfcamp 8 mo.cum: 38 MBO, 85 MMcf Dorothy White #1 3 rd BS / Upr Wolfcamp Cum 25 MBO, 93 MMcf Wolf #1 3 rd BS / Upr Wolfcamp Cum 58 MBO, 620 MMcf Wolfcamp 8 mo.cum: 14 MBO, 150 MMcf Wolfcamp 5 mo.cum: 40 MBO, 120 MMcf Wolfcamp 10 mo.cum: 72 MBO, 295 MMcf Note: As of November 5, 2012 and only wells with total depths greater than 7,000’ posted. Third-party information from public sources. rd |
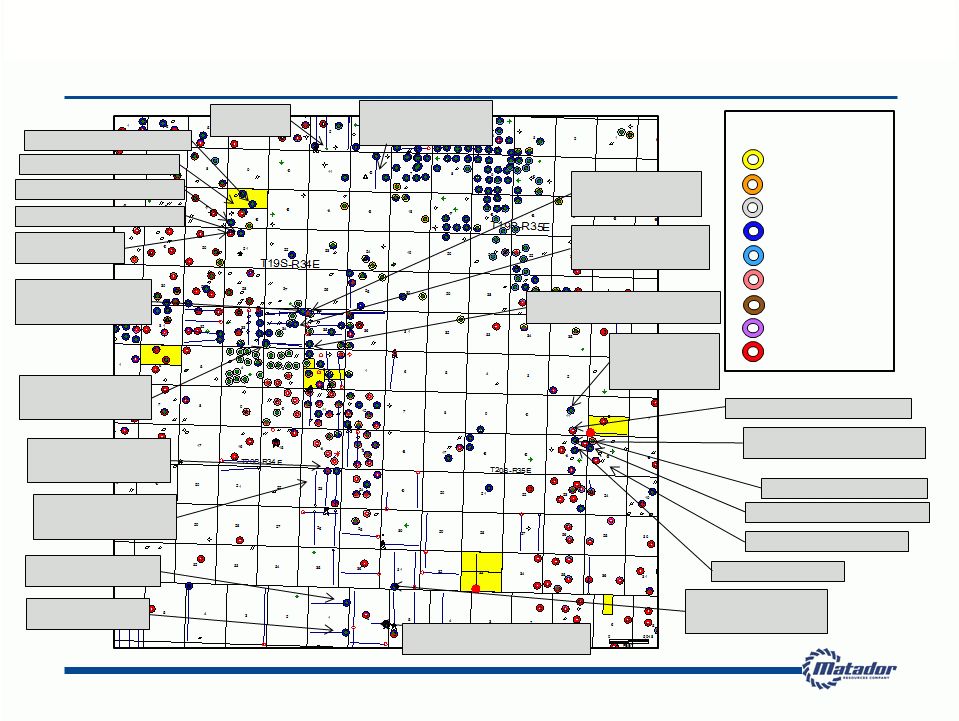 30 Ranger-Querecho Prospect Area, Lea County, New Mexico: ~1,700 acres Queen Producer San Andres Producer Delaware Producer Bone Spring Producer Wolfcamp Producer Producing Zone Legend Penn Producer Strawn Producer Atoka Producer Morrow Producer BS Cum 238,827 Bo, 479,129 Mcf BS Cum 48,400 Bo, 126,233 Mcf BS Cum 580,897 Bo, 454,415 Mcf BS Cum 254,689 Bo, 342,676 Mcf BS Cum 624,841 Bo, 539,756 Mcf IP: 68 Bopd 84 Mcfd 5 Month Cum: 34,045 Bo 16,313 Mcf IP: 230 Bopd 349 Mcfd 18 Month Cum: 79,989 Bo 101,356 Mcf IP: 850 Bopd 1,839 Mcfd 5 Month Cum: 105,141 Bo 72,414 Mcf IP: 318 Bopd 288 Mcfd 8 Month Cum: 101,111 Bo 139,692 Mcf IP: 1,470 Bopd 750 Mcfd Cum: not Rept. IP: 342 Bopd 500 Mcfd Cum: not Rept. IP: 511 Bopd 293 Mcfd IP: 480 Bopd 617 Mcfd 9 Month Cum: 158,754 Bo 106,038 Mcf IP: 148 Bopd 270 Mcfd 7 Month Cum: 28,550 Bo 23,026 Mcf IP: 107 Bopd 295 Mcfd 10 Month Cum: 41,946 Bo 56,912 Mcf IP: 107 Bopd 23 Mcfd 13 Month Cum: 23,147 Bo 14,541 Mcf BS Cum 296 Bo, 5,145 Mcf WC Cum: 27,817 Bo, 156,298 Mcf WC Cum: 385,560 Bo, 5,001,073 Mcf BS Cum 305,626 Bo 206,352 Mcf WC Cum: 155,751 Bo, 2,009,587 Mcf BS Cum 95,399 Bo, 174,936 Mcf BS Cum 77,261 Bo, 149,591 Mcf BS Cum 16,918 Bo, 28,097 Mcf BS Cum 141 Bo, 67 Mcf IP: 1,392 Bopd 1,130 Mcfd 8 Month Cum: 197,651 Bo 209,755 Mcf IP: 195 Bopd 236 Mcfd 12 Month Cum: 25,051 Bo 52,889 Mcf Note: Only wells with TDs greater than 7,000’ posted; Well data available through public sources and interpretation by Matador Resources |
 Gracie Wyoming, Utah and Idaho |
 Bear Lake Rich Lincoln Uinta Sweetwater Cache Franklin Caribou Sublette Fremont Daggett Summit Morgan Weber Davis Box Elder Salt Lake Bannock WYOMING IDAHO UTAH 32 Matador Today Gross Acres (1) 65,712 acres Net Acres (1) 31,621 acres 2012E CapEx Budget $2.5 million Wyoming, Utah and Idaho (Meade Peak Shale) Initial test well drilled and cored through the Meade Peak shale Detailed petrophysical and rock property testing concluded Carried participation interest provided by industry partner (1) At September 30, 2012 Matador Resources Joint Venture Area of Interest Crawford Federal #1H |
 Financials |
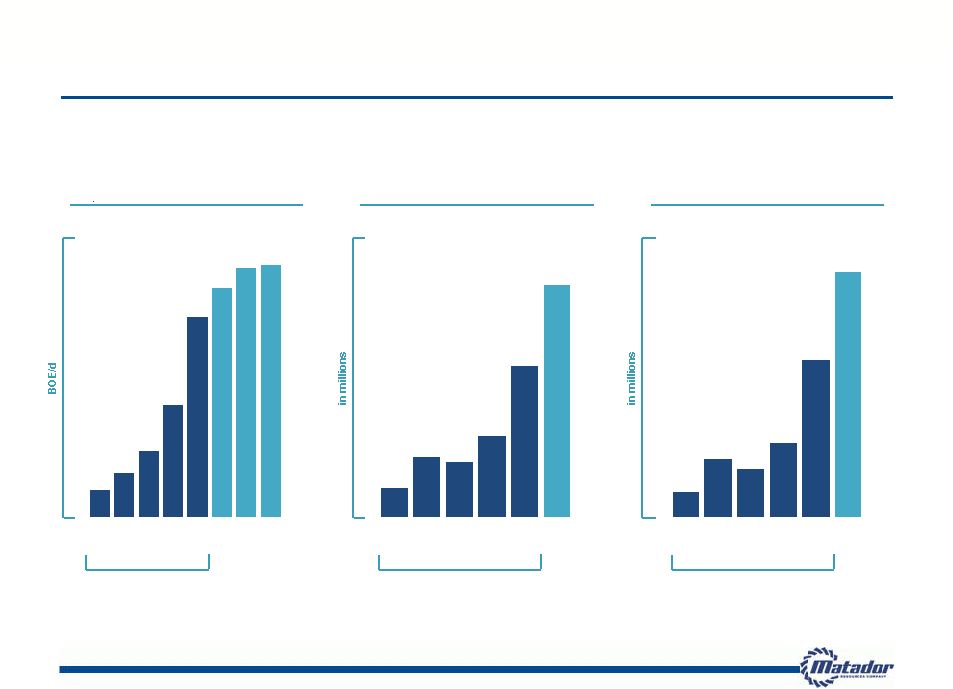 Continued Growth 34 Note: YTD 2012 is through September 30, 2012 (1) Adjusted EBITDA is a non-GAAP financial measure. For a definition of Adjusted EBITDA and a reconciliation of Adjusted EBITDA to our net (loss) income andnet cash provided by operating activities, see Appendix Year Ended December 31, Year Ended December 31, Year Ended December 31, (INCLUDING REALIZED GAIN ON DERIVATIVES) $8.1 $18.4 $15.2 $23.6 $49.9 $77.9 2007 2008 2009 2010 2011 YTD 2012 $14.2 $29.3 $26.7 $39.3 $74.1 $114.4 2007 2008 2009 2010 2011 YTD 2012 911 1,506 2,285 3,926 7,048 8,023 8,738 8,838 2007 2008 2009 2010 2011 2012 1Q 2012 2Q 2012 3Q AVERAGE DAILY OIL TOTAL REALIZED EQUIVALENT PRODUCTION REVENUES ADJUSTED EBITDA (1) |
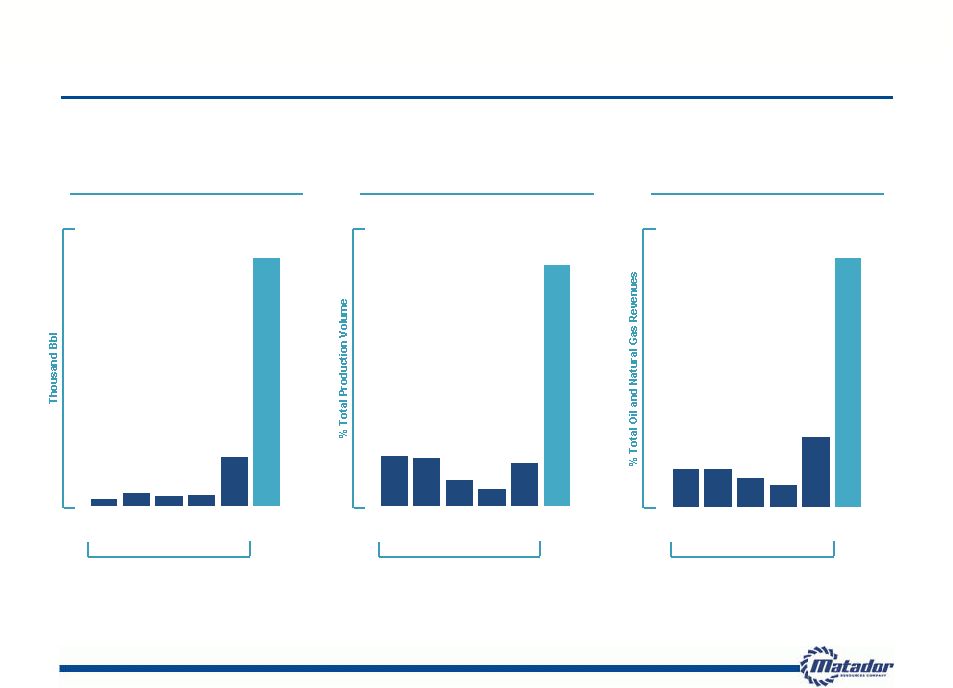 Transition to Oil 35 Year Ended December 31, Year Ended December 31, Year Ended December 31, TOTAL OIL PRODUCTION OIL BY VOLUME OIL BY REVENUE 12% 12% 9% 7% 22% 79% 2007 2008 2009 2010 2011 YTD 2012 7% 7% 4% 2% 6% 34% 2007 2008 2009 2010 2011 YTD 2012 22 37 30 33 154 788 2007 2008 2009 2010 2011 YTD 2012 Note: YTD 2012 is through September 30, 2012 |
 Recent Production and Financial Highlights 36 Record results in Q3 2012 Oil production of 303,000 Bbl, a sequential quarterly increase of 6% from 285,000 Bbl produced in Q2 2012 and a year-over-year increase of 7-fold Average daily oil equivalent production of 8,838 BOE per day, including 3,291 Bbl of oil per day and 33.3 MMcf of natural gas per day Oil production of 3,291 Bbl per day, up 7-fold from 465 Bbl per day in Q3 2011; gas production of 33.3 MMcf per day down about 14% from Q3 2011 and flat to Q2 2012 Total realized revenues, including hedging, of $41.4 million, a year-over-year increase of 119%; oil and natural gas revenues of $38.0 million, a year-over-year increase of 118% Adjusted EBITDA of $28.6 million, a year-over-year increase of 137% Nine months ended September 30, 2012 Adjusted EBITDA of $77.9 million, a year-over-year increase of 107% (1) PV-10 is a non-GAAP financial measure. For a reconciliation of PV-10, see Appendix Total realized revenues, including hedging, of $114.4 million, a year-over-year increase of 103%; oil and natural gas revenues of $103.3 million, a year-over-year increase of 99% 25% sequential increase in oil reserves to 8.4 million Bbl and 20% sequential increase in PV-10 (1) of proved reserves to $363.6 million (Standardized Measure of $333.9 million) |
 37 Financial Flexibility Funding 2012 capital budget with a portion of IPO net proceeds, cash flows from operations and available borrowings under credit facility Closed an amended and restated credit facility to increase the Company’s borrowing capacity to $200 million primarily as a result of increased oil reserves at June 30, 2012 – Expanded bank group to 5 banks – Total facility size increased from $400 million to $500 million Borrowing base of $200 million, increased from $125 million – 40% of current market capitalization (1) $135 million in debt outstanding as of November 9, 2012 (1) As of November 5, 2012 close |
 38 Hedging Profile Oil Hedges (Costless Collars) 4Q 2012 FY 2013 Total Volume Hedged by Ceiling (Bbl) 360,000 1,260,000 Weighted Average Price ($ / Bbl) $110.31 $110.26 Total Volume Hedged by Floor (Bbl) 360,000 1,260,000 Weighted Average Price ($ / Bbl) $90.83 $87.14 Natural Gas Hedges (Costless Collars) 4Q 2012 FY 2013 Total Volume Hedged by Ceiling (Bcf) 2.31 4.65 Weighted Average Price ($ / MMBtu) $5.30 $4.84 Total Volume Hedged by Floor (Bcf) 2.31 4.65 Weighted Average Price ($ / MMBtu) $4.07 $3.34 Natural Gas Liquids (NGLs) Hedges (Swaps) 4Q 2012 FY 2013 Total Volume Hedged (gal) 625,200 4,864,800 Weighted Average Price ($ / gal) $0.81 $0.79 |
 Reserves Summary – September 30, 2012 39 Total proved reserves: 20.9 million BOE (125.4 Bcfe) at September 30, 2012, including 8.4 million Bbl of oil and 74.9 Bcf of natural gas Oil reserves grew 25% to 8.4 million Bbl from 6.7 million Bbl at June 30, 2012 Oil reserves grew 122% from December 31, 2011 PV-10 (1) increased 20% to $363.6 million (Standardized Measure of $333.9 million) from $303.4 million (Standardized Measure of $281.5 million) at June 30, 2012 PV-10 (1) increased 46% from $248.7 million (Standardized Measure of $215.5 million) at December 31, 2011, despite removal of close to 100 Bcf of proved undeveloped Haynesville shale gas reserves at June 30, 2012 (1) PV-10 is a non-GAAP financial measure. For a reconciliation of PV-10, see Appendix Oil reserves comprised 40% (1 Bbl = 6 Mcf basis) of total proved reserves at September 30, 2012, up from 12% at December 31, 2011 and 4% at September 30, 2011 Eagle Ford reserves comprised 90% of total PV-10 (1) at September 30, 2012 as compared to 24% at September 30, 2011 |
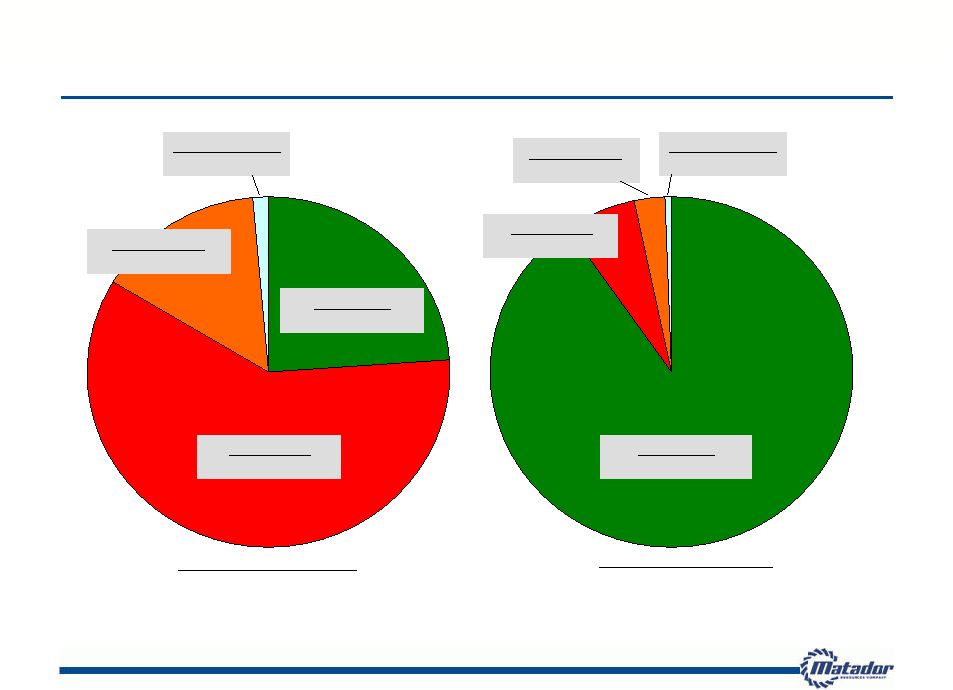 40 Proved Reserves Value Up Sharply and Shifting to Oil Over Past Year Eagle Ford $328.2 million, 90% Haynesville $23.8 million, 7% Cotton Valley $9.4 million, 3% SE New Mexico $2.2 million, 1% September 30, 2012 PV-10 (1) : $363.6 million (Standardized Measure = $333.9 million) Haynesville $92.6 million, 60% Cotton Valley $23.2 million, 15% Eagle Ford $37.2 million, 24% SE New Mexico $2.2 million, 1% September 30, 2011 PV-10 (1) : $155.2 million (Standardized Measure = $143.4 million) (1) PV-10 is a non-GAAP financial measure. For a reconciliation of PV-10, see Appendix |
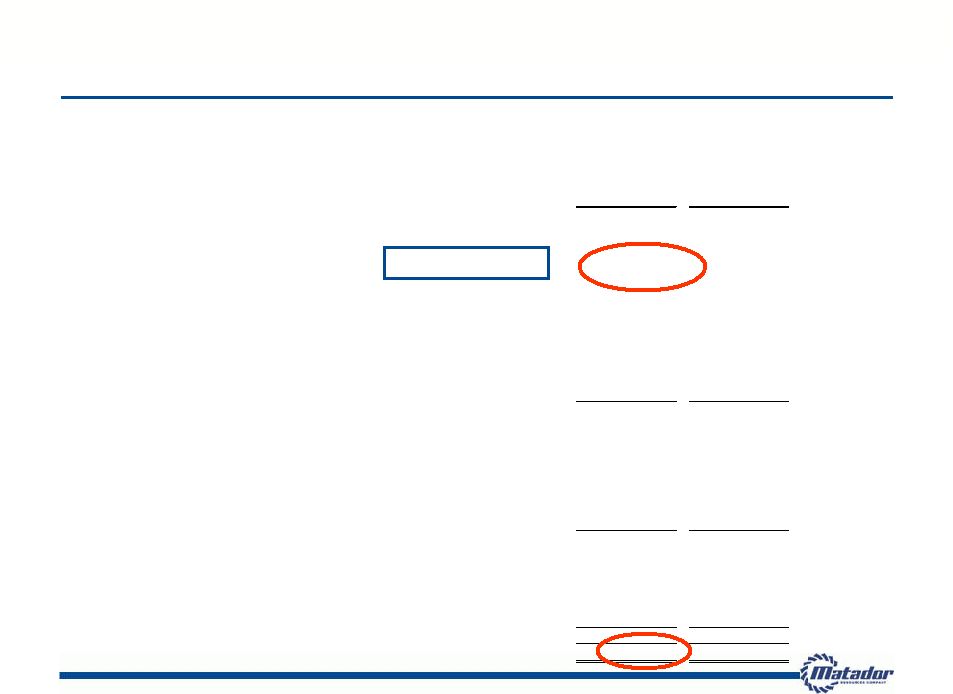 September 30, December 31, 2012 2011 ASSETS Current assets Cash and cash equivalents 4,178 $ 10,284 $ Certificates of deposit 266 1,335 Accounts receivable Oil and natural gas revenues 17,046 9,237 Joint interest billings 4,252 2,488 Other 591 1,447 Derivative instruments 6,395 8,989 Lease and well equipment inventory 1,478 1,343 Prepaid expenses 974 1,153 Total current assets 35,180 36,276 Property and equipment, at cost Oil and natural gas properties, full-cost method Evaluated 654,292 423,945 Unproved and unevaluated 164,514 162,598 Other property and equipment 24,597 18,764 Less accumulated depletion, depreciation and amortization (295,042) (205,442) Net property and equipment 548,361 399,865 Other assets Derivative instruments 1,880 847 Deferred income taxes 1,878 1,594 Other assets 1,537 887 Total other assets 5,295 3,328 Total assets 588,836 $ 439,469 $ Matador Resources Company and Subsidiaries CONDENSED CONSOLIDATED BALANCE SHEETS - UNAUDITED (In thousands, except par value and share data) 41 Financial Statements – Quarterly Period Ended September 30, 2012 $4.4 million cash |
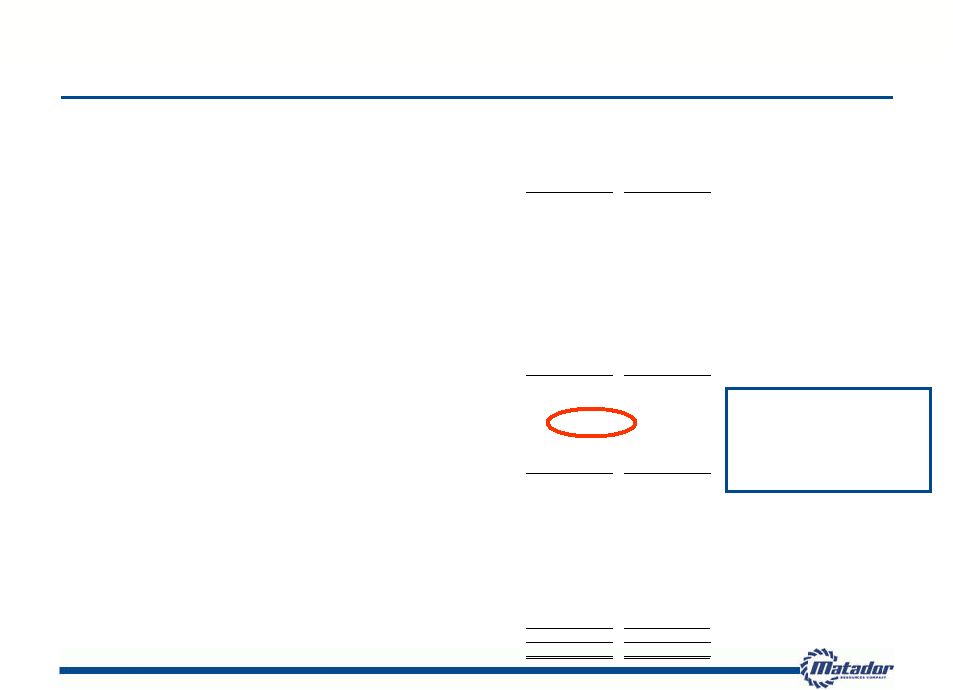 September 30, December 31, 2012 2011 LIABILITIES AND SHAREHOLDERS' EQUITY Current liabilities Accounts payable 17,364 $ 18,841 $ Accrued liabilities 50,262 25,439 Royalties payable 5,920 1,855 Borrowings under Credit Agreement - 25,000 Derivative instruments - 171 Advances from joint interest owners 1,782 - Income taxes payable 188 - Deferred income taxes 1,878 3,024 Dividends payable - Class B - 69 Other current liabilities 56 177 Total current liabilities 77,450 74,576 Long-term liabilities Borrowings under Credit Agreement 106,000 88,000 Asset retirement obligations 4,551 3,935 Derivative instruments 142 383 Other long-term liabilities 1,465 1,060 Total long-term liabilities 112,158 93,378 Shareholders' equity Common stock - Class A, $0.01 par value, 80,000,000 shares 567 429 authorized; 56,697,718 and 42,916,668 shares issued; 55,502,209 and 41,737,493 shares outstanding, respectively Common stock - Class B, $0.01 par value, zero and 2,000,000 shares - 10 authorized; zero and 1,030,700 shares issued and outstanding, respectively Additional paid-in capital 403,248 263,562 Retained earnings 6,178 18,279 Treasury stock, at cost, 1,192,509 and 1,179,175, respectively (10,765) (10,765) Total shareholders' equity 399,228 271,515 Total liabilities and shareholders' equity 588,836 $ 439,469 $ Matador Resources Company and Subsidiaries CONDENSED CONSOLIDATED BALANCE SHEETS - UNAUDITED (In thousands, except par value and share data) 42 Financial Statements – Quarterly Period Ended September 30, 2012 9/30/2012 borrowings at $106 million; 11/9/12 borrowings at $135 million |
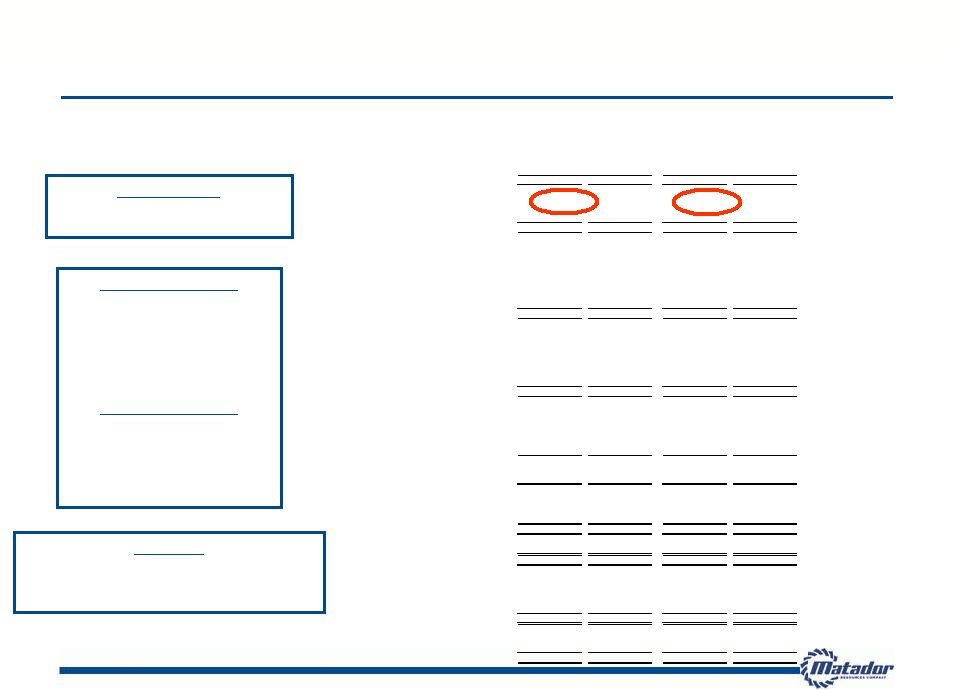 2012 2011 2012 2011 Revenues Oil and natural gas revenues 38,008 $ 17,447 $ 103,250 $ 52,009 $ Realized gain on derivatives 3,371 1,435 11,147 4,237 Unrealized (loss) gain on derivatives (12,993) 2,870 (1,149) 1,534 Total revenues 28,386 21,752 113,248 57,780 Expenses Production taxes and marketing 2,822 1,848 7,605 4,801 Lease operating 6,491 2,065 17,511 5,639 Depletion, depreciation and amortization 21,680 7,288 52,799 22,578 Accretion of asset retirement obligations 59 61 170 158 Full-cost ceiling impairment 3,596 - 36,801 35,673 General and administrative 3,439 4,207 11,321 9,919 Total expenses 38,087 15,469 126,207 78,768 Operating (loss) income (9,701) 6,283 (12,959) (20,988) Other income (expense) Net loss on asset sales and inventory impairment - - (60) - Interest expense (144) (171) (453) (461) Interest and other income 55 82 157 248 Total other expense (89) (89) (356) (213) (Loss) income before income taxes (9,790) 6,194 (13,315) (21,201) Income tax provision (benefit) Current 188 - 188 (46) Deferred (781) - (1,430) (6,906) Total income tax benefit (593) - (1,242) (6,952) Net (loss) income (9,197) $ 6,194 $ (12,073) $ �� (14,249) $ Earnings (loss) per common share Basic Class A (0.17) $ 0.14 $ (0.23) $ (0.34) $ Class B - $ 0.21 $ (0.03) $ (0.14) $ Diluted Class A (0.17) $ 0.14 $ (0.23) $ (0.34) $ Class B - $ 0.21 $ (0.03) $ (0.14) $ Weighted average common shares outstanding Basic Class A 55,271 41,720 53,379 41,671 Class B - 1,031 140 1,031 Total 55,271 42,751 53,519 42,702 Diluted Class A 55,271 41,848 53,379 41,671 Class B - 1,031 140 1,031 Total 55,271 42,879 53,519 42,702 Three Months Ended September 30, Nine Months Ended September 30, 43 Financial Statements – Quarterly Period Ended September 30, 2012 Production Up 28% Q3/Q3; up 21% YTD/YTD Oil up 7x Q3/Q3; up 7x YTD/YTD Gas down 14% Q3/Q3; down 15% YTD/YTD O&G Revenues Up 118% Q3/Q3 Oil revenue = $30.1 million 2012 YTD Unit Costs PTM = $3.25/BOE LOE = $7.49/BOE G&A = $4.84/BOE DD&A = $22.58/BOE Operating costs* = $15.58/BOE 2011 YTD Unit Costs PTM = $2.48/BOE LOE = $2.92/BOE G&A = $5.13/BOE DD&A = $11.68/BOE Operating costs* = $10.53/BOE Matador Resources Company and Subsidiaries CONDENSED CONSOLIDATED STATEMENTS OF OPERATIONS - UNAUDITED (In thousands, except per share data) * Operating costs defined as = PTM + LOE + G&A |
 2012 2011 Operating activities Net loss (12,073) $ (14,249) $ Adjustments to reconcile net loss to net cash provided by operating activities Unrealized loss (gain) on derivatives 1,149 (1,534) Depletion, depreciation and amortization 52,799 22,578 Accretion of asset retirement obligations 170 158 Full-cost ceiling impairment 36,801 35,673 Stock option and grant expense (585) 1,379 Restricted stock and restricted stock units expense 362 36 Deferred income tax benefit (1,430) (6,906) Loss on asset sales and inventory impairment 60 - Changes in operating assets and liabilities Accounts receivable (8,718) (2,411) Lease and well equipment inventory (285) (1) Prepaid expenses 179 240 Other assets (650) - Accounts payable, accrued liabilities and other liabilities 6,105 (2,360) Income taxes payable 188 - Royalties payable 4,065 2,548 Advances from joint interest owners 1,782 (723) Other long-term liabilities 406 15 Net cash provided by operating activities 80,325 34,443 Investing activities Oil and natural gas properties capital expenditures (212,702) (104,733) Expenditures for other property and equipment (5,297) (3,303) Purchases of certificates of deposit (416) (3,721) Maturities of certificates of deposit 1,485 3,985 Net cash used in investing activities (216,930) (107,772) Financing activities Repayments of borrowings under Credit Agreement (123,000) - Borrowings under Credit Agreement 116,000 60,000 Proceeds from issuance of common stock 146,510 592 Swing sale profit contribution 24 - Cost to issue equity (11,599) (1,185) Proceeds from stock options exercised 2,660 837 Payment of dividents - Class B (96) (206) Net cash provided by financing activities 130,499 60,038 Decrease in cash and cash equivalents (6,106) (13,291) Cash and cash equivalents at beginning of period 10,284 21,059 Cash and cash equivalents at end of period 4,178 $ 7,768 $ Nine Months Ended September 30, Matador Resources Company and Subsidiaries CONDENSED CONSOLIDATED STATEMENTS OF CASH FLOWS - UNAUDITED (In thousands, except par value and share data) 44 Financial Statements – Quarterly Period Ended September 30, 2012 Total CAPEX incurred at 9/30/12 $237.6 million 76% of 2012 budget Includes $21.2 million acreage EBITDA Q3 2012 = $28.6 million Q3 2011 = $12.1 million EBITDA up 137% Q3/Q3 YTD 2012 = $77.9 million YTD 2011 = $37.6 million EBITDA up 107% Y/Y |
 45 Statements of Operations - Selected Quarterly Periods in 2012 and 2011 Matador Resources Company and Subsidiaries CONDENSED CONSOLIDATED STATEMENTS OF OPERATIONS - UNAUDITED (In thousands, except per share data) 2012 2011 2012 2011 2012 2011 Revenues Oil and natural gas revenues 38,008 $ 17,447 $ 36,078 $ 20,864 $ 29,164 $ 13,698 $ Realized gain on derivatives 3,371 1,435 4,713 952 3,063 1,850 Unrealized (loss) gain on derivatives (12,993) 2,870 15,114 332 (3,270) (1,668) Total revenues 28,386 21,752 55,905 22,148 28,957 13,880 Expenses Production taxes and marketing 2,822 1,848 2,619 1,654 2,164 1,300 Lease operating 6,491 2,065 6,375 1,969 4,645 1,605 Depletion, depreciation and amortization 21,680 7,288 19,913 8,179 11,206 7,111 Accretion of asset retirement obligations 59 61 58 57 53 39 Full-cost ceiling impairment 3,596 - 33,205 - - 35,673 General and administrative 3,439 4,207 4,093 3,094 3,789 2,619 Total expenses 38,087 15,469 66,263 14,953 21,857 48,347 Operating (loss) income (9,701) 6,283 (10,358) 7,195 7,100 (34,467) Other income (expense) Net loss on asset sales and inventory impairment - - (60) - - - Interest expense (144) (171) (1) (183) (308) (106) Interest and other income 55 82 30 94 73 71 Total other expense (89) (89) (31) (89) (235) (35) (Loss) income before income taxes (9,790) 6,194 (10,389) 7,106 6,865 (34,502) Income tax provision (benefit) Current 188 - - (46) - - Deferred (781) - (3,713) - 3,064 (6,906) Total income tax benefit (provision) (593) - (3,713) (46) 3,064 (6,906) Net (loss) income (9,197) $ 6,194 $ (6,676) $ 7,152 $ 3,801 $ (27,596) $ Earnings (loss) per common share Basic Class A (0.17) $ 0.14 $ (0.12) $ 0.17 $ 0.08 $ (0.65) $ Class B - $ 0.21 $ - $ 0.23 $ 0.15 $ (0.58) $ Diluted Class A (0.17) $ 0.14 $ (0.12) $ 0.17 $ 0.08 $ (0.65) $ Class B - $ 0.21 $ - $ 0.23 $ 0.15 $ (0.58) $ Weighted average common shares outstanding Basic Class A 55,271 41,720 55,271 41,667 49,597 41,624 �� Class B - 1,031 - 1,031 419 1,031 Total 55,271 42,751 55,271 42,698 50,016 42,655 Diluted Class A 55,271 41,848 55,271 41,782 49,666 41,624 Class B - 1,031 - 1,031 419 1,031 Total 55,271 42,879 55,271 42,813 50,085 42,655 Three Months Ended March 31, Three Months Ended September 30, Three Months Ended June 30, |
 Appendix |
 Board of Directors and Special Board Advisors – Expertise and Stewardship 47 Board Members and Advisors Professional Experience Business Expertise Dr. Stephen A. Holditch Director - Professor and Former Head of Dept. of Petroleum Engineering, Texas A&M University - Founder / President S.A. Holditch & Associates - Past President of Society of Petroleum Engineers Oil & Gas Operations David M. Laney Director - Past Chairman, Amtrak Board of Directors - Former Partner, Jackson Walker LLP Law Gregory E. Mitchell Director - President / CEO, Toot’n Totum Food Stores Petroleum Retailing Dr. Steven W. Ohnimus Director - Retired VP and General Manager, Unocal Indonesia Oil & Gas Operations Michael C. Ryan Director - Partner, Berens Capital Management International Business and Finance Margaret B. Shannon Director - Retired VP and General Counsel, BJ Services Co. - Former Partner, Andrews Kurth LLP Law and Corporate Governance Mino Capossela Special Board Advisor - Retired partner Goldman Sachs; Charter Financial Analyst; Private Investor Finance and Management Marlan W. Downey Special Board Advisor - Retired President, ARCO International - Former President, Shell Pecten International - Past President of American Association of Petroleum Geologists Oil & Gas Exploration Wade I. Massad Special Board Advisor - Managing Member, Cleveland Capital Management, LLC - Former EVP Capital Markets, Matador Resources Company - Formerly with KeyBanc Capital Markets and RBC Capital Markets Capital Markets Edward R. Scott, Jr. Special Board Advisor - Former Chairman, Amarillo Economic Development Corporation - Law Firm of Gibson, Ochsner & Adkins Law, Accounting and Real Estate Development W.J. “Jack” Sleeper, Jr. Special Board Advisor - Oil & Gas Executive Management Retired President, DeGolyer and MacNaughton (Worldwide Petroleum Consultants) |
 Proven Management Team – Experienced Leadership 48 Management Team Background and Prior Affiliations Industry Experience Matador Experience Joseph Wm. Foran Founder, Chairman and CEO - Matador Petroleum Corporation, Foran Oil Company, J Cleo Thompson Jr. and Thompson Petroleum Corp. 32 years Since Inception David E. Lancaster EVP and COO - Schlumberger, S.A. Holditch & Associates, Inc., Diamond Shamrock 33 years Since 2003 Matthew V. Hairford EVP and Head of Operations - Samson, Sonat, Conoco 28 years Since 2004 David F. Nicklin Executive Director of Exploration - ARCO, Senior Geological Assignments in UK, Angola, Norway and the Middle East 41 years Since 2007 Bradley M. Robinson VP, Reservoir Engineering - Schlumberger, S.A. Holditch & Associates, Inc., Marathon 35 years Since Inception Craig N. Adams VP and General Counsel - Baker Botts L.L.P., Thompson & Knight LLP 20 years Since 2012 Kathryn L. Wayne Controller and Treasurer - Matador Petroleum Corporation, Mobil 28 years Since Inception Ryan London Senior Completion Engineer Eagle Ford Asset Manager - Matador Resources Company 9 years Since 2003 |
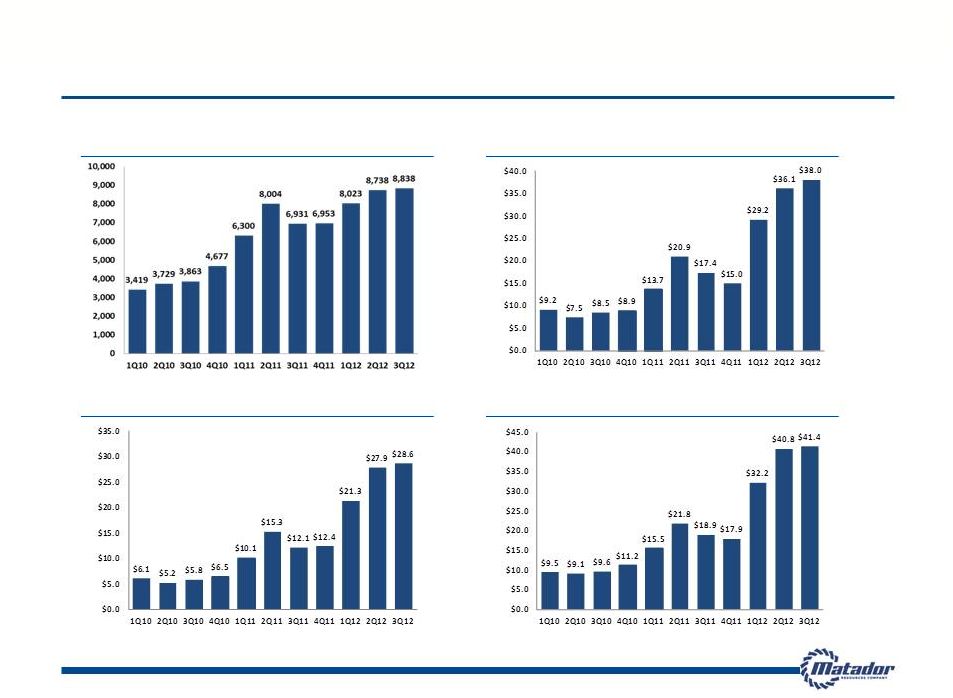 49 Quarterly Performance Metrics Through Q3 2012 Oil and Natural Gas Revenues ($ in mm) Total Realized Revenues ($ in mm) Adjusted EBITDA (1) ($ in mm) Average Daily Equivalent Production (BOE/d) (1) Adjusted EBITDA is a non-GAAP financial measure. For a definition of Adjusted EBITDA and a reconciliation of Adjusted EBITDA to our net (loss) income and net cash provided by operating activities, see Appendix |
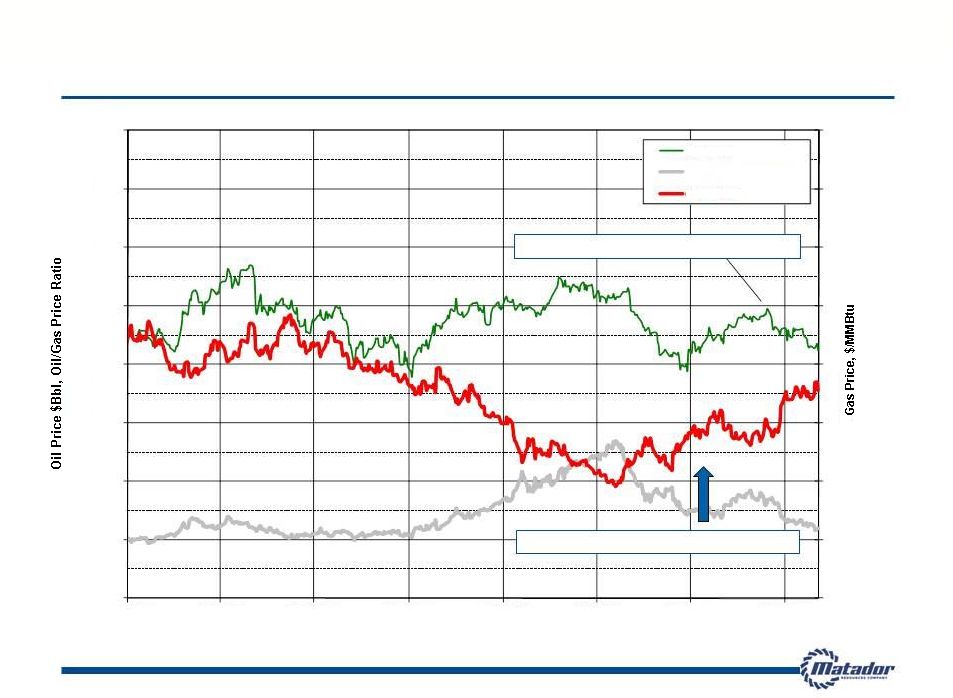 50 Oil and Natural Gas Prices Since January 2011 Natural gas prices have rallied since late April Oil prices have declined since mid-September 0 1 2 3 4 5 6 7 8 0 20 60 80 100 120 140 160 1/1/2011 4/1/2011 7/1/2011 10/1/2011 1/1/2012 4/1/2012 7/1/2012 10/1/2012 Date Oil Price Oil/Gas Price Ratio Gas Price 40 |
 51 Adjusted EBITDA Reconciliation The following table presents our calculation of Adjusted EBITDA and reconciliation of Adjusted EBITDA to the GAAP financial measures of net (loss) income and cash provided by operating activities, respectively. Year Ended December 31, Nine Months Ended September 30, (In thousands) 2007 2008 2009 2010 2011 2012 Unaudited Adjusted EBITDA reconciliation to Net Income (Loss): Net (loss) income ($300) $103,878 ($14,425) $6,377 ($10,309) ($8,568) Interest expense - - - 3 683 453 Total income tax provision (benefit) - 20,023 (9,925) 3,521 (5,521) (1,152) Depletion, depreciation and amortization 7,889 12,127 10,743 15,596 31,754 52,799 Accretion of asset retirement obligations 70 92 137 155 209 170 Full-cost ceiling impairment - 22,195 25,244 - 35,673 33,206 Unrealized loss (gain) on derivatives 211 (3,592) 2,375 (3,139) (5,138) 1,149 Stock option and grant expense 205 605 622 824 2,362 (585) Restricted stock grants 15 60 34 74 44 362 Net loss (gain) on asset sales and inventory impairment - (136,977) 379 224 154 60 Adjusted EBITDA $8,090 $18,411 $15,184 $23,635 $49,911 $77,894 Year Ended December 31, Nine Months Ended September 30, (In thousands) 2007 2008 2009 2010 2011 2012 Unaudited Adjusted EBITDA reconciliation to Net Cash Provided by Operating Activities: Net cash provided by operating activities $7,881 $25,851 $1,791 $27,273 $61,868 $80,325 Net change in operating assets and liabilities 209 (17,888) 15,717 (2,230) (12,594) (3,072) Interest expense - - - 3 683 453 Current income tax provision (benefit) - 10,448 (2,324) (1,411) (46) 188 Adjusted EBITDA $8,090 $18,411 $15,184 $23,635 $49,911 $77,894 We believe Adjusted EBITDA helps us evaluate our operating performance and compare our results of operation from period to period without regard to our financing methods or capital structure. We define Adjusted EBITDA as earnings before interest expense, income taxes, depletion, depreciation and amortization, accretion of asset retirement obligations, property impairments, unrealized derivative gains and losses, certain other non-cash items and non- cash stock-based compensation expense, including stock option and grant expense and restricted stock and restricted stock units expense, and net gain or loss on asset sales and inventory impairment. Adjusted EBITDA is not a measure of net (loss) income or cash flows as determined by GAAP. Adjusted EBITDA should not be considered an alternative to, or more meaningful than, net income or cash flows from operating activities as determined in accordance with GAAP or as an indicator of our operating performance or liquidity. |
 52 Adjusted EBITDA Reconciliation (Cont.) The following table presents our calculation of Adjusted EBITDA and reconciliation of Adjusted EBITDA to the GAAP financial measures of net (loss) income and cash provided by operating activities, respectively. (In thousands) 1Q 2010 2Q 2010 3Q 2010 4Q 2010 1Q 2011 2Q 2011 3Q 2011 4Q 2011 1Q 2012 2Q 2012 3Q 2012 Unaudited Adjusted EBITDA reconciliation to Net Income (Loss): Net income (loss) $ 5,676 $ (984) $ 2,681 $ (996) $ (27,596) $ 7,153 $ 6,194 $ 3,941 $ 3,801 $ (6,676) $ (9,197) Interest expense - - - 3 106 184 171 222 308 1 144 Total income tax provision (benefit) 2,975 (516) 1,584 (522) (6,906) (46) - 1,430 3,064 (3,713) (593) Depletion, depreciation and amortization 3,362 3,702 3,868 4,665 7,111 8,180 7,287 9,175 11,205 19,914 21,680 Accretion of asset retirement obligations 38 30 39 48 39 57 62 51 53 58 59 Full-cost ceiling impairment - - - - 35,673 - - - - 33,205 3,596 Unrealized (gain) loss on derivatives (6,093) 2,822 (2,541) 2,674 1,668 (332) (2,870) (3,604) 3,270 (15,114) 12,993 Stock option and grant expense 180 153 133 357 42 117 1,220 983 (374) 41 (252) Restricted stock grants 6 8 11 49 11 11 14 8 11 150 201 Net (gain)/loss on asset sales and inventory impairment - - - 224 - - - 154 - 60 - Adjusted EBITDA $ 6,142 $ 5,215 $ 5,776 $ 6,502 $ 10,148 $ 15,324 $ 12,078 $ 12,360 $ 21,338 $ 27,926 $ 28,631 (In thousands) 1Q 2010 2Q 2010 3Q 2010 4Q 2010 1Q 2011 2Q 2011 3Q 2011 4Q 2011 1Q 2012 2Q 2012 3Q 2012 Unaudited Adjusted EBITDA reconciliation to Net Cash Provided by Operating Activities: Net cash provided by operating activities $ 7,673 $ 29,040 $ (15,322) $ 5,883 $ 12,732 $ 6,799 $ 14,912 $ 27,425 $ 5,110 $ 46,416 $ 28,799 Net change in operating assets and liabilities (1,531) (23,824) 22,509 616 (2,690) 8,386 (3,004) (15,287) 15,920 (18,491) (500) Interest expense - - - 3 106 184 171 222 308 1 144 Current income tax (benefit) provision - - (1,411) - - (45) (1) - - - ` 188 Adjusted EBITDA $ 6,142 $ 5,215 $ 5,776 $ 6,502 $ 10,148 $ 15,324 $ 12,078 $ 12,360 $ 21,338 $ 27,926 $ 28,631 We believe Adjusted EBITDA helps us evaluate our operating performance and compare our results of operation from period to period without regard to our financing methods or capital structure. We define Adjusted EBITDA as earnings before interest expense, income taxes, depletion, depreciation and amortization, accretion of asset retirement obligations, property impairments, unrealized derivative gains and losses, certain other non-cash items and non-cash stock-based compensation expense, including stock option and grant expense and restricted stock and restricted stock units expense, and net gain or loss on asset sales and inventory impairment. Adjusted EBITDA is not a measure of net (loss) income or cash flows as determined by GAAP. Adjusted EBITDA should not be considered an alternative to, or more meaningful than, net income or cash flows from operating activities as determined in accordance with GAAP or as an indicator of our operating performance or liquidity. |
 53 PV-10 Reconciliation PV-10 is a non-GAAP financial measure and generally differs from Standardized Measure, the most directly comparable GAAP financial measure, because it does not include the effects of income taxes on future net revenues. PV-10 is not an estimate of the fair market value of our properties. Matador and others in the industry use PV-10 as a measure to compare the relative size and value of proved reserves held by companies and of the potential return on investment related to the companies’ properties without regard to the specific tax characteristics of such entities. The PV-10 at September 30, 2012, December 31, 2011 and September 30, 2011 may be reconciled to the Standardized Measure of discounted future net cash flows at such dates by reducing PV-10 by the discounted future income taxes associated with such reserves. The discounted future income taxes at September 30, 2012, December 31, 2011 and September 30, 2011 were, in millions, $29.7, $33.2 and $11.8, respectively. |