 Investor Presentation Exhibit 99.1 January 2013 |
 2 Disclosure Statements “Company”) during the course of this presentation include “forward-looking statements” within the meaning of Section 27A of the Securities Act of 1933, as amended, and Section 21E of the Securities Exchange Act of 1934, as amended. “Forward-looking statements” are statements related to future, not past, events. Forward-looking statements are based on current expectations and include any statement that does not directly relate to a current or historical fact. In this context, forward-looking statements often address expected future business and financial performance, and often contain words such as “could,” “believe,” “would,” “anticipate,” “intend,” “estimate,” “expect,” “may,” “should,” “continue,” “plan,” “predict,” “potential,” “project” and similar expressions that are intended to identify forward-looking statements, although not all forward- looking statements contain such identifying words. Actual results and future events could differ materially from those anticipated in such statements, and such forward-looking statements may not prove to be accurate. These forward-looking statements involve certain risks and uncertainties, including, but not limited to, the following risks related to our financial and operational performance: general economic conditions; our ability to execute our business plan, including whether our drilling program is successful; changes in oil, natural gas and natural gas liquids prices and the demand for oil, natural gas and natural gas liquids; our ability to replace reserves and efficiently develop our current reserves; our costs of operations, delays and other difficulties related to producing oil, natural gas and natural gas liquids; our ability to make acquisitions on economically acceptable terms; availability of sufficient capital to execute our business plan, including from our future cash flows, increases in our borrowing base, joint venture partners and otherwise; weather and environmental conditions; and other important factors which could cause actual results to differ materially from those anticipated or implied in the forward-looking statements. For further discussions of risks and uncertainties, you should refer to Matador’s SEC filings, including the “Risk Factors” section of Matador’s Annual Report on Form 10-K for the year ended December 31, 2011. Matador undertakes no obligation and does not intend to update these forward-looking statements to reflect events or circumstances occurring after the date of this presentation, except as required by law. You are cautioned not to place undue reliance on these forward-looking statements, which speak only as of the date of this presentation. All forward-looking statements are qualified in their entirety by this cautionary statement. only proved, probable and possible reserves. Potential resources are not proved, probable or possible reserves. The SEC’s guidelines prohibit Matador from including such information in filings with the SEC. Safe Harbor Statement – This presentation and statements made by representatives of Matador Resources Company (“Matador” or the Cautionary Note – The Securities and Exchange Commission (SEC) permits oil and gas companies, in their filings with the SEC, to disclose |
 Company Summary |
 Foran Oil & Matador Petroleum 4 Matador History Matador Resources Company Predecessor Entities (1) Tom Brown purchased by Encana in 2004 Matador Today Founded by Joe Foran in 1983 Foran Oil funded with $270,000 in contributed capital from 17 friends and family members Founded by Joe Foran in 2003 with a proven management and technical team and board of directors Grown through the drill bit, with focus on unconventional reservoir plays, initially in Haynesville In 2008, sold Haynesville rights in approximately 9,000 net acres to Chesapeake for approximately $180 million; retained 25% participation interest, carried working interest and overriding royalty interest Relatively early in the play, redeployed capital into the Eagle Ford, acquiring over 30,000 net acres for approximately $100 million, most in 2010 and 2011 Capital spending focused on developing Eagle Ford and transition to oil IPO in February 2012 (NYSE: MTDR) had net cash proceeds of approximately $136.6 million Sold to Tom Brown, Inc. in June 2003 for an enterprise value of $388 million in an all-cash transaction |
 5 Investment Highlights Strong Financial Position and Prudent Risk Management High Quality Asset Base in Attractive Areas Eagle Ford provides immediate oil-weighted value and upside Expanding acreage position in Delaware Basin in West Texas Other key assets provide long-term option value on natural gas, with Haynesville, Bossier and Cotton Valley assets all essentially held by production (HBP) Proven Management and Technical Team and Active Board of Directors Management averaging over 25 years of industry experience Board with extensive industry experience and expertise as well as significant company ownership Strong record of stewardship for over 28 years Strong Growth Profile with Increasing Focus on Oil / Liquids Oil production up almost five-fold in 2011 and projected to increase approximately eight-fold in 2012 2013E capital expenditure program focused on oil and liquids exploration and development |
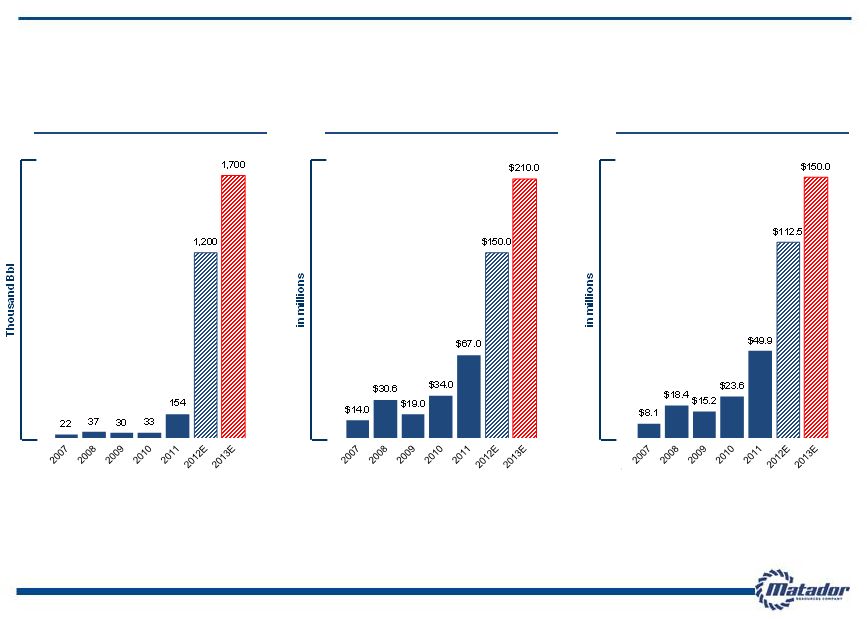 Matador’s Continued Growth 6 TOTAL OIL AND TOTAL OIL PRODUCTION (1) NATURAL GAS REVENUES ADJUSTED EBITDA (2) (1) 2013E Total Oil Production at the mid-point of 2013 guidance of estimated total oil production of 1.6 to 1.8 million barrels (2) Adjusted EBITDA is a non-GAAP financial measure. For a definition of Adjusted EBITDA and a reconciliation of Adjusted EBITDA to our net (loss) income and net cash provided by operating activities, see Appendix |
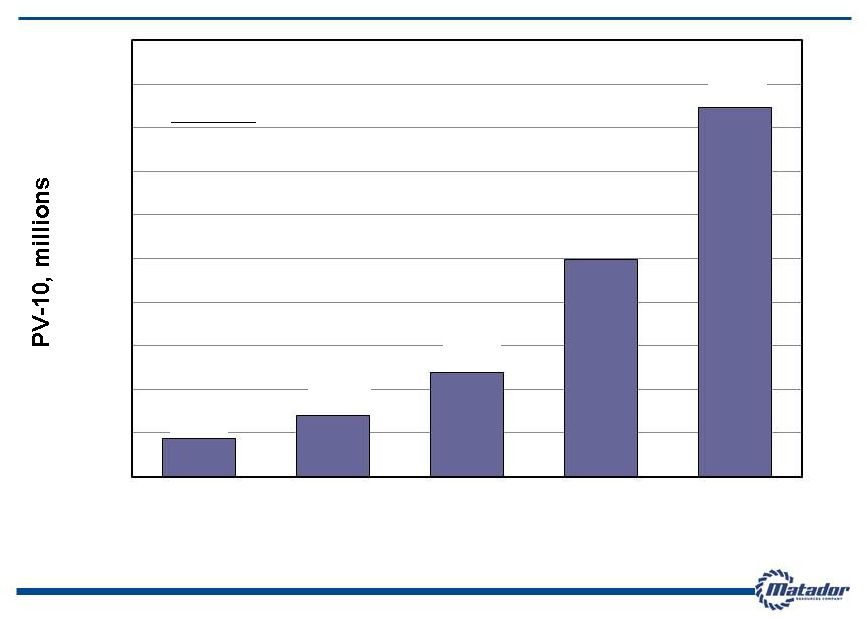 Growth in PV-10 (1) from Proved Reserves 2008 (2) 2009 (2) 2010 (2) 2011 (2) 2012 (2) (1) PV-10 is a non-GAAP measure. For a reconciliation of Standardized Measure (GAAP) to PV-10 (non-GAAP), please see Appendix (2) At December 31 of each respective year 7 $0 $50 $100 $150 $200 $250 $300 $350 $400 $450 $500 $41.00 oil $5.71 $57.65 oil $3.87 gas $75.96 oil $4.38 $92.71 oil $4.12 $91.21 oil $2.76 SEC Pricing Oil, $/Bbl Gas, $/MMBtu gas gas gas gas |
 Eagle Ford South Texas Key Operating Areas |
 9 Eagle Ford and Austin Chalk Overview Acreage positioned in some of the most active counties for Eagle Ford and Austin Chalk (including “Chalkleford”) Two rigs running, primarily focused on oil and liquids 2013E capital expenditure program focused on oil and liquids exploration and development Proved Reserves @ 12/31/12 14.3 Million BOE (1) % Proved Developed 46% % Oil / Liquids 72% Daily Oil Production (2) 3,259 Bbl/d Gross Acres (3) 44,326 acres Net Acres (3) 29,555 acres Eagle Ford (3)(4) 29,555 acres Austin Chalk (3)(4) 17,317 acres 2013E Anticipated Drilling 27.4 net wells 2013E CapEx Budget $242.7 million (1) Compared to 4.7 Million BOE Proved Reserves at December 31, 2012 (2) Estimated average daily oil production for year ended December 31, 2012 compared to 331 Bbl/d for year ended December 31, 2011 (3) As of November 30, 2012 (4) Some of the same leases cover the net acres shown for Eagle Ford and Austin Chalk. Therefore, the sum for both formations is not equal to the total net acreage |
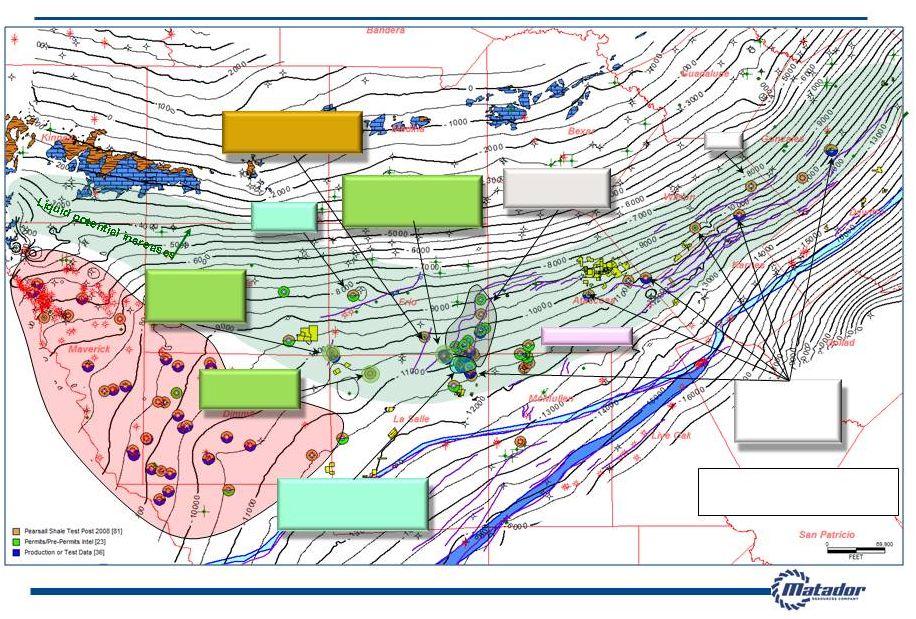
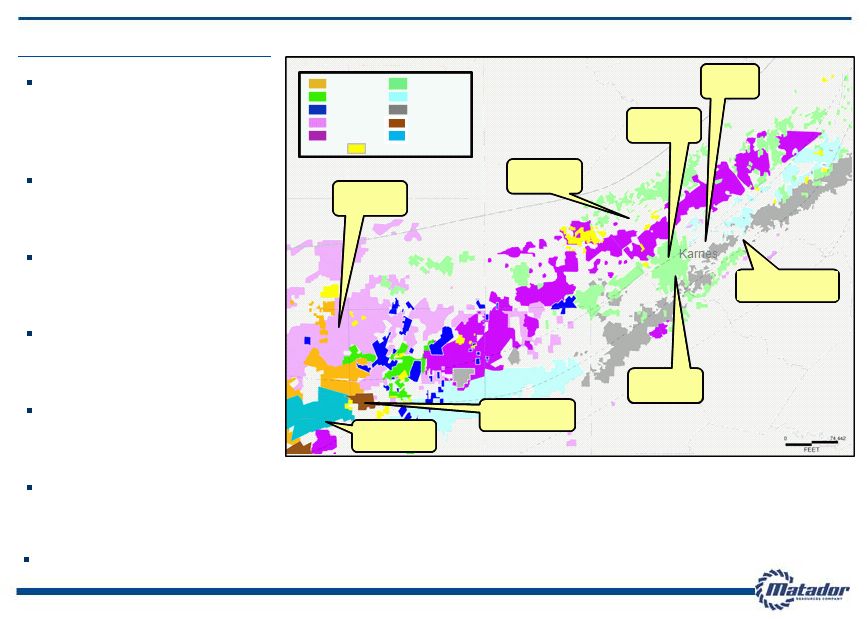 Highlights 10 Eagle Ford Properties are in Good Neighborhoods Matador’s acreage in counties with robust transaction activity – “good neighborhoods” Transaction values ranging from $10,000 to $30,000 per acre Matador’s Eagle Ford position approximately 30,000 net acres Acreage in both the eastern and western areas of the play Approximately 90% of acreage in prospective oil and liquids windows Acreage offers potential for Austin Chalk, Buda, Pearsall and other formations Good reputation with land and mineral owners Frio Medina Bexar Guadalupe Gonzales Atascosa Bee Goliad Live Oak McMullen La Salle Zavala Dimmit Wilson Dewitt OIL FAIRWAY COMBO LIQUIDS / GAS FAIRWAY DRY GAS FAIRWAY June 2011 +$14,000 / acre SHELL / HARRISON RANCH March 2010 ~$10,000 / acre TALISMAN-STATOIL / ENDURING October 2010 +$13,000 / acre CNOOC / CHESAPEAKE October 2010 +$11,000 / acre HUNT / MARUBENI January 2012 +$20,000 / acre MARATHON / HILCORP June 2011 +$24,000 / acre KKR / HILCORP June 2010 ~$10,000 / acre MARATHON / PALOMA May 2012 +$30,000 / acre Matador Anadarko EOG Chesapeake El Paso Carrizo Shell Petrohawk/BHP SM Energy Pioneer Marathon TALISMAN- STATOIL / SM ENERGY Note: All Matador acreage as of November 30, 2012 and all other acreage based on public information |
 11 EAGLE FORD EAST 7,568 gross / 6,171 net acres EOG OPERATED, MTDR WI ~21% 13,055 gross / 2,515 net acres GLASSCOCK (WINN) RANCH 8,891 gross / 8,891 net acres EAGLE FORD WEST 14,812 gross / 11,978 net acres San Antonio Uvalde Medina Zavala Frio Dimmit La Salle Webb Bexar Atascosa McMullen Live Oak Bee Goliad Dewitt Gonzales Wilson EAGLE FORD ACREAGE TOTALS 44,326 gross / 29,555 net acres COMBO LIQUIDS / GAS FAIRWAY DRY GAS FAIRWAY OIL FAIRWAY Glasscock Ranch Shelton Newman ZLS Martin Ranch Northcut Affleck Troutt Sutton MRC/EOG Pawelek Danysh Sickenius Lyssy Repka RCT Wilson Love Cowey Keseling Finney Lewton Hennig Nickel Ranch Pena Eagle Ford Properties Note: All acreage as of November 30, 2012 Karnes Matador Resources Acreage |
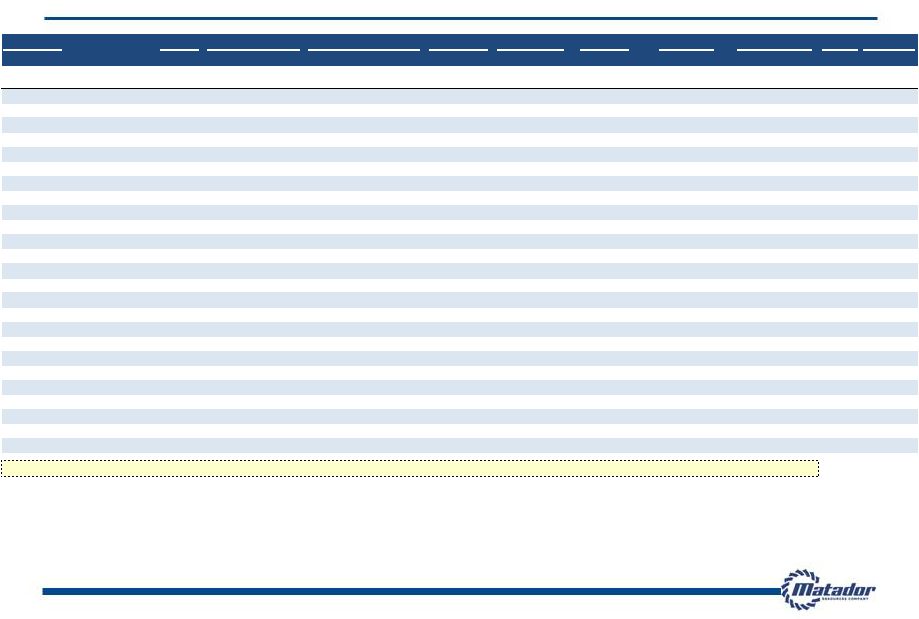 2012 Operated Eagle Ford Completion Results – 24 Hour IP Tests 12 Well Name County Completion Date Perforated Length (1) Top Perf (2) Frac Stages Oil IP (3)(4) Gas IP (3)(4) Oil Equiv IP (5) Choke Pressure Total (ft.) (ft.) (Bbl/day) (Mcf/day) (BOE/day) (inch) 2012 Wells Martin Ranch A 8H La Salle 1/28/2012 6,092 9,559 21 1,089 831 1,228 26/64 1,750 Martin Ranch A 6H La Salle 2/8/2012 6,509 9,550 22 689 1,714 975 26/64 1,650 Martin Ranch A 7H La Salle 2/12/2012 4,902 9,502 17 609 481 689 26/64 1,040 Martin Ranch B 4H La Salle 2/18/2012 3,801 9,701 13 595 968 756 26/64 1,320 Matador Sickenius Orca 1H Karnes 3/16/2012 5,712 10,897 19 785 540 875 26/64 820 Northcut A 1H La Salle 3/23/2012 4,446 9,209 15 583 592 682 26/64 1,000 Matador Danysh Orca 1H Karnes 4/1/2012 4,962 11,537 17 1,012 1,126 1,200 26/64 1,175 Northcut A 2H La Salle 5/1/2012 4,503 9,273 15 758 761 885 24/64 950 Matador Pawelek Orca 1H Karnes 6/5/2012 6,103 11,231 20 670 739 793 16/64 2,510 Matador Pawelek Orca 2H Karnes 6/7/2012 6,202 11,240 28 861 755 987 16/64 2,460 Matador Danysh Orca 2H Karnes 6/10/2012 5,115 11,331 17 750 746 874 16/64 2,675 Glasscock Ranch 1H Zavala 6/27/2012 5,352 7,166 18 307 0 307 pump 140 Matador K. Love Orca 1H DeWitt 8/10/2012 5,077 13,048 17 1,793 2,171 2,155 16/64 5,280 Matador K. Love Orca 2H DeWitt 8/11/2012 4,871 12,830 17 1,757 2,126 2,111 16/64 5,900 Northcut B 2H LaSalle 9/6/2012 4,777 9,131 16 410 315 463 16/64 1,175 Northcut B 1H LaSalle 9/12/2012 4,798 9,085 16 423 169 451 16/64 1,500 Matador Sickenius Orca 2H Karnes 9/16/2012 5,982 10,829 25 851 556 944 16/64 2,000 Martin Ranch A 12H LaSalle 10/4/2012 4,897 9,507 21 640 1,955 966 16/64 1,680 Matador K. Love Orca 4H DeWitt 11/4/2012 4,012 12,611 14 1,509 841 1,649 16/64 4,900 Matador K. Love Orca 3H DeWitt 11/6/2012 4,777 12,787 16 1,456 1,585 1,720 16/64 4,775 Martin Ranch B 13H LaSalle 11/22/2012 5,364 9,476 23 519 162 546 14/64 2,125 Martin Ranch B 9RH LaSalle 11/25/2012 5,364 9,428 23 482 240 522 14/64 2,000 Frances Lewton 2H DeWitt 12/5/2012 6,277 13,072 21 1,178 4,203 1,879 14/64 6,150 Matador Cowey Orca 1H DeWitt 12/9/2012 3,332 13,593 13 580 3,325 1,134 12/64 8,000 Northcut A 4H LaSalle 12/18/2012 4,592 9,069 16 395 139 418 14/64 1,580 Average 5,113 18.4 828 Bbl/day 1,082 Mcf/day 1,008 BOE/day 1) Total length of perforated lateral from the first perforation to the last perforation 2) Top perf is measured depth 3) Rates as reported or to be reported to the Texas Railroad Commission via W-2 or G-1 form 4) Rates are based on actual, stabilized, 24 hour production on a constant choke size 5) Oil equivalent rates are based on a 6:1 ratio of six Mcf gas per one Bbl oil |
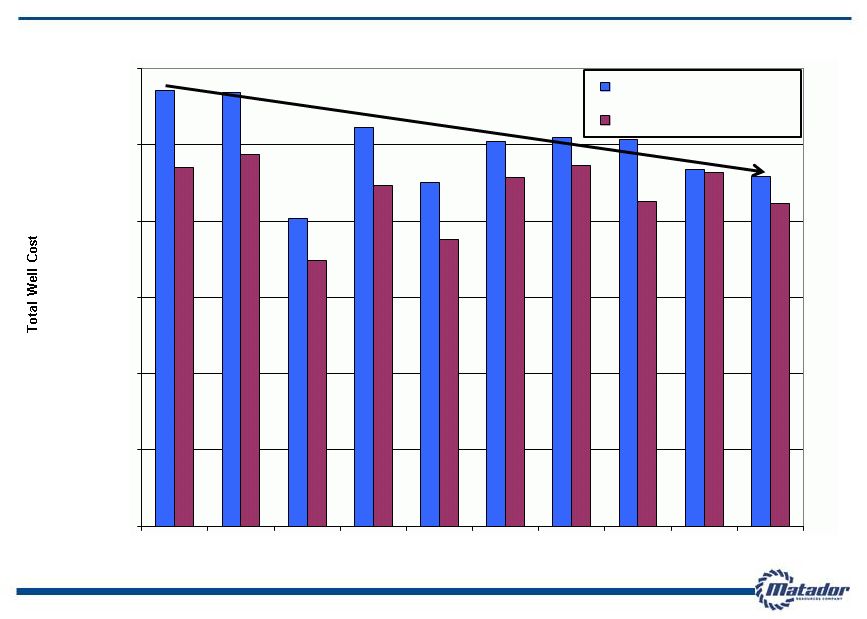 Eagle Ford Well Costs Declined During 2012 – Eastern Acreage 13 $0 $2,000,000 $4,000,000 $6,000,000 $8,000,000 $10,000,000 $12,000,000 1 2 3 4 5 6 7 8 9 10 Total Cost 5000' Normalized Cost Note: Wells are displayed in chronological order. Wells drilled and completed using two casing strings. Well drilling and completions costs only; costs do not include pipelines and lease facilities. |
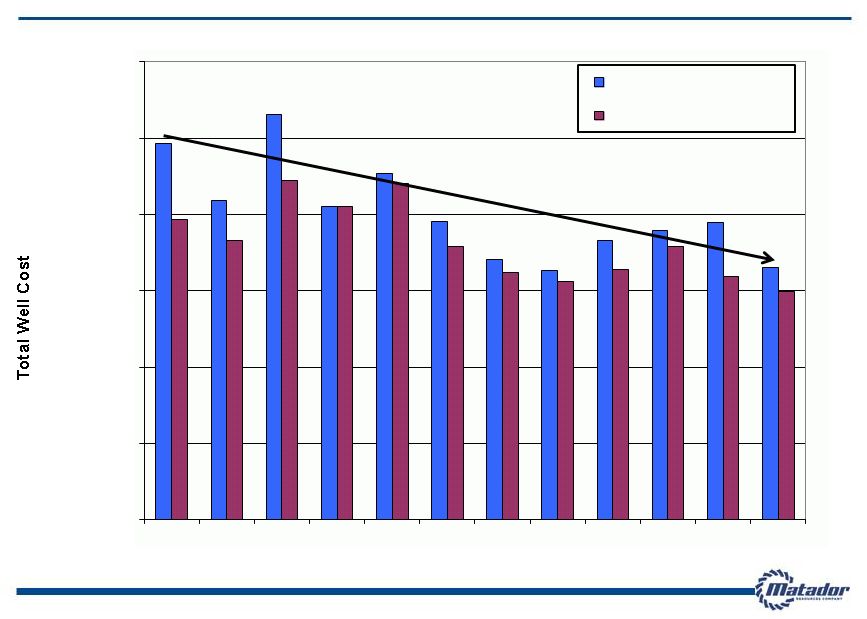 Eagle Ford Well Costs Declined During 2012 – Western Acreage 14 $0 $2,000,000 $4,000,000 $6,000,000 $8,000,000 $10,000,000 $12,000,000 1 2 3 4 5 6 7 8 9 10 11 12 Total Cost 5000' Normalized Cost Note: Wells are displayed in chronological order. Wells drilled and completed using two casing strings. Well drilling and completions costs only; costs do not include pipelines and lease facilities. |
 $0 $50,000 $100,000 $150,000 $200,000 $250,000 $300,000 $350,000 $400,000 $450,000 1 2 3 4 5 6 7 8 9 10 11 12 13 14 15 16 17 18 19 20 21 22 23 24 25 26 27 28 29 30 31 32 Bauxite White Sand Resin-Coated Sand Average Frac Stage Cost per Well 15 Note: Wells are displayed in chronological order; includes all Matador operated wells drilled and completed through December 31, 2012 |
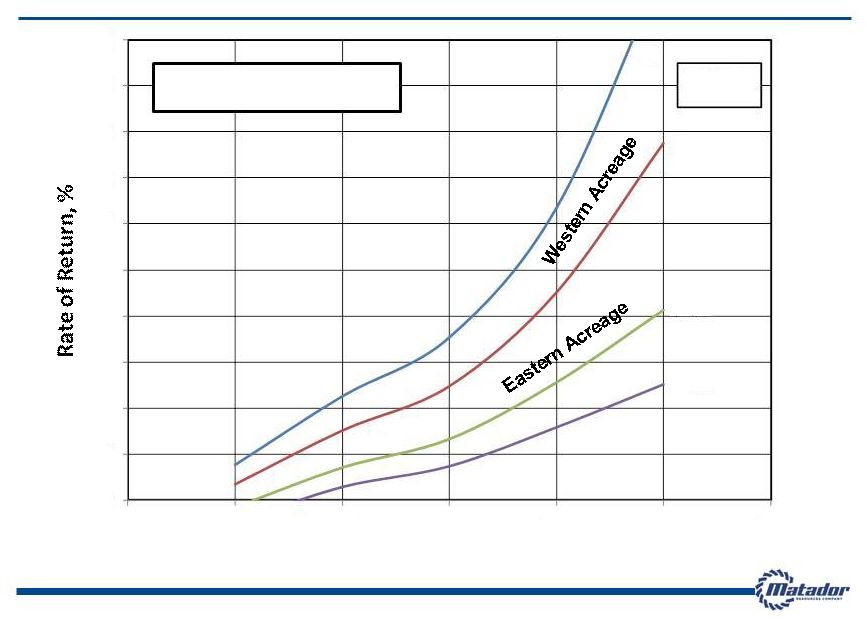 Eagle Ford Well Estimated ROR as a Function of EUR and Well Cost 16 Note: Individual well economics only. NGL price differential +$2.50/Mcf. Oil price differential +$4.30/Bbl. Estimated Ultimate Recovery (EUR), MBOE $90.00/Bbl NYMEX oil; $3.00/Mcf NYMEX natural gas $8.0 $10.0 $12.0 0 20 40 60 80 100 120 140 160 180 200 100 200 300 400 500 600 700 Well Cost, millions $7.0 |
 17 Technical Advancements in the Eagle Ford Rotary Steerable Tools – Drilling time in curve and lateral reduced by two days – Measurement While Drilling (MWD) telemetry closer to drill bit – Improves ability to stay in “sweet-spot” – Removes sumps and high-angle curves Improved frac design – Increases Stimulated Rock Volume (SRV) – Tighter fracture spacing (25% more fractures than previous design) – 35 Bbl/ft. frac fluid (75% increase from previous design) – Zipper Fracs (simultaneous frac operations) – Daily fixed cost reduced by 20% – Increases drainage efficiency Choke size reduction – Delays effects of pressure-dependent formation permeability – Increases Estimated Ultimate Recovery (EUR) – Delays installation of artificial lift – Lowers bottom-hole pressure differential – Mitigates damage to proppant pack Artificial lift – Pumping units with pump-off controllers on low-gas/oil ratio (GOR) wells – Gas-lift valves on high-gas/oil ratio (GOR) wells – Electric Submersible Pumps (ESP) to accelerate unloading frac fluids |
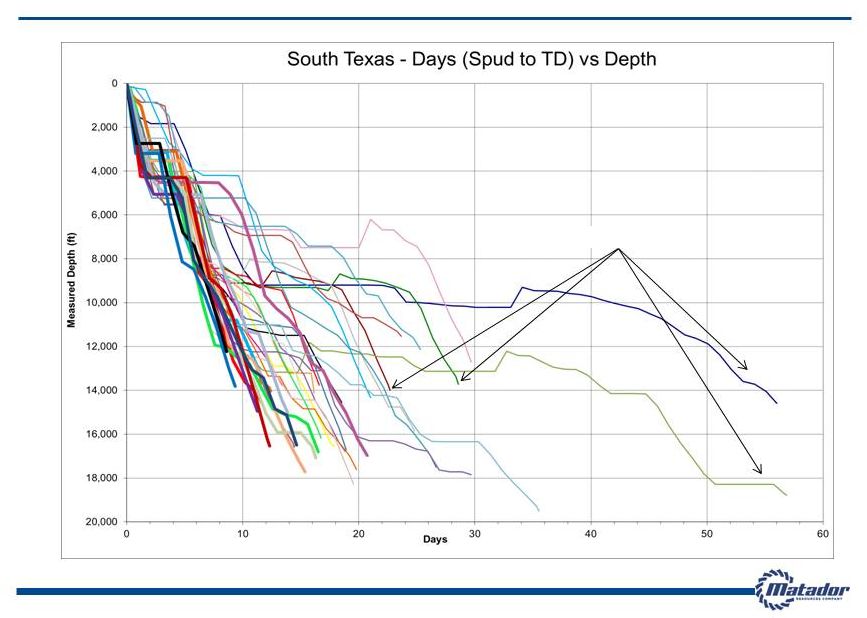 Drilling Times and Efficiencies 18 Note: As of January 25, 2013 * Bold wells utilized rotary steerable systems First 4 Wells |
 Zavala County Eagle Ford & Pearsall Trend |
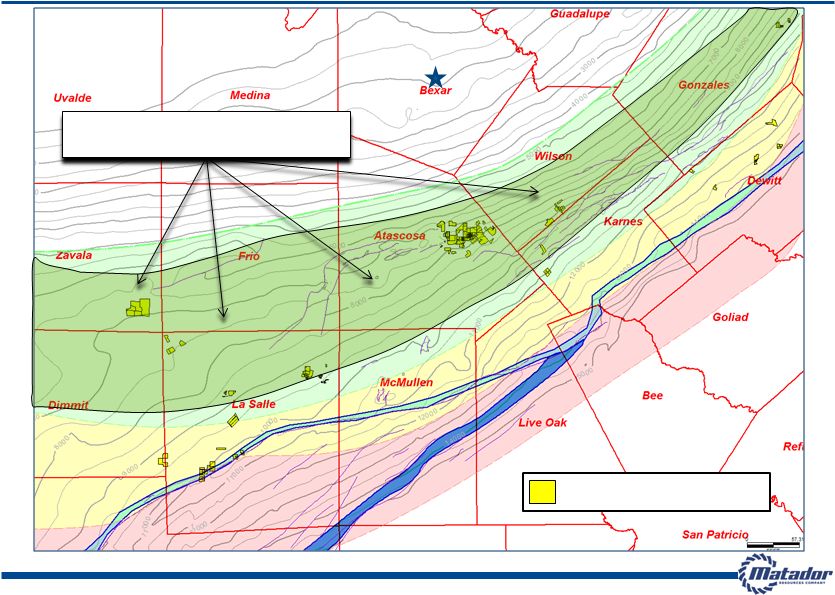
 20 South Texas Multi-Pay Petroleum Systems: Upside Potential in Zavala County Note: Information for Pearsall Oil Field sourced from public information Note: All acreage as of November 30, 2012 Olmos/Navarro Austin Chalk Oil and Gas Fields: Buda Wilcox Redhawk Area 8,891 gross / 8,891 net acres 100% Held By Production (HBP) All Rights, All Depths Matador Resources Acreage Edwards |
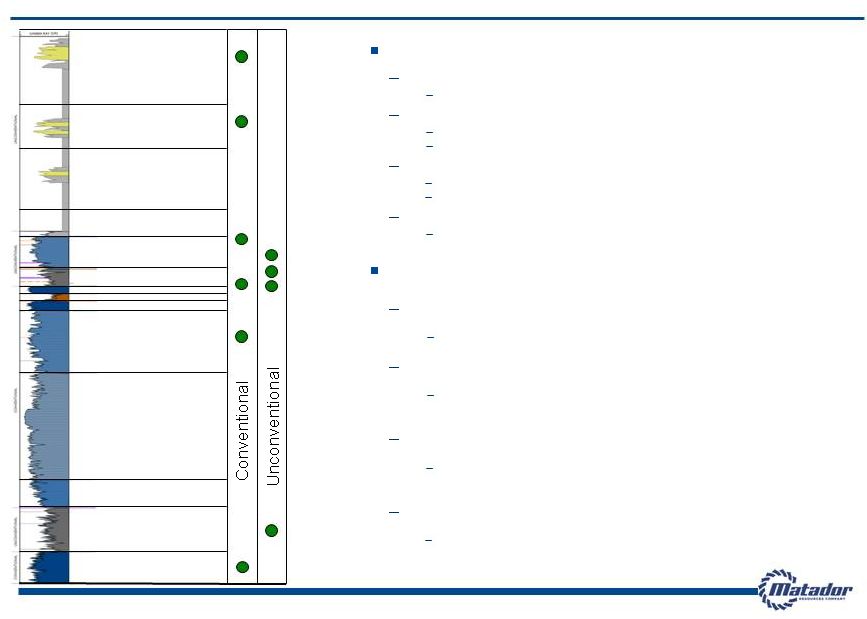 21 Multi-Pay Fairway: Productive and Prospective Pay Zones Historic Conventional Zones Olmos-Navarro Gas and oil fields in shallow section Austin Chalk Upper Austin horizontal drilling Fractured reservoir Buda Primarily productive on structure Fractured reservoir Edwards Productive on structure “New” Unconventional Zones “Chalkleford” (Eagle Ford / Austin Chalk transition zone) Recent results in Pearsall Field from other operators are positive Eagle Ford Lower costs combined with better completion techniques have improved initial results in northern oil window Horizontal Buda Drilling Exploratory play developing to exploit fracturing within the Buda both on and off structure Pearsall Shale Exploratory play, initial test wells now being drilled Austin Chalk Del Rio Edwards Glen Rose Rodessa Pearsall Sligo Olmos Navarro ANCC Eagle Ford Buda Georgetown |
 22 San Antonio Emerging Multi-Pay Area in Eagle Ford Oil Fairway and MTDR Acreage OIL FAIRWAY OIL FAIRWAY DRY GAS FAIRWAY DRY GAS FAIRWAY Note: All acreage as of November 30, 2012 Multi-Pay Fairway with Pearsall, Austin Chalk and Buda potential Matador Resources Acreage |
 Delaware Basin Southeast New Mexico and West Texas Key Operating Areas |
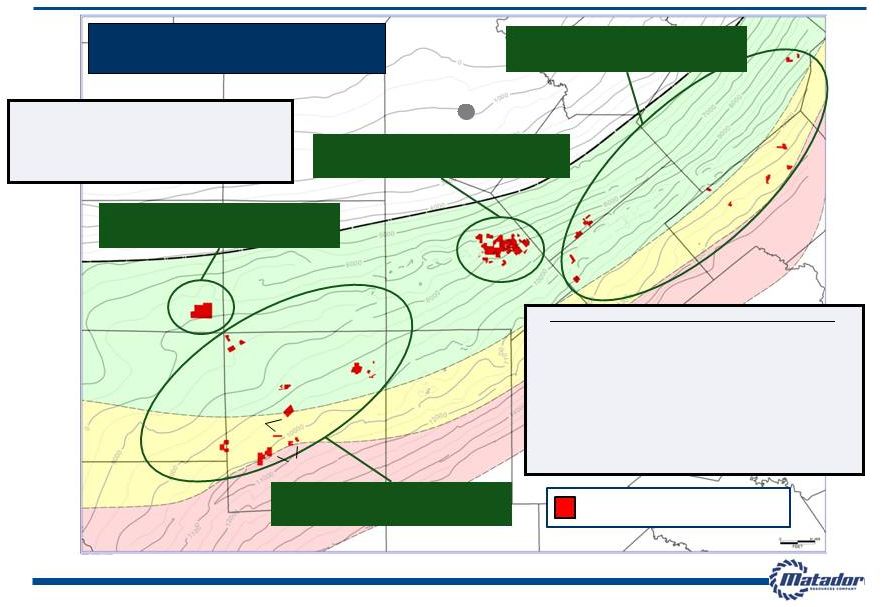
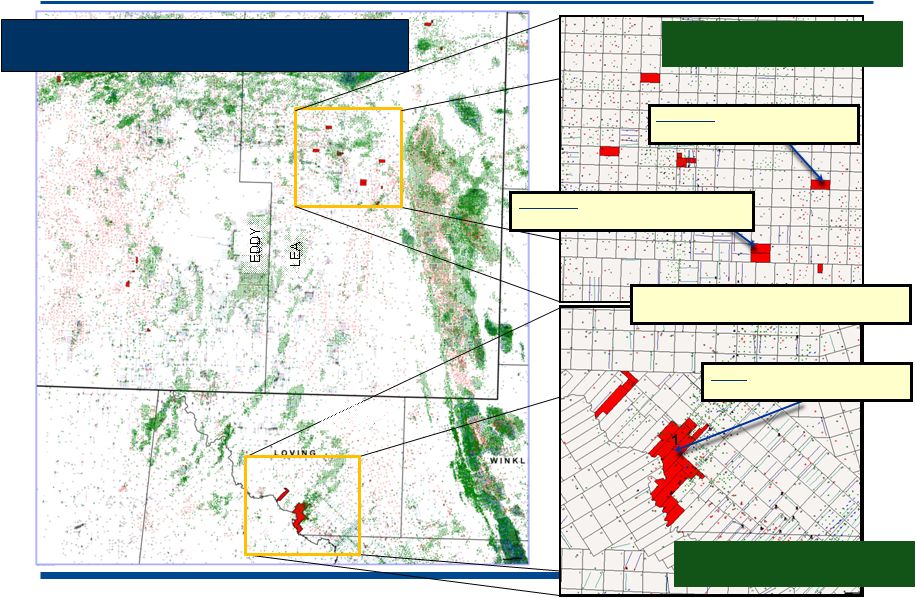
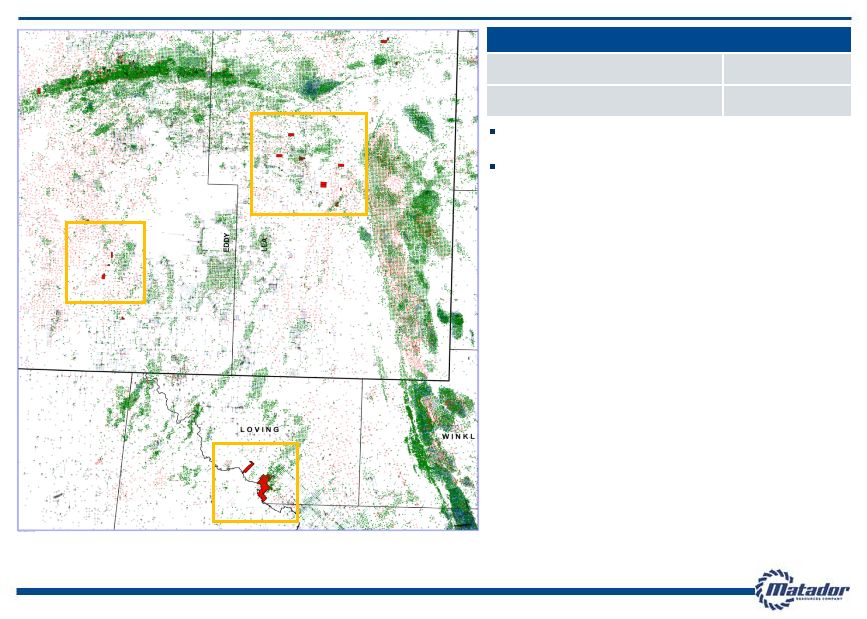 24 Matador Today Gross Acres (1) 15,860 acres Net Acres (1) 7,638 acres Southeast New Mexico / West Texas Foothold of existing production and reserves On August 10, 2012, acquired approx. 4,900 gross and 2,900 net acres prospective for the Wolfbone play in the Delaware Basin in Loving County, Texas. (1) As of November 30, 2012 RANGER- QUERECHO WOLF INDIAN DRAW |
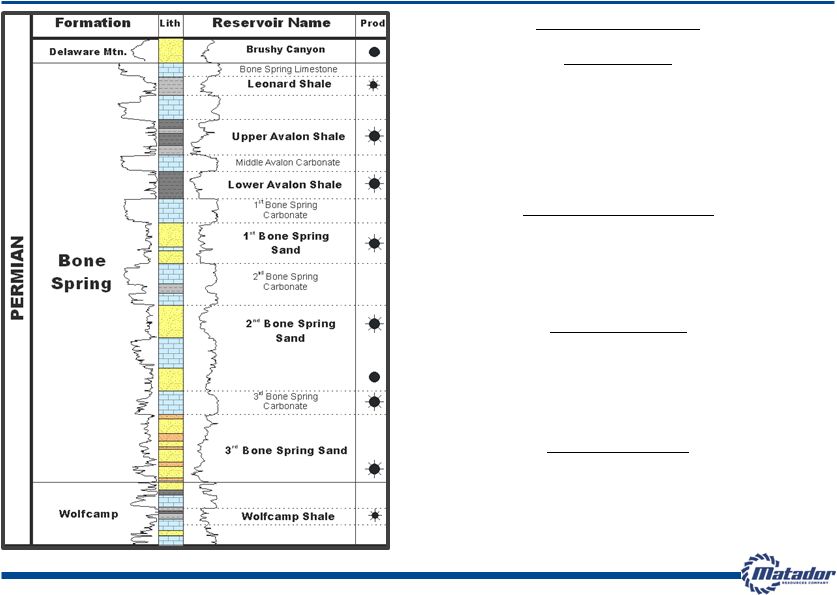 25 Wolfbone Play in the Delaware Basin (West Texas) Stratigraphic Column Avalon Shale Depth: 7,900’ – 8,300’ (Oil Window) Density Porosity: 12-14% Thickness: 300-500 ft. Normal Pressure (0.45 psi/ft.) Total Organic Carbon (TOC) 5-8% XRD: 15-20% clay and 40-60% silica IP: 100-270 Bbl/d 200-1,200 Mcf/d Middle Wolfcamp Depth: 11,500’ – 12,000’ Density Porosity: 12-15% Thickness: 200-300 ft. Geopressure (0.7psi/ft.) Total Organic Carbon (TOC) 2-4% Upper Wolfcamp Depth: 10,500’ – 10,600’ (Oil Window) Density Porosity: >10% Thickness: 280-350 ft. Geopressure (0.7psi/ft.) IP: 121-900 Bbl/d 250-3,300 Mcf/d Horizontal Targets 1 st 2 nd 3 rd Bone Spring Depth: 8,500’ – 10,600’ (Oil Window) Density Porosity: >10% Thickness: 10-100 ft. Normal Pressure (0.45 psi/ft.) IP: 10-600 Bbl/d 500-2,500 Mcf/d Note: Information from public sources |
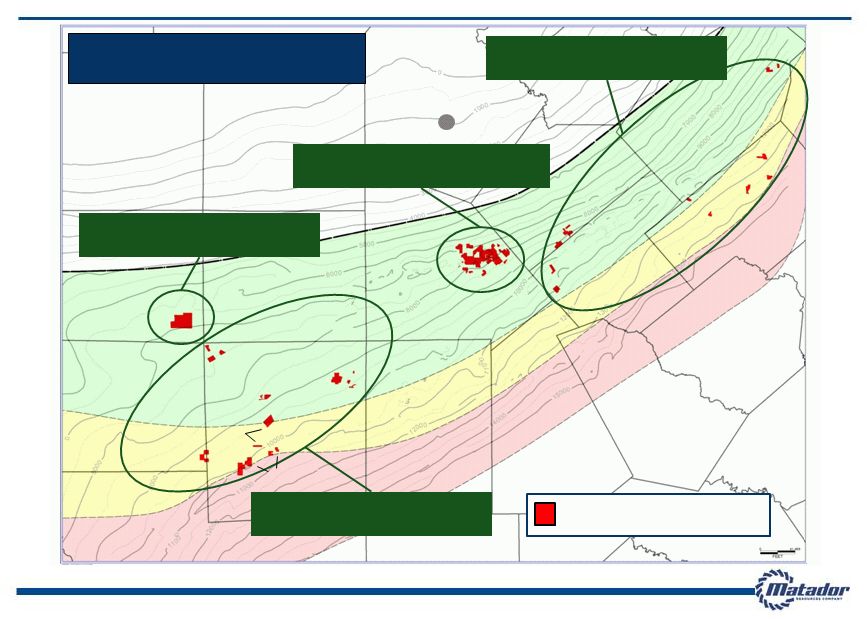
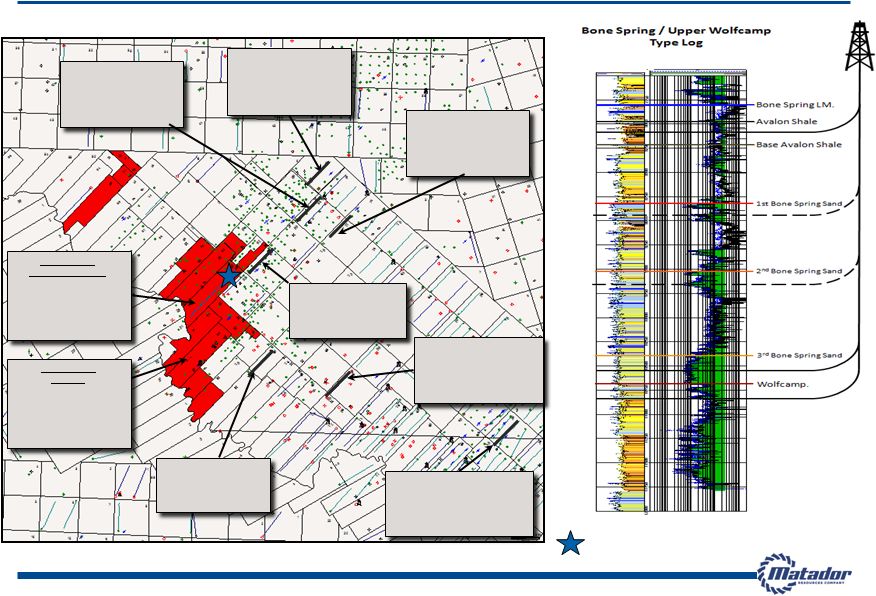 Wolf Leasehold: Proposed Wolfbone Multi-Zone Exploration Program and Surrounding Results Proposed location for Matador 2013 test well 26 Note: All acreage as of November 30, 2012 Chesapeake Johnson 1-86 (1H) Wolfcamp 17 mo.cum: 122 MBO; 344 MMcf Wolf Energy Dorothy White #1 (Vertical well) 3 BS / Upr Wolfcamp Cum Prod.: 17 years 25 MBO; 93 MMcf Wolf Energy Wolf #1 (Vertical well) 3 BS / Upr Wolfcamp Cum Prod.: 33 years 58 MBO; 620 MMcf Chesapeake Johnson 1-88 Lov #1H Wolfcamp 10 mo.cum: 72 MBO; 295 MMcf Chesapeake Johnson 1-76 (1H) Wolfcamp 22 mo.cum: 140 MBO; 475 MMcf OXY Reagan-McElvain 1H Status Unknown Spud 6/27/2012 Energen Black Mamba 1-57 Wolfcamp 3 mo.cum: 61 MBO; 180 MMcf Energen Resources Grayling 1-69 IP: 791 BOPD 7.3 MMCFD Anadarko Black Tip Johnson 1-39(1H) Wolfcamp 29 mo.cum: 234 MBO; 323 MMcf rd rd |
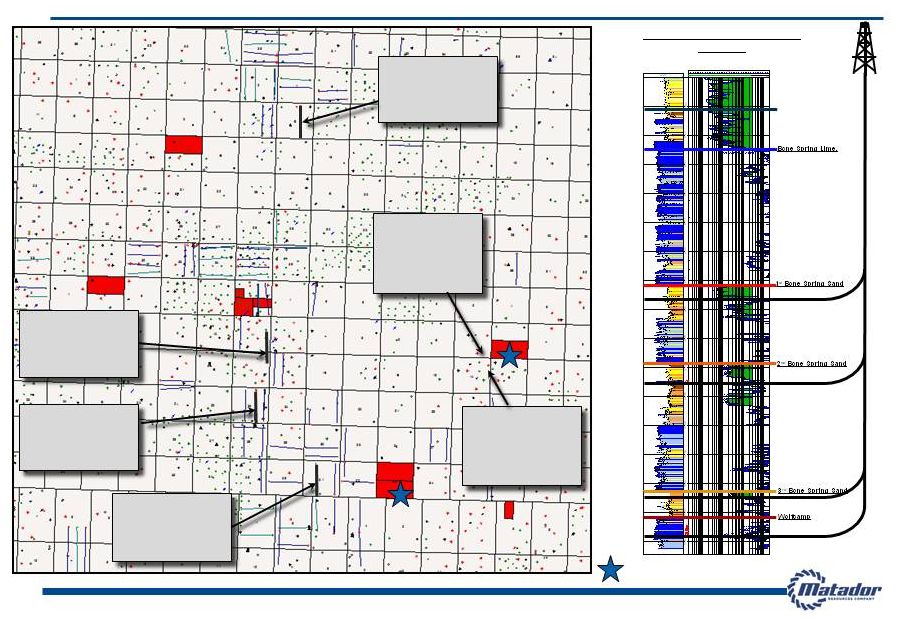 Ranger Prospect Area: Proposed Wolfbone Multi-Zone Exploration Program and Surrounding Results 27 Bone Spring / Upper Wolfcamp Type Log Proposed location for Matador 2013 test well Note: All acreage as of November 30, 2012 Legacy Operating Lee Unit 4H 3 Bone Spring 13 mo.cum: 57 MBO; 55 MMcf Cimarex Energy Lynch 23 Fed #1H 3 Bone Spring 9 mo.cum: 130 MBO; 99 MMcf Concho Stratojet 31 State #1H 2 Bone Spring 11 mo.cum: 243 MBO; 276 MMcf Concho AirCobra 12 #2H 3 Bone Spring 12 mo.cum: 196 MBO; 132 MMcf XOG Operating (Vertical well) Jordan B #1 Wolfcamp 20 years cum: 386 MBO; 5 Bcf Concho (Vertical well) Neuhaus 14 Fed #2 Wolfcamp 8 years cum: 156 MBO; 2 Bcf rd nd rd rd |
 Haynesville & Cotton Valley Northwest Louisiana and East Texas Key Operating Areas |
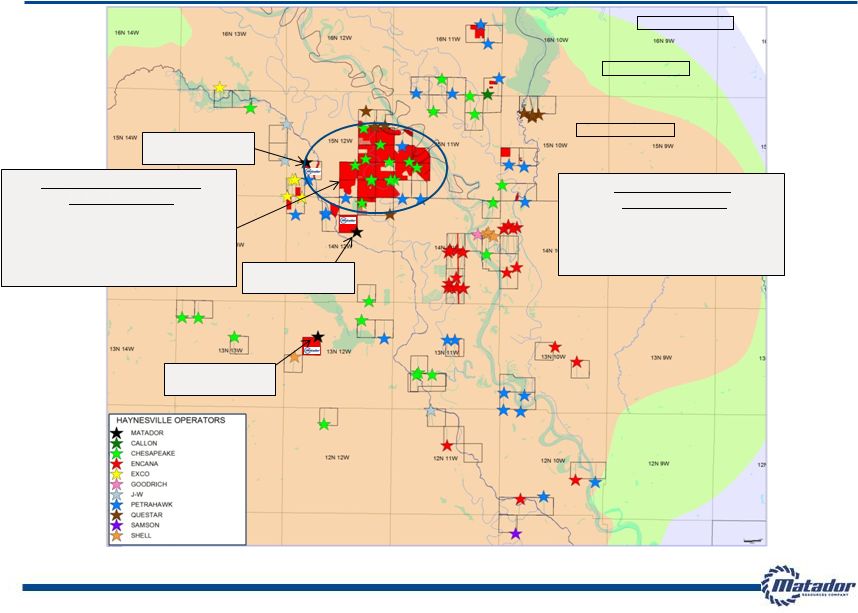 Tier 1 Haynesville and Elm Grove Cotton Valley Acreage Positions – Almost all prospective Haynesville acreage is HBP CADDO BOSSIER BIENVILLE RED RIVER TIER 1: 6 – 10+ Bcf TIER 2: 4 – 6 Bcf TIER 3: 2 – 4 Bcf 29 Elm Grove Cotton Valley: 49 Net Locations Matador Operated Acreage: 9,980 gross, 9,800 net Locations: 71 gross, 49 net (@ 3-4 locations/section) Potential Resource (1) : 135 – 170 Bcf net Tier 1 Haynesville: 50 Net Locations Acreage: 12,560 gross, 5,730 net Locations: 397 gross, 50 net (@ 7 locations/section) Potential Resource (1) : 250 – 310 Bcf net MTDR CV Horizontal T. Walker #1H MTDR Haynesville Williams (BLM) #1H MTDR Haynesville L.A. Wildlife #1H (1) Potential resource should not be considered proved natural gas reserves. Potential resource may be converted to proved natural gas reserves as a result of successful drilling operations and higher natural gas prices Note: Matador does not include any of this potential resource in its proved natural gas reserves at September 30, 2012 Note: All acreage as of November 30, 2012 |
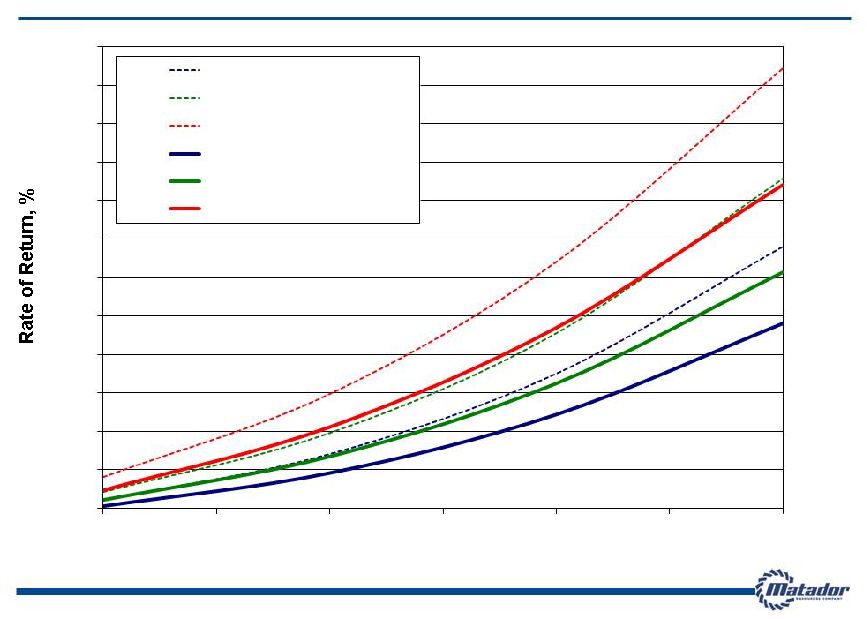 30 Haynesville Well Economics – Tier 1 Area Natural Gas Price, $/Mcf Note: Individual well economics only. D&C cost = drilling and completion cost. Natural gas price differential = ($0.85)/Mcf. 0 25 50 75 100 125 150 175 200 225 250 275 300 3 3.5 4 4.5 5 5.5 6 8 Bcf - $8.0 MM D&C Cost 9 Bcf - $8.0 MM D&C Cost 10 Bcf - $8.0 MM D&C Cost 8 Bcf - $9.0 MM D&C Cost 9 Bcf - $9.0 MM D&C Cost 10 Bcf - $9.0 MM D&C Cost |
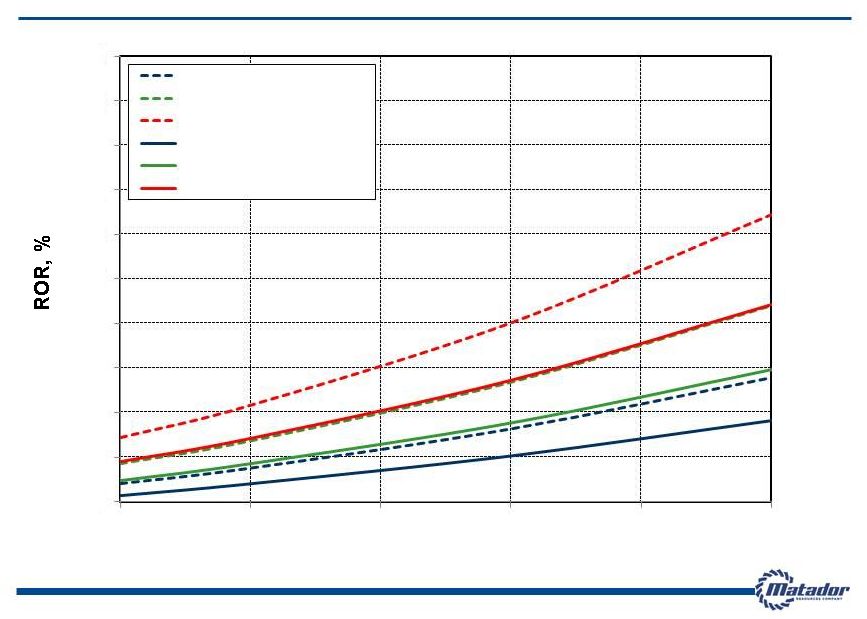 31 Cotton Valley Horizontal Well Economics Note: Individual well economics only. D&C cost = drilling and completion cost. Natural gas price differential = (10%) 0.0 10.0 20.0 30.0 40.0 50.0 60.0 70.0 80.0 90.0 100.0 $3.50 $4.00 $4.50 $5.00 $5.50 $6.00 Natural Gas Price, $/Mcf 4.0 Bcf - $5.6 MM D&C Cost 5.0 Bcf - $5.6 MM D&C Cost 6.0 Bcf - $5.6 MM D&C Cost 4.0 Bcf - $6.6 MM D&C Cost 5.0 Bcf - $6.6 MM D&C Cost 6.0 Bcf - $6.6 MM D&C Cost |
 Gracie Wyoming, Utah and Idaho Key Operating Areas |
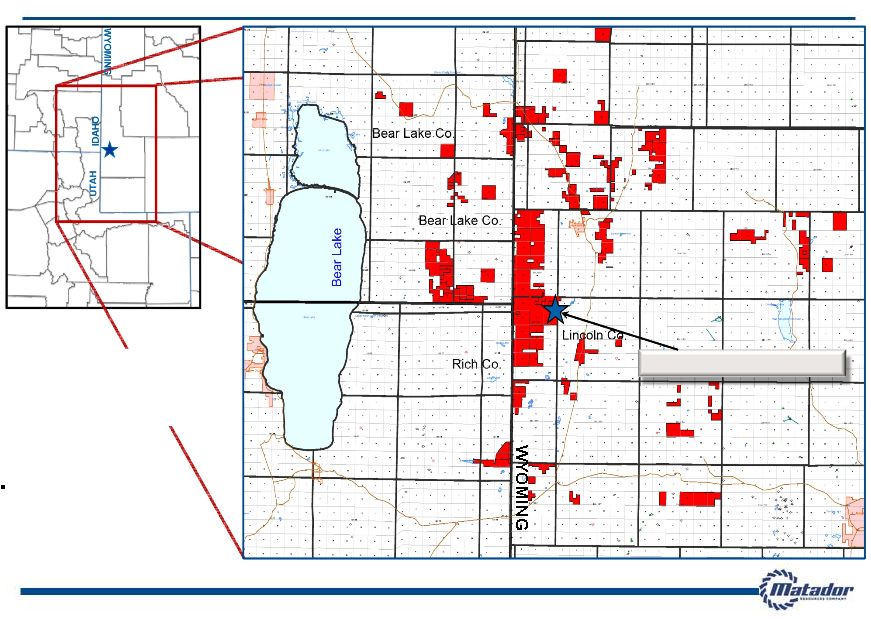 Matador Gracie Project Total Prospect Acreage 54,450 gross acres 26,908 net acres 33 Note: All acreage as of November 30, 2012 Crawford Federal #1H completion scheduled for summer 2013 IDAHO UTAH WYOMING WYOMING Crawford Federal #1H |
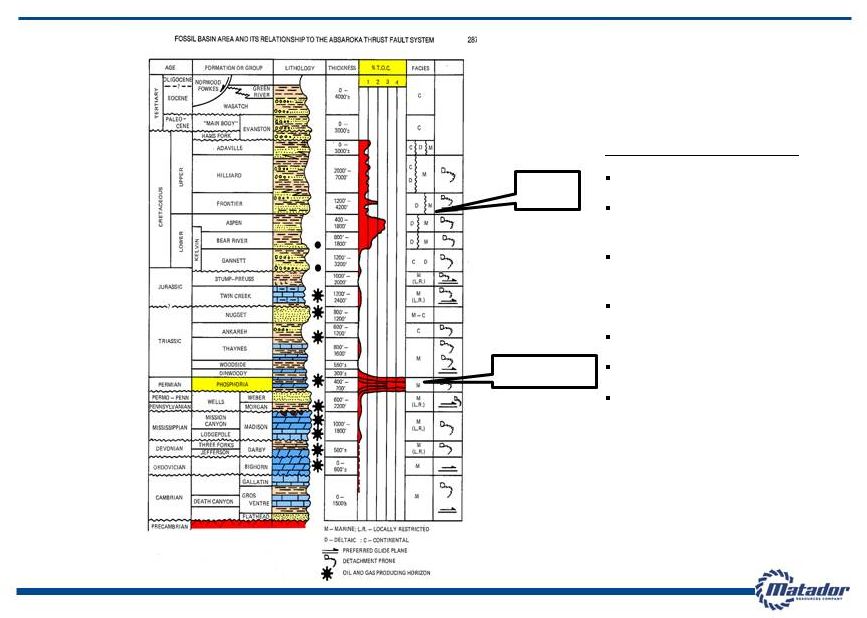 Southwest Wyoming Stratigraphy and Target Zones Lamberson, Paul, 1982, The Fossil Basin and its Relationship to the Absaroka Thrust System, Wyoming and Utah, RMAG Meade Peak Shale Cretaceous Shales 2% TOC Crawford Federal #1: 34 13% TOC Drilled straight hole in late 2011 Encountered 161’ Meade Peak with 46’ of main pay Recovered 50’ conventional core across pay zone TOC ave 4.52% (Maximum 14.2%) Thermally mature: Ro 1.69% Porosity Average: 3.0– 5.0% Micro-Darcy Permeability |
 2013 Capital Investment Plan |
 2013 Capital Investment Plan Highlights 36 2013 projected capital expenditures of approximately $310 million – Drill and complete or participate in 48 gross/31.3 net wells in 2013 – Including 31.0 gross/25.8 net Eagle Ford Shale and 3.0 gross/3.0 net Bone Spring/Wolfcamp – Also, includes 3.0 gross/1.6 net exploratory Austin Chalk, Buda and Edwards test – Includes approximately $25 million for pipelines/facilities and $25 million for land/seismic acquisition 2013 Production Expectations – Oil production of 1.6 to 1.8 million barrels – up about 40% from 2012 – Natural gas production of 11.0 to 12.0 Bcf – down about 8% from 2012 2013 Financial Expectations – Oil and natural gas revenues (1) of $200 to $220 million – up about 40% from estimated in 2012 – Adjusted EBITDA (1)(2) of $140 to $160 million – up about 33% from estimated in 2012 – Total borrowings outstanding estimated to be $310 to $320 million at YE 2013 Maintain financial discipline by funding 2013 capital expenditures through operating cash flows and borrowings under revolving credit facility – 2013 oil production volumes well hedged to protect cash flows below about $88/Bbl oil price (1) Estimated 2013 oil and natural gas revenues and Adjusted EBITDA at midpoint of guidance range using late November 2012 strip prices for oil and natural gas, plus property-specific differentials. Estimated average realized prices for oil and natural gas were $94.00/Bbl and $4.43/Mcf, respectively (2) Adjusted EBITDA is a non-GAAP financial measure. For a definition of Adjusted EBITDA and a reconciliation of Adjusted EBITDA to our net (loss) income and net cash provided by operating activities, see Appendix |
 37 2013 Oil Production Estimated total oil production of 1.6 to 1.8 million barrels Increase of approximately 40% from 2012 Oil production expected to decline from year-end 2012 levels in early 2013 Production delays, shut-ins due to pad drilling, zipper fracs, etc. Oil production expected to return to over 5,000 Bbl/d during second half of 2013 2013 Natural Gas Production Estimated total natural gas production of 11.0 to 12.0 Bcf Decrease of approximately 8% from 2012 Gas production expected to remain relatively flat during 2013, but should include higher percentage of liquids- rich gas 2013 Production Expectations (1) Estimated quarterly average oil and natural gas production at midpoint of guidance range Oil Production (1) (Bbl/d) Natural Gas Production (1) (MMcf/d) 0 1,000 2,000 3,000 4,000 5,000 6,000 1Q13 2Q13 3Q13 4Q13 0.0 10.0 20.0 30.0 40.0 1Q13 2Q13 3Q13 4Q13 – |
 38 2013 Revenue and Adjusted EBITDA (1)(2) Estimated oil and natural gas revenues of $200 to $220 million Increase of approximately 40% from estimated $145 to $155 million in 2012 Estimated Adjusted EBITDA (1)(2) of $140 to $160 million Increase of approximately 33% from estimated $110 to $115 million in 2012 Adjusted EBITDA (1)(2) growth expected to be impacted by lower oil price realizations and an estimated decrease of approximately $13 million in realized hedging gains compared to 2012 2013 Operating Costs Estimated average unit costs per BOE Production taxes/marketing = $4.10 Lease operating = $8.20 G&A = $4.70 Operating cash costs, excluding interest = $17.00 DD&A = $29.50 2013 Financial Expectations Oil and Natural Gas Revenues (2) (millions) Adjusted EBITDA (1)(2) (millions) $19.0 $34.0 $67.0 $150.0 $210.0 $0.0 $50.0 $100.0 $150.0 $200.0 $250.0 2009 2010 2011 2012E 2013E $15.2 $23.6 $49.9 $112.5 $150.0 $0.0 $40.0 $80.0 $120.0 $160.0 2009 2010 2011 2012E 2013E (1) Adjusted EBITDA is a non-GAAP financial measure. For a definition of Adjusted EBITDA and a reconciliation of Adjusted EBITDA to our net (loss) income and net cash provided by operating activities, see Appendix (2) Estimated 2013 oil and natural gas revenues and Adjusted EBITDA at midpoint of guidance range using late November 2012 strip prices for oil and natural gas, plus property-specific differentials. Estimated average realized prices for oil and natural gas were $94.00/Bbl and $4.43/Mcf, respectively |
 Funding for 2013 Capital Investment Plan 39 Maintain financial discipline by anticipated funding of 2013 capital expenditures through operating cash flows and borrowings under revolving credit facility – Most of 2013 Eagle Ford program is development drilling and largely de-risked by 2012 results – 1.5 million barrels of 2013 oil production hedged protecting cash flows below approximately $88/Bbl oil price Credit facility status at January 25, 2013 – Borrowing base of $215 million; total facility size of $500 million; facility matures in December 2016 – Borrowings outstanding of $165 million Ability to request quarterly borrowing base increases with growth in oil and natural gas reserves throughout 2013 – Estimated borrowings outstanding of $310 to $320 million at YE 2013 Additional flexibility to manage liquidity – No long-term drilling rig or service contract commitments – $25 million estimated for discretionary land/seismic acquisitions – No significant non-operated well obligations Simple capital structure; no high-yield debt or convertibles on balance sheet |
  40 Continued Oil/Liquids Focus to Fuel 2013 Growth 2013 Anticipated Drilling 2013E CapEx Gross Wells Net Wells (in millions) Total Total % Total % South Texas Eagle Ford Shale 31.0 25.8 82.4% $217.0 70.1% Austin Chalk, Buda, Edwards 3.0 1.6 5.1% $5.9 1.9% Facilities/Pipelines/Etc. - - - $19.8 6.4% Area Total 34.0 27.4 87.5% $242.7 78.4% West Texas/Southeast New Mexico Bone Spring/Wolfcamp 3.0 3.0 9.6% $30.2 9.8% Facilities/Pipelines/Etc. - - - $5.4 1.7% Area Total 3.0 3.0 9.6% $35.6 11.5% Northwest Louisiana Haynesville Shale 10.0 0.5 1.6% $5.1 1.7% Southwest Wyoming Meade Peak Shale 1.0 0.4 1.3% $1.0 0.3% Other Land/Seismic/Etc. - - - $25.0 8.1% Total 48.0 31.3 100.0% $309.4 100.0% |
 41 EAGLE FORD EAST 7,568 gross / 6,171 net acres EOG OPERATED, MTDR WI ~21% 13,055 gross / 2,515 net acres GLASSCOCK (WINN) RANCH 8,891 gross / 8,891 net acres EAGLE FORD WEST 14,812 gross / 11,978 net acres San Antonio Medina Zavala Frio Dimmit La Salle Webb Bexar Atascosa McMullen Dewitt Gonzales Wilson EAGLE FORD ACREAGE TOTALS 44,326 gross / 29,555 net acres COMBO LIQUIDS / GAS FAIRWAY DRY GAS FAIRWAY OIL FAIRWAY Glasscock Ranch Shelton Newman ZLS Martin Ranch Northcut Affleck Troutt Sutton MRC/EOG Pawelek Danysh Sickenius Lyssy Repka RCT Wilson Love Cowey Keseling Finney Lewton Hennig Nickel Ranch Pena Matador Resources Acreage 2013 South Texas Drilling Plan Note: All acreage values at November 30, 2012. Net wells reflect Matador’s working interest ownership Karnes 13 2 2 1 3 4 (Non-Op) 4 1 (Buda – Non-Op) 1 (Edwards – Non-Op) 1 1 1 (Austin Chalk) Potential Remaining Eagle Ford Drilling Locations 214 gross/164 net locations Tier 1 – 107 gross/78 net locations (80-acre spacing) Tier 2 – 107 gross/86 net locations (primarily Glasscock Ranch and Sutton, both HBP, 80 to 120-acre spacing) No Eagle Ford locations estimated for Atascosa acreage Numbers do not include any potential locations for other horizons – e.g., Austin Chalk, “Chalkleford”, Buda, Pearsall *At December 31, 2012 # - Gross wells planned in 2013; All Matador operated Eagle Ford wells unless noted otherwise 34 gross/27.4 net wells planned in 2013 |
 Delaware Basin Acreage and 2013 Drilling Plan RANGER LOVING WOLF 1 1 1 42 DELAWARE BASIN PROSPECTIVE ACREAGE 7,498 gross / 4,928 net acres RANGER 1,955 gross / 1,562 net acres Ranger A2 Primary Target: Wolfcamp Shale Ranger A1 Primary Target: 2nd Bone Spring Sand # - Matador operated wells planned in 2013 3 gross/3 net horizontal wells planned in 2013 Wolf 1 Primary Target: Wolfcamp Shale WOLF 5,203 gross / 2,977 net acres Matador’s acreage position as of November 30, 2012 shown in red. Note: Certain additional Matador acreage in West Texas/Southeast New Mexico not considered prospective as of November 30, 2012 |
 Financials |
 January 7, 2013 Operational Update 44 Matador announced that its average production rate during the month of December 2012 was approximately 5,800 barrels of oil per day and 34.6 million cubic feet of gas per day, or approximately 11,500 BOE per day. The average oil rate for December of 5,800 barrels per day was about 10% higher than the midpoint of the Company’s 2012 exit rate guidance of 5,000 to 5,500 barrels per day There are no other changes to the Company’s guidance for its 2012 or 2013 results The Company also announced an increase in its borrowing base to $215 million based on its lenders’ review of the Company’s proved oil and natural gas reserves at September 30, 2012 |
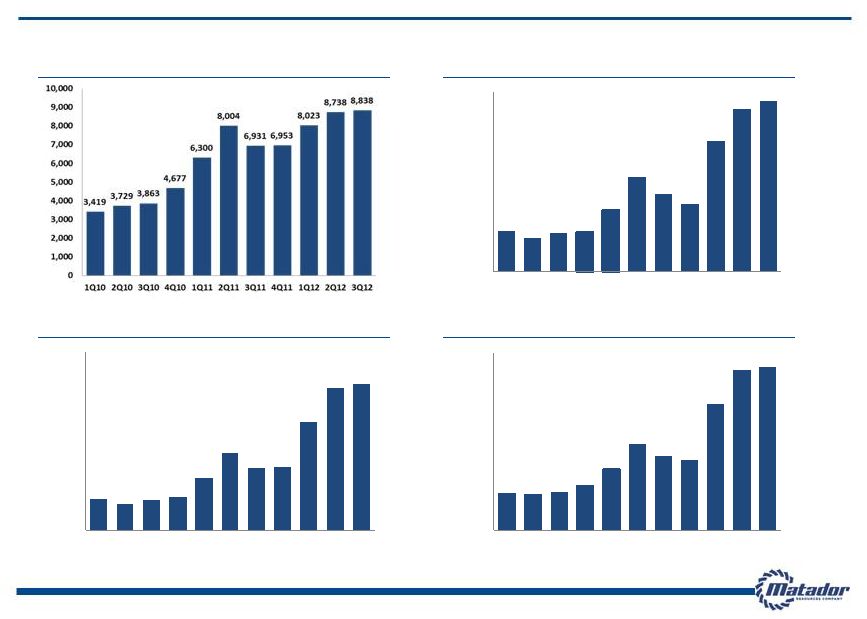
 Recent Production and Financial Highlights 45 Record results in Q3 2012 – Oil production of 303,000 Bbl, a sequential quarterly increase of 6% from 285,000 Bbl produced in Q2 2012 and a year-over-year increase of 7-fold – 25% sequential increase in oil reserves to 8.4 million Bbl and 20% sequential increase in PV-10 (1) of proved reserves to $363.6 million (Standardized Measure of $333.9 million) – Average daily oil equivalent production of 8,838 BOE per day, including 3,291 Bbl of oil per day and 33.3 MMcf of natural gas per day – Oil production of 3,291 Bbl per day, up 7-fold from 465 Bbl per day in Q3 2011; gas production of 33.3 MMcf per day down about 14% from Q3 2011 and flat to Q2 2012 – Total realized revenues, including hedging, of $41.4 million, a year-over-year increase of 119%; oil and natural gas revenues of $38.0 million, a year-over-year increase of 118% – Adjusted EBITDA (2) of $28.6 million, a year-over-year increase of 137% Nine months ended September 30, 2012 – Total realized revenues, including hedging, of $114.4 million, a year-over-year increase of 103%; oil and natural gas revenues of $103.3 million, a year-over-year increase of 99% – Adjusted EBITDA (2) of $77.9 million, a year-over-year increase of 107% (1) PV-10 is a non-GAAP financial measure. For a reconciliation of PV-10, see Appendix (2) Adjusted EBITDA is a non-GAAP financial measure. For a definition of Adjusted EBITDA and a reconciliation of Adjusted EBITDA to our net (loss) income and net cash provided by operating activities, see Appendix |
 46 2013 and 2014 Hedging Profile 1.5 million barrels of oil hedged for 2013 at weighted average floor and ceiling of $88/Bbl and $107/Bbl, respectively 4.7 Bcf of natural gas hedged at weighted average floor and ceiling of $3.34/MMBtu and $4.84/MMBtu, respectively 4.9 million gallons of natural gas liquids hedged at weighted average price of $0.79/gal As of January 25, 2013, Matador has 840,000 barrels of oil hedged for 2014 at weighted average floor and ceiling of $86/Bbl and $100/Bbl, respectively Oil Hedges (Costless Collars) FY 2013 Total Volume Hedged by Ceiling (Bbl) 1,260,000 Weighted Average Price ($ / Bbl) $110.26 Total Volume Hedged by Floor (Bbl) 1,260,000 Weighted Average Price ($ / Bbl) $87.14 Oil Hedges (Swaps) FY 2013 Total Volume Hedged (Bbl) 240,000 Weighted Average Price ($ / Bbl) $90.43 Natural Gas Hedges (Costless Collars) FY 2013 Total Volume Hedged by Ceiling (Bcf) 4.65 Weighted Average Price ($ / MMBtu) $4.84 Total Volume Hedged by Floor (Bcf) 4.65 Weighted Average Price ($ / MMBtu) $3.34 Natural Gas Liquids (NGLs) Hedges (Swaps) FY 2013 Total Volume Hedged (gal) 4,864,800 Weighted Average Price ($ / gal) $0.79 |
 Reserves Summary – December 31, 2012 47 Total proved reserves: 23.8 million BOE (142.9 Bcfe) at December 31, 2012, including 10.5 million Bbl of oil and 80.0 Bcf of natural gas Oil reserves grew 176% to 10.5 million Bbl from 3.8 million Bbl at December 31, 2011 PV-10 (1) increased 70% to $423.2 million from $248.7 million at December 31, 2011, despite removal of close to 100 Bcf of proved undeveloped Haynesville shale gas reserves at June 30, 2012 Oil reserves comprised 44% (1 Bbl = 6 Mcf basis) of total proved reserves at December 31, 2012, up from 12% at December 31, 2011 Eagle Ford reserves comprised 93% of total PV-10 (1) at December 31, 2012 as compared to 52% at December 31, 2011 Sequential growth from 9/30/2012 to 12/31/2012 – Oil reserves grew 25% to 10.5 million Bbl from 8.4 million Bbl at September 30, 2012 – PV-10 (1) increased 16% to $423.2 million from $363.6 million at September 30, 2012 (1) PV-10 is a non-GAAP financial measure. Matador is unable to calculate standardized measure at December 31, 2012 until it completes its audit. For a reconciliation of PV-10, see Appendix |
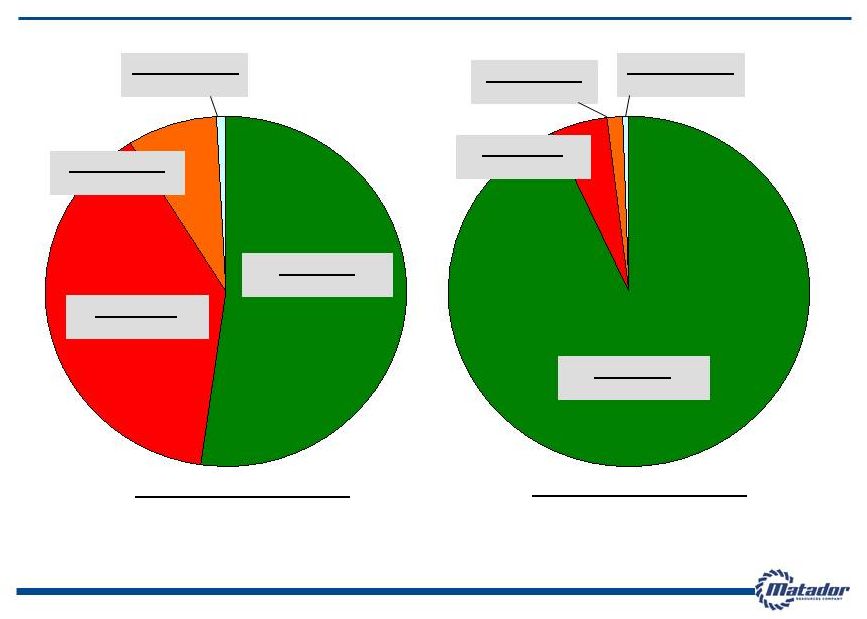 48 Value of Proved Reserves Up 70% and Shifting to Oil Over Past Year Eagle Ford $393.6 million, 93% Haynesville $21.8 million, 5% Cotton Valley $5.9 million, 1% SE New Mexico $2.0 million, 0% December 31, 2012 PV-10 (1) : $423.2 million (2) Proved Producing Reserves PV-10 (1) : $297.5 Million Haynesville $96.6 million, 39% Cotton Valley $19.5 million, 8% Eagle Ford $130.2 million, 52% SE New Mexico $2.4 million, 1% December 31, 2011 PV-10 (1) : $248.7 million Proved Producing Reserves PV-10 (1) : $154.1 Million (1) PV-10 is a non-GAAP financial measure. Matador will provide standardized measure at December 31, 2012 with its December 2012 audited financial results. For a reconciliation of PV-10, see Appendix (2) Future undiscounted net revenue of $704.2 million using YE 2012 SEC pricing of $91.21/Bbl oil and $2.757/MMBtu gas |
 Appendix |
 Board of Directors and Special Board Advisors – Expertise and Stewardship 50 Board Members and Advisors Professional Experience Business Expertise Dr. Stephen A. Holditch Director - Professor and Former Head of Dept. of Petroleum Engineering, Texas A&M University - Founder / President S.A. Holditch & Associates - Past President of Society of Petroleum Engineers Oil & Gas Operations David M. Laney Lead Director - Past Chairman, Amtrak Board of Directors - Former Partner, Jackson Walker LLP Law & Investments Gregory E. Mitchell Director - President / CEO, Toot’n Totum Food Stores Petroleum Retailing Dr. Steven W. Ohnimus Director - Retired VP and General Manager, Unocal Indonesia Oil & Gas Operations Michael C. Ryan Director - Partner, Berens Capital Management International Business and Finance Margaret B. Shannon Director - Retired VP and General Counsel, BJ Services Co. - Former Partner, Andrews Kurth LLP Law and Corporate Governance Mino Capossela Special Board Advisor - Retired partner Goldman Sachs; Charter Financial Analyst; Private Investor Finance and Management Marlan W. Downey Special Board Advisor - Retired President, ARCO International - Former President, Shell Pecten International - Past President of American Association of Petroleum Geologists Oil & Gas Exploration Wade I. Massad Special Board Advisor - Managing Member, Cleveland Capital Management, LLC - Former EVP Capital Markets, Matador Resources Company - Formerly with KeyBanc Capital Markets and RBC Capital Markets Capital Markets Edward R. Scott, Jr. Special Board Advisor - Former Chairman, Amarillo Economic Development Corporation - Law Firm of Gibson, Ochsner & Adkins Law, Accounting and Real Estate Development W.J. “Jack” Sleeper, Jr. Special Board Advisor - Retired President, DeGolyer and MacNaughton (Worldwide Petroleum Consultants) Oil & Gas Executive Management |
 Proven Management Team – Experienced Leadership 51 Management Team Background and Prior Affiliations Industry Experience Matador Experience Joseph Wm. Foran Founder, Chairman and CEO - Matador Petroleum Corporation, Foran Oil Company, J Cleo Thompson Jr. and Thompson Petroleum Corp. 32 years Since Inception David E. Lancaster EVP and COO - Schlumberger, S.A. Holditch & Associates, Inc., Diamond Shamrock 33 years Since 2003 Matthew V. Hairford EVP and Head of Operations - Samson, Sonat, Conoco 28 years Since 2004 David F. Nicklin Executive Director of Exploration - ARCO, Senior Geological Assignments in UK, Angola, Norway and the Middle East 41 years Since 2007 Bradley M. Robinson VP, Reservoir Engineering - Schlumberger, S.A. Holditch & Associates, Inc., Marathon 35 years Since Inception Craig N. Adams VP and General Counsel - Baker Botts L.L.P., Thompson & Knight LLP 20 years Since 2012 Kathryn L. Wayne Controller and Treasurer - Matador Petroleum Corporation, Mobil 28 years Since Inception Ryan London Senior Completion Engineer Eagle Ford Asset Manager - Matador Resources Company 9 years Since 2003 |
 52 Quarterly Performance Metrics Through Q3 2012 Oil and Natural Gas Revenues ($ in mm) Total Realized Revenues ($ in mm) Adjusted EBITDA (1) ($ in mm) Average Daily Equivalent Production (BOE/d) $9.2 $7.5 $8.5 $8.9 $13.7 $20.9 $17.4 $15.0 $29.2 $36.1 $38.0 $0.0 $5.0 $10.0 $15.0 $20.0 $25.0 $30.0 $35.0 $40.0 1Q10 2Q10 3Q10 4Q10 1Q11 2Q11 3Q11 4Q11 1Q12 2Q12 3Q12 $6.1 $5.2 $5.8 $6.5 $10.1 $15.3 $12.1 $12.4 $21.3 $27.9 $28.6 $0.0 $5.0 $10.0 $15.0 $20.0 $25.0 $30.0 $35.0 1Q10 2Q10 3Q10 4Q10 1Q11 2Q11 3Q11 4Q11 1Q12 2Q12 3Q12 $9.5 $9.1 $9.6 $11.2 $15.5 $21.8 $18.9 $17.9 $32.2 $40.8 $41.4 $0.0 $5.0 $10.0 $15.0 $20.0 $25.0 $30.0 $35.0 $40.0 $45.0 1Q10 2Q10 3Q10 4Q10 1Q11 2Q11 3Q11 4Q11 1Q12 2Q12 3Q12 (1) Adjusted EBITDA is a non-GAAP financial measure. For a definition of Adjusted EBITDA and a reconciliation of Adjusted EBITDA to our net (loss) income and net cash provided by operating activities, see Appendix |
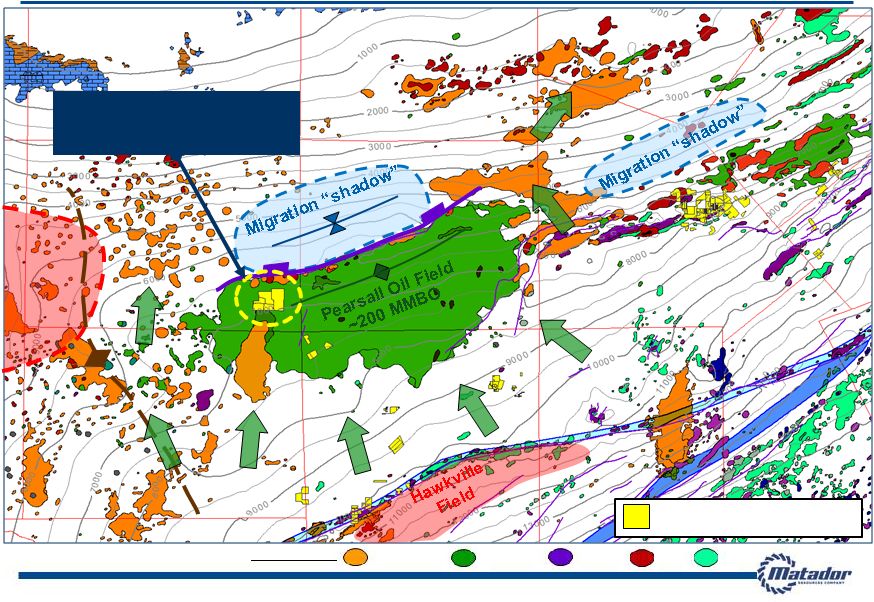
 South Texas Pearsall Play: Activity & Liquids to Dry Gas Distribution Model Anadarko Newfield Chesapeake Shell Gas Activity EOG Tests Condensate belt 500 – 2,000 BC/mo. Temp. Abnd or EGFD Horiz. Top Pearsall Depth Map CI = 500’ Cheyenne Indio Tanks Horiz. program 4 horizs w/ 700 to 450 BCPD plus 4-6 MMCFGPD Chesapeake Wilson C#1HP IP 250 BCPD/ 3 MMCFPD Abnd. Chesapeake Brownlow #3H Abandoned Test PXP Chesapeake Avant D#1HP 300 BC/mo. Abnd. Cheyenne Drilling Cabot 6 Horiz. Drilled 3 Permits Blackbrush O&G Pals Ranch 11H IP 706 BCPD/ 4 MMCFPD Valence Op. Co. 53 Note: All acreage as of November 30, 2012 Note: Well data available through public sources and interpretation by Matador Resources |
 Zavala, Frio, La Salle and Dimmit Counties: Important Matador and Competitor Wells Since 2011 54 ( ZaZa) Cenizo Ranch B 3H Best 3 Oil – 17,312 (MTDR) GR 1H 6,125’ Lateral On pump @ 60 BOPD Best 3 Oil – 9,827 Est. EUR = 100,000 BOE (Buffco) Howett 1H OIL IP: 243; GAS IP: 152 22/64” choke Best 3 Oil – 13,991 (Crimson) K M Ranch 2H OIL IP: 457; GAS IP: 326 Last Act. Date – 09/2012 (CHK) Traylor North 2H OIL IP: 405; GAS IP: 78 14/64” choke Best 3 Oil – 19,476 (CHK) Winterbotham A 4H OIL IP: 909 13/64” choke Best 3 Oil – 25,344 (CHK) Winterbotham A 1H OIL IP: 1,448 13/64” choke Best 3 Oil – 37,870 (US Enercorp) Rally 1H - CHKFD OIL IP: 416; GAS IP: 175 16/64” choke Best 3 Oil – 52,058 (Goodrich) Burns A 35H OIL IP: 736; GAS IP: 589 49/64” choke Best 3 Oil – 22,111 (CHK) Brownlow 1H OIL IP: 764; GAS IP: 437 30/64” choke Best 3 Oil – 21,853 (Crimson) K M Ranch 1H Plug back 3,076’ Lateral OIL IP: 200; GAS IP: 275 20/64” choke Best 3 Oil – 8,038 (Hughes) LANG 1H - Buda OIL IP: 165; GAS IP: 200 18/64” choke Best 3 Oil – 2,039 (CHK) Bohannam Dim C 1H OIL IP: 466; GAS IP: 174 10/64” choke Best 3 Oil – 18,031 LEGEND AUSTIN CHALK BUDA/DEL RIO Matador Acreage Buda Wells Wells Spudded Since 1/2011 (BBOG) Nickolson 1H OIL IP: 218; GAS IP: 2,167 19/64” choke Best 3 Oil – 9,520 (BBOG) Oppenheimer A1 OIL IP: 273; GAS IP: 1,400 38/64” choke Best 3 Oil – 9,725 (BBOG) Calvert 1H - Buda OIL IP: 170; GAS IP: 1,812 28/64” choke Best 3 Oil – 14,292 (CHK) Rogers B 2H OIL IP: 560; GAS IP: 175 12/64” choke Best 3 Oil – 31,184 (MTDR) ZLS 1H 4,551’ Comp. Lateral Post Frac Clean Up Phase Note: Well data available through public sources and interpretation by Matador Resources Note: All acreage as of November 30, 2012 |
 55 Adjusted EBITDA Reconciliation This presentation includes, and certain statements made during this presentation may include, the non- GAAP financial measure of Adjusted EBITDA. We believe Adjusted EBITDA helps us evaluate our operating performance and compare our results of operation from period to period without regard to our financing methods or capital structure. We define Adjusted EBITDA as earnings before interest expense, income taxes, depletion, depreciation and amortization, accretion of asset retirement obligations, property impairments, unrealized derivative gains and losses, certain other non-cash items and non-cash stock- based compensation expense, including stock option and grant expense and restricted stock and restricted stock units expense, and net gain or loss on asset sales and inventory impairment. Adjusted EBITDA is not a measure of net (loss) income or cash flows as determined by GAAP. Adjusted EBITDA should not be considered an alternative to, or more meaningful than, net income or cash flows from operating activities as determined in accordance with GAAP or as an indicator of our operating performance or liquidity. The following tables present our calculation of Adjusted EBITDA and the reconciliation of Adjusted EBITDA to the GAAP financial measures of net income (loss) and net cash provided by operating activities, respectively, that are of a historical nature. Where references are forward-looking, prospective or estimates in nature, and not based on historical fact, the table does not provide a reconciliation. We could not provide such reconciliations without undue hardship because the Adjusted EBITDA numbers included in this presentation, and that may be included in certain statements made during the presentation, are estimations, approximations and/or ranges. In addition, it would be difficult for us to present a detailed reconciliation on account of many unknown variables for the reconciling items. |
 56 Adjusted EBITDA Reconciliation The following table presents our calculation of Adjusted EBITDA and reconciliation of Adjusted EBITDA to the GAAP financial measures of net (loss) income and cash provided by operating activities, respectively. Year Ended December 31, Nine Months Ended September 30, (In thousands) 2007 2008 2009 2010 2011 2012 Unaudited Adjusted EBITDA reconciliation to Net Income (Loss): Net (loss) income ($300) $103,878 ($14,425) $6,377 ($10,309) ($8,568) Interest expense - - - 3 683 453 Total income tax provision (benefit) - 20,023 (9,925) 3,521 (5,521) (1,152) Depletion, depreciation and amortization 7,889 12,127 10,743 15,596 31,754 52,799 Accretion of asset retirement obligations 70 92 137 155 209 170 Full-cost ceiling impairment - 22,195 25,244 - 35,673 33,206 Unrealized loss (gain) on derivatives 211 (3,592) 2,375 (3,139) (5,138) 1,149 Stock option and grant expense 205 605 622 824 2,362 (585) Restricted stock grants 15 60 34 74 44 362 Net loss (gain) on asset sales and inventory impairment - (136,977) 379 224 154 60 Adjusted EBITDA $8,090 $18,411 $15,184 $23,635 $49,911 $77,894 Year Ended December 31, Nine Months Ended September 30, (In thousands) 2007 2008 2009 2010 2011 2012 Unaudited Adjusted EBITDA reconciliation to Net Cash Provided by Operating Activities: Net cash provided by operating activities $7,881 $25,851 $1,791 $27,273 $61,868 $80,325 Net change in operating assets and liabilities 209 (17,888) 15,717 (2,230) (12,594) (3,072) Interest expense - - - 3 683 453 Current income tax provision (benefit) - 10,448 (2,324) (1,411) (46) 188 Adjusted EBITDA $8,090 $18,411 $15,184 $23,635 $49,911 $77,894 |
 57 Adjusted EBITDA Reconciliation (Cont.) The following table presents our calculation of Adjusted EBITDA and reconciliation of Adjusted EBITDA to the GAAP financial measures of net (loss) income and cash provided by operating activities, respectively. (In thousands) 1Q 2010 2Q 2010 3Q 2010 4Q 2010 1Q 2011 2Q 2011 3Q 2011 4Q 2011 1Q 2012 2Q 2012 3Q 2012 Unaudited Adjusted EBITDA reconciliation to Net Income (Loss): Net income (loss) $ 5,676 $ (984) $ 2,681 $ (996) $ (27,596) $ 7,153 $ 6,194 $ 3,941 $ 3,801 $ (6,676) $ (9,197) Interest expense - - - 3 106 184 171 222 308 1 144 Total income tax provision (benefit) 2,975 (516) 1,584 (522) (6,906) (46) - 1,430 3,064 (3,713) (593) Depletion, depreciation and amortization 3,362 3,702 3,868 4,665 7,111 8,180 7,287 9,175 11,205 19,914 21,680 Accretion of asset retirement obligations 38 30 39 48 39 57 62 51 53 58 59 Full-cost ceiling impairment - - - - 35,673 - - - - 33,205 3,596 Unrealized (gain) loss on derivatives (6,093) 2,822 (2,541) 2,674 1,668 (332) (2,870) (3,604) 3,270 (15,114) 12,993 Stock option and grant expense 180 153 133 357 42 117 1,220 983 (374) 41 (252) Restricted stock grants 6 8 11 49 11 11 14 8 11 150 201 Net (gain)/loss on asset sales and inventory impairment - - - 224 - - - 154 - 60 - Adjusted EBITDA $ 6,142 $ 5,215 $ 5,776 $ 6,502 $ 10,148 $ 15,324 $ 12,078 $ 12,360 $ 21,338 $ 27,926 $ 28,631 (In thousands) 1Q 2010 2Q 2010 3Q 2010 4Q 2010 1Q 2011 2Q 2011 3Q 2011 4Q 2011 1Q 2012 2Q 2012 3Q 2012 Unaudited Adjusted EBITDA reconciliation to Net Cash Provided by Operating Activities: Net cash provided by operating activities $ 7,673 $ 29,040 $ (15,322) $ 5,883 $ 12,732 $ 6,799 $ 14,912 $ 27,425 $ 5,110 $ 46,416 $ 28,799 Net change in operating assets and liabilities (1,531) (23,824) 22,509 616 (2,690) 8,386 (3,004) (15,287) 15,920 (18,491) (500) Interest expense - - - 3 106 184 171 222 308 1 144 Current income tax (benefit) provision - - (1,411) - - (45) (1) - - - 188 Adjusted EBITDA $ 6,142 $ 5,215 $ 5,776 $ 6,502 $ 10,148 $ 15,324 $ 12,078 $ 12,360 $ 21,338 $ 27,926 $ 28,631 |
 58 PV-10 Reconciliation PV-10 is a non-GAAP financial measure and generally differs from Standardized Measure, the most directly comparable GAAP financial measure, because it does not include the effects of income taxes on future net revenues. PV-10 is not an estimate of the fair market value of our properties. Matador and others in the industry use PV-10 as a measure to compare the relative size and value of proved reserves held by companies and of the potential return on investment related to the companies’ properties without regard to the specific tax characteristics of such entities. The PV-10 at September 30, 2012, December 31, 2011 and September 30, 2011 may be reconciled to the Standardized Measure of discounted future net cash flows at such dates by reducing PV-10 by the discounted future income taxes associated with such reserves. The discounted future income taxes at September 30, 2012, December 31, 2011 and September 30, 2011 were, in millions, $29.7, $33.2 and $11.8, respectively. We have not provided a reconciliation of PV-10 to Standardized Measure at December 31, 2012. We could not provide such a reconciliation without undue hardship because we have not completed the audit of our 12/31/12 financial statements. In addition, it would be difficult for us to present a detailed reconciliation on account of many unknown variables for the reconciling items. |