UNITED STATES
SECURITIES AND EXCHANGE COMMISSION
Washington, D.C. 20549
FORM N-CSR
CERTIFIED SHAREHOLDER REPORT OF REGISTERED
MANAGEMENT INVESTMENT COMPANIES
Investment Company Act File Number: 811-22557
| T. Rowe Price Floating Rate Fund, Inc. |
|
| (Exact name of registrant as specified in charter) |
| |
| 100 East Pratt Street, Baltimore, MD 21202 |
|
| (Address of principal executive offices) |
| |
| David Oestreicher |
| 100 East Pratt Street, Baltimore, MD 21202 |
|
| (Name and address of agent for service) |
Registrant’s telephone number, including area code: (410) 345-2000
Date of fiscal year end: May 31
Date of reporting period: May 31, 2013
Item 1. Report to Shareholders
| Floating Rate Fund | May 31, 2013 |
The views and opinions in this report were current as of May 31, 2013. They are not guarantees of performance or investment results and should not be taken as investment advice. Investment decisions reflect a variety of factors, and the managers reserve the right to change their views about individual stocks, sectors, and the markets at any time. As a result, the views expressed should not be relied upon as a forecast of the fund’s future investment intent. The report is certified under the Sarbanes-Oxley Act, which requires mutual funds and other public companies to affirm that, to the best of their knowledge, the information in their financial reports is fairly and accurately stated in all material respects.
UPCOMING SHAREHOLDER MEETING
The T. Rowe Price Funds will be holding a shareholder meeting on October 22, 2013. Shareholders will be asked to elect directors and consider changes to certain fundamental policies to permit the funds greater flexibility in managing their investment strategies.
REPORTS ON THE WEB
Sign up for our E-mail Program, and you can begin to receive updated fund reports and prospectuses online rather than through the mail. Log in to your account at troweprice.com for more information.
Manager’s Letter
Fellow Shareholders
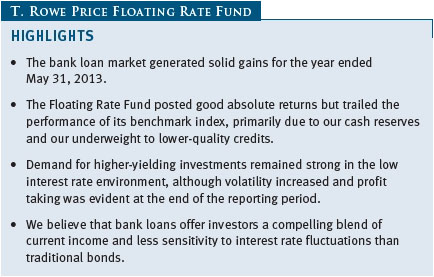
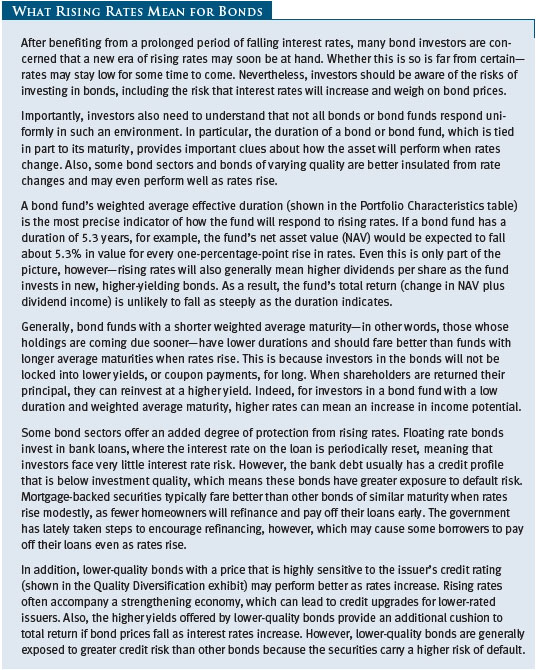
Floating rate loans continued their multiyear run of strong performance in the 12 months ended May 31, 2013. The overall environment for bank debt remained favorable due to low default expectations, abundant liquidity, improving corporate balance sheets, and solid investor demand for higher-yielding investments. Loan prices moved higher and yields trended lower for much of our fiscal year as the environment for companies that issue bank debt continued to improve. However, volatility crept into the market in the last few weeks of our reporting period as a combination of improving economic signals and rhetoric from the Fed chairman led investors to worry about the removal of quantitative easing policies. (See sidebar, “What Rising Rates Mean for Bonds” on page 2.) Floating rate loans are uniquely positioned relative to most other fixed income products given their combination of solid yield, senior status in the capital structure, and short-duration characteristics.
PORTFOLIO PERFORMANCE

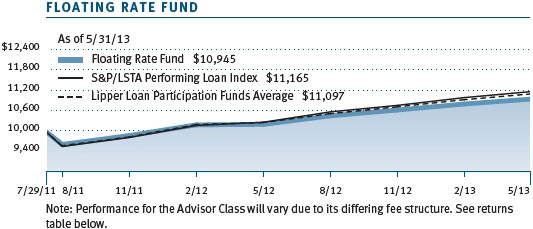
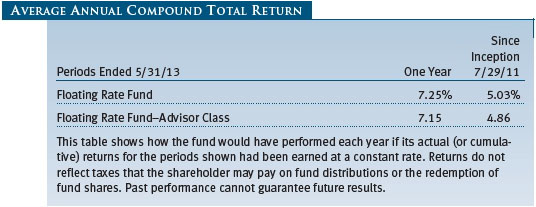
The Floating Rate Fund generated strong and stable absolute returns but underperformed the S&P/LSTA Performing Loan Index for the 6- and 12-month periods ended May 31, 2013. The fund is focused on bank loans and corporate bonds in the higher-quality tiers of the below investment-grade universe. We primarily invest in BB and B rated loans as these have historically outperformed CCC rated loans with less volatility. However, this positioning detracted from our comparison with the benchmark as lower-quality assets outperformed. Results for the fund’s Advisor Class shares varied slightly, reflecting their different fee structure, asset flows, and other factors.
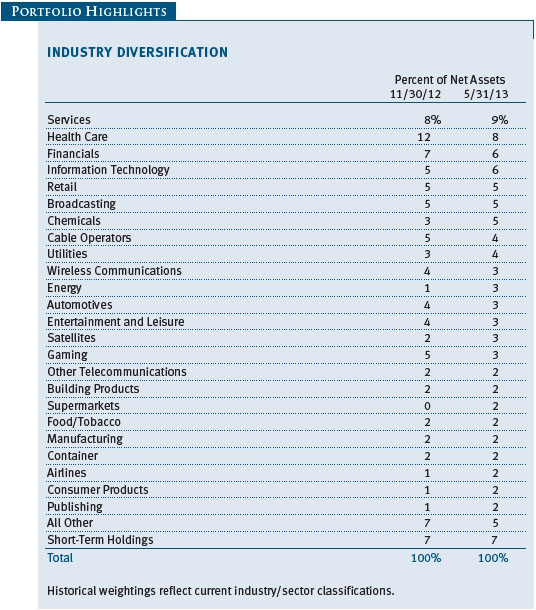
Throughout the reporting period, the portfolio’s positioning remained more conservative than the benchmark index. The fund maintained its high allocation to traditional loan structures with solid covenants and first priority on assets. Conversely, we typically avoid smaller, less-liquid loans. The riskier segments outperformed during the past year—in particular, a few distressed industries and credits rallied. For example, we are significantly underweight in the utilities and publishing industries, and not owning several of the struggling companies in those segments hurt our relative returns. Our allocation to short-term holdings also hurt our comparison with the benchmark index. We maintain a reserves position in order to make opportunistic purchases, for day-to-day operations, and to meet redemptions.
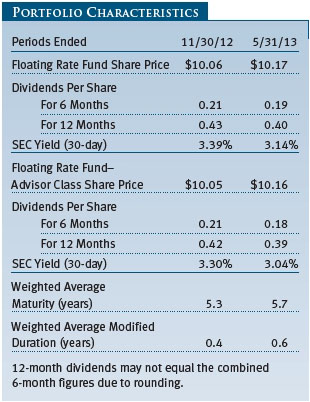
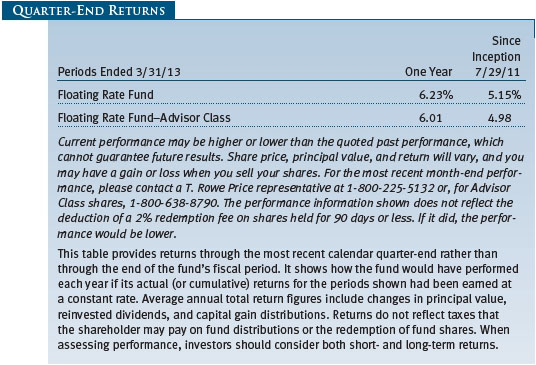
For the year, the fund’s share price gained $0.30, which, when coupled with $0.40 of dividend income, provided a solid 7.25% total return. At the end of the reporting period, the fund’s 3.14% 30-day SEC yield was slightly lower than the 3.39% yield six months ago. Capital appreciation was a significant component in the portfolio’s return, and we attempt to exploit market volatility to generate gains. However, at this time, many of the loans that we find attractive are trading close to par value. In the near term, we believe there will be fewer opportunities to generate capital appreciation.

MARKET ENVIRONMENT
The loan market benefited from steady investor demand, positive sentiment, and a decline in default expectations. Investors gravitated toward the asset class to capture higher yields. At this time, loan yields are comparable to those offered by top-tier (BB rated) high yield bonds. Loans, however, provide more defensive characteristics than high yield bonds as they reside at the top of the capital structure, are typically secured by collateral, and provide more stringent covenants to protect investors.
The capital market conditions for corporations in the loan market remain excellent, and the volume of bank debt issuance is setting records. In the first five months of 2013, $361 billion of new loans were priced; year-to-date issuance has almost surpassed the prior annual record of $388 billion in 2007. Approximately 80% of this year’s deals were for refinancing—to extend maturity profiles and reduce interest levels—bolstering balance sheets and liquidity. However, there has been an absence of new paper, creating a technical supply/demand imbalance, and it has allowed the underwriters to relax the terms on loan structures, leaving lenders with less protection than we like to see. The number of these covenant-lite transactions in 2013 has increased to levels that cause us some concern.
Another significant source of demand for floating rate loans in the past 12 months was collateralized loan obligation (CLO) formations. These are pools of loans created for certain investors that increase the supply of potential lenders and lower the interest costs for borrowers. Resurging CLO issuance, after a period of relatively little activity following the subprime mortgage crisis, further fueled the market rally. Thus far this year, flows into the loan asset class totaled $26 billion, more than double the $12 billion of inflows for all of 2012. In early May, many loans traded at par value or modestly higher, an atypical phenomenon and another indication of the strong demand for loans.
Overall, the environment for loan investing remains positive. The corporate fundamentals underpinning the asset class are sound—companies have abundant liquidity, much of the near-term maturity wall has been addressed, and the capital markets have sustained activity and remain receptive to new deals. Additionally, earnings and cash flow generation appear supportive, and the default rate is low and expected to remain below average into 2014. Fixed income investors have become increasingly concerned about the potential for rising interest rates and the deleterious effects it could have on traditional bond portfolios. This has bolstered the demand for leveraged loans given their floating rate feature.
PORTFOLIO REVIEW
Our results versus the benchmark in the period can be summarized as follows: We focused on high- versus lower-quality holdings; we were underweight in the most speculative sectors and credits; and we held cash for daily operations and to meet potential redemptions. Each of these factors hampered relative results. From an industry perspective, credit selection was strongest in wireless communications, chemicals, retail, and health care, while utilities and broadcasting were weakest. Short-term holdings were 7.2% of assets at the end of the period, but in a strongly rising market, holding reserves crimped relative performance.
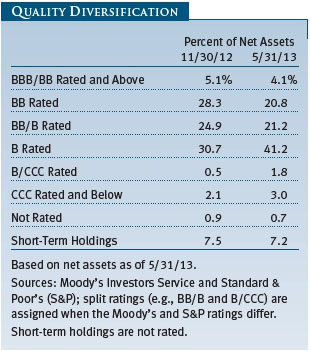
Most of our companies are performing well, and we have maintained a conservative investment approach. At the end of the reporting period, more than 96% of the portfolio was invested in securities rated split B or higher (including short-term holdings). Compared with our benchmark, we remain overweight in higher-quality credits and have been nearly 500 basis points (5.00%) underweight in CCC and not-rated securities for the past six months. During the six-month period, we trimmed our allocation to BB rated holdings and increased our weight in loans with a B rating. Both of these higher-quality segments trailed the performance of lower rated loans. However, credit selection in our holdings rated B and higher generated a strong relative performance contribution.
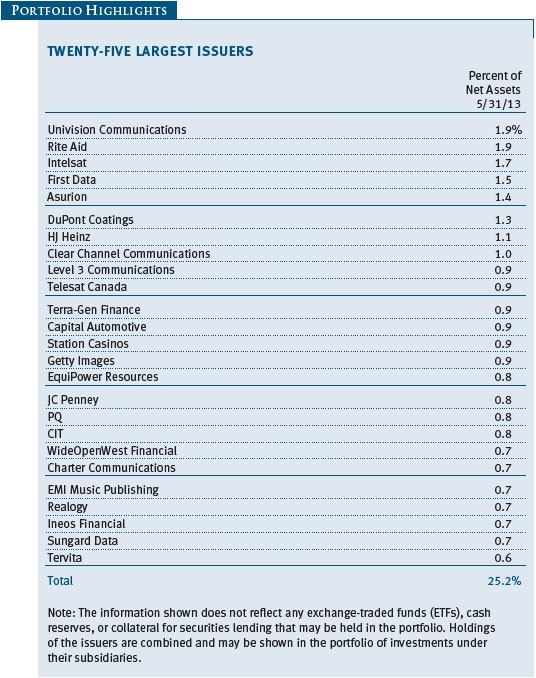
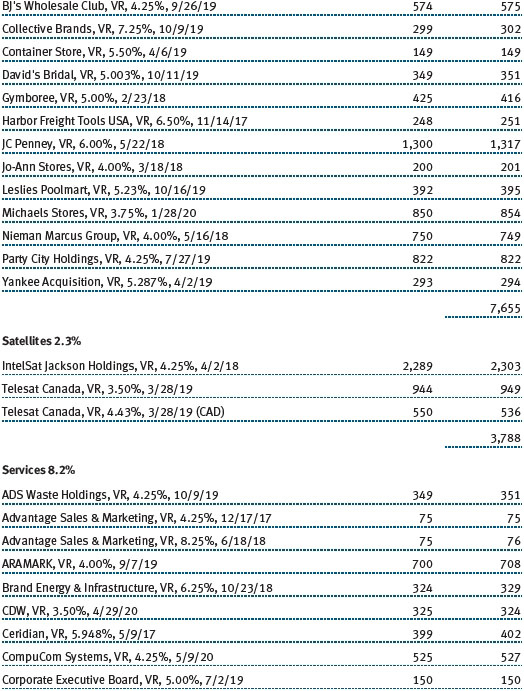
From an individual issuer standpoint, our largest holdings, which are shown in the Twenty-Five Largest Issuers table on page 13, were generally our best performance contributors. In fact, our 20 top-performing issuers added 210 basis points, while our 20 poorest performers detracted just three basis points. What’s more, each of our 20 best-performing issuers more than offset all of the losses from the 20 largest detractors combined.
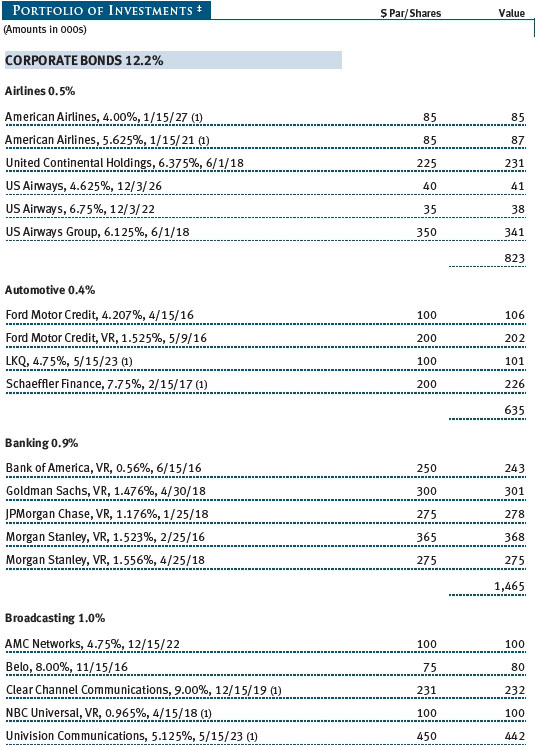
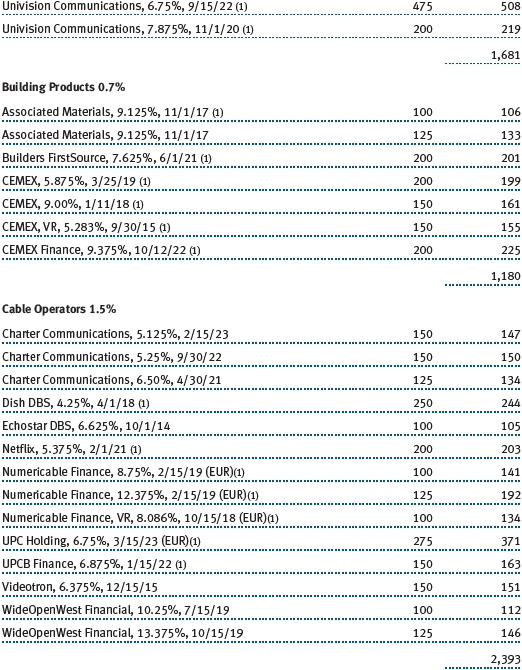
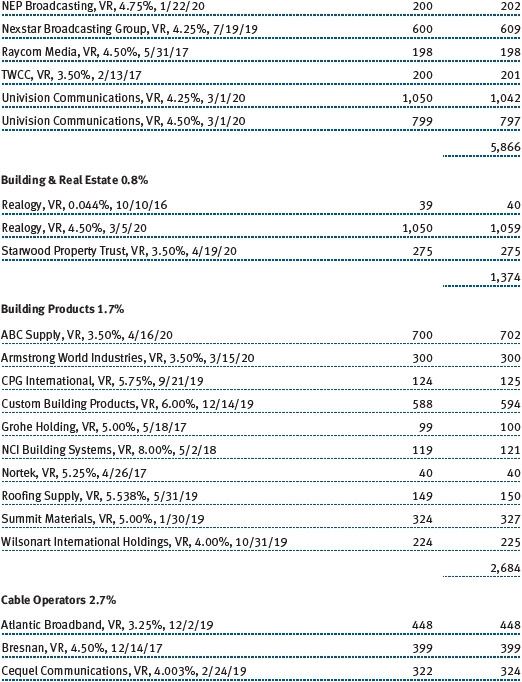
The top contributor and the fund’s largest holding at the end of the period was Univision Communications. The Spanish-language broadcasting company has a premier collection of TV and radio stations in several markets, including Miami, Los Angeles, and New York City. It was involved in an aggressive leveraged buyout (LBO) a few years ago, and a lot of debt remains. We think Univision has world-class assets and a deep and talented management team. The company has generated solid revenue, earnings, and cash flow, and it has done a formidable amount of loan refinancing, helping to lower its interest payments and improve balance sheet strength. Longer term, we believe that Univision could be an initial public offering candidate or sold to an investment-grade content company. In the near term, we have conviction in its earnings prospects. (Please refer to the fund’s portfolio of investments for a complete list of holdings and the amount that each represents in the fund.)
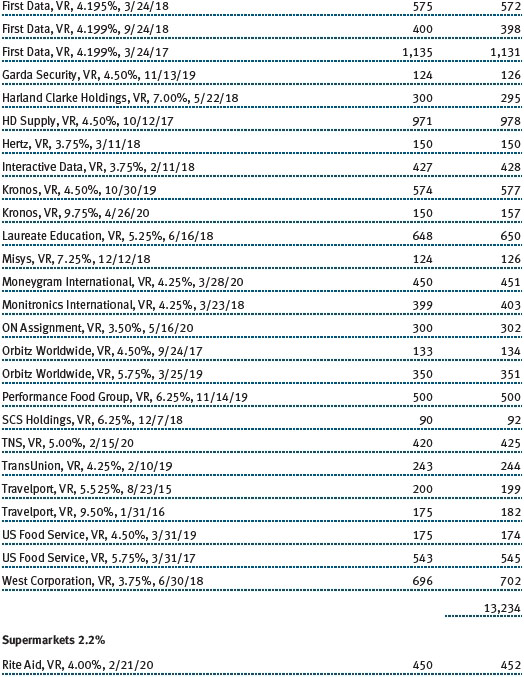
Another top contributor and one of our largest recent additions was CCC rated Rite Aid. It is our biggest allocation in the supermarket industry and among our largest holdings at 1.9% of the portfolio. The company has positive momentum as profit margins are benefiting from vastly improved generic drug sales, and store traffic increased after the company invested heavily in store refreshes and redesigns. Rite Aid’s management is working to deleverage its balance sheet, and we see significant additional opportunity for coupon refinancing, which should lower interest expenses and increase free cash flow. We think that Rite Aid is taking the right steps and that, in the next few years, it could have strategic value to a larger company in a takeover. As the company’s turnaround unfolded, we saw value in its first- and second-lien loans and made substantial additions to our existing position in early 2013.
Over the past year, we had few absolute performance detractors. However, from a relative performance standpoint, credits that we did not own hurt our comparison with the benchmark the most. The utilities industry was the largest relative performance detractor almost entirely due to our zero allocation to Texas Competitive Electric (also known as TXU). We eliminated the position more than a year ago based on its low credit quality, volatility, and the high probability of a restructuring (given its capital structure, level of earnings, and leverage). The company accounts for about 2.75% of the loan market and approximately one-half of the utilities segment. These distressed loans rallied during the period but still trade at less than three-quarters (74%) of par value. Because it is such a material position in the benchmark, avoiding it detracted from our relative results. We are constantly reviewing the prospects for TXU, working to identify the perceived recovery value. At this point, we are sticking with our decision and do not own the loans given the unfavorable risk/reward trade-off.
The other significant relative performance detractor for the past 12 months was Clear Channel Communications. It was our fourth-best absolute contributor and is among our 10 largest holdings, but we have remained underweight versus the benchmark, which hurt relative performance. The broadcasting company was a 2007 LBO and is heavily leveraged. Our positioning is predicated on concerns regarding its ability to refinance the outstanding loans and the possibility of having to file for bankruptcy. At the beginning of the period, the loans were trading at 85% of par value and the business seemed to be struggling. Although we held approximately a 100-basis-point position, meaningful from an absolute perspective, the index allocation is 140 basis points. The loans have rallied, and the company recently completed a refinancing transaction that extends roughly two-thirds of its loans to 2019, affording the company more time to grow into the current capital structure.
One of our largest sales during the period was the elimination of our position in Harrah’s. It has been a substantial holding for the fund. While the loan structure was attractive—a 9.5% fixed coupon maturing in 2016—we previously thought the loans would be called in October 2013. However, given the recent company-specific and capital markets transactions, we no longer believe this to be the case. We think that Harrah’s is overleveraged, its fundamentals have deteriorated, and the casino operator isn’t able to allocate the money needed to refresh its properties because its interest payments are so large. More recently, the company started additional corporate finance transactions to separate the good assets from the bad—it looks like management is positioning itself for a bankruptcy filing. Because assets that were backing our loans were being removed, we decided to eliminate our entire position. Since that trade, the loan prices have trended lower. In future periods, we think that not owning Harrah’s will be a positive relative performance contributor as it currently represents 78 basis points in the benchmark.
On the flip side, HJ Heinz was one of our largest purchases and one of the biggest loan deals since 2007. The loan is backed by equity sponsors including 3G Capital and Berkshire Hathaway. Although the loans have a modest yield, the paper is extremely high quality and should add stability to the portfolio’s performance. We participated heavily in the issue (adding a 1.1% allocation to the portfolio) as it fits in well with our high-quality philosophy. While it is unlikely to be our best-performing loan for the next 12 months, on a risk-adjusted basis we believe it is solid investment.
OUTLOOK
We are encouraged by the fundamental and technical strength underpinning the bank debt market, and we believe that BB and B rated loans represent compelling value versus the other fixed income alternatives. Additionally, because fixed income investors are increasingly focused on the potential for rising interest rates, there should be steady demand for floating rate investments. Potential for a seasonal slowdown coupled with volatility could lead to a correction, but we remain positive on the prospects for the asset class.
Excluding TXU, we see little reason for default rates in the loan market to rise above 2% in the next 18 months, which is well below the 3.5% long-term average. The companies in the asset class continue to improve, as evidenced in the deleveraging of corporate balance sheets and cash flow generation. New issue supply is setting record volumes, and the market is backed by solid investor demand for higher-yielding products. The bank loan asset class has become increasingly attractive for yield-starved investors who want to own a low-duration asset. Although the companies in our market have continued to perform well and remain fundamentally sound, we caution investors not to expect the portfolio’s returns in the coming year to be as strong as the results we have enjoyed in the past.
We view floating rate loans as an excellent asset class for diversification, as well as an indirect hedge against inflation in a rising interest rate environment. Although our conservative philosophy and our focus on higher-quality holdings led to underperformance versus the benchmark in this reporting period, we do not intend to alter our core investment philosophy. T. Rowe Price has invested substantial resources in our credit research efforts, and we are privileged to work with a talented team of professionals around the world to uncover opportunities for our shareholders.
Respectfully submitted,

Paul M. Massaro
Chairman of the fund’s Investment Advisory Committee
June 17, 2013
The committee chairman has day-to-day responsibility for managing the portfolio and works with committee members in developing and executing the fund’s investment program.
RISKS OF INVESTING IN FLOATING RATE LOAN FUNDS
Floating rate loans are subject to credit risk, the chance that any fund holding could have its credit rating downgraded or that a issuer will default (fail to make timely payments of interest or principal), and liquidity risk, the chance that the fund may not be able to sell loans or securities at desired prices, potentially reducing the fund’s income level and share price. Like bond funds, this fund is exposed to interest rate risk, but credit and liquidity risks may often be more important.
The loans in which the fund invests are often referred to as “leveraged loans” because the borrowing companies have significantly more debt than equity. In many cases, leveraged loans are issued in connection with recapitalizations, acquisitions, leveraged buyouts, and refinancings. Companies issuing leveraged loans typically have a below investment-grade credit rating or may not be rated by a major credit rating agency. Leveraged loan funds could have greater price declines than funds that invest primarily in high-quality bonds, so the securities are usually considered speculative investments.
GLOSSARY
Basis point: One one-hundredth of a percentage point, or 0.01%.
Duration: A measure of a bond fund’s sensitivity to changes in interest rates. For example, a fund with a one-year duration would fall about 1% in response to a one-percentage-point rise in interest rates, and vice versa.
Libor floor: The floor is the minimum interest rate payable on a floating rate loan. Many loans are issued at Libor plus a floor rate.
Lipper averages: The averages of available mutual fund performance returns for specified time periods in categories defined by Lipper Inc.
London Interbank Offered Rate (Libor): The interest rate at which banks loan money to each other in London wholesale market, which is also known as the interbank market.
SEC yield (30-day): A method of calculating a fund’s yield that assumes all portfolio securities are held until maturity. Yield will vary and is not guaranteed.
S&P/LSTA Performing Loan Index: A benchmark that tracks the performance of the leveraged loan market.
Weighted average maturity: A measure of a fund’s interest rate sensitivity—in general, the longer the average maturity, the greater the fund’s sensitivity to interest rate changes. The weighted average maturity may take into account the interest rate readjustment dates for certain securities.
Performance and Expenses
This chart shows the value of a hypothetical $10,000 investment in the fund over the past 10 fiscal year periods or since inception (for funds lacking 10-year records). The result is compared with benchmarks, which may include a broad-based market index and a peer group average or index. Market indexes do not include expenses, which are deducted from fund returns as well as mutual fund averages and indexes.
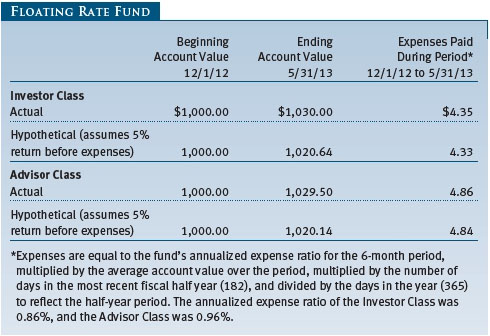
As a mutual fund shareholder, you may incur two types of costs: (1) transaction costs, such as redemption fees or sales loads, and (2) ongoing costs, including management fees, distribution and service (12b-1) fees, and other fund expenses. The following example is intended to help you understand your ongoing costs (in dollars) of investing in the fund and to compare these costs with the ongoing costs of investing in other mutual funds. The example is based on an investment of $1,000 invested at the beginning of the most recent six-month period and held for the entire period.
Actual Expenses
The first line of the following table (Actual) provides information about actual account values and expenses based on the fund’s actual returns. You may use the information on this line, together with your account balance, to estimate the expenses that you paid over the period. Simply divide your account value by $1,000 (for example, an $8,600 account value divided by $1,000 = 8.6), then multiply the result by the number on the first line under the heading “Expenses Paid During Period” to estimate the expenses you paid on your account during this period.
Hypothetical Example for Comparison Purposes
The information on the second line of the table (Hypothetical) is based on hypothetical account values and expenses derived from the fund’s actual expense ratio and an assumed 5% per year rate of return before expenses (not the fund’s actual return). You may compare the ongoing costs of investing in the fund with other funds by contrasting this 5% hypothetical example and the 5% hypothetical examples that appear in the shareholder reports of the other funds. The hypothetical account values and expenses may not be used to estimate the actual ending account balance or expenses you paid for the period.
Note: T. Rowe Price charges an annual account service fee of $20, generally for accounts with less than $10,000. The fee is waived for any investor whose T. Rowe Price mutual fund accounts total $50,000 or more; accounts electing to receive electronic delivery of account statements, transaction confirmations, prospectuses, and shareholder reports; or accounts of an investor who is a T. Rowe Price Preferred Services, Personal Services, or Enhanced Personal Services client (enrollment in these programs generally requires T. Rowe Price assets of at least $100,000). This fee is not included in the accompanying table. If you are subject to the fee, keep it in mind when you are estimating the ongoing expenses of investing in the fund and when comparing the expenses of this fund with other funds.
You should also be aware that the expenses shown in the table highlight only your ongoing costs and do not reflect any transaction costs, such as redemption fees or sales loads. Therefore, the second line of the table is useful in comparing ongoing costs only and will not help you determine the relative total costs of owning different funds. To the extent a fund charges transaction costs, however, the total cost of owning that fund is higher.
The accompanying notes are an integral part of these financial statements.
The accompanying notes are an integral part of these financial statements.


The accompanying notes are an integral part of these financial statements.
The accompanying notes are an integral part of these financial statements.
The accompanying notes are an integral part of these financial statements.
The accompanying notes are an integral part of these financial statements.
| Notes to Financial Statements |
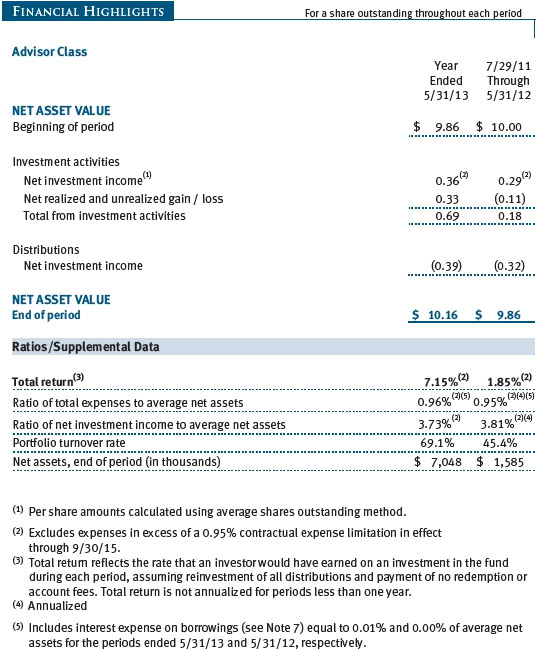
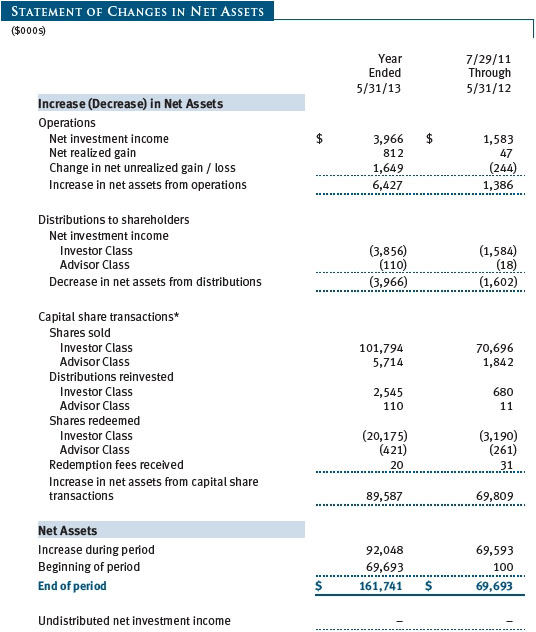
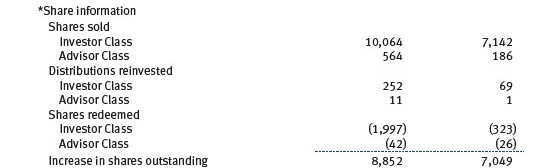
T. Rowe Price Floating Rate Fund (the fund), is registered under the Investment Company Act of 1940 (the 1940 Act) as a diversified, open-end management investment company. The fund seeks high current income and, secondarily, capital appreciation. The fund has two classes of shares: the Floating Rate Fund original share class, referred to in this report as the Investor Class, offered since July 29, 2011, and the Floating Rate Fund–Advisor Class (Advisor Class), offered since July 29, 2011. Advisor Class shares are sold only through unaffiliated brokers and other unaffiliated financial intermediaries that are compensated by the class for distribution, shareholder servicing, and/or certain administrative services under a Board-approved Rule 12b-1 plan. Each class has exclusive voting rights on matters related solely to that class; separate voting rights on matters that relate to both classes; and, in all other respects, the same rights and obligations as the other class.
NOTE 1 - SIGNIFICANT ACCOUNTING POLICIES
Basis of Preparation The accompanying financial statements were prepared in accordance with accounting principles generally accepted in the United States of America (GAAP), which require the use of estimates made by management. Management believes that estimates and valuations are appropriate; however, actual results may differ from those estimates, and the valuations reflected in the accompanying financial statements may differ from the value ultimately realized upon sale or maturity.
Investment Transactions, Investment Income, and Distributions Income and expenses are recorded on the accrual basis. Premiums and discounts on debt securities are amortized for financial reporting purposes. Paydown gains and losses are recorded as an adjustment to interest income. Dividends received from mutual fund investments are reflected as dividend income; capital gain distributions are reflected as realized gain/loss. Dividend income and capital gain distributions are recorded on the ex-dividend date. Income tax-related interest and penalties, if incurred, would be recorded as income tax expense. Investment transactions are accounted for on the trade date. Realized gains and losses are reported on the identified cost basis. Distributions to shareholders are recorded on the ex-dividend date. Income distributions are declared by each class daily and paid monthly. Capital gain distributions, if any, are generally declared and paid by the fund annually.
Currency Translation Assets, including investments, and liabilities denominated in foreign currencies are translated into U.S. dollar values each day at the prevailing exchange rate, using the mean of the bid and asked prices of such currencies against U.S. dollars as quoted by a major bank. Purchases and sales of securities, income, and expenses are translated into U.S. dollars at the prevailing exchange rate on the date of the transaction. The effect of changes in foreign currency exchange rates on realized and unrealized security gains and losses is reflected as a component of security gains and losses.
Class Accounting The Advisor Class pays distribution, shareholder servicing, and/or certain administrative expenses in the form of Rule 12b-1 fees, in an amount not exceeding 0.25% of the class’s average daily net assets. Shareholder servicing, prospectus, and shareholder report expenses incurred by each class are charged directly to the class to which they relate. Expenses common to both classes and investment income are allocated to the classes based upon the relative daily net assets of each class’s settled shares; realized and unrealized gains and losses are allocated based upon the relative daily net assets of each class’s outstanding shares.
Credits The fund earns credits on temporarily uninvested cash balances held at the custodian, which reduce the fund’s custody charges. Custody expense in the accompanying financial statements is presented before reduction for credits, which are reflected as expenses paid indirectly.
Redemption Fees A 2% fee is assessed on redemptions of fund shares held for 90 days or less to deter short-term trading and to protect the interests of long-term shareholders. Redemption fees are withheld from proceeds that shareholders receive from the sale or exchange of fund shares. The fees are paid to the fund and are recorded as an increase to paid-in capital. The fees may cause the redemption price per share to differ from the net asset value per share.
New Accounting Guidance In December 2011, the Financial Accounting Standards Board issued amended guidance requiring an entity to disclose information about offsetting and related arrangements to enable users of its financial statements to understand the effect of those arrangements on its financial position. The guidance is effective for fiscal years and interim periods beginning on or after January 1, 2013. Adoption will have no effect on the fund’s net assets or results of operations.
NOTE 2 - VALUATION
The fund’s financial instruments are valued and each class’s net asset value (NAV) per share is computed at the close of the New York Stock Exchange (NYSE), normally 4 p.m. ET, each day the NYSE is open for business.
Fair Value The fund’s financial instruments are reported at fair value, which GAAP defines as the price that would be received to sell an asset or paid to transfer a liability in an orderly transaction between market participants at the measurement date. The T. Rowe Price Valuation Committee (the Valuation Committee) has been established by the fund’s Board of Directors (the Board) to ensure that financial instruments are appropriately priced at fair value in accordance with GAAP and the 1940 Act. Subject to oversight by the Board, the Valuation Committee develops and oversees pricing-related policies and procedures and approves all fair value determinations. Specifically, the Valuation Committee establishes procedures to value securities; determines pricing techniques, sources, and persons eligible to effect fair value pricing actions; oversees the selection, services, and performance of pricing vendors; oversees valuation-related business continuity practices; and provides guidance on internal controls and valuation-related matters. The Valuation Committee reports to the fund’s Board; is chaired by the fund’s treasurer; and has representation from legal, portfolio management and trading, operations, and risk management.
Various valuation techniques and inputs are used to determine the fair value of financial instruments. GAAP establishes the following fair value hierarchy that categorizes the inputs used to measure fair value:
Level 1 – quoted prices (unadjusted) in active markets for identical financial instruments that the fund can access at the reporting date
Level 2 – inputs other than Level 1 quoted prices that are observable, either directly or indirectly (including, but not limited to, quoted prices for similar financial instruments in active markets, quoted prices for identical or similar financial instruments in inactive markets, interest rates and yield curves, implied volatilities, and credit spreads)
Level 3 – unobservable inputs
Observable inputs are developed using market data, such as publicly available information about actual events or transactions, and reflect the assumptions that market participants would use to price the financial instrument.
Unobservable inputs are those for which market data are not available and are developed using the best information available about the assumptions that market participants would use to price the financial instrument. GAAP requires valuation techniques to maximize the use of relevant observable inputs and minimize the use of unobservable inputs. When multiple inputs are used to derive fair value, the financial instrument is assigned to the level within the fair value hierarchy based on the lowest-level input that is significant to the fair value of the financial instrument. Input levels are not necessarily an indication of the risk or liquidity associated with financial instruments at that level but rather the degree of judgment used in determining those values.
Valuation Techniques Debt securities generally are traded in the over-the-counter (OTC) market. Securities with remaining maturities of one year or more at the time of acquisition are valued at prices furnished by dealers who make markets in such securities or by an independent pricing service, which considers the yield or price of bonds of comparable quality, coupon, maturity, and type, as well as prices quoted by dealers who make markets in such securities. Securities with remaining maturities of less than one year at the time of acquisition generally use amortized cost in local currency to approximate fair value. However, if amortized cost is deemed not to reflect fair value or the fund holds a significant amount of such securities with remaining maturities of more than 60 days, the securities are valued at prices furnished by dealers who make markets in such securities or by an independent pricing service. Generally, debt securities are categorized in Level 2 of the fair value hierarchy; however, to the extent the valuations include significant unobservable inputs, the securities would be categorized in Level 3.
Investments in mutual funds are valued at the mutual fund’s closing net asset value per share on the day of valuation and are categorized in Level 1 of the fair value hierarchy. Forward currency exchange contracts are valued using the prevailing forward exchange rate and are categorized in Level 2 of the fair value hierarchy. Assets and liabilities other than financial instruments, including short-term receivables and payables, are carried at cost, or estimated realizable value, if less, which approximates fair value.
Thinly traded financial instruments and those for which the above valuation procedures are inappropriate or are deemed not to reflect fair value are stated at fair value as determined in good faith by the Valuation Committee. The objective of any fair value pricing determination is to arrive at a price that could reasonably be expected from a current sale. Financial instruments fair valued by the Valuation Committee are primarily private placements, restricted securities, warrants, rights, and other securities that are not publicly traded.
Subject to oversight by the Board, the Valuation Committee regularly makes good faith judgments to establish and adjust the fair valuations of certain securities as events occur and circumstances warrant. For instance, in determining the fair value of troubled or thinly traded debt instruments, the Valuation Committee considers a variety of factors, which may include, but are not limited to, the issuer’s business prospects, its financial standing and performance, recent investment transactions in the issuer, strategic events affecting the company, market liquidity for the issuer, and general economic conditions and events. In consultation with the investment and pricing teams, the Valuation Committee will determine an appropriate valuation technique based on available information, which may include both observable and unobservable inputs. The Valuation Committee typically will afford greatest weight to actual prices in arm’s length transactions, to the extent they represent orderly transactions between market participants; transaction information can be reliably obtained; and prices are deemed representative of fair value. However, the Valuation Committee may also consider other valuation methods such as a discount or premium from market value of a similar, freely traded security of the same issuer; discounted cash flows; yield to maturity; or some combination. Fair value determinations are reviewed on a regular basis and updated as information becomes available, including actual purchase and sale transactions of the issue. Because any fair value determination involves a significant amount of judgment, there is a degree of subjectivity inherent in such pricing decisions and fair value prices determined by the Valuation Committee could differ from those of other market participants. Depending on the relative significance of unobservable inputs, including the valuation technique(s) used, fair valued securities may be categorized in Level 2 or 3 of the fair value hierarchy.
Valuation Inputs The following table summarizes the fund’s financial instruments, based on the inputs used to determine their fair values on May 31, 2013:
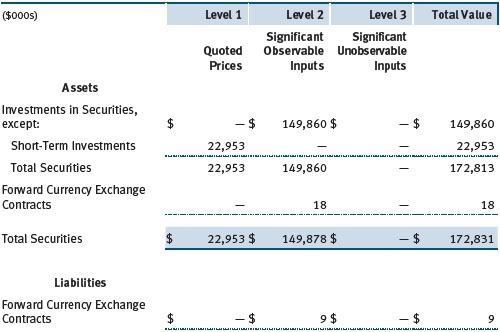
There were no material transfers between Levels 1 and 2 during the period.
NOTE 3 - DERIVATIVE INSTRUMENTS
During the year ended May 31, 2013, the fund invested in derivative instruments. As defined by GAAP, a derivative is a financial instrument whose value is derived from an underlying security price, foreign exchange rate, interest rate, index of prices or rates, or other variable; it requires little or no initial investment and permits or requires net settlement. The fund invests in derivatives only if the expected risks and rewards are consistent with its investment objectives, policies, and overall risk profile, as described in its prospectus and Statement of Additional Information. The fund may use derivatives for a variety of purposes, such as seeking to hedge against declines in principal value, increase yield, invest in an asset with greater efficiency and at a lower cost than is possible through direct investment, or to adjust portfolio duration and credit exposure. The risks associated with the use of derivatives are different from, and potentially much greater than, the risks associated with investing directly in the instruments on which the derivatives are based. Investments in derivatives can magnify returns positively or negatively; however, the fund at all times maintains sufficient cash reserves, liquid assets, or other SEC-permitted asset types to cover the settlement obligations under its open derivative contracts.
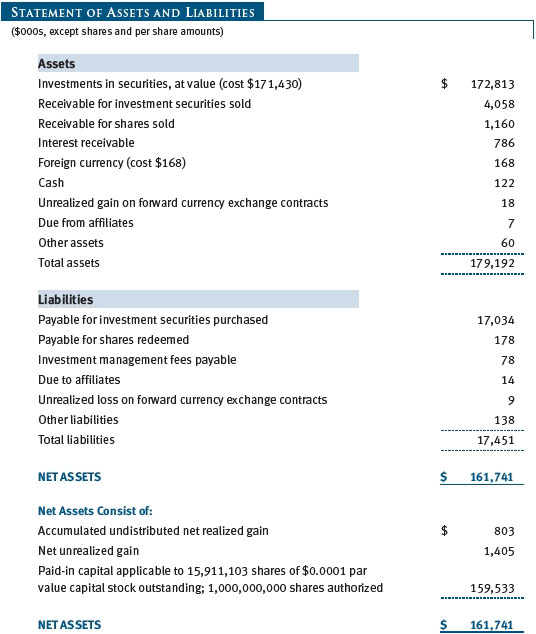
The fund values its derivatives at fair value, as described below and in Note 2, and recognizes changes in fair value currently in its results of operations. Accordingly, the fund does not follow hedge accounting, even for derivatives employed as economic hedges. The fund does not offset the fair value of derivative instruments against the right to reclaim or obligation to return collateral. As of May 31, 2013, the fund held foreign exchange derivatives with a fair value of $18,000, included in Unrealized gain on forward currency exchange contracts, and $9,000, included in Unrealized loss on forward currency exchange contracts, on the accompanying Statement of Assets and Liabilities.
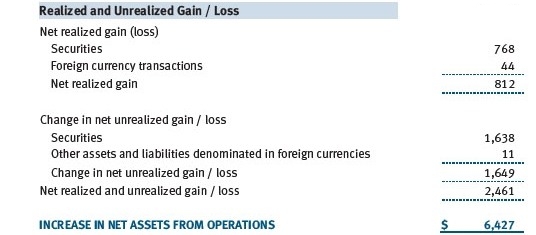
Additionally, during the year ended May 31, 2013, the fund recognized $28,000 of realized gain on Foreign Currency Transactions and a $9,000 change in unrealized gain on Foreign Currency Transactions related to its investments in foreign exchange derivatives; such amounts are included on the accompanying Statement of Operations.
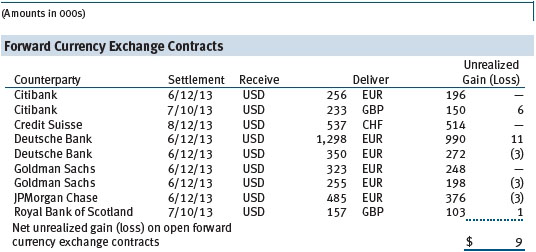
Forward Currency Exchange Contracts The fund is subject to foreign currency exchange rate risk in the normal course of pursuing its investment objectives. It uses forward currency exchange contracts (forwards) primarily to protect its non-U.S. dollar-denominated securities from adverse currency movements relative to the U.S. dollar. A forward involves an obligation to purchase or sell a fixed amount of a specific currency on a future date at a price set at the time of the contract. Although certain forwards may be settled by exchanging only the net gain or loss on the contract, most forwards are settled with the exchange of the underlying currencies in accordance with the specified terms. Forwards are valued at the unrealized gain or loss on the contract, which reflects the net amount the fund either is entitled to receive or obligated to deliver, as measured by the difference between the forward exchange rates at the date of entry into the contract and the forward rates at the reporting date. Appreciated forwards are reflected as assets, and depreciated forwards are reflected as liabilities on the accompanying Statement of Assets and Liabilities. Risks related to the use of forwards include the possible failure of counterparties to meet the terms of the agreements; that anticipated currency movements will not occur, thereby reducing the fund’s total return; and the potential for losses in excess of the fund’s initial investment. During the year ended May 31, 2013, the fund’s exposure to forwards, based on underlying notional amounts, was generally between 0% and 3% of net assets.
NOTE 4 - OTHER INVESTMENT TRANSACTIONS
Consistent with its investment objective, the fund engages in the following practices to manage exposure to certain risks and/or to enhance performance. The investment objective, policies, program, and risk factors of the fund are described more fully in the fund’s prospectus and Statement of Additional Information.
Noninvestment-Grade Debt Securities At May 31, 2013, approximately 91% of the fund’s net assets were invested, either directly or through its investment in T. Rowe Price institutional funds, in noninvestment-grade debt securities, commonly referred to as “high yield” or “junk” bonds. The noninvestment-grade bond market may experience sudden and sharp price swings due to a variety of factors, including changes in economic forecasts, stock market activity, large sustained sales by major investors, a high-profile default, or a change in market psychology. These events may decrease the ability of issuers to make principal and interest payments and adversely affect the liquidity or value, or both, of such securities.
Restricted Securities The fund may invest in securities that are subject to legal or contractual restrictions on resale. Prompt sale of such securities at an acceptable price may be difficult and may involve substantial delays and additional costs.
Bank Loans The fund may invest in bank loans, which represent an interest in amounts owed by a borrower to a syndication of lenders. Bank loans may involve multiple loans with the same borrower under a single credit agreement (each loan, a tranche), and each tranche may have different terms and associated risks. A bank or other financial institution typically acts as the agent and administers a bank loan in accordance with the associated credit agreement. Bank loans are generally noninvestment grade and often involve borrowers whose financial condition is troubled or uncertain and companies that are highly leveraged. The fund may buy and sell bank loans in the form of either loan assignments or loan participations. A loan assignment transfers all legal, beneficial, and economic rights to the buyer. Although loan assignments continue to be administered by the agent, the buyer acquires direct rights against the borrower. In many cases, a loan assignment requires the consent of both the borrower and the agent. In contrast, a loan participation generally entitles the buyer to receive the cash flows from principal, interest, and any fee payments that the seller is entitled to receive from the borrower; however, the seller continues to hold legal title to the loan. As a result, with loan participations, the buyer generally has no right to enforce compliance with the terms of the credit agreement against the borrower, and the buyer is subject to the credit risk of both the borrower and the seller. Bank loans often have extended settlement periods, during which the fund is subject to nonperformance risk by the counterparty. A portion of the fund’s bank loans may require additional principal to be funded at the borrowers’ discretion at a later date (unfunded commitments), and bank loans usually may be repaid at any time at the option of the borrower. The fund reflects both the funded portion of the bank loan as well as any unfunded commitment on the loan in the Portfolio of Investments.
Certain credit agreements include tranches that provide no initial funding but may require the full principal commitment to be funded at a future date(s) at the borrower’s discretion. Such agreements are not reflected in the Portfolio of Investments until funded. At May 31, 2013, the fund’s total unfunded commitments were $2,275,000.
Counterparty Risk and Collateral The fund has entered into collateral agreements with certain counterparties to mitigate counterparty risk associated with certain over-the-counter (OTC) financial instruments, including swaps, forward currency exchange contracts, TBA purchase commitments, and OTC options (collectively, covered OTC instruments). Subject to certain minimum exposure requirements (which typically range from $100,000 to $500,000), collateral requirements generally are determined and transfers made based on the net aggregate unrealized gain or loss on all OTC instruments covered by a particular collateral agreement with a specified counterparty. At any point in time, the fund’s risk of loss from counterparty credit risk on covered OTC instruments is the aggregate unrealized gain on appreciated covered OTC instruments in excess of collateral, if any, pledged by the counterparty to the fund. Further, in accordance with the terms of the relevant agreements, counterparties to certain OTC instruments may be able to terminate the contracts prior to maturity upon the occurrence of certain stated events, such as a decline in net assets above a certain percentage or a failure by the fund to perform its obligations under the contract. Upon termination, all transactions would typically be liquidated and a net amount would be owed by or payable to the fund.
Collateral can be in the form of cash or debt securities issued by the U.S. government or related agencies. Collateral both pledged by the fund to a counterparty and pledged by a counterparty to the fund, is held in a segregated account by a third-party agent. Cash posted by the fund as collateral is reflected as restricted cash in the accompanying financial statements and securities posted by the fund are so noted in the accompanying Portfolio of Investments; both remain in the fund’s assets. Collateral pledged by counterparties is not included in the fund’s assets because the fund does not obtain effective control over those assets. As of May 31, 2013, no collateral was pledged by either the fund or counterparties for covered OTC instruments.
Other Purchases and sales of portfolio securities other than short-term securities aggregated $148,287,000 and $65,912,000, respectively, for the year ended May 31, 2013.
NOTE 5 - FEDERAL INCOME TAXES
No provision for federal income taxes is required since the fund intends to continue to qualify as a regulated investment company under Subchapter M of the Internal Revenue Code and distribute to shareholders all of its taxable income and gains. Distributions determined in accordance with federal income tax regulations may differ in amount or character from net investment income and realized gains for financial reporting purposes. Financial reporting records are adjusted for permanent book/tax differences to reflect tax character but are not adjusted for temporary differences.
The fund files U.S. federal, state, and local tax returns as required. The fund’s tax returns are subject to examination by the relevant tax authorities until expiration of the applicable statute of limitations, which is generally three years after the filing of the tax return but which can be extended to six years in certain circumstances. Tax returns for open years have incorporated no uncertain tax positions that require a provision for income taxes.
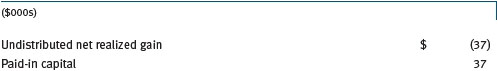
Reclassifications to paid-in capital relate primarily to a tax practice that treats a portion of the proceeds from each redemption of capital shares as a distribution of taxable net investment income and/or realized capital gain. For the year ended May 31, 2013, the following reclassifications were recorded to reflect tax character (there was no impact on results of operations or net assets):
Distributions during the periods ended May 31, 2013 and May 31, 2012, totaled $3,966,000 and $1,602,000, respectively, and were characterized as ordinary income for tax purposes. At May 31, 2013, the tax-basis cost of investments and components of net assets were as follows:

NOTE 6 - RELATED PARTY TRANSACTIONS
The fund is managed by T. Rowe Price Associates, Inc. (Price Associates), a wholly owned subsidiary of T. Rowe Price Group, Inc. (Price Group). The investment management agreement between the fund and Price Associates provides for an annual investment management fee, which is computed daily and paid monthly. The fee consists of an individual fund fee, equal to 0.30% of the fund’s average daily net assets, and a group fee. The group fee rate is calculated based on the combined net assets of certain mutual funds sponsored by Price Associates (the group) applied to a graduated fee schedule, with rates ranging from 0.48% for the first $1 billion of assets to 0.275% for assets in excess of $400 billion. The fund’s group fee is determined by applying the group fee rate to the fund’s average daily net assets. At May 31, 2013, the effective annual group fee rate was 0.30%.
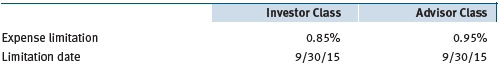
The Investor Class and Advisor Class are also subject to a contractual expense limitation through the limitation dates indicated in the table below. During the limitation period, Price Associates is required to waive its management fee and/or reimburse expenses, excluding interest, taxes, brokerage commissions, and extraordinary expenses that would otherwise cause the class’s ratio of annualized total expenses to average net assets (expense ratio) to exceed its expense limitation. For a period of three years after the date of any reimbursement or waiver, each class is required to repay Price Associates for expenses previously reimbursed and management fees waived to the extent the class’s net assets have grown or expenses have declined sufficiently to allow repayment without causing the class’s expense ratio to exceed its expense limitation.
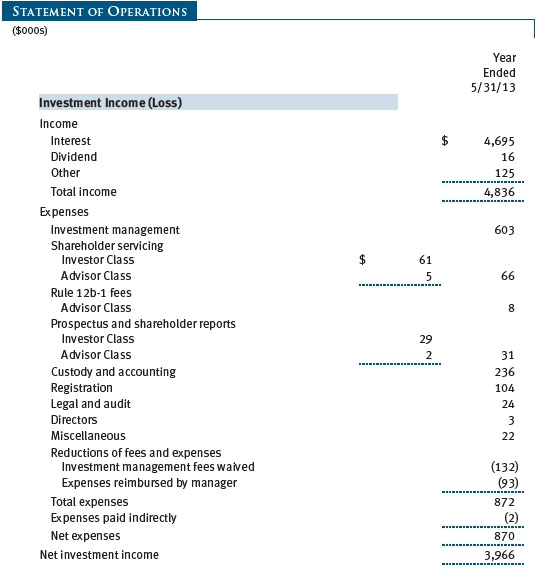
Pursuant to this agreement, management fees in the amount of $132,000 were waived and expenses in the amount of $93,000 were reimbursed by Price Associates during the year ended May 31, 2013. Including these amounts, management fees waived and expenses previously reimbursed by Price Associates in the amount of $476,000 remain subject to repayment at May 31, 2013.
In addition, the fund has entered into service agreements with Price Associates and two wholly owned subsidiaries of Price Associates (collectively, Price). Price Associates computes the daily share prices and provides certain other administrative services to the fund. T. Rowe Price Services, Inc., provides shareholder and administrative services in its capacity as the fund’s transfer and dividend disbursing agent. T. Rowe Price Retirement Plan Services, Inc., provides subaccounting and recordkeeping services for certain retirement accounts invested in the Investor Class. For the year ended May 31, 2013, expenses incurred pursuant to these service agreements were $169,000 for Price Associates; $36,000 for T. Rowe Price Services, Inc.; and less than $1,000 for T. Rowe Price Retirement Plan Services, Inc. The total amount payable at period-end pursuant to these service agreements is reflected as Due to Affiliates in the accompanying financial statements.
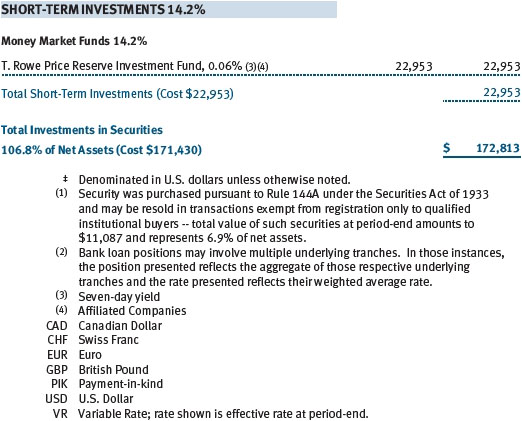
The fund may invest in the T. Rowe Price Reserve Investment Fund and the T. Rowe Price Government Reserve Investment Fund (collectively, the T. Rowe Price Reserve Investment Funds), open-end management investment companies managed by Price Associates and considered affiliates of the fund. The T. Rowe Price Reserve Investment Funds are offered as cash management options to mutual funds, trusts, and other accounts managed by Price Associates and/or its affiliates and are not available for direct purchase by members of the public. The T. Rowe Price Reserve Investment Funds pay no investment management fees.
As of May 31, 2013, T. Rowe Price Group, Inc., and/or its wholly owned subsidiaries owned 2,475,000 shares of the fund, aggregating 16% of the fund’s net assets.
NOTE 7 - BORROWING
The fund may borrow to provide temporary liquidity. The fund, along with another T. Rowe Price-sponsored mutual fund (collectively, the participating funds), has entered into a $200 million committed credit facility (the facility) provided by JPMorgan Chase Bank, N.A., pursuant to which the participating funds may borrow on a first-come, first-served basis up to the full amount of the facility. Interest is charged to the borrowing fund at a rate equal to 1.25% plus the greater of (a) the Federal Funds rate or (b) the one-month LIBOR. A commitment fee, equal to 0.10% per annum of the average daily undrawn commitment, is allocated to the participating funds based on each fund’s relative net assets; it is accrued daily and paid quarterly. Loans are generally unsecured; however, the fund must collateralize any borrowings under the facility on an equivalent basis if it has other collateralized borrowings. During the year ended May 31, 2013, the fund incurred $8,000 in commitment fees. At May 31, 2013, the fund had no borrowings outstanding under the facility and the undrawn amount of the facility was $200,000,000.
| Report of Independent Registered Public Accounting Firm |
To the Board of Directors and Shareholders of T. Rowe Price
Floating Rate Fund, Inc.
In our opinion, the accompanying statement of assets and liabilities, including the portfolio of investments, and the related statements of operations and of changes in net assets and the financial highlights present fairly, in all material respects, the financial position of T. Rowe Price Floating Rate Fund, Inc. (the “Fund”) at May 31, 2013, and the results of its operations, the changes in its net assets and the financial highlights for each of the periods indicated therein, in conformity with accounting principles generally accepted in the United States of America. These financial statements and financial highlights (hereafter referred to as “financial statements”) are the responsibility of the Fund’s management; our responsibility is to express an opinion on these financial statements based on our audits. We conducted our audits of these financial statements in accordance with the standards of the Public Company Accounting Oversight Board (United States). Those standards require that we plan and perform the audit to obtain reasonable assurance about whether the financial statements are free of material misstatement. An audit includes examining, on a test basis, evidence supporting the amounts and disclosures in the financial statements, assessing the accounting principles used and significant estimates made by management, and evaluating the overall financial statement presentation. We believe that our audits, which included confirmation of securities at May 31, 2013 by correspondence with the custodian and brokers, and confirmation of the underlying funds by correspondence with the transfer agent, provide a reasonable basis for our opinion.
PricewaterhouseCoopers LLP
Baltimore, Maryland
July 16, 2013
| Tax Information (Unaudited) for the Tax Year Ended 5/31/13 |
We are providing this information as required by the Internal Revenue Code. The amounts shown may differ from those elsewhere in this report because of differences between tax and financial reporting requirements.
The fund’s distributions to shareholders included:
- $34,000 from short-term capital gains,
- $3,000 from long-term capital gains, subject to the 15% rate gains category
| Information on Proxy Voting Policies, Procedures, and Records |
A description of the policies and procedures used by T. Rowe Price funds and portfolios to determine how to vote proxies relating to portfolio securities is available in each fund’s Statement of Additional Information. You may request this document by calling 1-800-225-5132 or by accessing the SEC’s website, sec.gov.
The description of our proxy voting policies and procedures is also available on our website, troweprice.com. To access it, click on the words “Social Responsibility” at the top of our corporate homepage. Next, click on the words “Conducting Business Responsibly” on the left side of the page that appears. Finally, click on the words “Proxy Voting Policies” on the left side of the page that appears.
Each fund’s most recent annual proxy voting record is available on our website and through the SEC’s website. To access it through our website, follow the above directions to reach the “Conducting Business Responsibly” page. Click on the words “Proxy Voting Records” on the left side of that page, and then click on the “View Proxy Voting Records” link at the bottom of the page that appears.
| How to Obtain Quarterly Portfolio Holdings |
The fund files a complete schedule of portfolio holdings with the Securities and Exchange Commission for the first and third quarters of each fiscal year on Form N-Q. The fund’s Form N-Q is available electronically on the SEC’s website (sec.gov); hard copies may be reviewed and copied at the SEC’s Public Reference Room, 100 F St. N.E., Washington, DC 20549. For more information on the Public Reference Room, call 1-800-SEC-0330.
| Approval of Investment Management Agreement |
On March 5, 2013, the fund’s Board of Directors (Board), including a majority of the fund’s independent directors, approved the continuation of the investment management agreement (Advisory Contract) between the fund and its investment advisor, T. Rowe Price Associates, Inc. (Advisor). In connection with its deliberations, the Board requested, and the Advisor provided, such information as the Board (with advice from independent legal counsel) deemed reasonably necessary. The Board considered a variety of factors in connection with its review of the Advisory Contract, also taking into account information provided by the Advisor during the course of the year, as discussed below:
Services Provided by the Advisor
The Board considered the nature, quality, and extent of the services provided to the fund by the Advisor. These services included, but were not limited to, directing the fund’s investments in accordance with its investment program and the overall management of the fund’s portfolio, as well as a variety of related activities such as financial, investment operations, and administrative services; compliance; maintaining the fund’s records and registrations; and shareholder communications. The Board also reviewed the background and experience of the Advisor’s senior management team and investment personnel involved in the management of the fund, as well as the Advisor’s compliance record. The Board concluded that it was satisfied with the nature, quality, and extent of the services provided by the Advisor.
Investment Performance of the Fund
The Board reviewed the fund’s three-month, one-year, and year-by-year returns, as well as the fund’s annualized since-inception return, and compared these returns with a wide variety of previously agreed upon comparable performance measures and market data, including those supplied by Lipper and Morningstar, which are independent providers of mutual fund data.
On the basis of this evaluation and the Board’s ongoing review of investment results, and factoring in the fund’s relatively limited operating history, the Board concluded that the fund’s performance was satisfactory.
Costs, Benefits, Profits, and Economies of Scale
The Board reviewed detailed information regarding the revenues received by the Advisor under the Advisory Contract and other benefits that the Advisor (and its affiliates) may have realized from its relationship with the fund, including any research received under “soft dollar” agreements and commission-sharing arrangements with broker-dealers. The Board considered that the Advisor may receive some benefit from soft-dollar arrangements pursuant to which research is received from broker-dealers that execute the applicable fund’s portfolio transactions. The Board received information on the estimated costs incurred and profits realized by the Advisor from managing T. Rowe Price mutual funds. While the Board did not review information regarding profits realized from managing the fund in particular because the fund had not achieved sufficient scale to produce meaningful profit margin percentages, the Board concluded that the Advisor’s profits were reasonable in light of the services provided to the funds.
The Board also considered whether the fund benefits under the fee levels set forth in the Advisory Contract from any economies of scale realized by the Advisor. Under the Advisory Contract, the fund pays a fee to the Advisor for investment management services composed of two components—a group fee rate based on the combined average net assets of most of the T. Rowe Price mutual funds (including the fund) that declines at certain asset levels and an individual fund fee rate based on the fund’s average daily net assets—and the fund pays its own expenses of operations (subject to an expense limitation agreed to by the Advisor for both Investor Class and Advisor Class). The Board concluded that the advisory fee structure for the fund continued to provide for a reasonable sharing of benefits from any economies of scale with the fund’s investors.
Fees
The Board was provided with information regarding industry trends in management fees and expenses, and the Board reviewed the fund’s management fee rate, operating expenses, and total expense ratio for the Investor Class and Advisor Class in comparison with fees and expenses of other comparable funds based on information and data supplied by Lipper. The information provided to the Board indicated that the fund’s management fee rate (after including reductions of the management fee that resulted from fee waivers and/or expenses paid by the Advisor) was below the median for comparable funds. The information also indicated that the total expense ratio for the Investor Class was above the median for certain groups of comparable funds and below the median for other groups of comparable funds, and the total expense ratio for the Advisor Class was below the median for comparable funds.
The Board also reviewed the fee schedules for institutional accounts and private accounts with similar mandates that are advised or subadvised by the Advisor and its affiliates. Management provided the Board with information about the Advisor’s responsibilities and services provided to institutional account clients, including information about how the requirements and economics of the institutional business are fundamentally different from those of the mutual fund business. The Board considered information showing that the mutual fund business is generally more complex from a business and compliance perspective than the institutional business and that the Advisor generally performs significant additional services and assumes greater risk in managing the fund and other T. Rowe Price mutual funds than it does for institutional account clients.
On the basis of the information provided and the factors considered, the Board concluded that the fees paid by the fund under the Advisory Contract are reasonable.
Approval of the Advisory Contract
As noted, the Board approved the continuation of the Advisory Contract. No single factor was considered in isolation or to be determinative to the decision. Rather, the Board concluded, in light of a weighting and balancing of all factors considered, that it was in the best interests of the fund and its shareholders for the Board to approve the continuation of the Advisory Contract (including the fees to be charged for services thereunder). The independent directors were advised throughout the process by independent legal counsel.
| About the Fund’s Directors and Officers |
Your fund is overseen by a Board of Directors (Board) that meets regularly to review a wide variety of matters affecting the fund, including performance, investment programs, compliance matters, advisory fees and expenses, service providers, and other business affairs. The Board elects the fund’s officers, who are listed in the final table. At least 75% of the Board’s members are independent of T. Rowe Price Associates, Inc. (T. Rowe Price), and its affiliates; “inside” or “interested” directors are employees or officers of T. Rowe Price. The business address of each director and officer is 100 East Pratt Street, Baltimore, Maryland 21202. The Statement of Additional Information includes additional information about the fund directors and is available without charge by calling a T. Rowe Price representative at 1-800-638-5660.
Independent Directors
| Name | | |
| (Year of Birth) | | |
| Year Elected* | | |
| [Number of T. Rowe Price | | Principal Occupation(s) and Directorships of Public Companies and |
| Portfolios Overseen] | | Other Investment Companies During the Past Five Years |
| | | |
| William R. Brody | | President and Trustee, Salk Institute for Biological Studies (2009 |
| (1944) | | to present); Director, Novartis, Inc. (2009 to present); Director, IBM |
| 2011 | | (2007 to present); President and Trustee, Johns Hopkins University |
| [143] | | (1996 to 2009); Chairman of Executive Committee and Trustee, |
| | Johns Hopkins Health System (1996 to 2009) |
| | | |
| Anthony W. Deering | | Chairman, Exeter Capital, LLC, a private investment firm (2004 to |
| (1945) | | present); Director and Member of the Advisory Board, Deutsche |
| 2011 | | Bank North America (2004 to present); Director, Under Armour |
| [143] | | (2008 to present); Director, Vornado Real Estate Investment Trust |
| | (2004 to 2012) |
| | | |
| Donald W. Dick, Jr. | | Principal, EuroCapital Partners, LLC, an acquisition and management |
| (1943) | | advisory firm (1995 to present) |
| 2011 | | |
| [143] | | |
| | | |
| Karen N. Horn | | Senior Managing Director, Brock Capital Group, an advisory and |
| (1943) | | investment banking firm (2004 to present); Director, Eli Lilly and |
| 2011 | | Company (1987 to present); Director, Simon Property Group (2004 |
| [143] | | to present); Director, Norfolk Southern (2008 to present); Director, |
| | Fannie Mae (2006 to 2008) |
| | | |
| Theo C. Rodgers | | President, A&R Development Corporation (1977 to present) |
| (1941) | | |
| 2011 | | |
| [143] | | |
| | | |
| John G. Schreiber | | Owner/President, Centaur Capital Partners, Inc., a real estate |
| (1946) | | investment company (1991 to present); Cofounder and Partner, |
| 2011 | | Blackstone Real Estate Advisors, L.P. (1992 to present); Director, |
| [143] | | General Growth Properties, Inc. (2010 to present); Director, Capital |
| | Trust, Inc., a real estate investment company (2012 to present) |
| | | |
| Mark R. Tercek | | President and Chief Executive Officer, The Nature Conservancy (2008 |
| (1957) | | to present); Managing Director, The Goldman Sachs Group, Inc. |
| 2011 | | (1984 to 2008) |
| [143] | | |
| | | |
*Each independent director serves until retirement, resignation, or election of a successor. |
Inside Directors
| Name | | |
| (Year of Birth) | | |
| Year Elected* | | |
| [Number of T. Rowe Price | | Principal Occupation(s) and Directorships of Public Companies and |
| Portfolios Overseen] | | Other Investment Companies During the Past Five Years |
| | | |
| Edward C. Bernard | | Director and Vice President, T. Rowe Price; Vice Chairman of the |
| (1956) | | Board, Director, and Vice President, T. Rowe Price Group, Inc.; |
| 2011 | | Chairman of the Board, Director, and President, T. Rowe Price |
| [143] | | Investment Services, Inc.; Chairman of the Board and Director, |
| | T. Rowe Price Retirement Plan Services, Inc., T. Rowe Price Savings |
| | Bank, and T. Rowe Price Services, Inc.; Chairman of the Board, Chief |
| | Executive Officer, and Director, T. Rowe Price International; Chairman |
| | of the Board, Chief Executive Officer, Director, and President, |
| | T. Rowe Price Trust Company; Chairman of the Board, all funds |
| | | |
| Michael C. Gitlin | | Vice President, Price Hong Kong, Price Singapore, T. Rowe Price, |
| (1970) | | T. Rowe Price Group, Inc., and T. Rowe Price International |
| 2011 | | |
| [50] | | |
| | | |
*Each inside director serves until retirement, resignation, or election of a successor. |
Officers
| Name (Year of Birth) | | |
| Position Held With Floating Rate Fund | | Principal Occupation(s) |
| | | |
| Brian E. Burns (1960) | | Vice President, T. Rowe Price, T. Rowe Price |
| Vice President | | Group, Inc., and T. Rowe Price Trust Company |
| | | |
| Michael F. Connelly, CFA (1977) | | Vice President, T. Rowe Price and T. Rowe Price |
| Vice President | | Group, Inc. |
| | | |
| Roger L. Fiery III, CPA (1959) | | Vice President, Price Hong Kong, Price |
| Vice President | | Singapore, T. Rowe Price, T. Rowe Price Group, |
| | Inc., T. Rowe Price International, and T. Rowe |
| | Price Trust Company |
| | | |
| Stephen M. Finamore, CPA (1976) | | Vice President, T. Rowe Price and T. Rowe Price |
| Vice President | | Group, Inc. |
| | | |
| Justin T. Gerbereux, CFA (1975) | | Vice President, T. Rowe Price, T. Rowe Price |
| Vice President | | Group, Inc., and T. Rowe Price Trust Company |
| | | |
| John R. Gilner (1961) | | Chief Compliance Officer and Vice President, |
| Chief Compliance Officer | | T. Rowe Price; Vice President, T. Rowe Price |
| | Group, Inc., and T. Rowe Price Investment |
| | Services, Inc. |
| | | |
| David R. Giroux, CFA (1975) | | Vice President, T. Rowe Price, T. Rowe Price |
| Vice President | | Group, Inc., and T. Rowe Price Trust Company |
| | | |
| Gregory S. Golczewski (1966) | | Vice President, T. Rowe Price and T. Rowe Price |
| Vice President | | Trust Company |
| | | |
| Gregory K. Hinkle, CPA (1958) | | Vice President, T. Rowe Price, T. Rowe Price |
| Treasurer | | Group, Inc., and T. Rowe Price Trust Company |
| | | |
| Steven C. Huber, CFA, FSA (1958) | | Vice President, T. Rowe Price and T. Rowe Price |
| Vice President | | Group, Inc. |
| | | |
| Paul A. Karpers, CFA (1967) | | Vice President, T. Rowe Price and T. Rowe Price |
| Vice President | | Group, Inc. |
| | | |
| Patricia B. Lippert (1953) | | Assistant Vice President, T. Rowe Price and |
| Secretary | | T. Rowe Price Investment Services, Inc. |
| | | |
| Paul M. Massaro, CFA (1975) | | Vice President, T. Rowe Price, T. Rowe Price |
| Executive Vice President | | Group, Inc., and T. Rowe Price Trust Company |
| | | |
| Michael J. McGonigle (1966) | | Vice President, T. Rowe Price and T. Rowe Price |
| Vice President | | Group, Inc. |
| | | |
| David Oestreicher (1967) | | Director, Vice President, and Secretary, T. Rowe |
| Vice President | | Price Investment Services, Inc., T. Rowe |
| | Price Retirement Plan Services, Inc., T. Rowe |
| | Price Services, Inc., and T. Rowe Price Trust |
| | Company; Chief Legal Officer, Vice President, |
| | and Secretary, T. Rowe Price Group, Inc.; |
| | Vice President and Secretary, T. Rowe Price |
| | and T. Rowe Price International; Vice President, |
| | Price Hong Kong and Price Singapore; |
| | Secretary, T. Rowe Price Savings Bank |
| | | |
| Brian A. Rubin, CPA (1974) | | Vice President, T. Rowe Price, T. Rowe Price |
| Vice President | | Group, Inc., and T. Rowe Price Trust Company |
| | | |
| Deborah D. Seidel (1962) | | Vice President, T. Rowe Price, T. Rowe Price |
| Vice President | | Group, Inc., T. Rowe Price Investment Services, |
| | Inc., and T. Rowe Price Services, Inc. |
| | | |
| Walter P. Stuart III, CFA (1960) | | Vice President, T. Rowe Price and T. Rowe Price |
| Vice President | | Group, Inc. |
| | | |
| Thomas E. Tewksbury (1961) | | Vice President, T. Rowe Price, T. Rowe Price |
| Vice President | | Group, Inc., and T. Rowe Price Trust Company |
| | | |
| Mark J. Vaselkiv (1958) | | Vice President, T. Rowe Price, T. Rowe Price |
| President | | Group, Inc., and T. Rowe Price Trust Company |
| | | |
| Julie L. Waples (1970) | | Vice President, T. Rowe Price |
| Vice President | | |
| | | |
| Thea N. Williams (1961) | | Vice President, T. Rowe Price, T. Rowe Price |
| Vice President | | Group, Inc., and T. Rowe Price Trust Company |
| | | |
Unless otherwise noted, officers have been employees of T. Rowe Price or T. Rowe Price International for at least 5 years. |
Item 2. Code of Ethics.
The registrant has adopted a code of ethics, as defined in Item 2 of Form N-CSR, applicable to its principal executive officer, principal financial officer, principal accounting officer or controller, or persons performing similar functions. A copy of this code of ethics is filed as an exhibit to this Form N-CSR. No substantive amendments were approved or waivers were granted to this code of ethics during the period covered by this report.
Item 3. Audit Committee Financial Expert.
The registrant’s Board of Directors/Trustees has determined that Mr. Anthony W. Deering qualifies as an audit committee financial expert, as defined in Item 3 of Form N-CSR. Mr. Deering is considered independent for purposes of Item 3 of Form N-CSR.
Item 4. Principal Accountant Fees and Services.
(a) – (d) Aggregate fees billed for the last two fiscal years for professional services rendered to, or on behalf of, the registrant by the registrant’s principal accountant were as follows:
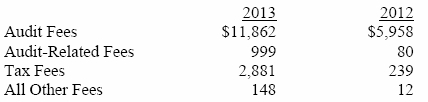
Audit fees include amounts related to the audit of the registrant’s annual financial statements and services normally provided by the accountant in connection with statutory and regulatory filings. Audit-related fees include amounts reasonably related to the performance of the audit of the registrant’s financial statements and specifically include the issuance of a report on internal controls and, if applicable, agreed-upon procedures related to fund acquisitions. Tax fees include amounts related to services for tax compliance, tax planning, and tax advice. The nature of these services specifically includes the review of distribution calculations and the preparation of Federal, state, and excise tax returns. All other fees include the registrant’s pro-rata share of amounts for agreed-upon procedures in conjunction with service contract approvals by the registrant’s Board of Directors/Trustees.
(e)(1) The registrant’s audit committee has adopted a policy whereby audit and non-audit services performed by the registrant’s principal accountant for the registrant, its investment adviser, and any entity controlling, controlled by, or under common control with the investment adviser that provides ongoing services to the registrant require pre-approval in advance at regularly scheduled audit committee meetings. If such a service is required between regularly scheduled audit committee meetings, pre-approval may be authorized by one audit committee member with ratification at the next scheduled audit committee meeting. Waiver of pre-approval for audit or non-audit services requiring fees of a de minimis amount is not permitted.
(2) No services included in (b) – (d) above were approved pursuant to paragraph (c)(7)(i)(C) of Rule 2-01 of Regulation S-X.
(f) Less than 50 percent of the hours expended on the principal accountant’s engagement to audit the registrant’s financial statements for the most recent fiscal year were attributed to work performed by persons other than the principal accountant’s full-time, permanent employees.
(g) The aggregate fees billed for the most recent fiscal year and the preceding fiscal year by the registrant’s principal accountant for non-audit services rendered to the registrant, its investment adviser, and any entity controlling, controlled by, or under common control with the investment adviser that provides ongoing services to the registrant were $1,794,000 and $1,375,000, respectively.
(h) All non-audit services rendered in (g) above were pre-approved by the registrant’s audit committee. Accordingly, these services were considered by the registrant’s audit committee in maintaining the principal accountant’s independence.
Item 5. Audit Committee of Listed Registrants.
Not applicable.
Item 6. Investments.
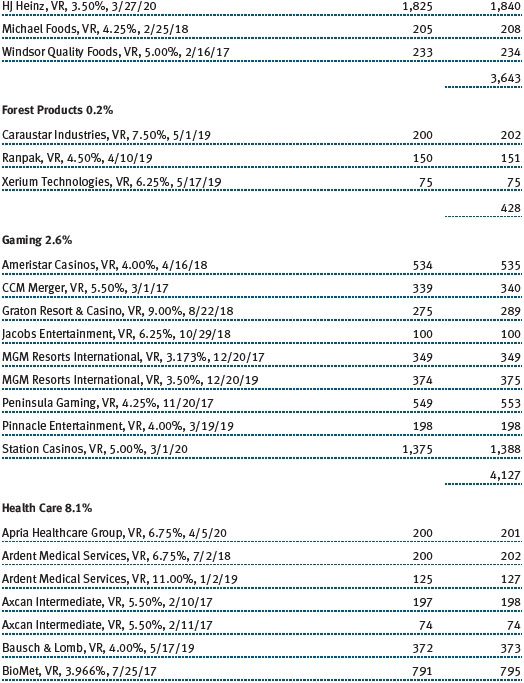
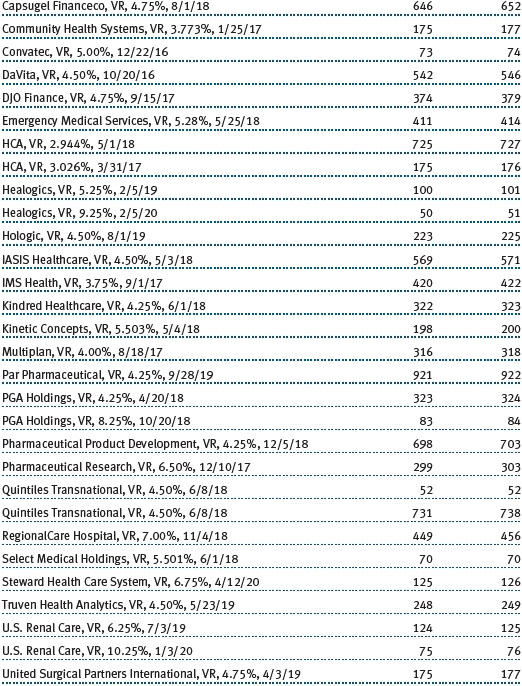
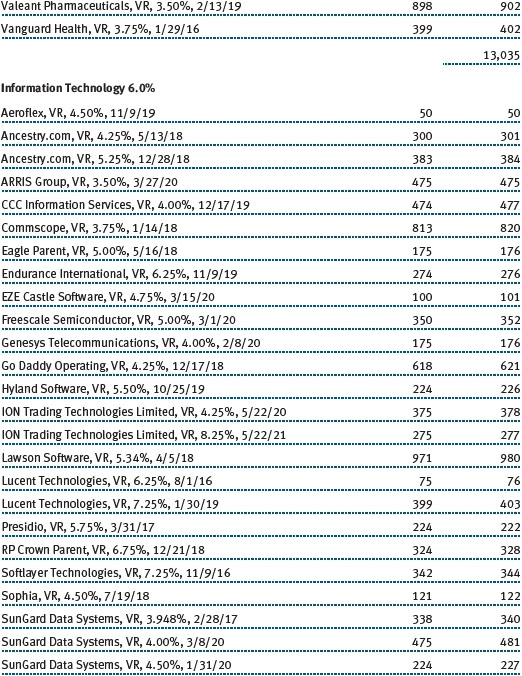
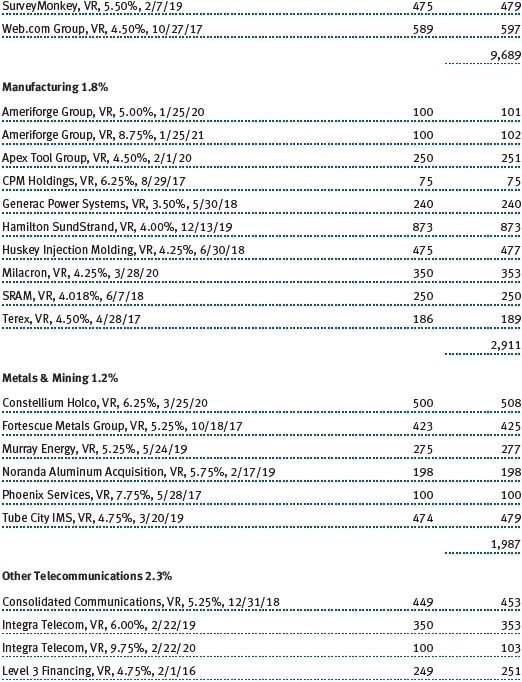
(a) Not applicable. The complete schedule of investments is included in Item 1 of this Form N-CSR.
(b) Not applicable.
Item 7. Disclosure of Proxy Voting Policies and Procedures for Closed-End Management Investment Companies.
Not applicable.
Item 8. Portfolio Managers of Closed-End Management Investment Companies.
Not applicable.
Item 9. Purchases of Equity Securities by Closed-End Management Investment Company and Affiliated Purchasers.
Not applicable.
Item 10. Submission of Matters to a Vote of Security Holders.
Not applicable.
Item 11. Controls and Procedures.
(a) The registrant’s principal executive officer and principal financial officer have evaluated the registrant’s disclosure controls and procedures within 90 days of this filing and have concluded that the registrant’s disclosure controls and procedures were effective, as of that date, in ensuring that information required to be disclosed by the registrant in this Form N-CSR was recorded, processed, summarized, and reported timely.
(b) The registrant’s principal executive officer and principal financial officer are aware of no change in the registrant’s internal control over financial reporting that occurred during the registrant’s second fiscal quarter covered by this report that has materially affected, or is reasonably likely to materially affect, the registrant’s internal control over financial reporting.
Item 12. Exhibits.
(a)(1) The registrant’s code of ethics pursuant to Item 2 of Form N-CSR is attached.
(2) Separate certifications by the registrant's principal executive officer and principal financial officer, pursuant to Section 302 of the Sarbanes-Oxley Act of 2002 and required by Rule 30a-2(a) under the Investment Company Act of 1940, are attached.
(3) Written solicitation to repurchase securities issued by closed-end companies: not applicable.
(b) A certification by the registrant's principal executive officer and principal financial officer, pursuant to Section 906 of the Sarbanes-Oxley Act of 2002 and required by Rule 30a-2(b) under the Investment Company Act of 1940, is attached.
SIGNATURES
Pursuant to the requirements of the Securities Exchange Act of 1934 and the Investment Company Act of 1940, the registrant has duly caused this report to be signed on its behalf by the undersigned, thereunto duly authorized.
T. Rowe Price Floating Rate Fund, Inc.
| | By | /s/ Edward C. Bernard |
| | Edward C. Bernard |
| | Principal Executive Officer |
| |
| Date July 16, 2013 | | |
Pursuant to the requirements of the Securities Exchange Act of 1934 and the Investment Company Act of 1940, this report has been signed below by the following persons on behalf of the registrant and in the capacities and on the dates indicated.
| | By | /s/ Edward C. Bernard |
| | Edward C. Bernard |
| | Principal Executive Officer |
| |
| Date July 16, 2013 | | |
| |
| |
| By | /s/ Gregory K. Hinkle |
| | Gregory K. Hinkle |
| | Principal Financial Officer |
| |
| Date July 16, 2013 | | |