Controladora Vuela Compañía de Aviación, S.A.B. de C.V. (VLRS)
Filed: 7 Dec 20, 4:18pm
Exhibit 99.56
RECENT DEVELOPMENTS
The discussion included herein of Controladora Vuela Compañía de Aviación, S.A.B. de C.V. (which we refer to as “Volaris,” the “Company” or “we”) results of operations for the nine month periods ended September 30, 2020 and 2019 should be read in conjunction with our annual report on Form 20-F for the fiscal year ended December 31, 2019, as filed with the U.S. Securities and Exchange Commission (which we refer to as the “SEC”) on April 28, 2020 (which we refer to as the “Form 20-F”) and with our unaudited interim financial statements as of September 30, 2020 and for the nine month periods ended September 30, 2020 and 2019, as furnished to the SEC on Form 6-K on October 23, 2020 included herein as Exhibit 99.57 (which we refer to as the “unaudited interim financial statements”). We hereby designate this report on Form 6-K as being incorporated by reference into our registration statement on Form F-3, as originally filed with the SEC on October 7, 2020 (File No. 333-249370), and amended by Amendment No. 1 to the Registration Statement filed with the SEC on November 27, 2020.
COVID-19 Pandemic Update
The SARS-CoV-2 (“COVID-19”) pandemic has drastically reduced demand for air travel and caused major disruptions and volatility in global financial markets, resulting in the fall of stock prices (including the price of our stock), both trends which may continue. There are other broad and continuing concerns related to the potential effects of the COVID-19 pandemic on international trade (including supply chain disruptions and export levels), travel, restrictions on our ability to access our facilities or aircraft, requirements to collect additional passenger data, employee productivity, employee illness, increased unemployment levels, securities markets, and other economic activities, particularly for airlines, that may have a destabilizing effect on financial markets and economic activity.
From a macroeconomic point of view, the impact of the COVID-19 pandemic in Mexico is uncertain. The Mexican Central Bank’s (Banco de México) initial pre-COVID-19 estimates indicated that Mexico’s GDP was predicted to grow between 0.5% and 1.5% in 2020. In the Mexican Central Bank’s latest quarterly report, Mexico’s GDP expectations are based on one central COVID-19 pandemic scenario in which Mexican GDP is predicted to contract approximately 8.7% in 2020. Economic stagnation, the depreciation of the peso, contraction of demand and decreased income levels and increased unemployment levels could result in decreased passenger demand and lower net income in the long term, even after any potential COVID-19 related travel restrictions and border closures are lifted. For example, according to the Mexican Social Security Institute (Instituto Mexicano del Seguro Social) for the period from March 30, 2020 to September 30, 2020, 780,751 formal jobs were lost in Mexico. Furthermore, the COVID-19 pandemic has also resulted in increased volatility in both the local and the international financial markets and economic indicators, such as exchange rates, interest rates, credit spreads and commodity prices. Any shocks or unexpected movements in these market factors could result in additional financial losses.
The COVID-19 pandemic has had a negative impact on the Mexican airline industry, particularly in terms of passenger traffic. The following chart sets forth passenger traffic for the Mexican airline industry in each of the first three quarters of 2020 as compared to the same first three quarters of 2019, as reported by the Mexican Federal Agency of Civil Aviation (Agencia Federal de Aviación Civil, or “AFAC”):
| 2019 | 2020 | Variation | ||||||||||
| (In thousands, except for %) | ||||||||||||
| First Quarter | 15,753.9 | 15,229.4 | (3.3 | )% | ||||||||
| Second Quarter | 17,966.2 | 1,868.5 | (89.6 | )% | ||||||||
| Third Quarter | 18,427.2 | 6,983.7 | (62.1 | )% | ||||||||
| Total | 52,147.3 | 24,081.6 | (53.8 | )% | ||||||||
In terms of the impact on us, we reduced our capacity as compared to the same months in 2019 as measured by available seat miles (“ASMs”) by approximately 82% for the month of April, approximately 88% for the month of May, approximately 59% for the month of June, approximately 37% for the month of July, approximately 21% for the month of August, approximately 16% for the month of September, approximately 16% for the month of October and approximately 2% for the month of November. Additionally, we suspended service on certain routes. In particular, Costa Rica, Guatemala and El Salvador imposed operational and migration restrictions that made it impossible to operate international passenger flights to those countries. In order to mitigate the impact of the COVID-19 pandemic on us, we took the following measures:
1
| · | Preserving liquidity and cash. We implemented a strict liquidity preservation program, which has resulted in approximately U.S. $266 million of savings as of September 30, 2020 through items such as cost reductions and deferral agreements with suppliers. For example, we deferred approximately 80% of our aircraft lease payments due in 2020 to 2021, resulting in the postponement of U.S.$200 million in pre-delivery payments (“PDPs”). In addition, we negotiated cost reductions and payment deferrals with more than 360 suppliers and cut non-essential expenses. We also implemented online training and leave of absence programs in order to reduce costs. We expect to continue reducing costs with the aim of reaching a CASM ex-fuel (calculated based on total operating expenses, net excluding fuel expense divided by ASMs) similar to 2019 levels by the end of 2020. As of November 30, 2020, our cash and cash equivalents were approximately Ps. 7.5 billion. Additionally, at November 30, 2020 our credit lines totaled Ps. 9.3 billion, of which Ps. 6.9 billion were related to financial debt and Ps. 2.4 billion were related to letters of credit (and of which Ps. 1.8 billion were undisbursed). |
| · | Defending ourselves against sales declines. We decreased scheduled capacity in order to protect our profitability. We also strengthened our relationships with customers by revamping our website and maintaining close communications via social media and email. |
| · | Developing commercial and network growth opportunities. We are closely monitoring capacity reductions from competitors for possible opportunities, testing new ancillary products and running targeted promotions to test potential stimulation of air travel. Certain of our competitors are facing financial difficulties which has led them to stop utilizing certain slots at the Mexico City airport. We have been allowed to use some of these slots to open new destinations and increase operations at this airport, and currently hold 26% of the market share by ASMs. However, since the Mexico City airport has issued a waiver to the minimum usage requirement due to the COVID-19 pandemic, we will not be granted historical priority of such slots unless (i) the waiver is terminated, (ii) the slots are not reclaimed by their prior holders and (iii) we continue operating the slots in accordance with certain conditions, including usage at least 85% of the time and conducting on time operations at least 85% of the time (operations are considered on time if they fall within 15 minutes of the assigned slot time). We can offer no assurance that our competitors will not reclaim the use of such slots prior to the expiration of the waiver on March 27, 2021, or that the waiver will not be extended. If our competitors do reclaim the slots prior to the expiration of the waiver, we may lose the preferential use of such slots almost immediately. Since the start of the COVID-19 pandemic, we have launched five new domestic routes and seven new international routes, now operating 107 domestic and 64 international routes in total. |
| · | Reviewing our fleet plan. Our new contractual fleet plan with Airbus allows us to maintain a “cautiously” sized fleet that will remain at approximately 88 aircraft, net of new deliveries and redeliveries, until 2023. |
| · | Protecting our customers and employees. We launched a new biosecurity and cleaning protocol and are communicating proactively with all staff, especially with crews and airport staff, regarding health and COVID-19 developments. For employees who are able to work remotely, we have activated home office technologies and protocols. |
Furthermore, a gradual opening of the economy and easing of lockdown measures in Mexico and the other countries in which we operate led to a recovery in our ASMs and route operation during the summer of 2020. In June, our load factor was 73.1%, and our capacity in terms of ASMs was 825 million. We were able to ramp up to 63% of July 2019 service in July, and expanded further to 79% of August 2019 service in August. Our load factor for July and August was 73.1% and 72.6%, respectively, and our capacity in terms of ASMs was 1,387 million and 1,690 million, respectively. September is typically a low travel month so we prudently increased capacity to 84% of prior year while focusing on increasing total revenue per available seat mile. Our load factor for September was 74.4% and our capacity in terms of ASMs was 1,686 million. For the full nine month period ended September 30, 2020, we operated 68% of ASMs compared to the same period in 2019. The Mexican domestic market led the capacity recovery, where we operated 73% ASMs as compared to the same period in 2019. In the international market, we operated 56% ASMs as compared to the same period in 2019. In the third quarter of 2020, our CASM ex-fuel was U.S.$5.03 cents, our average base fare was U.S.$32.00 and we flew around 3.6 million passengers. For the third quarter of 2020, our load factor was 73.4% and our capacity in terms of ASMs was 75.1% of our capacity in terms of ASMs for the third quarter of 2019. Ancillary revenues made up to 45% of our total revenues for the third quarter of 2020, with average ancillary revenue of U.S.$27.00 per passenger. For October 2020, we operated 84.3% of ASMs as compared to the same month in 2019 and for November 2020 we operated 98% of ASMs as compared to the same month in 2019. Our load factor for October and November was 82.1% and 80.5%, respectively, and our capacity in terms of ASMs was 1,731 million and 1,998 million, respectively. During those months, our Central American operations remained closed. However, we resumed our Central American operations on November 23, 2020. Based on scheduled flights, our load factor for December 2020 is expected to be 80.5% and we expect to operate at approximately 100% capacity as compared to December 2019. Based on flights operated in October and November and flights scheduled in December, our capacity in terms of ASMs for the fourth quarter of 2020 is expected to be approximately 95% of fourth quarter capacity in 2019. Since the start of the COVID-19 pandemic, we have transported approximately 6.7 million passengers.
2
We are focused on taking advantage of the current situation and see opportunities to rebuild core market presence, expand existing market leadership, increase our domestic network overlap against distressed competitors to appropriately serve customer demand, continue United States expansion through visiting friends and relatives (“VFR”) niches and selected Mexico City-U.S. routes, eventually increasing capacity in central America and initiating operations in South America.
Despite the gradual recovery we have seen in ASMs and route operation, the ongoing COVID-19 pandemic is likely to continue to have a negative impact on our financial condition and results of operations, as a result of the following indicators:
| · | A resurgence of COVID-19 infection rates could lead Mexico and the countries in which we operate to return to partial or total lockdowns, which would most likely result in a decrease in demand for our flights (which in turn may require reductions to our ASMs at levels similar to the early months of the pandemic) and aircraft utilization rate and consequently a decrease in our total operating revenue; |
| · | Any further downward volatility in the international capital markets could result in (i) the fall of stock prices, including the price of our stock and (ii) financial losses associated with our financial portfolio, which may cause a deterioration of our financial condition or limitations on our ability to meet our liabilities; |
| · | If our revenues decrease for a significant portion of time, we may have less cash available to meet our obligations under our aircraft and engine lease agreements and additional sources of financing may be difficult to obtain at favorable rates; and |
| · | Even after the COVID-19 pandemic eases, there is a risk that we will experience reduced demand in the near to mid-term due to the potential economic impact of the pandemic on the travel industry (business and leisure) and on our customers, as well as customer health concerns about the safety of air travel. |
Operational and Other Developments
We currently operate at 43 of the 56 airports in Mexico, three of which we began serving in the second half of 2020. Of these 43 airports, we have a leadership position at 24. We have strong network positions in large VFR networks in the United States, including California and Illinois, and see significant opportunities for growth in Central America. We are also making certain changes to our fleet, transitioning to Airbus A320 and A321 NEOs to contribute to fuel efficiency and to allow us to take advantage of upgauging opportunities. For the years ended December 31, 2016, 2017, 2018 and 2019, our fleet was comprised of 1%, 8%, 21%, and 28% Airbus A320 and A321 NEOs, respectively. Based on our contractual order book, for the years ended December 31, 2020, 2021, 2022 and 2023, our fleet will be comprised of 35%, 39%, 52% and 60% Airbus A320 and A321 NEOs, respectively, with 86, 87, 93 and 85 Airbus A320 and A321 NEOs in our fleet at each respective calendar year end.
3
In addition to the opportunities we see to gain market share in light of the impact of the COVID-19 pandemic, discussed above, we also plan to use our low fares to continue gaining market share from the bus transportation market. This represents a substantial growth opportunity for us, as the air travel market represents just 3.4% of the bus market in Mexico. On approximately 40% of our routes, we operate without air competition and compete only with buses. We pioneered air service on 68 routes, and 6% of our passengers (1.2 million for the year ended December 31, 2019) were first time flyers. Low prices have stimulated demand historically and our fares are lower than bus fares in many markets. In addition, remittances to Mexico rose to a new twelve-month record in August 2020, increasing disposable income for Mexican families. The following chart shows comparisons of our fares and travel times against bus fares on certain of the routes we operate, which we believe present a clear and favorable value proposition:
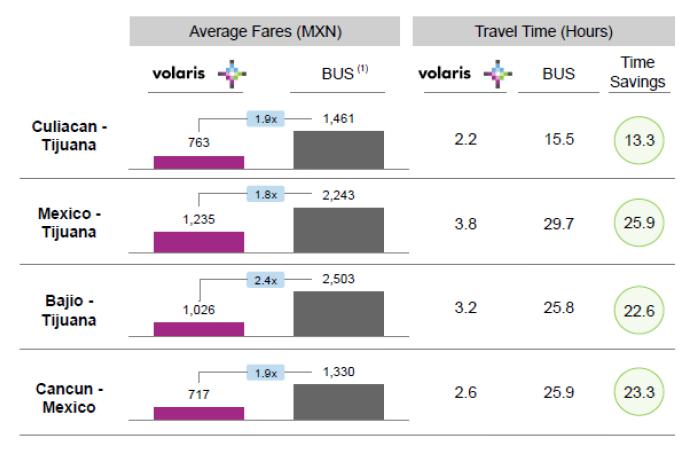
(1) Fares by segment observed in December 2019 as reported by Volaris based on information from individual company websites.
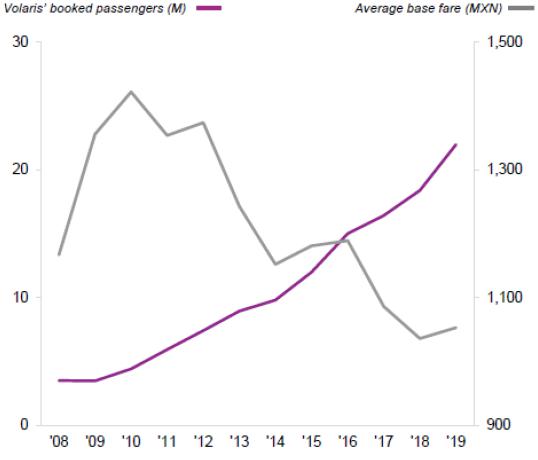
We believe that our strategy of low base fares has stimulated air travel, which is further evidence by the following chart that shows the inverse relationship between our fares and the number of passengers we have carried over the last ten years:
4
The Mexican tax authority is currently performing an audit of our fiscal years 2013 and 2014. We are cooperating fully in respect of any requests for information, which have thus far focused on our deduction of certain expenses, such as maintenance and aircraft lease expenses. As of the date of this current report, such audits remain ongoing.
Recent Developments in the Mexican Airline Industry
Our competitors and the Mexican airline industry as a whole have also been significantly impacted by the COVID-19 pandemic. According to information published by AFAC, as of September 30, 2020, the number of commercial aircraft in service in Mexico had decreased to 258, as compared to 355 as of December 31, 2019. This 27% reduction was comprised mainly of narrow body aircraft, including 49 Airbus A320s, 20 Boeing 737s, and 12 Airbus A321s. On June 30, 2020, Grupo Aeroméxico, our largest competitor by domestic and international market share in 2019, announced that it was filing for Chapter 11 bankruptcy protection in the United States. According to its public filings with the CNBV, Grupo Aeroméxico has maintained regular operations during the restructuring process but has received court approval to return at least 19 aircraft to lessors, which would reduce its fleet size by around 15%. As of September 30, 2020, AFAC reports indicate that Grupo Aeroméxico’s subsidiaries Aeroméxico and Aeroméxico Connect had fleets of 51 and 43 aircraft, respectively, as compared to 69 and 56, respectively, as of December 30, 2019. In addition, Interjet, our second largest competitor by international market share in 2019, has been unable to resume international flights since suspending the routes in March 2020. Interjet’s fleet decreased by almost 90% in 2020, from 67 aircraft as of December 30, 2019 to seven as of September 30, 2020, according to information published by the AFAC. While VivaAerobus, our second largest competitor by domestic market share in 2019, has increased their fleet from 37 as of December 30, 2019 to 39 as of September 30, 2020, this increase does not compensate for the reductions observed in the market. In addition to these changes in fleet size, our market share has also increased. As of October 2020, our domestic market share had increased 9.4 percentage points to 40.5% and our international market share had increased 6.0 percentage points to 14.9%, in each case as compared to our market shares as of October 2019.
5
Results of Operations
Operating Revenues
| For the nine month periods ended September 30, | ||||||||||||||||
| 2019 | 2020 | Variation | ||||||||||||||
| (In thousands of pesos, except for % and operating data) | ||||||||||||||||
| Operating Revenues | ||||||||||||||||
| Passenger revenues: | ||||||||||||||||
| Fare revenues | 16,562,053 | 8,491,208 | (8,070,845 | ) | (48.7 | )% | ||||||||||
| Other passenger revenues | 7,723,539 | 5,132, 658 | (2,590,881 | ) | (33.5 | )% | ||||||||||
| Non-passenger revenues: | ||||||||||||||||
| Other non-passenger revenues | 612,631 | 555,312 | (57,319 | ) | (9.4 | )% | ||||||||||
| Cargo | 164,900 | 132,287 | (32,613 | ) | (19.8 | )% | ||||||||||
| Non-derivative financial instruments | (39,713 | ) | (237,438 | ) | (197,725 | ) | >100 | % | ||||||||
| Total operating revenues | 25,023,410 | 14,074,027 | (10,949,383 | ) | (43.8 | )% | ||||||||||
| Operating Data | ||||||||||||||||
| Capacity (in ASMs in thousands) (1) | 18,198,975 | 12,295,462 | (5,903,513 | ) | (32.4 | )% | ||||||||||
| % Load factor booked (2) | 85 | % | 80 | % | - | (5.0 | ) pp | |||||||||
| Booked passengers (in thousands) (1) | 16,237 | 9,852 | (6,385 | ) | (39.3 | )% | ||||||||||
| Average ticket revenue per booked passenger (2) | 1,022 | 862 | (158 | ) | (15.5 | )% | ||||||||||
| Average other passenger revenue per booked passenger (1) | 476 | 521 | 45 | 9.5 | % | |||||||||||
| Average total ancillary revenue per booked passenger(1) | 524 | 591 | 67 | 12.8 | % | |||||||||||
| Revenue passenger miles (RPMs in thousands) (1) | 15,511,199 | 9,799,915 | (5,711,284 | ) | (36.8 | )% | ||||||||||
| 612,631 | 555,312 | (57,319 | ) | (9.4 | )% | |||||||||||
(1) Includes scheduled & charter.
(2) Includes scheduled.
Fare revenues. The 48.7% decrease in fare revenues in the nine months ended September 30, 2020 as compared to the same period of 2019 was primarily due to a decrease in our ASM capacity of 32.4%, which in turn was as a result of reductions in operations due to the COVID-19 pandemic, despite the incorporation of four new net aircraft to our fleet. Additionally, our booked passengers decreased 39.3%, and our average ticket revenue per booked passenger decreased 15.5% as compared to the same period of the prior year.
Other passenger revenues. The 33.5% decrease in other passenger revenues in the nine months ended September 30, 2020 as compared to the same period of 2019 was primarily due to a lower volume of passengers electing to purchase additional services, which in turn was also due to the decrease in our passenger volume as a result of the COVID-19 pandemic.
Other non-passenger revenues. The 9.4% decrease in other non-passenger revenues in the nine months ended September 30, 2020 as compared to the same period of 2019 was primarily due to the decrease in passengers that acquired additional services.
Cargo. The 19.8% decrease in cargo revenues in the nine months ended September 30, 2020 as compared to the same period of 2019 was primarily due to reductions in our capacity of flights as result of the COVID-19 pandemic, which in turn resulted in a lower volume of cargo operations.
Non-derivative financial instruments. Non-derivative financial instruments loss increased 197.7 million in the nine months ended September 30, 2020 as compared to the same period of 2019, primarily due to the 14.4% depreciation of the peso against the U.S. dollar at the end of the period as compared to the exchange rate at the end of the same period of 2019.
6
Operating Expenses, net
| For the nine month periods ended September 30, | ||||||||||||||||
| 2019 | 2020 | Variation | ||||||||||||||
| (In thousands of pesos, except for %) | ||||||||||||||||
| Other operating income | (264,118 | ) | (568,169 | ) | (304,051 | ) | >100 | % | ||||||||
| Fuel expense, net | 8,653,888 | 4,613,905 | (4,039,983 | ) | (46.7 | )% | ||||||||||
| Landing, take-off and navigation expenses | 3,724,625 | 2,942,623 | (782,002 | ) | (21.0 | )% | ||||||||||
| Depreciation of right of use assets | 3,522,130 | 3,751,958 | 229,828 | 6.5 | % | |||||||||||
| Salaries and benefits | 2,647,710 | 2,470,210 | (177,500 | ) | (6.7 | )% | ||||||||||
| Sales, marketing and distribution expenses | 1,038,344 | 1,505,708 | 467,364 | 45.0 | % | |||||||||||
| Maintenance expenses | 1,128,348 | 714,038 | (414,310 | ) | (36.7 | )% | ||||||||||
| Aircraft and engine variable lease expenses | 768,592 | 1,337,873 | 569,281 | 74.1 | % | |||||||||||
| Other operating expenses | 948,129 | 869,463 | (78,666 | ) | (8.3 | )% | ||||||||||
| Depreciation and amortization | 467,694 | 649,762 | 182,068 | 38.9 | % | |||||||||||
| Total operating expenses, net | 22,635,342 | 18,287,371 | (4,347,971 | ) | (19.2 | )% | ||||||||||
Total operating expenses, net decreased 19.2% in the nine months ended September 30, 2020 as compared to the same period of 2019 primarily as a result of reductions in operations caused by the COVID-19 pandemic and other factors described below.
Other Operating Income. Other operating income increased Ps. 304.1 million in the nine months ended September 30, 2020 as compared to the same period of 2019, primarily due to higher sale and leaseback gains recorded during the nine months ended September 2020 compared to the same period of the prior year.
Fuel expense, net. The 46.7% decrease in fuel expense in the nine months ended September 30, 2020 as compared to the same period of 2019 was primarily as a result of a decrease in the average fuel cost per gallon of 11.6% and a decrease in fuel gallons consumed of 35.7% which, in turn, was primarily due to fewer aircraft in operation, a 35.6% decrease in our departures and the decline of average oil and gasoline prices worldwide.
During the nine months ended September 30, 2020 and 2019, we entered into Asian Zero-Cost collar options and Asian call options contracts, which are contracts designated to hedge our projected fuel consumption. These instruments also qualify for hedge accounting. As a result, during the nine months ended September 30, 2020, their intrinsic value loss of Ps. 637.6 million was incorporated into the cost of fuel.
Landing, Take-off and Navigation Expenses. The 21.0% decrease in landing, take-off and navigation expenses in the nine months ended September 30, 2020 as compared to the same period of 2019 was primarily due to a decrease in our operations as measured by number of departures, which decreased by 35.6%. Additionally, we decreased the number of airports we served and observed a decline in number of passengers transported as a result of the COVID-19 pandemic.
Depreciation of right of use assets. The 6.5% increase in depreciation of right of use assets in the nine months ended September 30, 2020 as compared to the same period of 2019 was primarily due to an increase of our fleet, as we incorporated four new net aircraft and four new net engine leases during the period.
Salaries and Benefits. The 6.7% decrease in salaries and benefits in the nine months ended September 30, 2020 as compared to the same period of 2019, was primarily the result of a decrease of 0.7% in our total number of employees during the period. Additionally, the variable compensation of our workforce decreased primarily due to lower operations and block hours recorded during the period and the accounting accrual impact of our management retention plans. This decrease was partially offset by our annual salary increase.
Sales, Marketing and Distribution Expenses. The 45.0% increase in sales, marketing and distribution expenses in the nine months ended September 30, 2020 as compared to the same period of 2019 was mainly due to a one-time charge recorded during the nine months ended September 30, 2020 relating to an adjustment made on the Mexican northern border value added tax rate.
7
Maintenance Expenses. The 36.7% decrease in maintenance expenses in the nine months ended September 30, 2020 as compared to the same period of 2019 was mainly due to reductions in required maintenance tasks as a result of the decrease in operations and flight hours resulting from the COVID-19 pandemic. This decrease was partially offset by the depreciation of approximately 13.1% in the average exchange rate of the peso against the U.S. dollar during the nine months ended September 30, 2020 as compared to the same period of 2019, given that some of our maintenance expenses are denominated in U.S. dollars.
Aircraft and engine variable lease expenses. The 74.1% increase in aircraft and engine variable expenses in the nine months ended September 30, 2020 as compared to the same period of 2019 was primarily due to redelivery costs and the depreciation of approximately 13.1% in the average exchange rate of the peso against the U.S. dollar during the nine months ended September 30, 2020 as compared to the same period of 2019, given that the majority of these expenses are denominated in U.S. dollars.
Other Operating Expenses. The 8.3% decrease in other operating expenses in the nine months ended September 30, 2020 as compared to the same period of 2019 was mainly due to reductions in passenger services and other expenses as a result of reductions in our overall operations due to the COVID -19 pandemic. This decrease was partially offset by an increase in other operating expenses on a U.S. dollar basis due to the depreciation of approximately 13.1% in the average exchange rate of the peso against the U.S. dollar during the nine months ended September 30, 2020 as compared to the same period of 2019, given that some of these expenses are denominated in U.S. dollars.
Depreciation and Amortization. The 38.9% increase in depreciation and amortization in the nine months ended September 30, 2020 as compared to the same period of 2019 was primarily due to higher amortization of major maintenance events associated with the aging of our fleet. The cost of the major maintenance events is accounted for under the deferral method. During the nine months ended September 30, 2020 and 2019, we recorded amortization of major maintenance leasehold improvements of Ps. 463.1 million and Ps. 316.2 million, respectively.
Operating Results
| For the nine month periods ended September 30, | ||||||||||||||||
2019 | 2020 | Variation | ||||||||||||||
| (In thousands of pesos, except for %) | ||||||||||||||||
| Operating Results | ||||||||||||||||
| Total operating revenues | 25,023,410 | 14,074,027 | (10,949,383 | ) | (43.8 | )% | ||||||||||
| Total operating expenses, net | 22,635,342 | 18,287,371 | (4,347,971 | ) | (19.2 | )% | ||||||||||
| Operating income (loss) | 2,388,068 | (4,213,344 | ) | (6,601,412 | ) | N.M. | ||||||||||
Operating (loss) income. As a result of the factors outlined above, our operating loss was Ps. 4,213 million in the nine months ended September 30, 2020, a decrease of Ps. 6,601 million compared to our operating income of Ps. 2,388 million in the nine months ended September 30, 2019.
Financial Results
| For the nine months ended September 30, | ||||||||||||||||
| 2019 | 2020 | Variation | ||||||||||||||
| (In thousands of pesos, except for %) | ||||||||||||||||
| Financing Results | ||||||||||||||||
| Finance income | 152,608 | 93,108 | (59,500 | ) | (39.0 | )% | ||||||||||
| Finance cost | (1,594,394 | ) | (2,523,404 | ) | (929,010 | ) | 58.3 | % | ||||||||
| Exchange gain (loss), net | 984,747 | (418,751 | ) | (1,403,498 | ) | N.M. | ||||||||||
| Total financing results | (457,039 | ) | (2,849,047 | ) | (2,392,008 | ) | >100 | % | ||||||||
8
Total Financing Results. The significant increase in our total financing loss in the nine months ended September 30, 2020 as compared to the nine months ended September 30, 2019 was primarily due to our foreign exchange loss.
During the nine months ended September 30, 2020, we recorded an exchange loss of Ps. 418.8 million, which resulted from the 14.4% depreciation of the peso against the U.S. dollar at the end of the period as compared to the exchange rate at the end of the same period of the prior year, since we maintained a net monetary liability position of U.S. $1.8 billion in the nine months ended September 30, 2020. Our U.S. dollar net monetary liability position mainly resulted from the value of our lease liabilities and financial debt. Additionally, our finance income decreased by Ps. 59.5 million, mainly due to a decrease in our short-term investments as a result of a lower level of cash during the nine months ended September 30, 2020 as compared to the same period of 2019. Our finance cost increased by Ps. 929.0 million, mainly due to an increase in our lease financial cost related to the recognition of IFRS 16, interest paid on our asset backed trust notes and ineffective derivative financial instruments.
Income Tax Expense and Net Income
| For the nine months ended September 30, | ||||||||||||||||
| 2019 | 2020 | Variation | ||||||||||||||
| (In thousands of pesos, except for %) | ||||||||||||||||
| Net income (loss) | ||||||||||||||||
| Income (loss) before income tax | 1,931,029 | (7,062,391 | ) | (8,993,420 | ) | N.M. | ||||||||||
| Income tax (expense) benefit | (579,309 | ) | 1,871,534 | 2,450,843 | N.M. | |||||||||||
| Net income (loss) | 1,351,720 | (5,190,857 | ) | (6,542,577 | ) | N.M. | ||||||||||
We recorded a net loss of Ps. 5.2 billion in the nine months ended September 30, 2020 compared to a net income of Ps. 1.4 billion in the nine months ended September 30, 2019. During the nine months ended September 30, 2020 and 2019, we recorded a tax benefit (expense) of Ps. 1.9 billion and Ps. (579.3) million, respectively. At September 30, 2020, our tax loss carry-forwards amounted to Ps. 1.3 billion, as compared to Ps. 1.6 billion at September 30, 2019.
The effective tax rate during the nine months ended September 30, 2020 and 2019 was 26.5% and 30.0%, respectively.
Liquidity
Our primary source of liquidity is cash provided by operations, with our primary uses of liquidity being working capital and capital expenditures.
For the nine months ended September 30, | ||||||||
| 2019 | 2020 | |||||||
| (In thousands of pesos) | ||||||||
| Net cash flows provided by operating activities | 7,464,746 | 3,289,563 | ||||||
| Net cash flows used in investing activities | (1,279,621 | ) | (144,515 | ) | ||||
| Net cash flows used in financing activities | (4,238,918 | ) | (4,405,049 | ) | ||||
In recent years, we have been able to meet our working capital requirements through cash from our operations. Our capital expenditures consist primarily of the acquisition of flight equipment, including pre-delivery payments for aircraft acquisitions. From time to time, we finance pre-delivery payments related to our aircraft with revolving lines of credit with the commercial banks. We have obtained committed financing for pre-delivery payments in respect of all the aircraft to be delivered through 2022.
9
Our cash and cash equivalents increased by Ps. 221.6 million, from Ps. 8.0 billion at December 31, 2019 to Ps. 8.2 billion at September 30, 2020. At September 30, 2020, we had available credit lines totaling Ps. 10.0 billion, of which Ps. 7.3 billion were related to financial debt and Ps. 2.7 billion were related to letters of credit (and of which Ps. 1.7 billion were undisbursed). At December 31, 2019, we had available credit lines totaling Ps. 9.0 billion, of which Ps. 6.6 billion were related to financial debt and Ps. 2.4 billion were related to letters of credit (and of which Ps. 86.1 million were undisbursed).
At November 30, 2020, we had available credit lines totaling Ps. 9.3 billion, of which Ps. 6.9 billion were related to financial debt and Ps. 2.4 billion were related to letters of credit (and of which Ps. 1.8 billion were undisbursed).
We have an investment policy to optimize the performance and ensure availability of, and minimize the risk associated with, the investment of cash, cash equivalents and short-term investments. Such policy provides for guidelines regarding minimum balance, currency mix, instruments, deadlines, counterparties and credit risk. At September 30, 2020, 97% of our cash, cash equivalents and short-term investments were denominated in U.S. dollars and 3% were denominated in pesos.
Net cash flows provided by operating activities. We rely primarily on cash flows from operating activities to provide working capital for current and future operations. Net cash flows provided by operating activities totaled Ps. 3.3 billion and Ps. 7.5 billion in the nine months ended September 2020 and 2019, respectively. Our net cash flows decreased primarily due to the COVID-19 pandemic effects which impacted our operating cash flows. Additionally, we recorded a significant increase in guarantee deposits as compared to the nine months ended September 30, 2019, which in turn increased due to an increase in collateral deposits.
Net cash flows used in investing activities. During the nine months ended September 30, 2020, net cash flow used in investing activities totaled Ps. 0.1 billion, which consisted primarily of pre-delivery payments for aircraft and engine acquisitions totaling Ps. 1.4 billion, partially offset by pre-delivery payment reimbursements totaling Ps. 1.0 billion. Additionally, we recorded other capital expenditures relating to aircraft parts and rotable spare parts acquisitions, intangible assets and major maintenance costs, net of disposals of Ps. 0.3 billion.
During the nine months ended September 2019, net cash flow used in investing activities totaled Ps. 1.3 billion, which consisted primarily of pre-delivery payments for aircraft and engine acquisitions totaling Ps. 0.5 billion, partially offset by pre-delivery payment reimbursements totaling Ps. 0.7 billion. Additionally, we recorded other capital expenditures relating to aircraft parts and rotable spare parts acquisitions, intangible assets and major maintenance costs, net of disposals of Ps. 1.5 billion.
Net cash flow used in financing activities. During the nine months ended September 30, 2020, net cash flows used in financing activities totaled Ps. 4.4 billion, which consisted primarily of payments of the principal portion of lease liabilities of Ps. 4.3 billion (aircraft and spare engine rent payment), payments of financial debt related to the aircraft financing pre-delivery payments for a net amount of Ps. 1.1 billion and interest paid of Ps. 0.2 billion, which were partially offset by proceeds from disbursements under our revolving credit facility with Banco Santander and Bancomext of Ps. 1.3 billion. As of September 30, 2020, Ps. 4.1 billion was outstanding under this revolving credit facility.
During the nine months ended September 30, 2019, net cash flows used in financing activities totaled Ps. 4.2 billion, which consisted primarily of payments of the principal portion of lease liabilities of Ps. 4.8 billion (aircraft and spare engine rent payments), payments of financial debt related to the aircraft financing pre-delivery payments for a net amount of Ps. 0.7 billion, payments of working capital credit lines of Ps. 0.4 billion and interest paid of Ps. 0.1 billion, which were partially offset by proceeds from our asset backed trust notes (CEBUR) of Ps. 1.4 billion, which take into account amortized transaction costs and proceeds from disbursements under our revolving credit facility with Banco Santander and Bancomext of Ps. 0.4 billion. This credit facility provides for certain covenants, including limits on our ability to, among others, incur debt above a specified debt basket unless certain financial ratios are met. Due to the effects of the COVID-19 pandemic, we started negotiations with Banco Santander and Bancomext in order to amend the schedule for financing of PDPs and the grant of a waiver to one of the financial ratio covenants. On July 3, 2020, we, Banco Santander and Bancomext executed an amendment to the schedule for financing of PDPs. In addition, we requested a waiver of the financial ratio covenant that requires that our net debt to EBITDAR ratio be less than or equal to 6.5x from the banks and received one dated October 23, 2020, covering the third and fourth quarters of 2020 and the first and second quarters of 2021. Nonetheless, we can offer no assurance we will continue to be in compliance with such covenant after the waiver ends or whether our creditors would continue to grant an additional waiver beyond the current agreed dates.
10