 Investor Presentation February 2013 Financial data as of September 30, 2012 Exhibit 99.1 |
 Forward Looking Statements 1 Any statements in this presentation that are not historical or current facts are forward-looking statements. Forward-looking statements include, without limitation, statements concerning plans, objectives, goals, projections, strategies, future events or performance, and underlying assumptions and other statements, which are not statements of historical facts. Forward-looking statements convey Nationstar Mortgage Holdings Inc.’s (“Nationstar”) current expectations or forecasts of future events. When used in this presentation, the words “anticipate,” “appears,” “believe,” “foresee,” “intend,” “should,” “expect,” “estimate,” “target,” “project,” “plan,” “may,” “could,” “will,” “are likely” and similar expressions are intended to identify forward-looking statements. These statements involve predictions of our future financial condition, performance, plans and strategies, and are thus dependent on a number of factors including, without limitation, assumptions and data that may be imprecise or incorrect. Specific factors that may impact performance or other predictions of future actions have, in many but not all cases, been identified in connection with specific forward-looking statements. Forward-looking statements involve known and unknown risks, uncertainties and other factors that may cause Nationstar’s actual results, performance or achievements to be materially different from any future results, performances or achievements expressed or implied by the forward-looking statements. Certain of these risks and uncertainties are described in the “Risk Factors” section of Nationstar Mortgage LLC’s Form 10-K for the year ended December 31, 2011, Nationstar Mortgage Holdings Inc.’s Form 10-Q for the quarter ended September 30, 2012, and other reports filed with the SEC, which are available at the SEC’s website at http://www.sec.gov. We caution you not to place undue reliance on these forward-looking statements that speak only as of the date they were made. Unless required by law, Nationstar undertakes no obligation to publicly update or revise any forward-looking statements to reflect circumstances or events after the date of this presentation. |
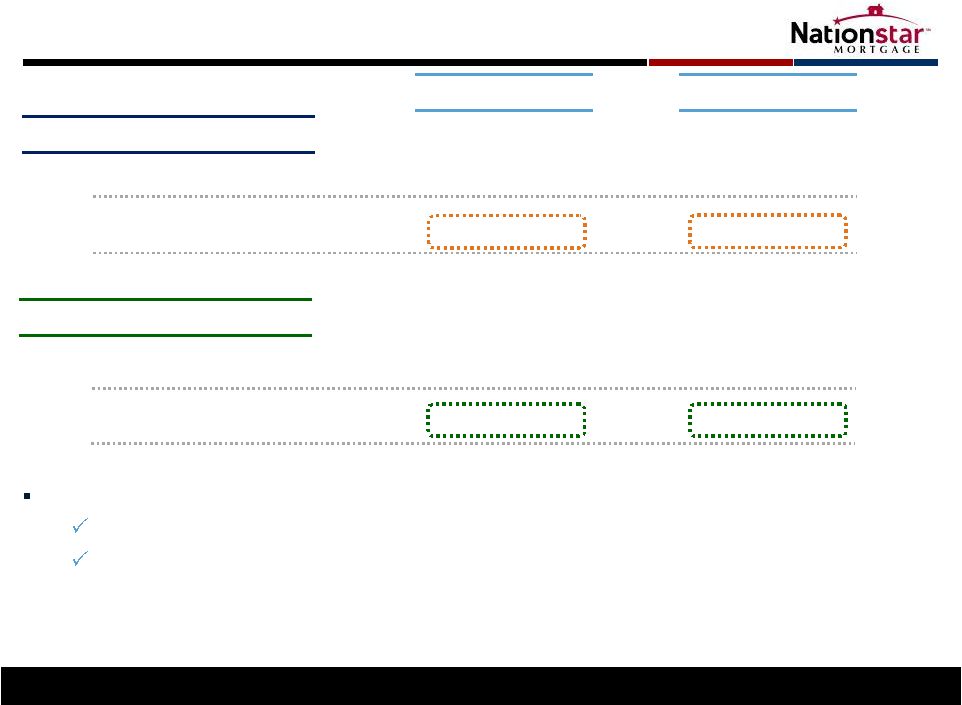
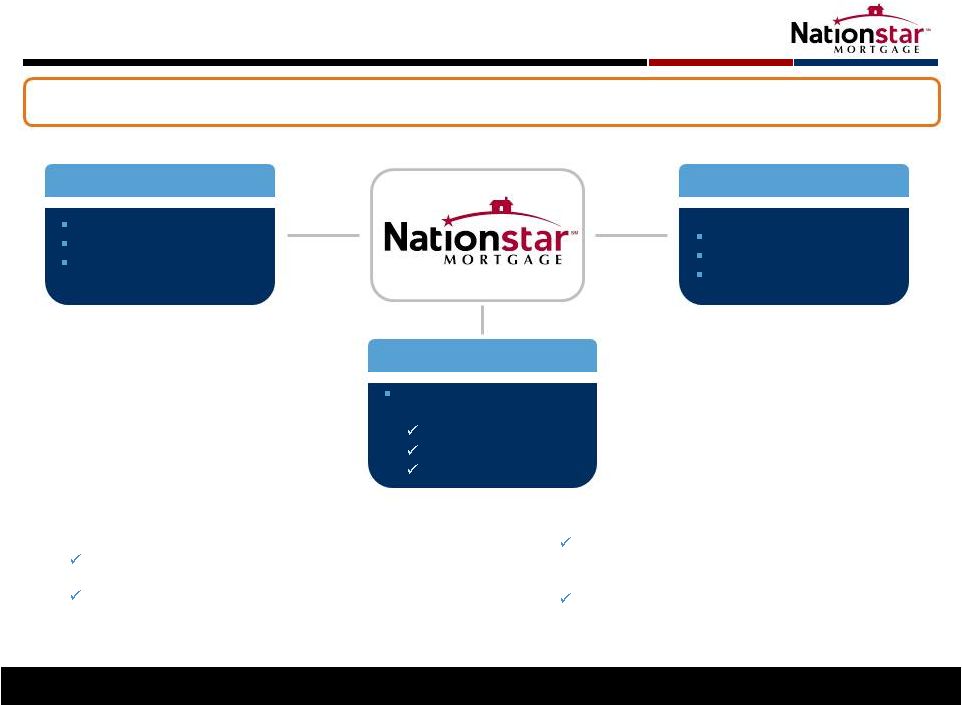 Our Business 1) Proforma UPB and customers include Q3 ‘12 end of period UPB, $13B UPB BofA acquisition closed in Q4 ’12, and ~$215B UPB acquired portfolio. Acquired portfolio transfers to occur as investor and other third-party approvals are received 2) Annual origination run-rate based on Q3’12 annualized 3) As of February 8, 2013 $425B of UPB (1) Service 2.5MM+ customers (1) Focused on asset performance and credit risk management Servicing Originations 2 A leading services provider to the residential mortgage market Economics across mortgage lifecycle Settlement Processing Asset management Solutionstar Corporate Highlights: Established in 1994 as a division of Centex Homes Sold to funds managed by Fortress Investment Group in 2006 Publicly traded (NYSE: NSM) with market capitalization of over $3.3B (3) Over 4,900 total employees $7.2B annual production (2) Agency and government Servicing substantially retained |
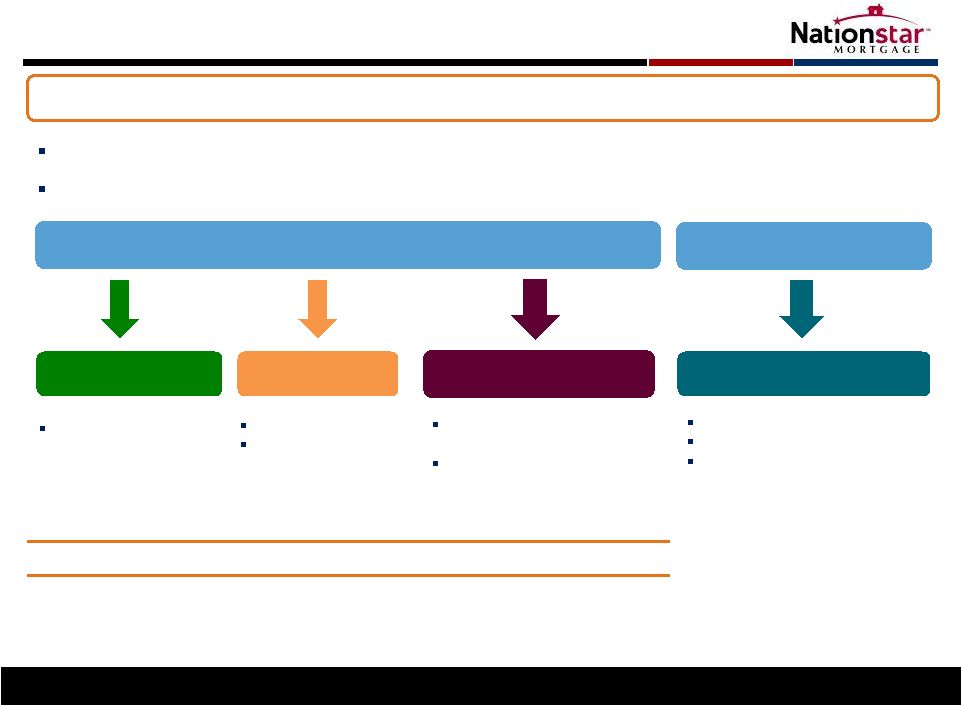
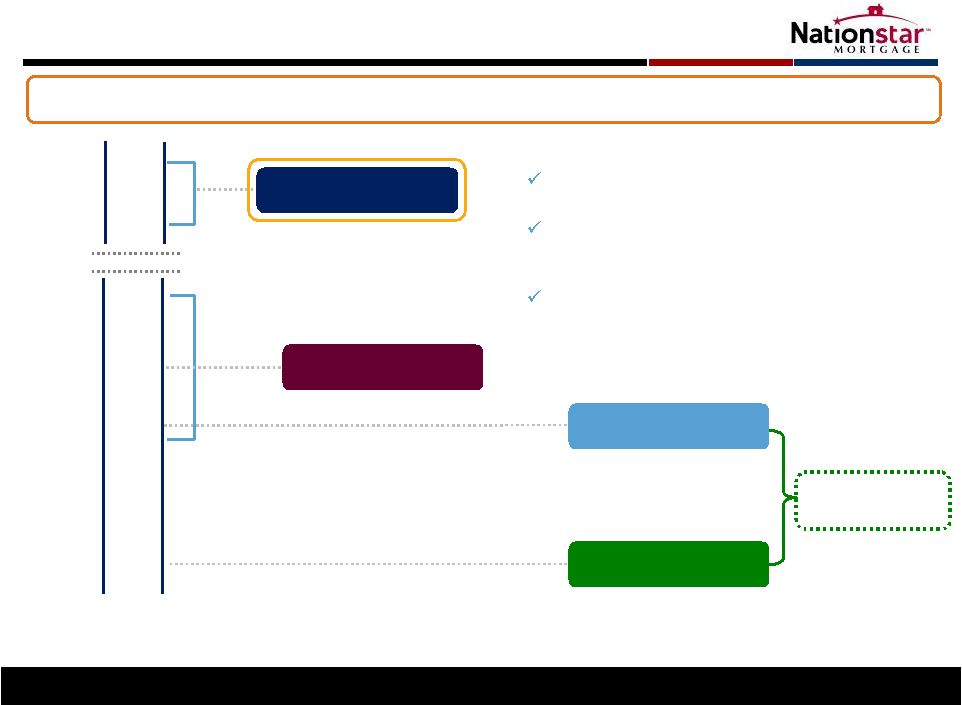
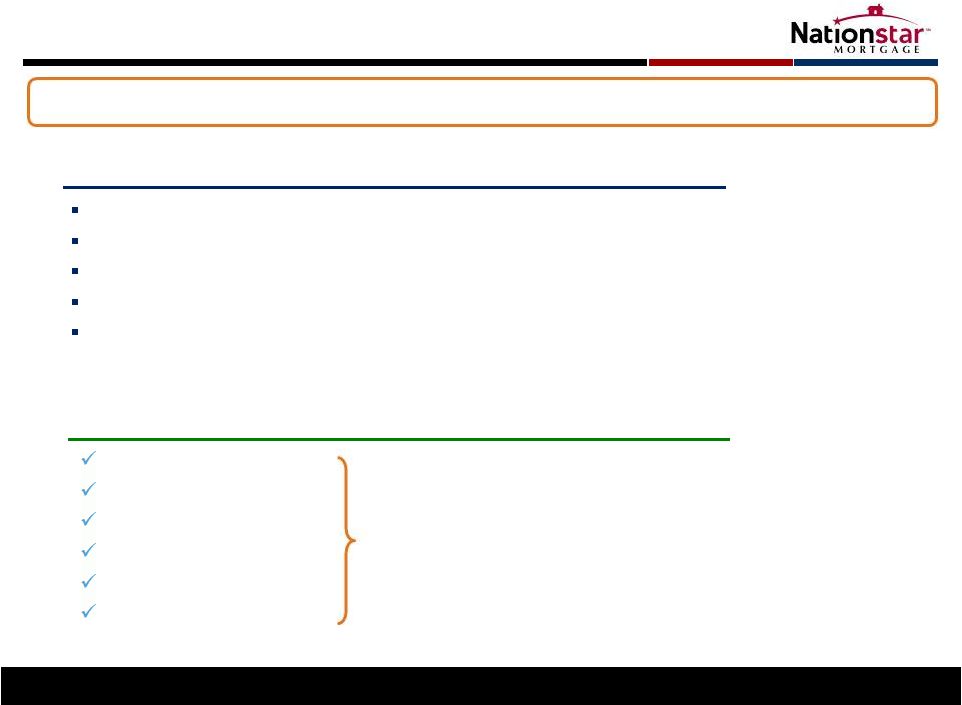 Nationstar: Residential Services Provider Focus on core customers Shedding non-core assets Capital constraints and pressures Legal, regulatory, headline risk Need for regulatory solutions 3 …Creating a Need for a Strategic Service Partner Financial Institutions Re-evaluating Their Mortgage Business Models… Complete outsourcing Credit risk management Origination/fulfillment Default servicing Core/non-core servicing Solutionstar Multiple Fee-Based Revenue Streams Long-term partner of choice to financial institutions |
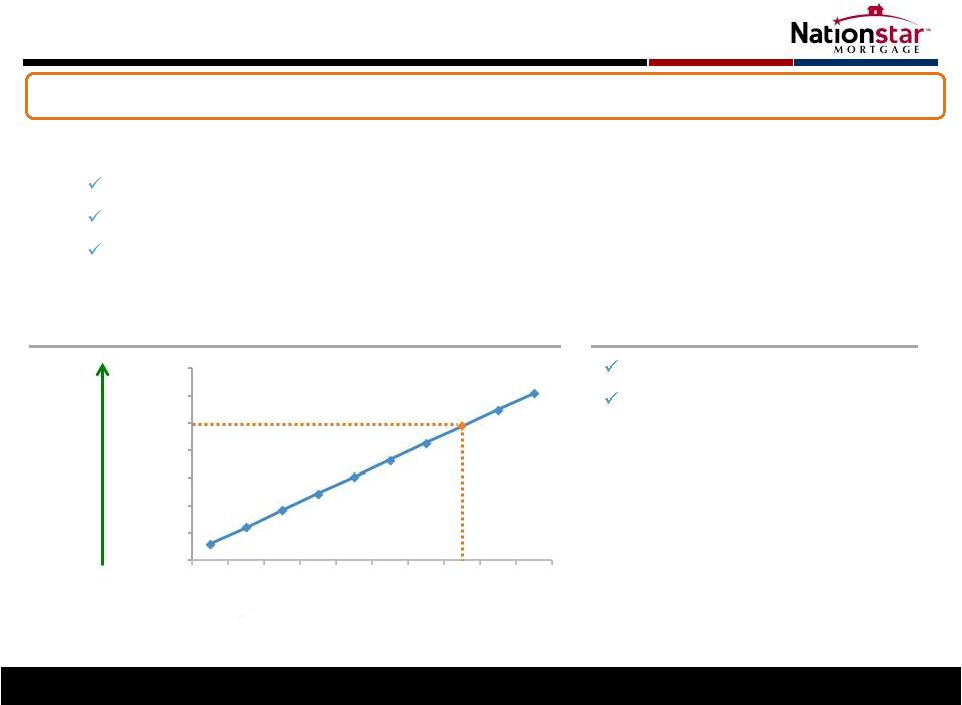
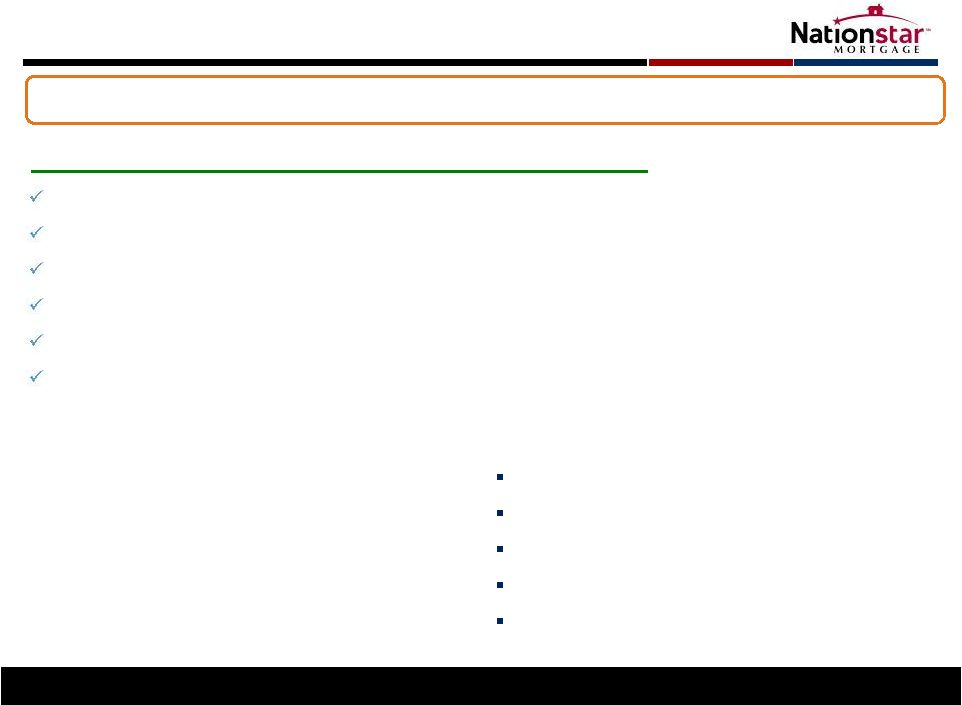 Nationstar: Residential Services Provider Highly dependent on economic cycle Capital intensive Credit exposure Single source of income Transaction focus 4 Nationstar model designed to outperform in all markets… …Traditional mortgage banking model Fee-based income in all environments Capital-light growth model Minimal credit risk; loans sold into secondary market Debt facilities not linked to mark-to-market swings Broad array of services to consumers, credit investors, financial institutions Customer focus Diverse revenue streams, strong cash flows, sustainable platform leads to higher valuation Versus |
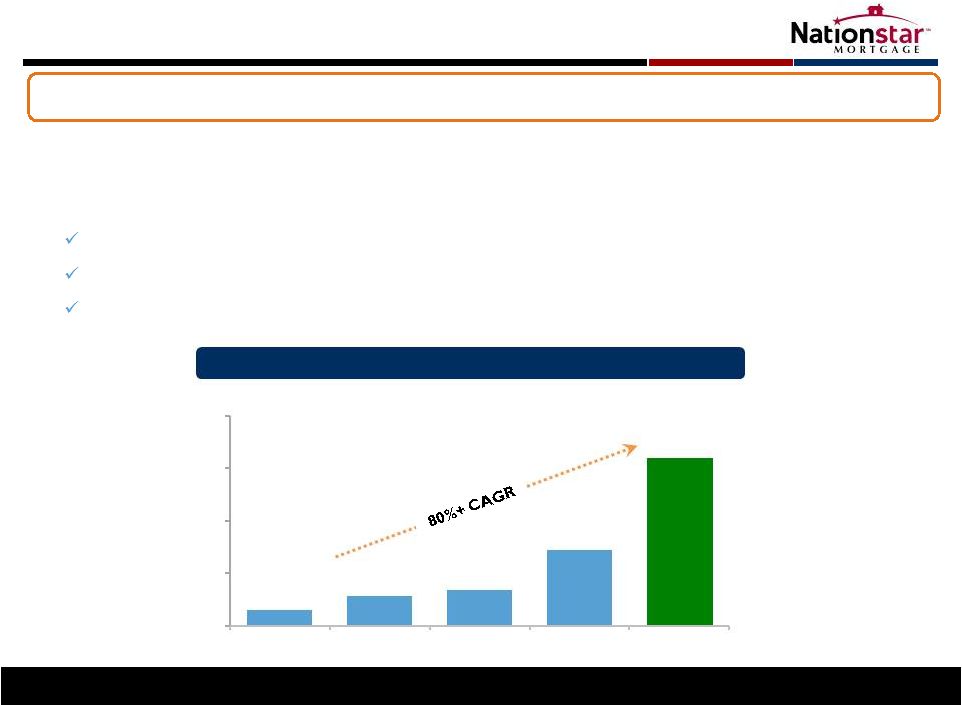
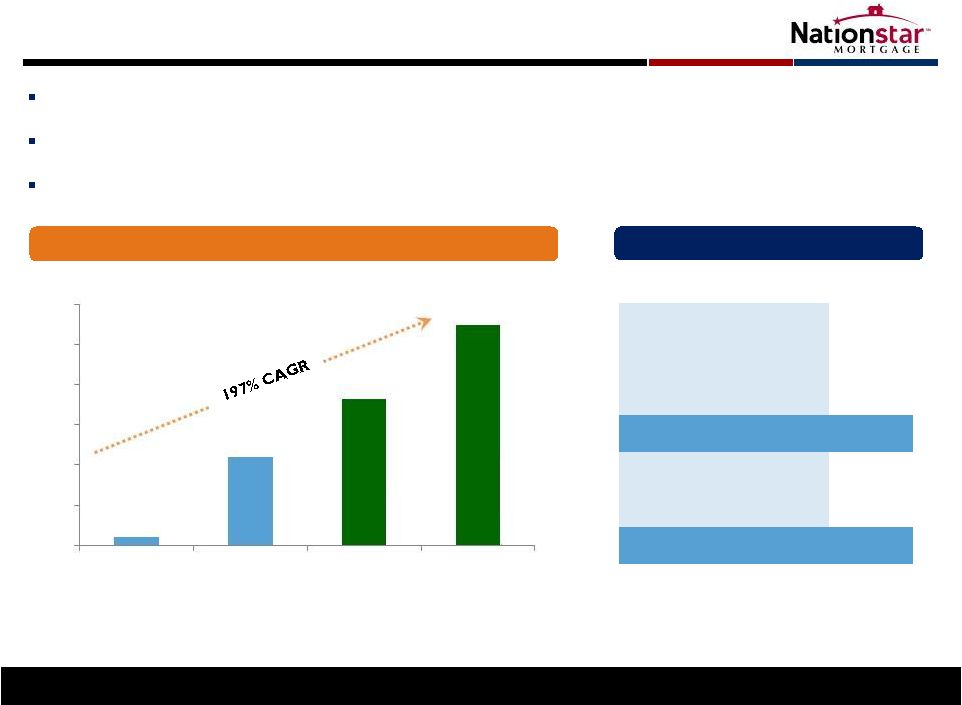 BofA Portfolio Acquisition – Landmark Acquisition 5 5 1) Balances as of Nov. 30, 2012; balances may change prior to closing due to normal portfolio run-off 2) Proforma UPB includes Q3 ‘12 end of period UPB, $13B UPB BofA acquisition closed in Q4 ’12, and ~$215B UPB acquired portfolio. Acquired portfolio transfers to occur as investor and other third-party approvals are received 3) Please refer to Endnotes for information regarding 2013E and 2014E Net Income; CAGR and bar chart amounts for 2013E and 2014E represent midpoint of ranges for proforma combined Company Acquiring $215B (1) servicing book; proforma UPB of $425B (2) ; 1.3MM new customers Capture multiple revenue streams driving profitability over entire economic cycle Significant earnings accretion expected Net Income Growth (3) $ in millions Deal Summary $ in millions $ UPB $215,000 MSRs $1,345 Servicing Advances $5,800 Total Assets $7,145 MSR Price (bps) 63 Average Servicing Fee (bps) 33 MSR Purchase Multiple 1.9x $21 $220 $335 - $395 $510 - $590 0 100 200 300 400 500 600 2011 Q3'12 RR 2013E 2014E |
 Earnings Estimates 1) Assumes 90.7 million shares outstanding 2) Please refer to Endnotes for information regarding 2013E and 2014E AEBITDA, Net Income and EPS 6 Acquisition highly accretive 2013 estimates reflect year-one portfolio ramp and integration 2014 estimates reflect fully ramped earnings power of the Company AEBITDA per share (1)(2) Earnings per share (1)(2) 2013E 2014E Acquired Portfolio Total Company Estimate Acquired Portfolio Total Company Estimate $2.20 - $2.55 $9.50 - $11.05 $4.65 - $5.40 $12.30 - $14.30 $0.70 - $0.80 $3.70 - $4.35 $2.30 - $2.70 $5.60 - $6.50 |
 Future Growth Opportunities (1) Servicing Originations Bulk Servicing (2) Flow Servicing Channel Development MSRs and subservicing Multiple lenders Already executed agreements ~ $10B for ‘13 KB Home/Builder Wholesale Correspondent Potential Opportunity Size: Macro-thesis of secular shift remains intact; legal, regulatory and headline risk for banks persists Growth of customer base presents opportunity for expansion of Solutionstar Solutionstar 2.5 million customers in servicing portfolio (3) Multiple fee-based opportunities 7 1) The identified opportunities referenced above are not currently serviced by the Company and there can be no assurance that these potential servicing transactions will ultimately be consummated, or will remain the same size. Notwithstanding the above, it is possible that these potential servicing transactions, if consummated, could result in a partial or total loss of any invested capital 2) All pipeline deals are under a signed non-disclosure agreement between Nationstar and the counter-party 3) Proforma UPB and customers include Q3 ‘12 end of period UPB, $13B BofA acquisition closed in Q4 ’12, and ~$215B acquired portfolio. Acquired portfolio transfers to occur as investor and other third-party approvals are received Pipeline of opportunities remains elevated for the foreseeable future $300 billion+ $25-50 billion annually $425 billion portfolio (3) |
 Servicing Profitability Ramp 8 Expense Reduction (bps) EPS Impact $0.30 EPS per 1 bps improvement in servicing expenses 1) Notes to replace $300 million in existing Agency servicing advance facilities that carried a weighted average floating rate of Libor plus 2.86%, or 3.10% in total, resulting in a reduction in rate of 1.65% as of Jan. 24, 2013 2) For illustrative purposes only. This illustration uses assumptions that affect results shown, including assumptions that are based on factors that are beyond NSM’s control. Actual results could differ from this illustration. Assumes 90.7 million shares outstanding; marginal tax rate of 35% Illustrative Cost Reduction Example (2) Targeting 8 bps servicing expense reduction by Q3 ‘14 Assumptions $2.50 8 $0.00 $0.50 $1.00 $1.50 $2.00 $3.00 $3.50 1 2 3 4 5 6 7 9 10 Multiple initiatives underway: Cost per loan: Strategic sourcing of non-customer facing functions Portfolio performance: Reduced Aurora 60+ DQ rate by 250 bps since boarding Reduce advance costs: $300MM GSE advance securitization (reducing funding cost by >1.65%) (1) Opportunity for non-agency securitizations (significant potential savings) Servicing portfolio: $425B Targeted Improvement: 8 bps |
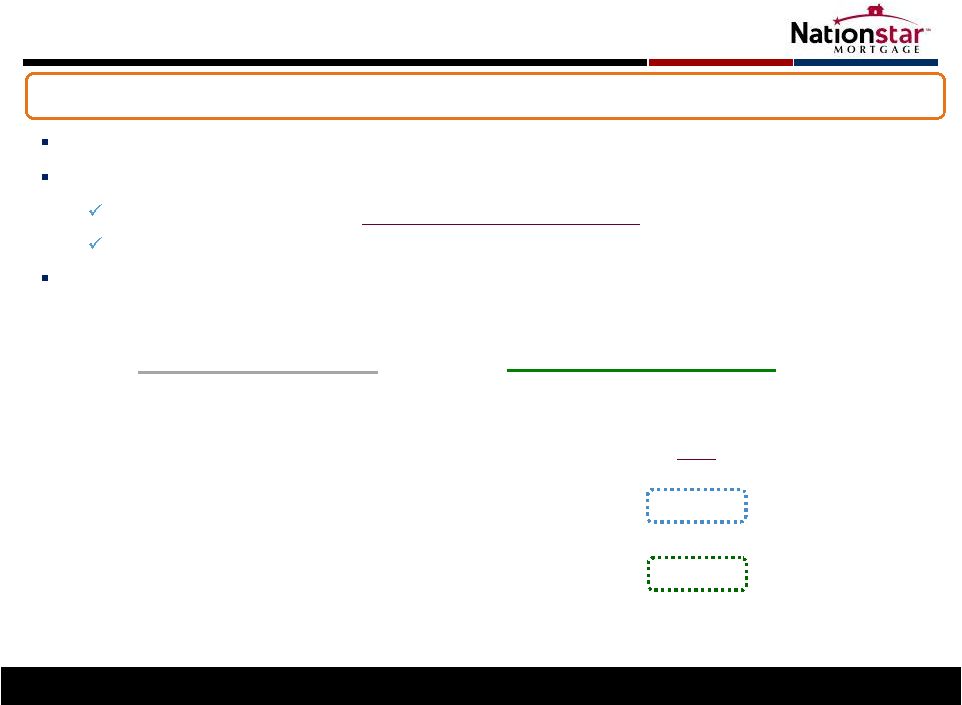 Advance Securitization: Significant Earnings Catalyst 9 1) Notes to replace $300 million in existing Agency servicing advance facilities that carried a weighted average floating rate of Libor plus 2.86%, or 3.10% in total, resulting in a reduction in rate of 1.65% as of Jan. 24, 2013 2) For illustrative purposes only. This illustration uses assumptions that affect results shown, including assumptions that are based on factors that are beyond NSM’s control. Actual results could differ from this illustration. Assumes 90.7 million shares outstanding; marginal tax rate of 35% Attractive asset class from a credit and cash flow perspective $300 million agency advance securitization executed in January ‘13 Blended average rate of 1.46%; reduction of funding cost by 1.65% (1) Fixed rate at historic lows; high investor demand with deal over-subscribed Approximately $7.5 billion of advance receivables after BofA closings Emerging asset class drives reduction in interest expense Advances (as of 9/30) Advance Balances post BofA Balances: WA Rate: Rate Type: Est. Annual Expense: Balances: $1.9B Potential Savings (2) : Potential EPS Benefit (2) : 1.00% $7.5B $0.54 Floating Rate Type: Fixed 3.65% ~$70MM |
 Originations: Enhances Core Servicing Platform 10 ($bn of UPB) Capitalize on market dislocation; wide margins & limited supply 1) 2012 data as of September 30, 2012 Origination Volume $1.5 $2.8 $3.4 $7.2 $16.0+ 0 5 10 15 20 2009 2010 2011 Q3 '12 Ann. 2013E Primary Strategy: Recapture of refinanced Nationstar loans Cash flow-positive, cost-effective creation of servicing assets 2013/2014 Objectives: HARP: Exhaust portfolio of HARP/recapture opportunities to capitalize on margin premium Build Out Channels: Wholesale, correspondent, direct-to-consumer Builder: Execute additional ventures with homebuilders; set stage for return of purchase money (1) |
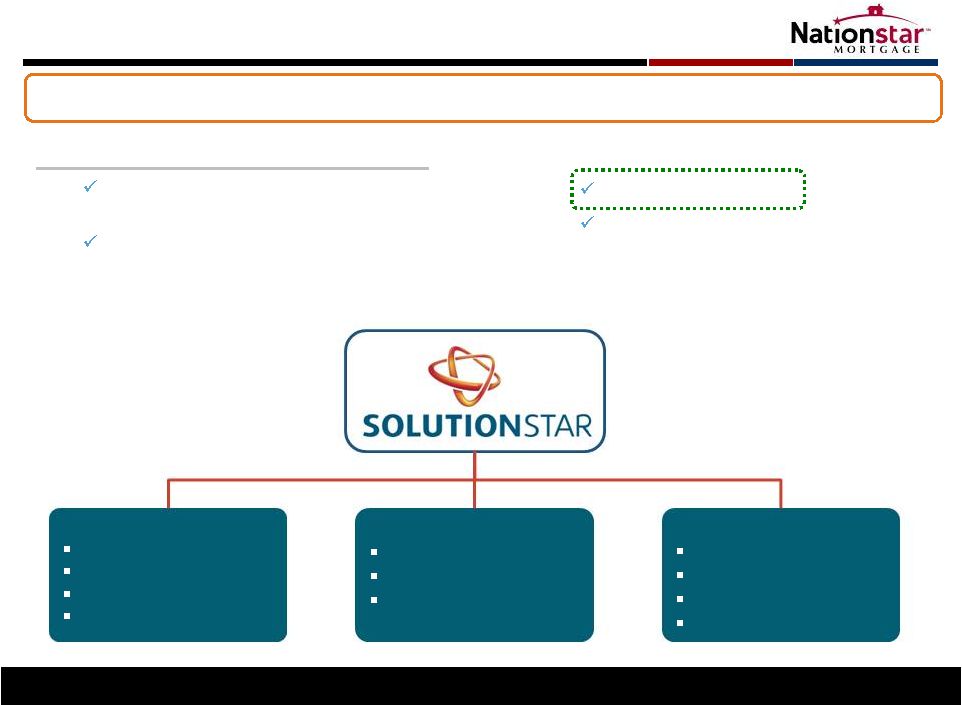 Solutionstar 2013 Expectations: $200 million in revenue 15% of revenue from 3 party customers 11 Processing Real Estate Settlement Opportunity to capture economics across the entire mortgage lifecycle Acquired Equifax Settlement Services on 2/7/13 Leading provider of appraisal, title insurance and settlement services Broad array of blue chip clients; largest financial institutions in the country rd Claims Processing FCL Processing BK Processing Recovery Services Closing Services Title Services Valuation Services Field Services Brokerage REO and SPO Auctions Traditional REO |
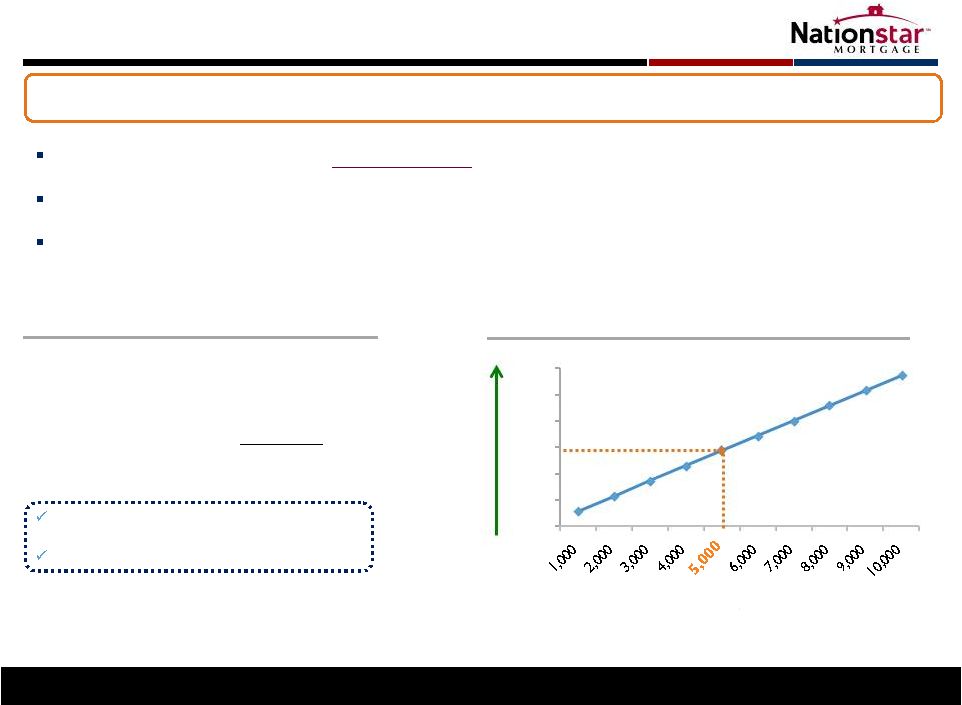 Illustrative Example: Solutionstar Earnings Lever 12 Technology-based solutions generate significant earnings opportunities Large-scale REO activity with nearly 16,000 properties in portfolio (1) Attractive, capital-light, fee-based earnings stream linked to UPB growth Similar business models generate 20%+ pre-tax margins # of REO Sales EPS Impact $0.01 EPS per 1% improvement in net fee $0.06 EPS per 1,000 increase in unit sales Illustrative REO Example Sample Economics – REO Dispositions (2) $0.30 1) As of September 30, 2012 2) For illustrative purposes only. This illustration uses assumptions that affect results shown, including assumptions that are based on factors that are beyond NSM’s control. Actual results could differ from this illustration. Assumes 90.7 million shares outstanding; marginal tax rate of 35% $0.00 $0.10 $0.20 $0.40 $0.50 $0.60 REO sales: 5,000 Avg. balance: $200,000 Net fees: 4% $40MM (1) |
 At Current Levels, NSM Represents Value Proposition 13 ‘14E P/E Multiple 1) Fee-based service peer group of Fidelity National, Old Republic, Lender Processing Services, Corelogic, First American Financial. Average of ‘14 P/E multiples based on share prices as of February 8, 2013 2) Sterne Agee Industry Report, January 10, 2013 3) Peer group consists of OCN and WAC. Average for ‘14 P/E multiple based on share prices as of February 8, 2013 4) Based on February 8, 2013 closing price of $37.36 and mid-point of ’14E EPS guidance of $6.05 NSM Discount - 32% Average for fee-based service providers 12–14x (1) Historical average P/E ratio for mortgage companies has been 8-10x (2) Peers trading at discount to historical multiples for originators/servicers and fee-based providers 6x 7x 8x 9x 10x 12x 14x 8.2x 6.2x Fee-Based Service Providers NSM trading at significant discount to peers, historical valuations Peer Average (3) Nationstar (4) Mortgage Cos. – Historical Average |
 Key Focus 14 Maximize shareholder value via… Strong cash flow generation…. Balanced platform generating diverse fee income in all environments Grow segments that have commanded higher valuations Increased profitability…. Reduce cost per loan and delinquencies, strategic outsourcing Increase originations productivity; reduce time to fund High ROE investment opportunities…. BofA servicing portfolio > 20% IRR (1) Equifax Settlement Services > 20% IRR (1) Capital optimization…. Drive down cost of debt financing Lock-in low cost fixed rate financing for advances 1) Return expectations based on acquisition underwriting. Acquisition underwriting uses assumptions that affect results shown, including assumptions that are based on factors that are beyond NSM’s control. Actual results could differ from the initial underwriting |
 Appendix 7 |
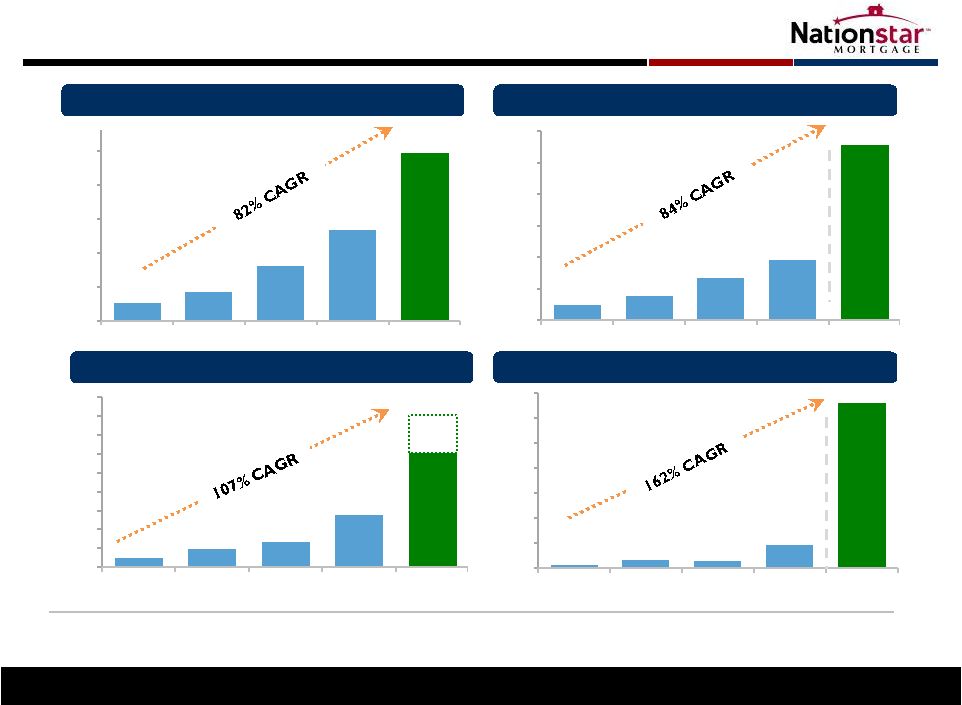 $22 $46 $65 $136 $301 0 50 100 150 200 250 300 350 400 450 2008 2009 2010 2011 2012 Estimate $400+ $21 $34 $64 $107 $198 0 40 80 120 160 200 2008 2009 2010 2011 Q3 '12 $7 $16 $15 $46 $331 0 50 100 150 200 250 300 350 2008 2009 2010 2011 Q3 '12 RR $97 $156 $267 $ 379 $1,108 0 200 400 600 800 1,000 1,200 2008 2009 2010 2011 Q3 '12 RR Focused on Profitable Growth Pre-Tax Income Growth ($mm) (1) UPB Growth ($bn) Revenue Growth ($mm) (1) AEBITDA Growth ($mm) (1)(2) Margin (%) 22% 30% 24% 36% 7% 11% 6% 30% 12% 9M 16 1) Revenue, AEBITDA and pre-tax income from operating segments 2) Please see Endnotes for information on AEBITDA and reconciliations on page 17 |
 AEBITDA Reconciliation 17 1) For operating segments ($ in thousands) Nine Months Ended FY 2008 FY 2009 FY 2010 FY 2011 Q3 ’12 9/30/12 Net Income (loss) $ (157,610) $ (80,877) $ (9,914) $ 20,887 $ 55,067 $ 141,528 Adjust for: Net loss from Legacy Portfolio and Other 164,738 97,263 24,806 24,892 2,874 18,294 Interest expense from unsecured senior notes - - 24,628 30,464 17,656 39,714 Depreciation and amortization 1,172 1,542 1,873 3,395 2,772 5,773 Change in fair value of MSRs 11,701 27,915 6,043 39,000 22,430 42,810 Amortization of mortgage servicing obligations - - - - (2,652) (3,276) Fair value changes on excess spread financing - - - 3,060 (2,213) 5,050 Share-based compensation 1,633 579 8,999 14,764 2,623 11,371 Exit costs - - - 1,836 - - Fair value changes on interest rate swaps - - 9,801 (298) (236) (424) Ineffective portion of cash flow hedge - - (930) (2,032) - - Income tax expense - - - - 24,714 40,639 Adjusted EBITDA (1) $ 21,634 $ 46,422 $ 65,306 $ 135,968 $ 123,035 $ 301,479 |
 Endnotes Pro-forma Earnings Per Share (“Pro-forma EPS”) This disclaimer applies to every usage of pro-forma EPS in this presentation. Pro-forma EPS is a metric that is used by management to exclude certain non-recurring items in an attempt to provide a better earnings per share comparison to prior periods. Pro-forma Q3 ‘12 EPS excludes certain expenses related to ResCap and other transactions. These expenses include the advance hiring of servicing staff, recruiting expenses and travel and licensing expenses. Pro-forma Q2 ‘12 EPS excluded certain expenses incurred in advance of the closing of the Aurora transaction. Pro-forma AEBITDA Per Share This disclaimer applies to every usage of pro-forma AEBITDA per share in this presentation. Pro-forma AEBITDA per share is a metric that is used by management to exclude certain non-recurring items in an attempt to provide a better earnings per share comparison to prior periods. Pro-forma Q3 ‘12 AEBITDA per share excludes certain expenses related to ResCap and other transactions. These expenses include the advance hiring of servicing staff, recruiting expenses and travel and licensing expenses. Pro-forma Q2 ‘12 AEBITDA per share excluded certain expenses incurred in advance of the closing of the Aurora transaction. 2013 Estimate Net Income 2013 Estimate Net Income is based on our expectations of continued growth, current market conditions and increased operating efficiencies in our business in addition to our financial targets for 2013. Our actual Net Income for 2013 on an annualized basis may differ from our 2013(E) Net Income. 2014 Estimate Net Income 2014 Estimate Net Income is based on our expectations of continued growth, current market conditions and increased operating efficiencies in our business in addition to our financial targets for 2014. Our actual Net Income for 2014 on an annualized basis may differ from our 2014(E) Net Income. Adjusted EBITDA (“AEBITDA”) This disclaimer applies to every usage of “Adjusted EBITDA” or “AEBITDA” in this presentation. Adjusted EBITDA is a key performance metric used by management in evaluating the performance of our segments. Adjusted EBITDA represents our Operating Segments' income (loss), and excludes income and expenses that relate to the financing of our senior notes, depreciable (or amortizable) asset base of the business, income taxes (if any), exit costs from our restructuring and certain non-cash items. Adjusted EBITDA also excludes results from our legacy asset portfolio and certain securitization trusts that were consolidated upon adoption of the accounting guidance eliminating the concept of a qualifying special purpose entity ("QSPE“). 2013 Estimate AEBITDA 2013 Estimate AEBITDA is based on our expectations of continued growth, current market conditions and increased operating efficiencies in our business in addition to our financial targets for 2013. Target for all non-GAAP figures excludes the same items as we excluded in our 2011/2012 non-GAAP reconciliation, as follows: income and expenses that relate to the financing of the senior notes, depreciable (or amortizable) asset base and several other relevant items. Our actual AEBITDA for 2013 on an annualized basis may differ from our 2013(E) AEBITDA. 2014 Estimate AEBITDA 2014 Estimate AEBITDA is based on our expectations of continued growth, current market conditions and increased operating efficiencies in our business in addition to our financial targets for 2014. Target for all non-GAAP figures excludes the same items as we excluded in our 2011/2012 non-GAAP reconciliation, as follows: income and expenses that relate to the financing of the senior notes, depreciable (or amortizable) asset base and several other relevant items. Our actual AEBITDA for 2014 on an annualized basis may differ from our 2014(E) AEBITDA. NOTE: 2013 and 2014 Estimate Net Income and 2013 and 2014 Estimate AEBITDA are forward-looking and subject to significant business, economic, regulatory and competitive uncertainties, many of which are beyond the control of Nationstar and its management, and are based upon assumptions with respect to future decisions, which are subject to change. Actual results will vary and those variations may be material. Nothing in this presentation should be regarded as a representation by any person that this target will be achieved and Nationstar undertakes no duty to update this target. 18 |