SkyBridge G II Fund, LLC
Consolidated Schedule of Investments
December 31, 2021 (Unaudited)
| | | | | | | | | | | | | | | | |
| | | First | | | | | | | | | % of | |
| | | Acquisition | | | | | | | | | Shareholders’ | |
| | | Date | | | Cost | | | Fair Value | | | Capital | |
Investments in Investment Funds - ‡ | | | | | | | | | | | | | | | | |
Directional Equity | | | | | | | | | | | | | | | | |
Armistice Capital Offshore Fund Ltd. - b | | | 11/01/2020 | | | $ | 2,521,214 | | | $ | 3,016,602 | | | | 4.76% | |
Coatue Offshore Fund Ltd - b,d | | | 01/01/2021 | | | | 1,850,000 | | | | 1,903,656 | | | | 3.00 | |
Harvest Claro, LLC - c | | | 04/01/2021 | | | | 454,995 | | | | 470,872 | | | | 0.74 | |
Melvin Capital Offshore Ltd - a,h | | | 10/01/2021 | | | | 2,305,000 | | | | 2,360,708 | | | | 3.73 | |
Redmile Capital Offshore Fund, Ltd. - a,b | | | 11/01/2020 | | | | 2,595,000 | | | | 1,919,529 | | | | 3.03 | |
Sand Grove Opportunities Fund Ltd - a,b | | | 03/01/2021 | | | | 2,269,000 | | | | 2,357,340 | | | | 3.72 | |
Soma Offshore Ltd - a,b | | | 04/01/2021 | | | | 822,000 | | | | 674,317 | | | | 1.06 | |
Whale Rock Flagship Fund Ltd - b | | | 11/01/2020 | | | | 2,700,000 | | | | 2,344,325 | | | | 3.70 | |
| | | | | | | | | | | | | | | | |
Total Directional Equity | | | | | | | 15,517,209 | | | | 15,047,349 | | | | 23.74 | |
| | | | | | | | | | | | | | | | |
Directional Macro | | | | | | | | | | | | | | | | |
Galaxy Institutional Ethereum Fund, LP Class B - f,g | | | 07/01/2021 | | | | 459,045 | | | | 743,571 | | | | 1.17 | |
Multicoin Index Fund Offshore SPC - b,d | | | 12/01/2021 | | | | 1,420,000 | | | | 1,152,089 | | | | 1.82 | |
NYDIG Institutional Bitcoin Fund LP - e,f | | | 12/11/2020 | | | | 1,298,879 | | | | 2,373,996 | | | | 3.75 | |
| | | | | | | | | | | | | | | | |
Total Directional Macro | | | | | | | 3,177,924 | | | | 4,269,656 | | | | 6.74 | |
| | | | | | | | | | | | | | | | |
Event Driven | | | | | | | | | | | | | | | | |
Axonic Credit Opportunities Fund L.P. - b | | | 01/01/2014 | | | | 2,142,965 | | | | 2,168,153 | | | | 3.42 | |
Axonic Credit Opportunities Overseas Fund, Ltd. - b | | | 01/01/2016 | | | | 439,736 | | | | 555,863 | | | | 0.88 | |
Medalist Partners Harvest SPV Ltd - c | | | 04/01/2021 | | | | 1,184,650 | | | | 677,707 | | | | 1.07 | |
Mudrick Distressed Opportunity Fund, L.P. - a,b | | | 09/01/2019 | | | | 312,500 | | | | 352,059 | | | | 0.56 | |
Seer Capital Partners Fund L.P. - c | | | 01/01/2014 | | | | 240,120 | | | | 269,295 | | | | 0.42 | |
Seer Capital Partners Offshore Fund Ltd. - c | | | 04/01/2016 | | | | 744,019 | | | | 908,037 | | | | 1.43 | |
Third Point Offshore Fund, Ltd. - b | | | 09/01/2020 | | | | 6,374,999 | | | | 8,302,987 | | | | 13.10 | |
| | | | | | | | | | | | | | | | |
Total Event Driven | | | | | | | 11,438,989 | | | | 13,234,101 | | | | 20.88 | |
| | | | | | | | | | | | | | | | |
Relative Value | | | | | | | | | | | | | | | | |
Context Partners Fund, L.P. - b | | | 02/01/2019 | | | | 1,016,834 | | | | 1,336,392 | | | | 2.11 | |
Hildene Opportunities Fund II, L.P. - a,b | | | 04/01/2017 | | | | 1,125,000 | | | | 1,718,461 | | | | 2.71 | |
Hildene Opportunities Offshore Fund II, Ltd. - a,b | | | 10/01/2017 | | | | 712,500 | | | | 1,003,543 | | | | 1.58 | |
Linden Investors LP - a,b | | | 01/01/2015 | | | | 1,911,371 | | | | 2,987,205 | | | | 4.71 | |
Metacapital Mortgage Opportunities Fund, L.P. Class B - a,b | | | 01/01/2014 | | | | 16,320 | | | | 12,622 | | | | 0.02 | |
Millennium International, Ltd. - a,b | | | 08/01/2015 | | | | 589,781 | | | | 842,751 | | | | 1.33 | |
Sculptor Overseas Fund II, Ltd. - b | | | 04/01/2021 | | | | 3,450,000 | | | | 3,437,937 | | | | 5.43 | |
Shaolin Capital Partners Onshore Fund, L.P. - b | | | 02/01/2021 | | | | 1,000,000 | | | | 1,002,800 | | | | 1.58 | |
ShoreBridge Point72 Select, Ltd. - a,b | | | 06/01/2020 | | | | 3,509,288 | | | | 4,243,562 | | | | 6.70 | |
| | | | | | | | | | | | | | | | |
Total Relative Value | | | | | | | 13,331,094 | | | | 16,585,273 | | | | 26.17 | |
| | | | | | | | | | | | | | | | |
Total Investments in Investment Funds - * | | | | | | $ | 43,465,216† | | | $ | 49,136,379 | | | | 77.53 | |
| | | | | | | | | | | | | | | | |
SkyBridge G II Fund, LLC
Consolidated Schedule of Investments (continued)
December 31, 2021 (Unaudited)
| | | | | | | | | | | | | | | | |
| | | First | | | | | | | | | % of | |
| | | Acquisition | | | | | | | | | Shareholders’ | |
| | | Date | | | Cost | | | Fair Value | | | Capital | |
Investments in Securities | | | | | | | | | | | | | | | | |
United States | | | | | | | | | | | | | | | | |
Private Equity | | | | | | | | | | | | | | | | |
Chime Financial, Inc. | | | 11/24/2021 | | | $ | 899,982 | | | $ | 899,982 | | | | 1.42% | |
Homebrew Ventures I, L.P. | | | 07/01/2021 | | | | 312,402 | | | | 312,402 | | | | 0.49 | |
New York Digital Investment Group LLC | | | 08/19/2021 | | | | 1,040,000 | | | | 1,170,578 | | | | 1.85 | |
Payward, Inc. | | | 11/01/2021 | | | | 961,070 | | | | 961,070 | | | | 1.51 | |
| | | | | | | | | | | | | | | | |
Total Investments in Securities - * | | | | | | $ | 3,213,454† | | | $ | 3,344,032 | | | | 5.27 | |
| | | | | | | | | | | | | | | | |
Other Assets, less Liabilities | | | | | | | | | | | 10,899,116 | | | | 17.20 | |
| | | | | | | | | | | | | | | | |
Shareholders’ Capital | | | | | | | | | | $ | 63,379,527 | | | | 100.00% | |
| | | | | | | | | | | | | | | | |
Note: Investments in underlying Investment Funds are categorized by investment strategy.
| a | As of December 31, 2021, subject to gated redemptions (these are investor-level percentage limitations on redemption). |
| b | Redemptions permitted quarterly. |
| c | Illiquid, redeemable only when underlying investment is realized or converted to liquid interest in Investment Fund. The Company held $2,325,911 (4.73% of total Investments in Investment Funds) of illiquid investments at December 31, 2021. |
| d | Subject to a current lock-up on liquidity provisions on a greater than quarterly basis. |
| e | Redemptions permitted monthly. |
| f | The Investment Fund is held by SkyBridge G II Sub-Fund I Ltd. (the “Sub-Fund”), a wholly-owned subsidiary of the Company. Investment Funds held by the Sub-Fund represent 6.34% of the total Investments in Investment Funds. |
| g | Redemptions permitted weekly. |
| h | Redemptions permitted semi-annually. |
| * | All Investments in Investment Funds and securities are non-income producing. |
| † | The cost and unrealized appreciation/(depreciation) of investments as of December 31, 2021, as computed for federal tax purposes, were as follows: |
| | | | |
Aggregate cost | | $ | 58,308,976 | |
| | | | |
| |
Gross unrealized appreciation | | $ | 7,456,756 | |
Gross unrealized depreciation | | | (13,285,321) | |
| | | | |
Net unrealized depreciation | | $ | (5,828,565) | |
| | | | |
SkyBridge G II Fund, LLC
Consolidated Schedule of Investments (continued)
December 31, 2021 (Unaudited)
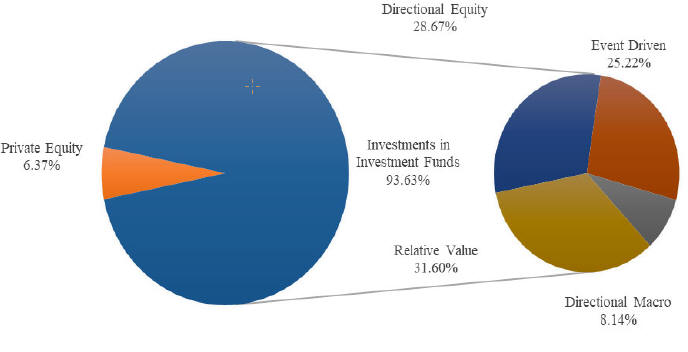
Investment Strategy as a Percentage of Total Investments
SkyBridge G II Fund, LLC
Notes to Schedule of Investments
December 31, 2021 (Unaudited)
In accordance with the authoritative guidance on fair value measurements and disclosures under accounting principles generally accepted in the United States of America (“GAAP”), SkyBridge G II Fund, LLC (the “Company”) discloses the fair value of its investments in a hierarchy that prioritizes the inputs to valuation techniques used to measure the fair value. The hierarchy gives the highest priority to valuations based upon unadjusted quoted prices in active markets for identical assets or liabilities (Level 1 measurement) and the lowest priority to valuations based upon unobservable inputs that are significant to the valuation (Level 3 measurement). The guidance establishes three levels of fair value as listed below.
Level 1- Inputs that reflect unadjusted quoted prices in active markets for identical assets or liabilities that the Company has the ability to access at the measurement date;
Level 2- Inputs other than quoted prices that are observable for the asset or liability either directly or indirectly, including inputs in markets that are not considered to be active;
Level 3- Inputs that are unobservable.
The notion of unobservable inputs is intended to allow for situations in which there is little, if any, market activity for the asset or liability at the measurement date. Under Level 3, the owner of an asset must determine valuation based on their own assumptions about what market participants would take into account in determining the fair value of the asset, using the best information available.
The inputs or methodology used for valuing securities are not necessarily an indication of the risk associated with investing in those securities.
A financial instrument’s level within the fair value hierarchy is based upon the lowest level of any input that is significant to the fair value measurement. However, the determination of what constitutes “observable” requires significant judgment by the Adviser. The Adviser considers observable data to be market data which is readily available, regularly distributed or updated, reliable and verifiable, not proprietary, and provided by independent sources that are actively involved in the relevant market.
The following is a summary of the Company’s assets measured at fair value as of December 31, 2021, by Accounting Standards Codification (“ASC”) 820 fair value hierarchy levels:
| | | | | | | | | | | | | | | | | | | | |
| Description | | Level 1
Quoted Prices | | | Level 2
Significant
Observable Inputs | | | Level 3
Significant
Unobservable
Inputs | | | Investments
Measured at Net
Asset Value | | | Total Fair Value
at December 31,
2021 | |
Investments in Investment Funds | | $ | — | | | $ | — | | | $ | — | | | $ | 49,136,379 | | | $ | 49,136,379 | |
Investments in Securities | | $ | — | | | $ | — | | | $ | 3,344,032 | | | $ | — | | | $ | 3,344,032 | |
| | | | | | | | | | | | | | | | | | | | |
The Company’s investments in Investment Funds for which fair value is measured using NAV per share as a practical expedient, in the amount of $49,136,379 have not been categorized in the fair value hierarchy. This amount includes $3,117,567 held by SkyBridge G II Sub-Fund I Ltd. (the “Sub-Fund”), which was organized as an exempted Cayman Islands limited liability company on
SkyBridge G II Fund, LLC
Notes to Schedule of Investments (continued)
December 31, 2021 (Unaudited)
December 9, 2020 and is a wholly owned subsidiary of the Company. The Company also has investments in securities in the amount of $3,344,032.
The following table details purchases, sales and in-kind transfer of the investments in which significant unobservable inputs (Level 3) were used in determining value:
| | | | | | | | |
| | | Fair Value Measurements Using Level 3
Inputs | |
| | | | |
| | |
| | | Private Equity | | | Total Investments | |
| | | | |
| | |
Sales | | $ | — | | | $ | — | |
Purchases | | $ | 3,213,454 | | | $ | 3,213,454 | |
The following table summarizes the valuation methodology and significant unobservable inputs used to estimate the fair value of Level 3 investments as of December 31, 2021.
| | | | | | | | | | |
| | | Fair Value as of | | | | | Unobservable | | |
| Type of Level 3 Investment | | December 31, 2021 | | | Valuation Methodology | | Input | | Inputs |
Investments in Securities Private Equity | | $ | 3,344,032 | | | Fair Value | | Transaction Price | | N/A |
There were no transfers in or out between any levels during the period.
The following is a summary of the investment strategies, their liquidity and redemption notice periods and any restrictions on the liquidity provisions of the investments in Investment Funds held by the Company as of December 31, 2021 and measured at fair value using the NAV per share practical expedient. Investment Funds with no current redemption restrictions may be subject to future gates, lock-up provisions or other restrictions, in accordance with their offering documents which would be considered in fair value measurement and disclosure.
Directional Equity funds take long and short stock positions. The manager may attempt to profit from both long and short stock positions independently, or profit from the relative outperformance of long positions against short positions. The stock picking and portfolio construction process is usually based on bottom-up fundamental stock analysis, but may also include top-down macro-based views, market trends and sentiment factors. Directional equity managers may specialize by region (e.g., global, U.S., Europe or Japan) or by sector. No assurance can be given that the managers will be able to correctly locate profitable trading opportunities, and such opportunities may be adversely affected by unforeseen events. In addition, short selling creates the risk of loss if the security that has been sold short appreciates in value. Generally, the Investment Funds within this strategy have quarterly to semi-annual liquidity, subject to a 45 to 90 day notice period. An Investment Fund in this strategy, representing approximately 3 percent of the Investment Funds in this strategy is an illiquid or side pocket investment with a suspended redemption. Approximately 13 percent of the Investment Funds in this strategy are subject to hard lock provisions to be lifted after 12 months. Approximately 49 percent of the Investment Funds in this strategy have gated redemptions, which are estimated to be
SkyBridge G II Fund, LLC
Notes to Schedule of Investments (continued)
December 31, 2021 (Unaudited)
lifted after 12 months. The remaining approximately 35 percent of the Investment Funds in this strategy can be redeemed with no restrictions as of the measurement date.
Directional Macro strategies require well developed risk management procedures due to the frequent employment of leverage. Investment managers may trade futures, options on future contracts and foreign exchange contracts and may trade in diversified markets or focus on one market sector. Two types of strategies employed by directional macro managers are discretionary and systematic trading. Discretionary trading strategies seek to dynamically allocate capital to relatively short-term trading opportunities around the world. Directional strategies (seeking to participate in rising and declining markets when the trend appears strong and justified by fundamentals) and relative value approaches (establishing long positions in undervalued instruments and short positions in related instruments believed to be over valued) or in “spread” positions in an attempt to capture changes in the relationships between instruments. Systematic trading strategies generally rely on computerized trading systems or models to identify and capitalize on trends in financial and commodity markets. This systematic approach allows investment managers to seek to take advantage of price patterns in very large number of markets. The trading models may be focused on technical or fundamental factors or combination of factors. Also included in the Directional Macro strategy is the Company’s exposure to digital assets, including its passively-managed exposure in bitcoin. Digital assets (also known as “virtual currencies,” “cryptocurrencies,” “coins” or “tokens” or similar terms) are assets that are issued and/or transferred using technological innovations such as distributed ledger or blockchain technology and include, but are not limited to, bitcoin. The Investment Funds in this strategy have weekly to quarterly liquidity, subject to a 1 to 30 day notice period. Approximately 27 percent of the Investment Funds in this strategy are subject to hard lock provisions to be lifted after 12 months. The remaining approximately 73 percent of the Investment Funds in this strategy can be redeemed with no restrictions as of the measurement date.
Event Driven strategies involve investing in opportunities created by significant transactional events such as spin-offs, mergers and acquisitions, bankruptcies, recapitalizations and share buybacks. Event driven strategies include “merger arbitrage” and “distressed securities”. Generally, the Investment Funds within this strategy have quarterly liquidity, subject to a 90 day notice period. Investment Funds in this strategy, representing approximately 14 percent of the Investment Funds in this strategy are illiquid or side pocket investments with suspended redemptions. Approximately 3 percent of the Investment Funds in this strategy have gated redemptions, which are estimated to be lifted after 12 months. The remaining approximately 83 percent of the Investment Funds in this strategy can be redeemed with no restrictions as of the measurement date.
Relative Value strategies seek to take advantage of specific pricing anomalies, while also seeking to maintain minimal exposure to systematic market risk. This may be achieved by purchasing one security previously believed to be undervalued, while selling short another security perceived to be overvalued. Relative value arbitrage strategies include equity market neutral, statistical arbitrage, convertible arbitrage, and fixed income arbitrage. Some investment managers classified as multi-strategy relative value arbitrage use a combination of these substrategies. Generally, the Investment Funds within this strategy have quarterly liquidity, subject to a 30 to 90 day notice period. Approximately 65 percent of the Investment Funds in this strategy have gated redemptions, which are
SkyBridge G II Fund, LLC
Notes to Schedule of Investments (continued)
December 31, 2021 (Unaudited)
estimated to be lifted after 12 months. The remaining approximately 35 percent of the Investment Funds in this strategy can be redeemed with no restrictions as of the measurement date.
The Company follows the authoritative guidance under GAAP on determining fair value when the volume and level of activity for the asset or liability have significantly changed and identifying transactions that are not orderly. Accordingly, if the Company determines that either the volume and/or level of activity for an asset or liability has significantly changed (from normal conditions for that asset or liability) or price quotations or observable inputs are not associated with orderly transactions, increased analysis and management judgment will be required to estimate fair value. Valuation techniques such as an income approach might be appropriate to supplement or replace a market approach in those circumstances.
The guidance also provides a list of factors to determine whether there has been a significant change in relation to normal market activity. Regardless of the valuation technique and inputs used, the objective for the fair value measurement in those circumstances is unchanged from what it would be if markets were operating at normal activity levels and/or transactions were orderly; that is, to determine the current exit price.