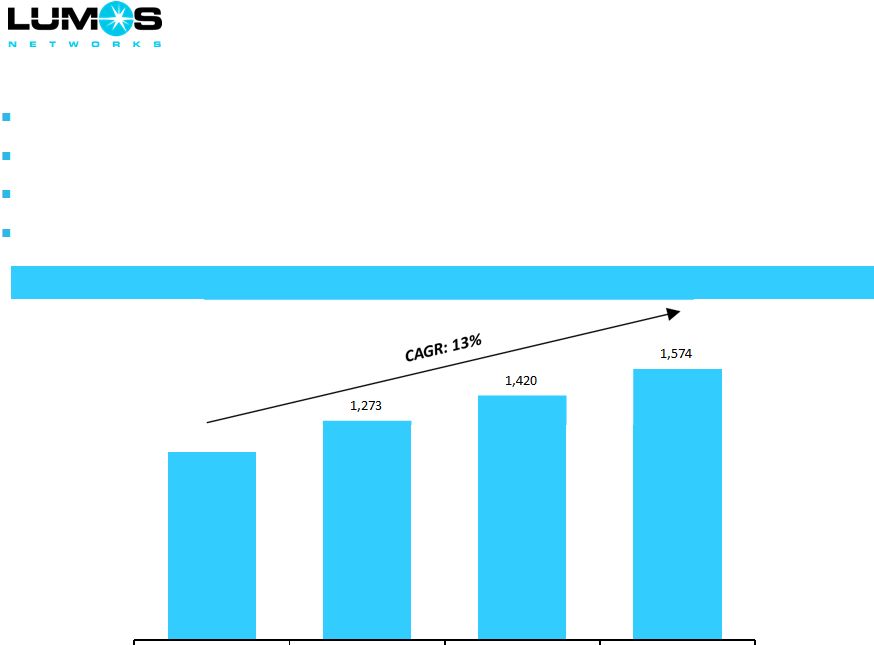
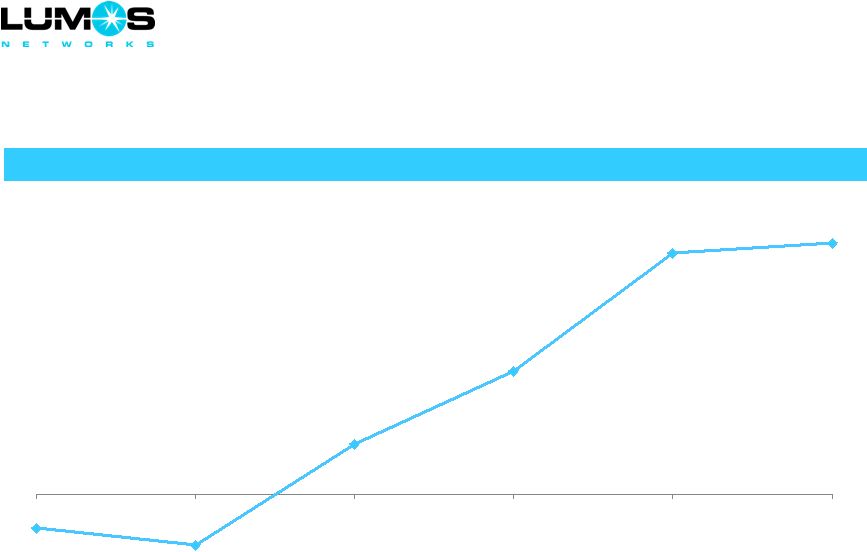
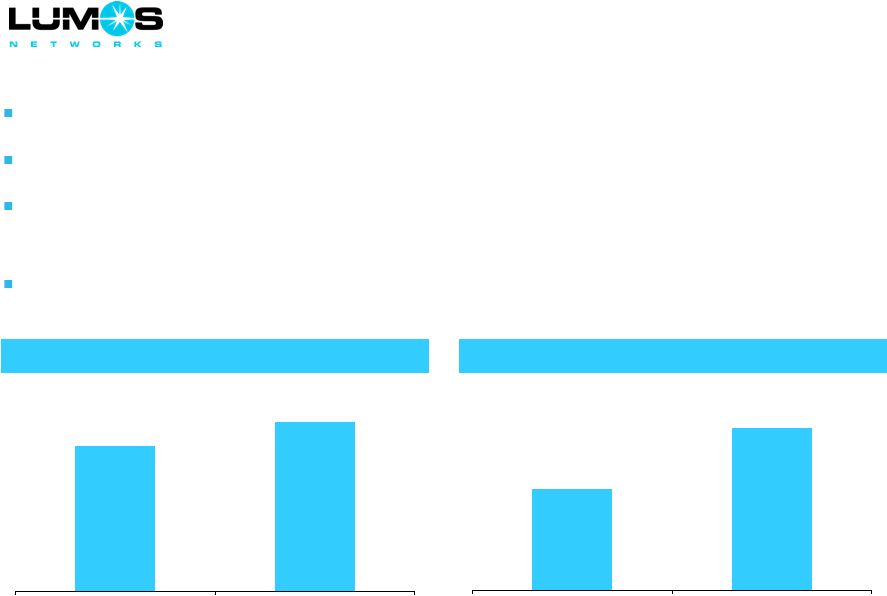
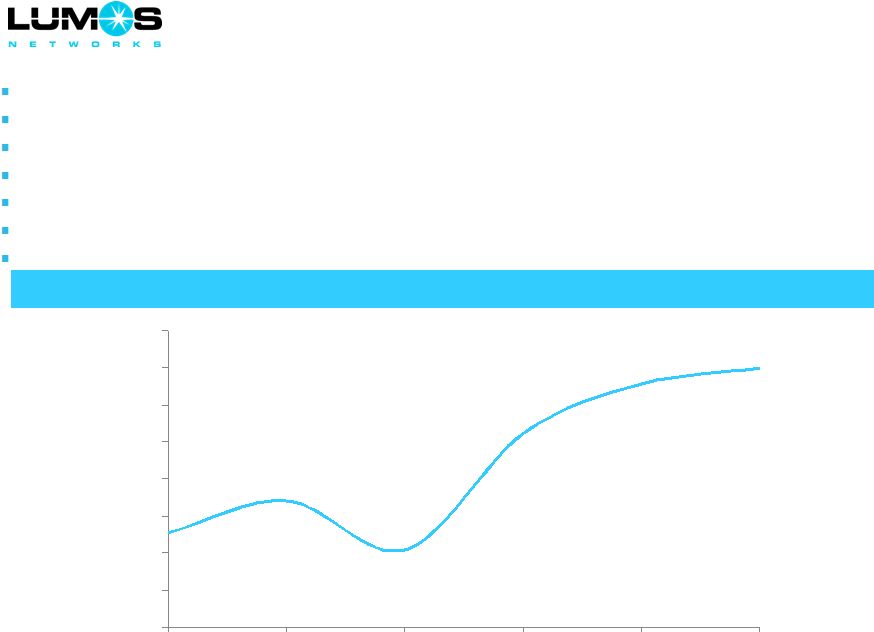
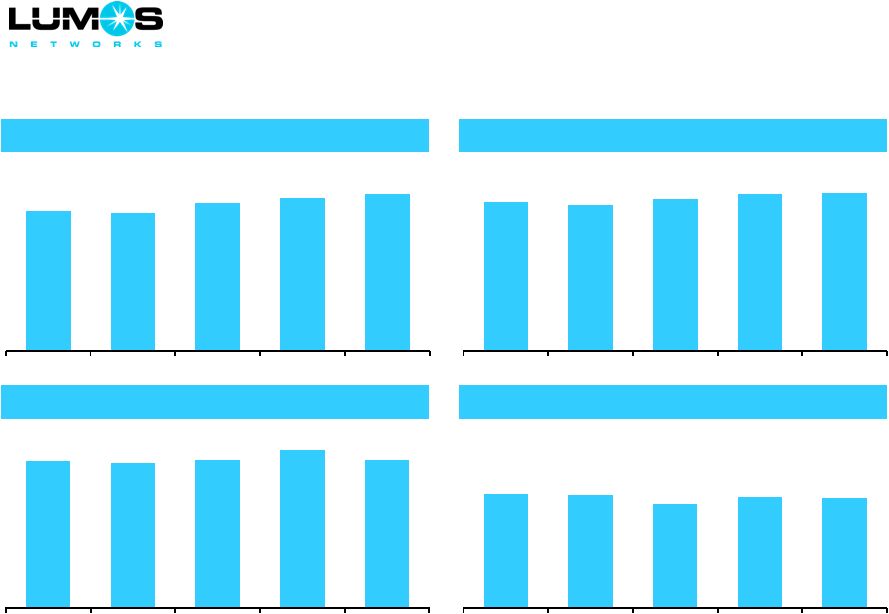
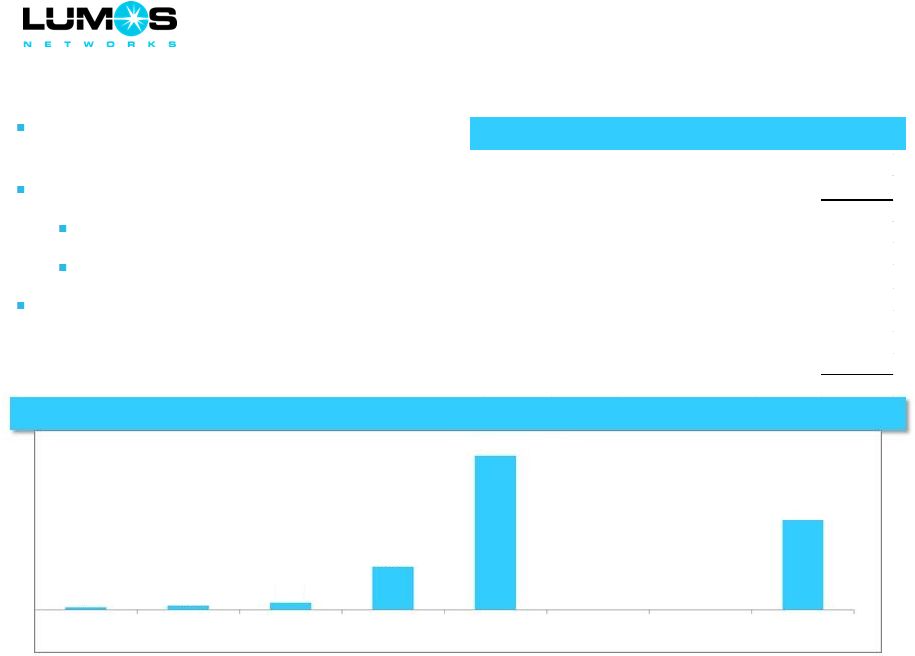
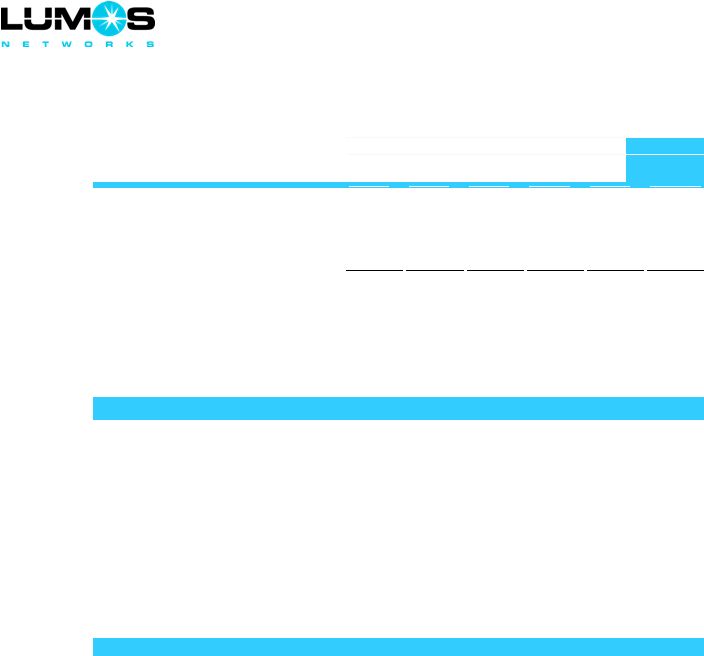
Historical Financial Metrics by Segment 1 Defined as operating revenues less network access costs 2 Defined as net income attributable to Lumos Networks before interest, income taxes, depreciation and amortization, accretion of asset retirement obligations, net income or loss attributable to noncontrolling interests, other income or expenses, equity-based compensation charges, acquisition-related charges, amortization of actuarial losses on retirement plans, employee separation charges, restructuring-related charges, gain or loss on settlements and gain or loss on interest rate swap derivatives. See note from the Company on “Use of Non-GAAP Measures” on Slide 1 3 The Company recorded a $10.8 million curtailment gain in the second half of 2014 related to the elimination of certain medical benefits under the postretirement plan, which was not allocated to the operating segments 31 ($ in Thousands) FYE 2013 FYE 2014 FYE 2015 % of 2Q15 1Q13 2Q13 3Q13 4Q13 1Q14 2Q14 3Q14 4Q14 1Q15 2Q15 Total Revenue Data $25,369 $25,706 $26,094 $26,943 $26,137 $26,707 $26,488 $27,310 $27,767 $28,089 55.1% Residential and Small Business 21,057 20,453 20,055 19,094 18,647 18,290 17,668 17,423 17,265 17,010 33.4% RLEC Access 6,108 6,152 5,478 4,966 5,306 5,168 6,360 5,952 5,463 5,854 11.5% Total Revenue $52,534 $52,311 $51,627 $51,003 $50,090 $50,165 $50,516 $50,685 $50,495 $50,953 100.0% % Sequential Growth (0.3%) (0.4%) (1.3%) (1.2%) (1.8%) 0.1% 0.7% 1.0% (0.4%) 0.9% % YoY Growth by Segment Data 19.0% 17.5% 15.1% 10.3% 3.0% 3.9% 1.5% 1.4% 6.2% 5.2% Residential and Small Business (12.3%) (12.5%) (13.5%) (12.8%) (11.4%) (10.6%) (11.9%) (8.8%) (7.4%) (7.0%) RLEC Access 0.4% 11.0% (10.8%) (21.8%) (13.1%) (16.0%) 16.1% 19.9% 3.0% 13.3% Gross Profit 1 Data $21,338 $21,827 $22,206 $22,940 $21,963 $22,788 $22,551 $23,350 $24,122 $24,025 58.5% Residential and Small Business 13,934 13,831 13,601 12,677 12,107 12,019 11,355 11,670 11,198 11,162 27.2% RLEC Access 6,108 6,152 5,478 4,966 5,306 5,168 6,360 5,952 5,463 5,854 14.3% Total Gross Profit 1 $41,380 $41,810 $41,285 $40,583 $39,376 $39,975 $40,266 $40,972 $40,783 $41,041 100.0% Adjusted EBITDA 2 Data $13,124 $13,355 $13,012 $14,011 $12,717 $13,395 $12,984 $12,629 $12,367 $12,492 55.1% Residential and Small Business 6,697 6,356 5,691 5,917 5,544 5,230 4,503 4,623 5,627 5,327 23.5% RLEC Access 4,874 4,840 4,343 4,104 4,306 4,098 5,214 4,621 4,517 4,848 21.4% Adjusted EBITDA, Before Curtailment Gain $24,695 $24,551 $23,046 $24,032 $22,567 $22,723 $22,701 $21,873 $22,511 $22,667 100.0% Curtailment Gain 3 0 0 0 0 0 0 10,207 567 0 0 Total Adjusted EBITDA $24,695 $24,551 $23,046 $24,032 $22,567 $22,723 $32,908 $22,440 $22,511 $22,667 % Sequential Growth, Normalized 6.4% (0.6%) (6.1%) 4.3% (6.1%) 0.7% (0.1%) (3.6%) 2.9% 0.7% % Margin, Normalized 47.0% 46.9% 44.6% 47.1% 45.1% 45.3% 44.9% 43.2% 44.6% 44.5% |


