|
Exhibit 99.1 
|
Company Presentation
November 2016
Use of Non-GAAP Financial Measures
Included in this presentation are certain non-GAAP financial measures that are not determined in accordance with US generally accepted accounting principles. These financial performance measures are not indicative of cash provided or used by operating activities and exclude the effects of certain operating, capital and financing costs and may differ from comparable information provided by other companies, and they should not be considered in isolation, as an alternative to, or more meaningful than measures of financial performance determined in accordance with US generally accepted accounting principles. These financial performance measures are commonly used in the industry and are presented because Lumos Networks Corp. believes they provide relevant and useful information to investors. The Company utilizes these financial performance measures to assess its ability to meet future capital expenditure and working capital requirements, to incur indebtedness if necessary, and to fund continued growth. Lumos Networks Corp. also uses these financial performance measures to evaluate the performance of its business, for budget planning purposes and as factors in its employee compensation programs.
Special Note Regarding Forward-Looking Statements
This Presentation includes certain forward-looking statements. Such forward-looking statements reflect, among other things, our current expectations, plans and strategies, and anticipated financial results, all of which are subject to known and unknown risks, uncertainties and factors that may cause our actual results to differ materially from those expressed or implied by these forward-looking statements. Many of these risks are beyond our ability to control or predict. Because of these risks, uncertainties and assumptions, you should not place undue reliance on these forward-looking statements. Furthermore, forward-looking statements speak only as of the date they are made. We do not undertake any obligation to update or review any forward-looking information, whether as a result of new information, future events or otherwise. Important factors with respect to any such forward-looking statements, including certain risks and uncertainties that could cause actual results to differ from those contained in the forward-looking statements, include, but are not limited to: our ability to complete the Clarity acquisition on a timely basis and the impact of the acquisition on our operations; rapid development and intense competition with resulting pricing pressure in the telecommunications and high speed data transport industry; our ability to grow our data business on an organic or inorganic basis in order to offset expected revenue declines in legacy voice and access products; our ability to obtain new carrier contracts or expand services under existing carrier contracts at competitive pricing levels to offset churn and achieve revenue growth from our carrier businesses; our ability to separate our legacy business on a timely basis; our ability to effectively allocate capital and timely implement network expansion plans necessary to accommodate organic growth initiatives; our ability to complete customer installations in a timely manner; adverse economic conditions; operating and financial restrictions imposed by our senior credit facility and our unsecured debt obligations; our cash and capital requirements; our ability to maintain and enhance our network; the potential to experience a high rate of customer turnover; federal and state regulatory fees, requirements and developments; our reliance on certain suppliers and vendors; and other unforeseen difficulties that may occur. These risks and uncertainties are not intended to represent a complete list of all risks and uncertainties inherent in our business, and should be read in conjunction with the more detailed cautionary statements and risk factors included in our other SEC filings, including our Annual Report filed on Form 10-K for the year ended December 31, 2015. 1
|

|
Advanced Fiber Network Driving Value for Our Customers
2
Lumos at a Glance
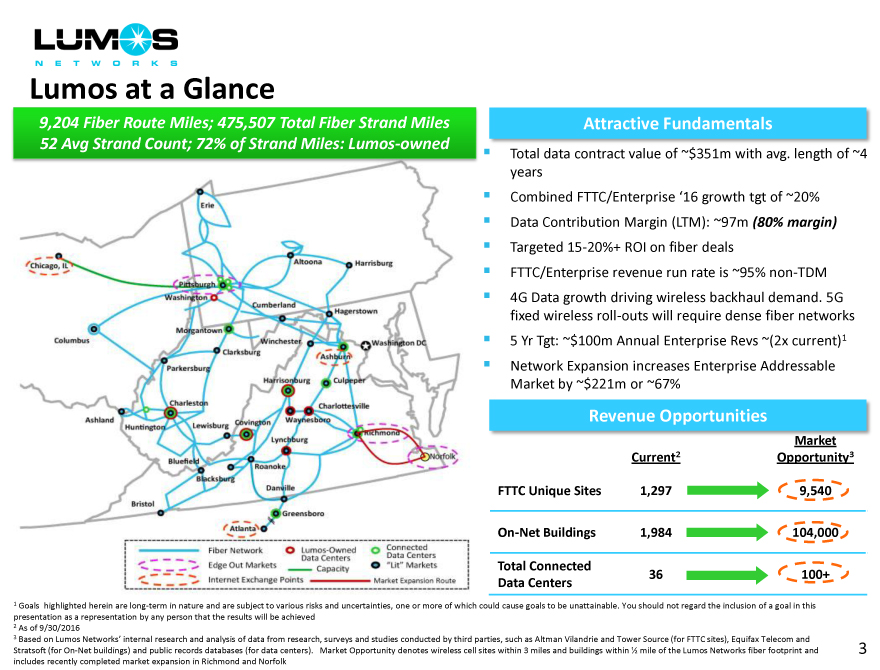
9,204 Fiber Route Miles; 475,507 Total Fiber Strand Miles Attractive Fundamentals
52 Avg Strand Count; 72% of Strand Miles: Lumos-owned
Total data contract value of ~$351m with avg. length of ~4
years
Combined FTTC/Enterprise ‘16 growth tgt of ~20%
Data Contribution Margin (LTM): ~97m (80% margin)
Targeted 15-20%+ ROI on fiber deals
FTTC/Enterprise revenue run rate is ~95% non-TDM
4G Data growth driving wireless backhaul demand. 5G
fixed wireless roll-outs will require dense fiber networks
5 Yr Tgt: ~$100m Annual Enterprise Revs ~(2x current)1
Network Expansion increases Enterprise Addressable
Market by ~$221m or ~67%
Revenue Opportunities
Market
Current2Opportunity3
FTTC Unique Sites 1,2979,540
On-Net Buildings 1,984104,000
Total Connected
36100+
Data Centers
1 Goals highlighted herein are long-term in nature and are subject to various risks and uncertainties, one or more of which could cause goals to be unattainable. You should not regard the inclusion of a goal in this
presentation as a representation by any person that the results will be achieved
2 As of 9/30/2016
3 Based on Lumos Networks’ internal research and analysis of data from research, surveys and studies conducted by third parties, such as Altman Vilandrie and Tower Source (for FTTC sites), Equifax Telecom and
Stratsoft (for On-Net buildings) and public records databases (for data centers). Market Opportunity denotes wireless cell sites within 3 miles and buildings within 1/2 mile of the Lumos Networks fiber footprint and 3
includes recently completed market expansion in Richmond and Norfolk
The Transformation in Numbers
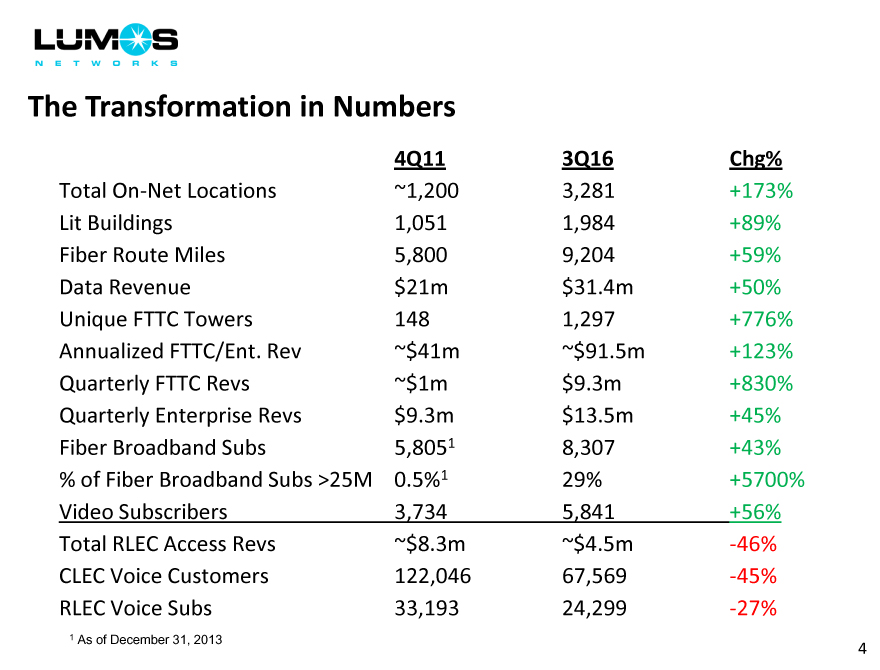
4Q11 3Q16Chg%
Total On-Net Locations ~1,200 3,281+173%
Lit Buildings 1,051 1,984+89%
Fiber Route Miles 5,800 9,204+59%
Data Revenue $21m $31.4m+50%
Unique FTTC Towers 148 1,297+776%
Annualized FTTC/Ent. Rev ~$41m ~$91.5m+123%
Quarterly FTTC Revs ~$1m $9.3m+830%
Quarterly Enterprise Revs $9.3m $13.5m+45%
Fiber Broadband Subs 5,8051 8,307+43%
% of Fiber Broadband Subs >25M 0.5%1 29%+5700%
Video Subscribers 3,734 5,841+56%
Total RLEC Access Revs ~$8.3m ~$4.5m-46%
CLEC Voice Customers 122,046 67,569-45%
RLEC Voice Subs 33,193 24,299-27%
1 As of December 31, 2013 4
3 EB
2 EB
Exponential Growth in Bandwidth Demand 1 EB
Bandwidth Demand Drivers
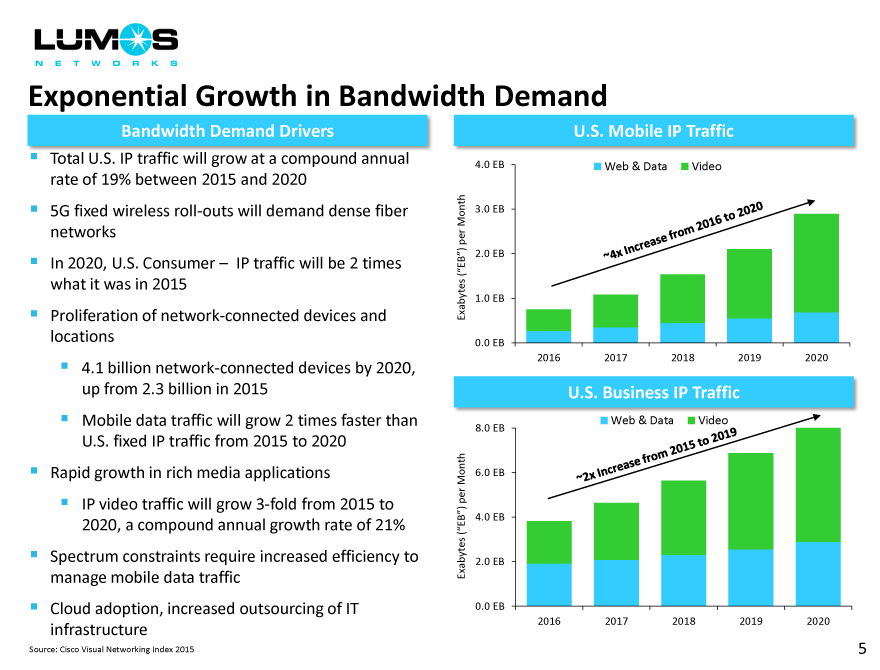
Total U.S. IP traffic will grow at a compound annual
rate of 19% between 2015 and 2020
5G fixed wireless roll-outs will demand dense fiber
networks
In 2020, U.S. Consumer IP traffic will be 2 times
what it was in 2015
Proliferation of network-connected devices and
locations
4.1 billion network-connected devices by 2020,
up from 2.3 billion in 2015
Mobile data traffic will grow 2 times faster than
U.S. fixed IP traffic from 2015 to 2020
Rapid growth in rich media applications
IP video traffic will grow 3-fold from 2015 to
2020, a compound annual growth rate of 21%
Spectrum constraints require increased efficiency to
manage mobile data traffic
Cloud adoption, increased outsourcing of IT
infrastructure
Source: Cisco Visual Networking Index 2015
(EB ) per Month Exabytes
(EB ) per Month Exabytes
[Graphic Appears Here]
4.0 EB Web & Data Video File Sharing
5 EB
3.0 EB
4 EB
2.0 EB
3 EB
1.0 EB2 EB
0.0 EB1 EB
2016 2017 2018 2019 2020
0 EB
2012 U.S. Business IP Traffic 2013 2014 2015 2016 2017
Web & Data Video File Sharing
8.0 EB
6.0 EB
4.0 EB
2.0 EB
0.0 EB
2016 2017 2018 2019 2020
5
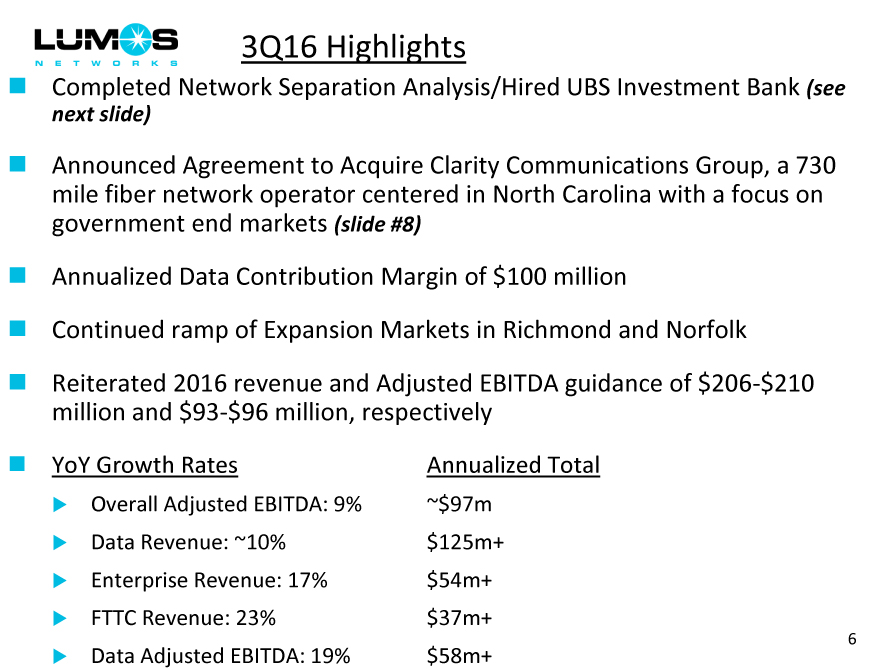
3Q16 Highlights
Completed Network Separation Analysis/Hired UBS Investment Bank (see
next slide)
Announced Agreement to Acquire Clarity Communications Group, a 730
mile fiber network operator centered in North Carolina with a focus on
government end markets (slide #8)
Annualized Data Contribution Margin of $100 million
Continued ramp of Expansion Markets in Richmond and Norfolk
Reiterated 2016 revenue and Adjusted EBITDA guidance of $206-$210
million and $93-$96 million, respectively
YoY Growth Rates Annualized Total
Overall Adjusted EBITDA: 9% ~$97m
Data Revenue: ~10% $125m+
Enterprise Revenue: 17% $54m+
FTTC Revenue: 23% $37m+
6
Data Adjusted EBITDA: 19% $58m+
Status of Separation of Regulated Legacy Assets
Continue to expect to create pure-play fiber bandwidth entity
Milestones Completed in 3Q16
Completed Network Separation Analysis: networks are separable
Working with financial advisor UBS Investment Bank to explore Strategic
Alternatives for regulated Local Exchange Network LEC assets
Focus on preserving optionality with respect to regulated assets in order to
maximize shareholder value
Physical Network Separation began in 3Q16 with the migration of RLEC backbone
Estimated 2016 Financial Metrics for Regulated LEC assets based on guidance
Revenue: approximately $50-55 million
Adjusted EBITDA: approximately $30-32 million
Capex: approximately $6-7 million
7
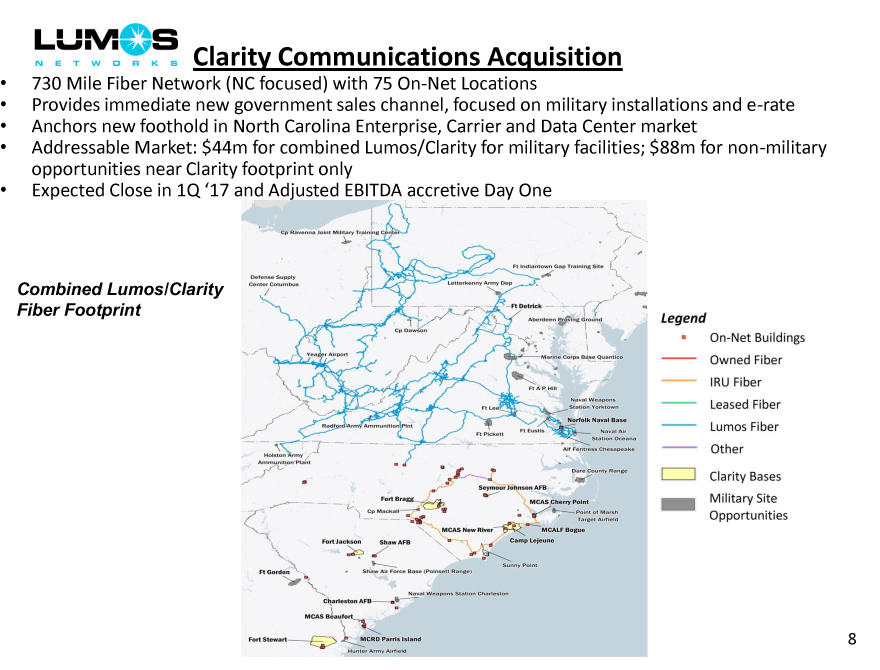
Clarity Communications Acquisition
730 Mile Fiber Network (NC focused) with 75 On-Net Locations
Provides immediate new government sales channel, focused on military installations and e-rate
Anchors new foothold in North Carolina Enterprise, Carrier and Data Center market
Addressable Market: $44m for combined Lumos/Clarity for military facilities; $88m for non-military
opportunities near Clarity footprint only
Expected Close in 1Q ‘17 and Adjusted EBITDA accretive Day One
Combined Lumos/Clarity
Fiber Footprint
8
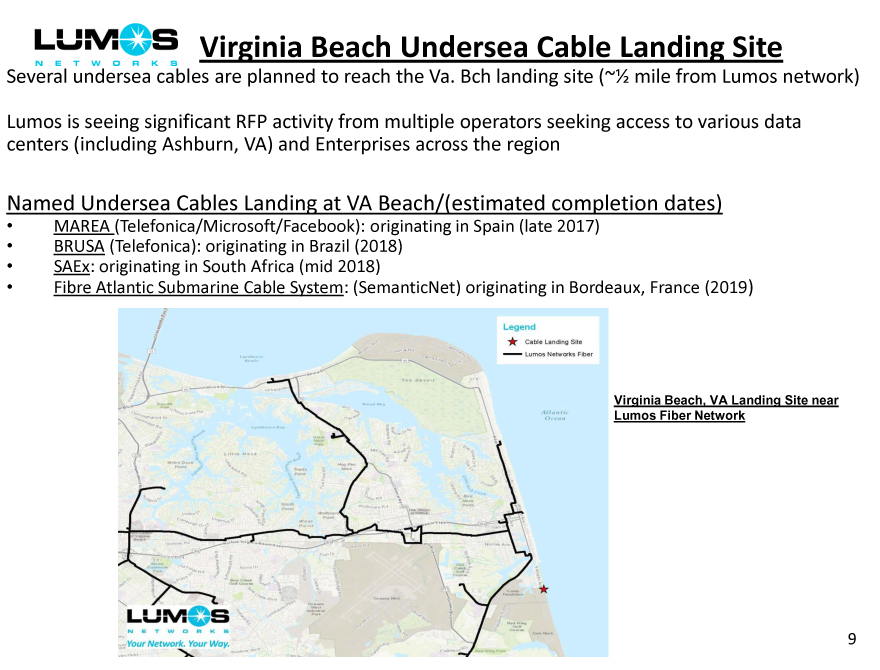
Virginia Beach Undersea Cable Landing Site
Several undersea cables are planned to reach the Va. Bch landing site (~ 1/2 mile from Lumos network)
Lumos is seeing significant RFP activity from multiple operators seeking access to various data centers (including Ashburn, VA) and Enterprises across the region
Named Undersea Cables Landing at VA Beach/(estimated completion dates)
MAREA (Telefonica/Microsoft/Facebook): originating in Spain (late 2017)
BRUSA (Telefonica): originating in Brazil (2018)
SAEx: originating in South Africa (mid 2018)
Fibre Atlantic Submarine Cable System: (SemanticNet) originating in Bordeaux, France (2019)
Virginia Beach, VA Landing Site near
Lumos Fiber Network
9
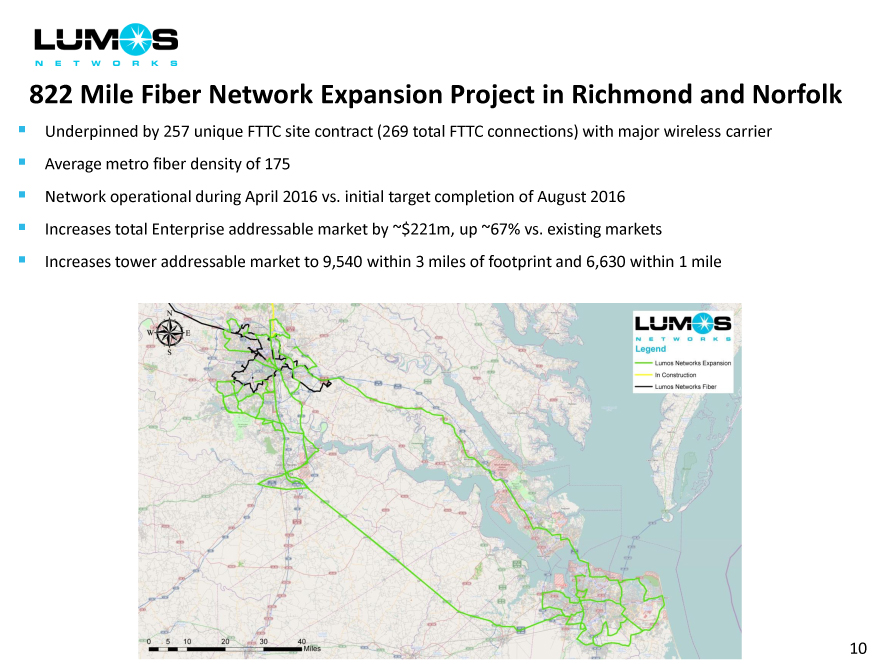
822 Mile Fiber Network Expansion Project in Richmond and Norfolk
Underpinned by 257 unique FTTC site contract (269 total FTTC connections) with major wireless carrier
Average metro fiber density of 175
Network operational during April 2016 vs. initial target completion of August 2016
Increases total Enterprise addressable market by ~$221m, up ~67% vs. existing markets
Increases tower addressable market to 9,540 within 3 miles of footprint and 6,630 within 1 mile
10
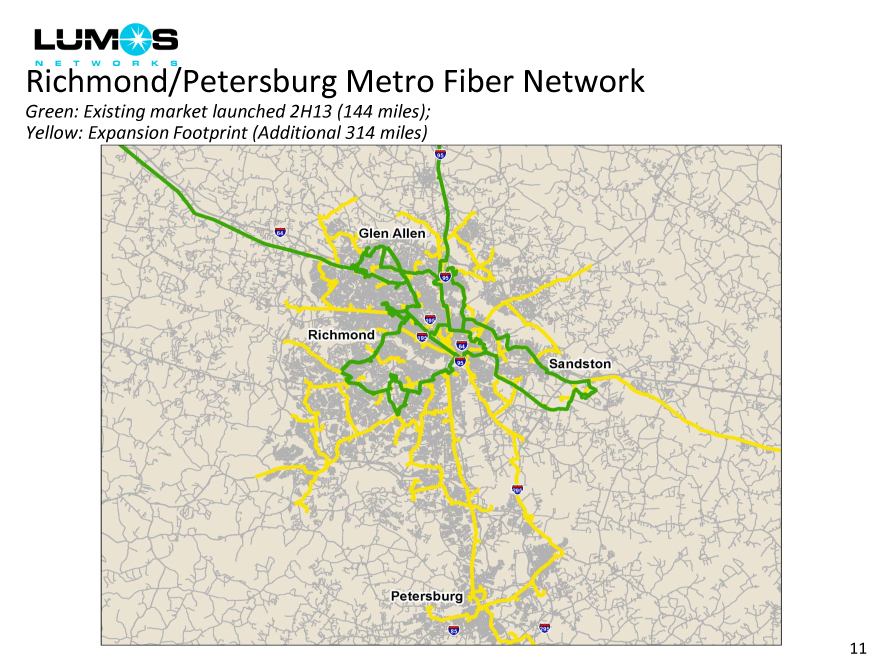
Richmond/Petersburg Metro Fiber Network
Green: Existing market launched 2H13 (144 miles); Yellow: Expansion Footprint (Additional 314 miles)
11
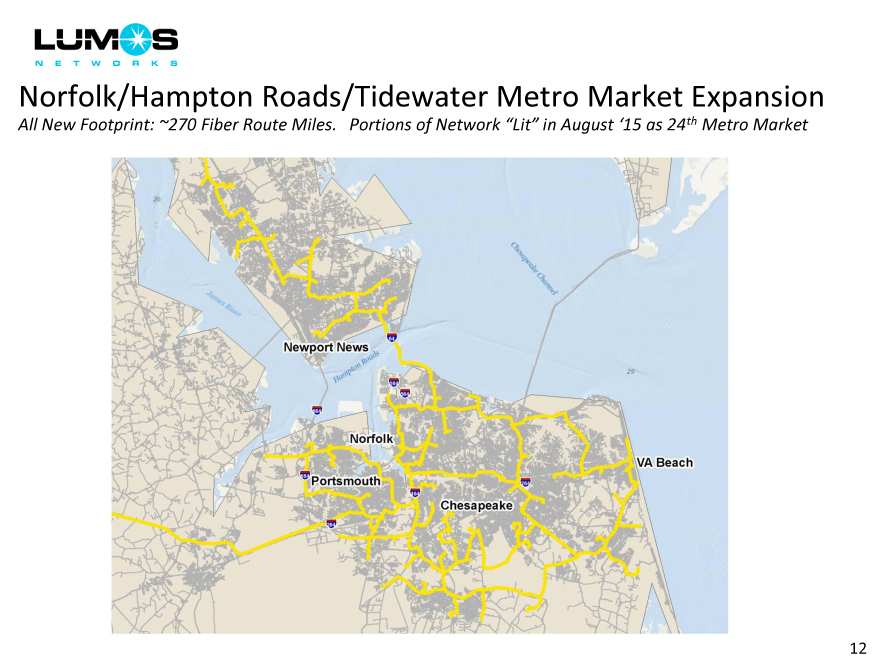
Norfolk/Hampton Roads/Tidewater Metro Market Expansion
All New Footprint: ~270 Fiber Route Miles. Portions of Network Lit in August ‘15 as 24th Metro Market
12
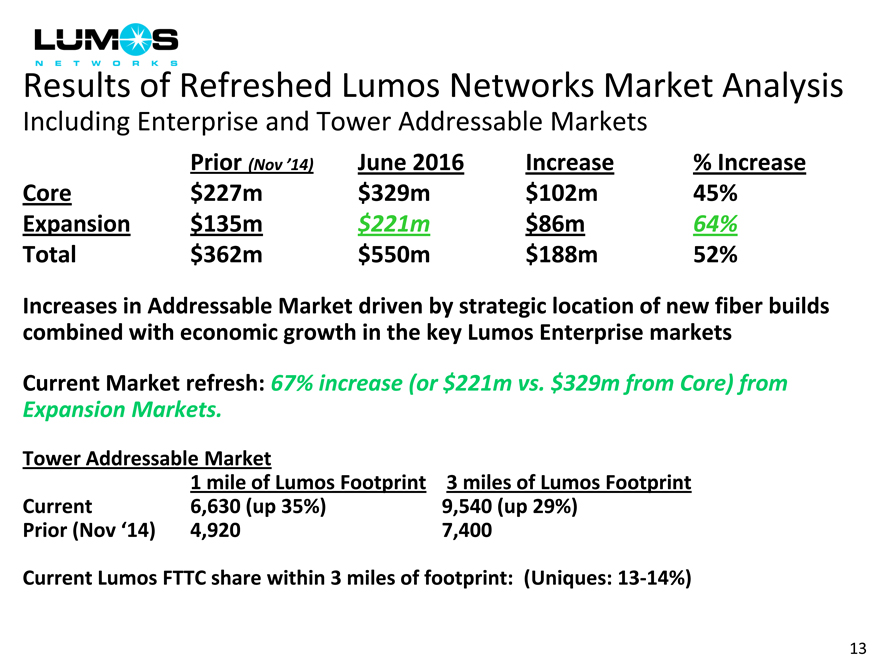
Results of Refreshed Lumos Networks Market Analysis
Including Enterprise and Tower Addressable Markets
Prior (Nov ‘14) June 2016Increase% Increase
Core $227m$329m$102m45%
Expansion $135m$221m$86m64%
Total $362m$550m$188m52%
Increases in Addressable Market driven by strategic location of new fiber builds combined with economic growth in the key Lumos Enterprise markets
Current Market refresh: 67% increase (or $221m vs. $329m from Core) from
Expansion Markets.
Tower Addressable Market
1 mile of Lumos Footprint 3 miles of Lumos Footprint
Current 6,630 (up 35%) 9,540 (up 29%)
Prior (Nov ‘14) 4,920 7,400
Current Lumos FTTC share within 3 miles of footprint: (Uniques: 13-14%)
13
Strategic Financial Partnership with Pamplona Capital
In August of 2015, Lumos closed on a $150 million cash investment from Pamplona
Capital, a Private Equity Fund with over $8 billion in total capital commitments
Strategic Partnership to Accelerate the Transformation of Lumos Networks to a Pure-
Play Fiber Bandwidth Infrastructure Company
Use of Proceeds
Approximately $50m used to pay down existing senior bank debt and related deal
costs
Approximately $100m for general corporate purposes. Provides the company
with additional capital to pursue organic and inorganic growth opportunities in the
fiber and data center space.
Interest payable on the notes issued in connection with Pamplona’s investment
accrues at an annual rate of 8%, paid quarterly either in cash or in kind. The
warrants issued entitle Pamplona to purchase up to 5.5 million shares of common
stock at an exercise price equal to $13.99, the closing price immediately prior to
the closing of the transaction.
Pamplona designates two members of the Lumos Board of Directors
William Pruellage, Partner at Pamplona Capital (based in New York City)
Peter Aquino, CEO of Internap Corporation, former Executive Chairman of Primus
Telecommunications Group and former President and CEO of RCN Corporation 14
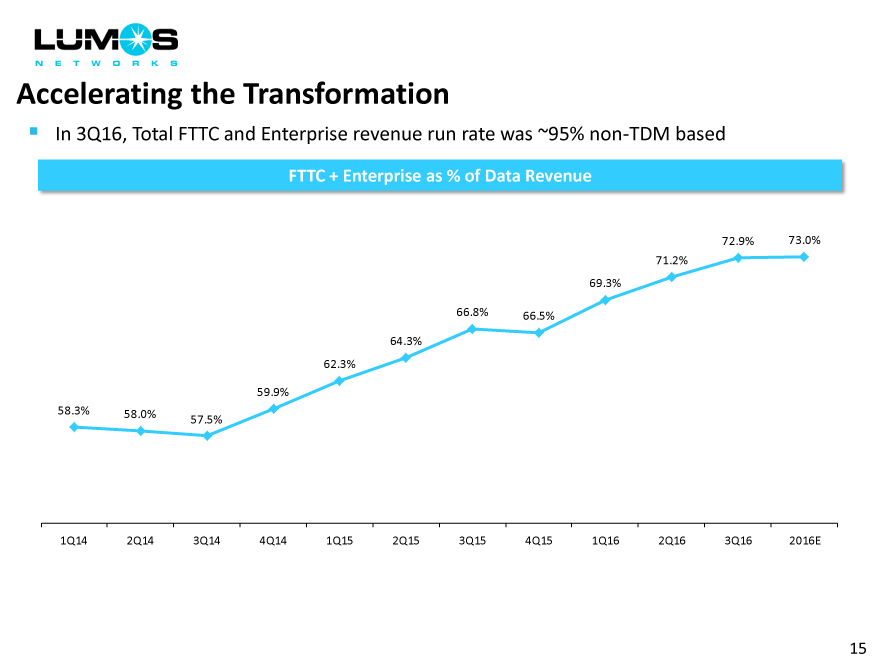
Accelerating the Transformation
In 3Q16, Total FTTC and Enterprise revenue run rate was ~95% non-TDM based
FTTC + Enterprise as % of Data Revenue
72.9%73.0%
71.2%
69.3%
66.8%66.5%
64.3%
62.3%
59.9%
58.3% 58.0%
57.5%
1Q14 2Q14 3Q144Q141Q152Q153Q154Q151Q162Q163Q162016E
15
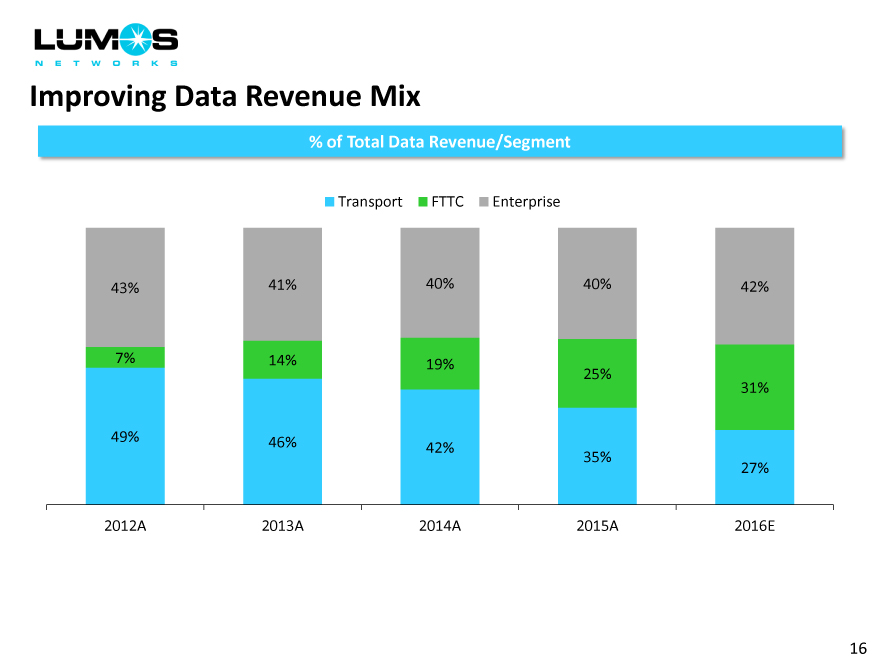
Improving Data Revenue Mix
% of Total Data Revenue/Segment
Transport FTTCEnterprise
43% 41% 40%40%42%
7% 14% 19%
25%
31%
49% 46%
42%35%
27%
2012A 2013A 2014A2015A2016E
16
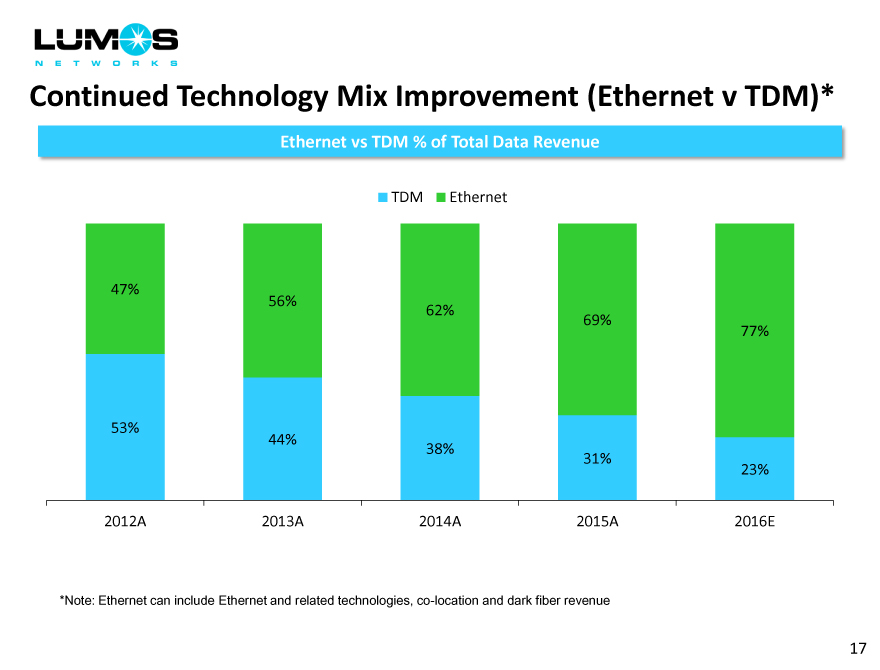
Continued Technology Mix Improvement (Ethernet v TDM)*
Ethernet vs TDM % of Total Data Revenue
TDMEthernet
47%
56%
62%
69%
77%
53%
44%
38%
31%
23%
2012A 2013A 2014A2015A2016E
*Note: Ethernet can include Ethernet and related technologies, co-location and dark fiber revenue
17
Dark Fiber Activity Increasing
Recent FTTC and Enterprise Dark Fiber Wins
Targeting a Growing Number of RFPs in our Footprint:
Macro Fiber to the Cell Backhaul/Small Cell Fronthaul
Large Enterprises: Healthcare, Education/Gov’t, Financial
Data Centers
Relatively limited dark fiber deployments in our footprint (by any fiber
provider), but industry dark fiber network activity has increased so far in
2016 and expected to continue to accelerate in 2017 and beyond
Lumos Dark Fiber Product has standardized Monthly Recurring Charge
(MRC) and Non-Recurring Charge (NRC) pricing
Lumos provides dark fibers and our customers supply their own
equipment and resources to manage their bandwidth service
Lumos has $1m+ in annual Dark Fiber revenue, mostly derived from
Allegheny Energy assets purchased in 2009
18
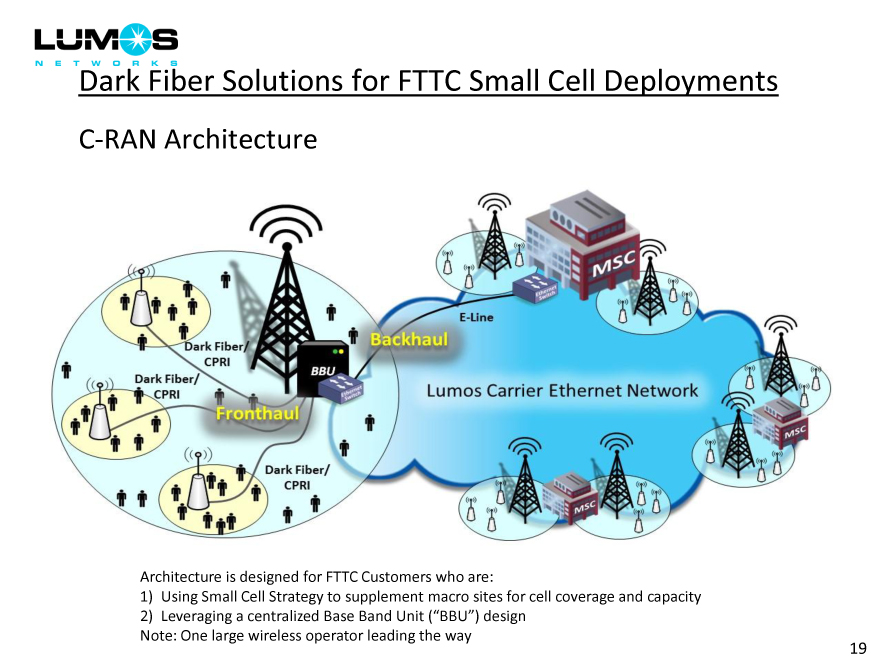
Dark Fiber Solutions for FTTC Small Cell Deployments
C-RAN Architecture
Architecture is designed for FTTC Customers who are:
Using Small Cell Strategy to supplement macro sites for cell coverage and capacity
Leveraging a centralized Base Band Unit (BBU ) design
Note: One large wireless operator leading the way
19
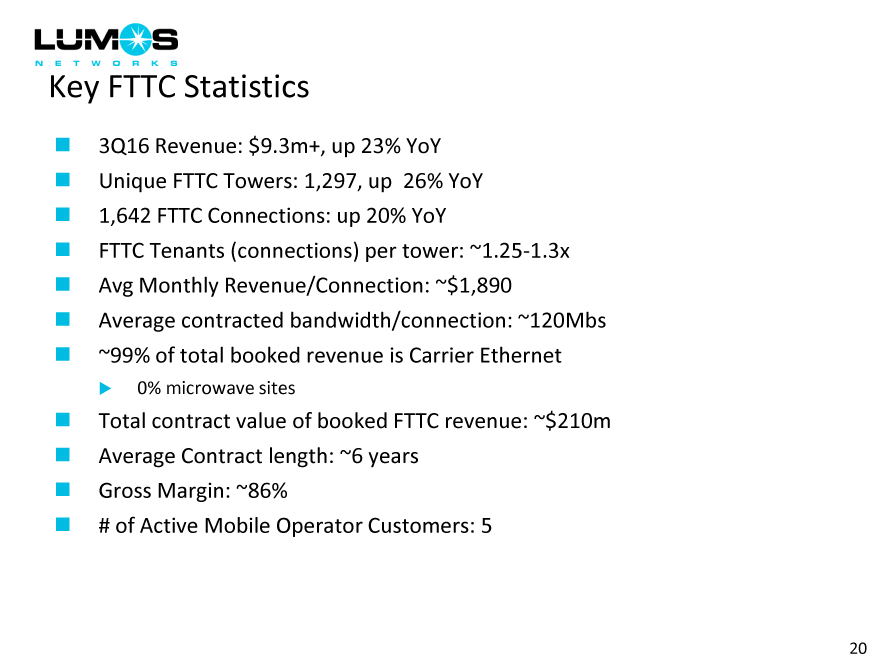
Key FTTC Statistics
3Q16 Revenue: $9.3m+, up 23% YoY
Unique FTTC Towers: 1,297, up 26% YoY
1,642 FTTC Connections: up 20% YoY
FTTC Tenants (connections) per tower: ~1.25-1.3x
Avg Monthly Revenue/Connection: ~$1,890
Average contracted bandwidth/connection: ~120Mbs
~99% of total booked revenue is Carrier Ethernet
0% microwave sites
Total contract value of booked FTTC revenue: ~$210m
Average Contract length: ~6 years
Gross Margin: ~86%
# of Active Mobile Operator Customers: 5
20
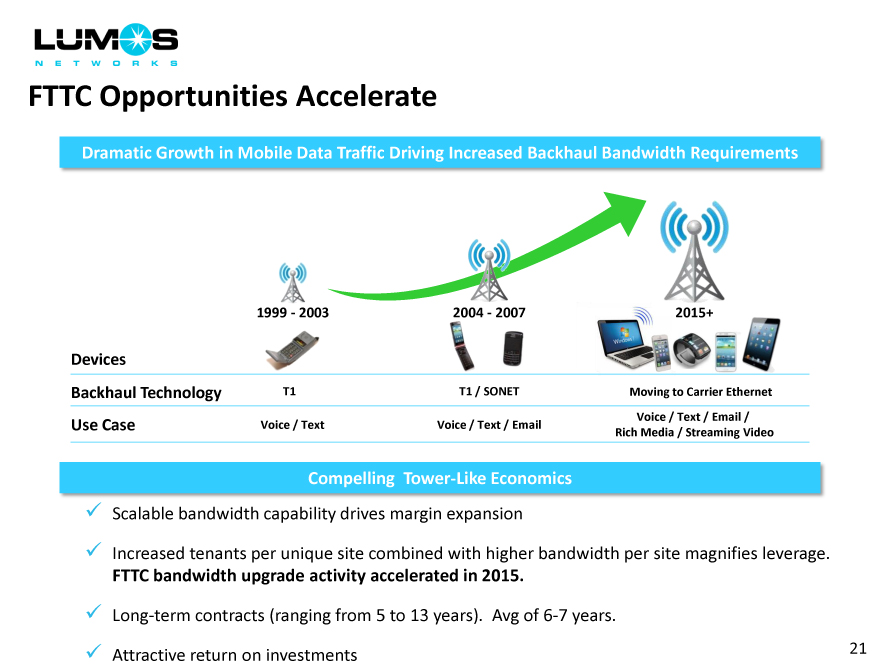
FTTC Opportunities Accelerate
Dramatic Growth in Mobile Data Traffic Driving Increased Backhaul Bandwidth Requirements
1999—2003 2004—20072015+
Devices
Backhaul Technology T1 T1 / SONETMoving to Carrier Ethernet
Use Case Voice / Text Voice / Text / EmailVoice / Text / Email /
Rich Media / Streaming Video
Compelling Tower-Like Economics
Scalable bandwidth capability drives margin expansion
Increased tenants per unique site combined with higher bandwidth per site magnifies leverage.
FTTC bandwidth upgrade activity accelerated in 2015.
Long-term contracts (ranging from 5 to 13 years). Avg of 6-7 years.
Attractive return on investments
21
Project Ark: 100G Core—Premier FTTC Network in Footprint
New MEF-certified Carrier Ethernet MPLS/IP fiber network
Fully Redundant/Fast Re-route
A key selling point for a series of contract wins (total of 500+ FTTC
sites) with a major US wireless carrier
100G: Entire Ark Core and and 1/3 of distribution rings
Core network completed in Sept ‘14 using Cisco routers
~ Over 2 years of operation without design-related incident
FTTC traffic already routed onto Ark
Expect 100% of FTTC traffic routed onto Ark during 2016
Cisco provides new testing tools, thousands of hours of training,
and 2 R&D centers
Ark planned to provide total bandwidth throughput up to ~1
Terabit (equivalent to 2,500 circuits at 400 Mbps each)
Allows for cost effective scalability for upgraded FTTC connection
target of 3,100
22
23
Key Enterprise Accounts
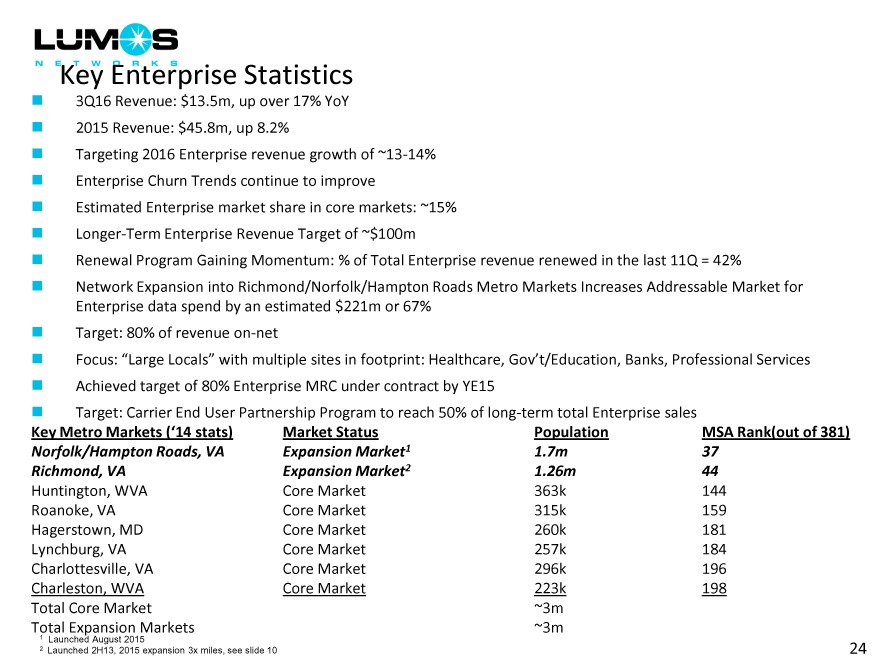
Key Enterprise Statistics
3Q16 Revenue: $13.5m, up over 17% YoY
2015 Revenue: $45.8m, up 8.2%
Targeting 2016 Enterprise revenue growth of ~13-14%
Enterprise Churn Trends continue to improve
Estimated Enterprise market share in core markets: ~15%
Longer-Term Enterprise Revenue Target of ~$100m
Renewal Program Gaining Momentum: % of Total Enterprise revenue renewed in the last 11Q = 42%
Network Expansion into Richmond/Norfolk/Hampton Roads Metro Markets Increases Addressable Market for
Enterprise data spend by an estimated $221m or 67%
Target: 80% of revenue on-net
Focus: Large Locals with multiple sites in footprint: Healthcare, Gov’t/Education, Banks, Professional Services
Achieved target of 80% Enterprise MRC under contract by YE15
Target: Carrier End User Partnership Program to reach 50% of long-term total Enterprise sales
Key Metro Markets (‘14 stats) Market Status PopulationMSA Rank(out of 381)
Norfolk/Hampton Roads, VA Expansion Market1 1.7m37
Richmond, VA Expansion Market2 1.26m44
Huntington, WVA Core Market 363k144
Roanoke, VA Core Market 315k159
Hagerstown, MD Core Market 260k181
Lynchburg, VA Core Market 257k184
Charlottesville, VA Core Market 296k196
Charleston, WVA Core Market 223k198
Total Core Market ~3m
Total Expansion Markets ~3m
1 Launched August 2015
2 Launched 2H13, 2015 expansion 3x miles, see slide 10 24
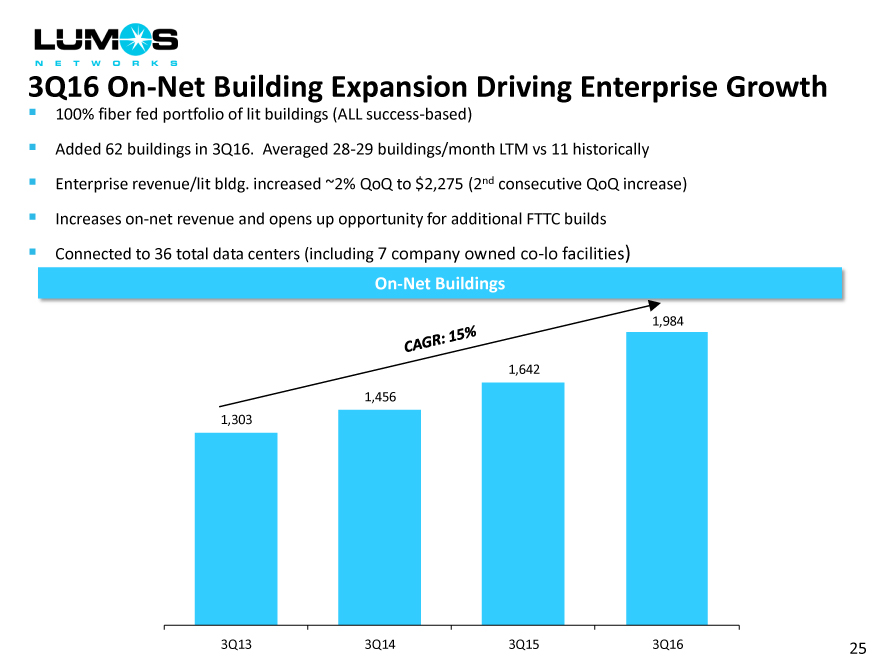
3Q16 On-Net Building Expansion Driving Enterprise Growth
100% fiber fed portfolio of lit buildings (ALL success-based)
Added 62 buildings in 3Q16. Averaged 28-29 buildings/month LTM vs 11 historically
Enterprise revenue/lit bldg. increased ~2% QoQ to $2,275 (2nd consecutive QoQ increase)
Increases on-net revenue and opens up opportunity for additional FTTC builds
Connected to 36 total data centers (including 7 company owned co-lo facilities)
On-Net Buildings
1,984
1,642
1,456 1,303
3Q13
3Q14
3Q15
3Q16
25
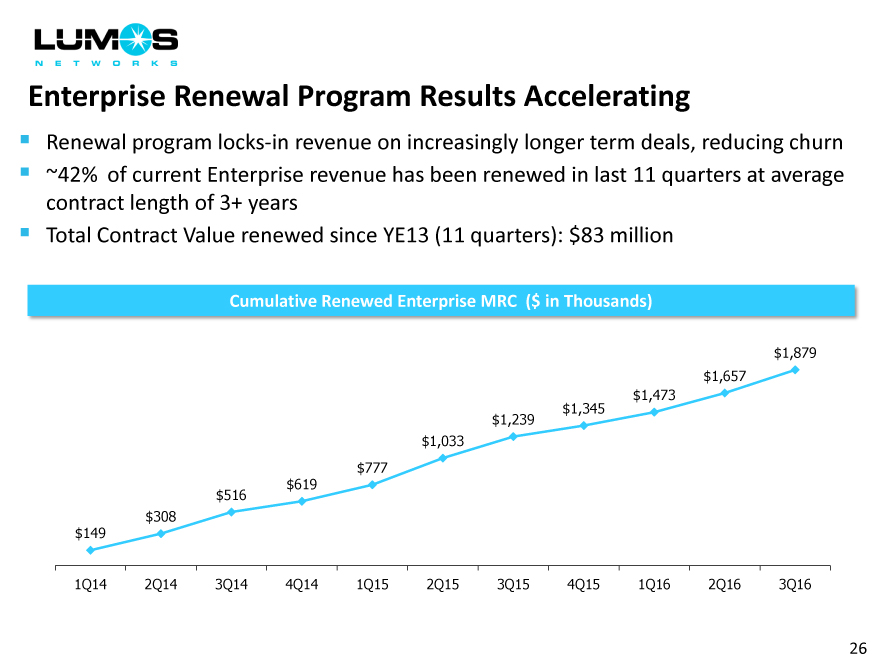
Enterprise Renewal Program Results Accelerating
Renewal program locks-in revenue on increasingly longer term deals, reducing churn
~42% of current Enterprise revenue has been renewed in last 11 quarters at average
contract length of 3+ years
Total Contract Value renewed since YE13 (11 quarters): $83 million
Cumulative Renewed Enterprise MRC ($in Thousands)
$1,879
$1,657
$1,473
$1,345
$1,239
$1,033
$777
$619
$516
$308
$149
1Q14 2Q14 3Q144Q141Q152Q153Q154Q151Q162Q163Q16
26
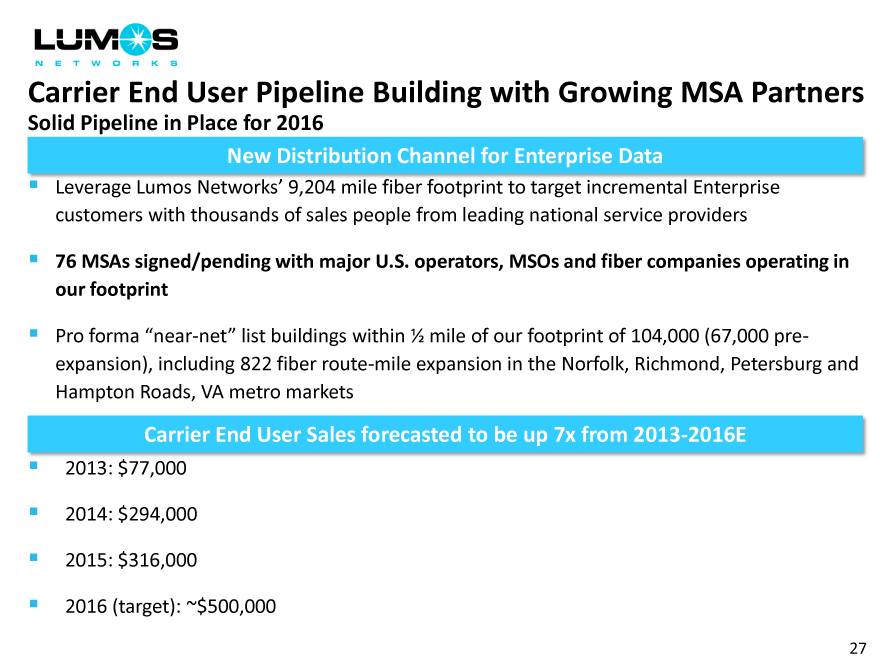
Carrier End User Pipeline Building with Growing MSA Partners
Solid Pipeline in Place for 2016
New Distribution Channel for Enterprise Data
Leverage Lumos Networks’ 9,204 mile fiber footprint to target incremental Enterprise
customers with thousands of sales people from leading national service providers
76 MSAs signed/pending with major U.S. operators, MSOs and fiber companies operating in
our footprint
Pro forma near-net list buildings within 1/2 mile of our footprint of 104,000 (67,000 pre-
expansion), including 822 fiber route-mile expansion in the Norfolk, Richmond, Petersburg and
Hampton Roads, VA metro markets
Carrier End User Sales forecasted to be up 7x from 2013-2016E
2013: $77,000 2014: $294,000 2015: $316,000 2016 (target): ~$500,000
27
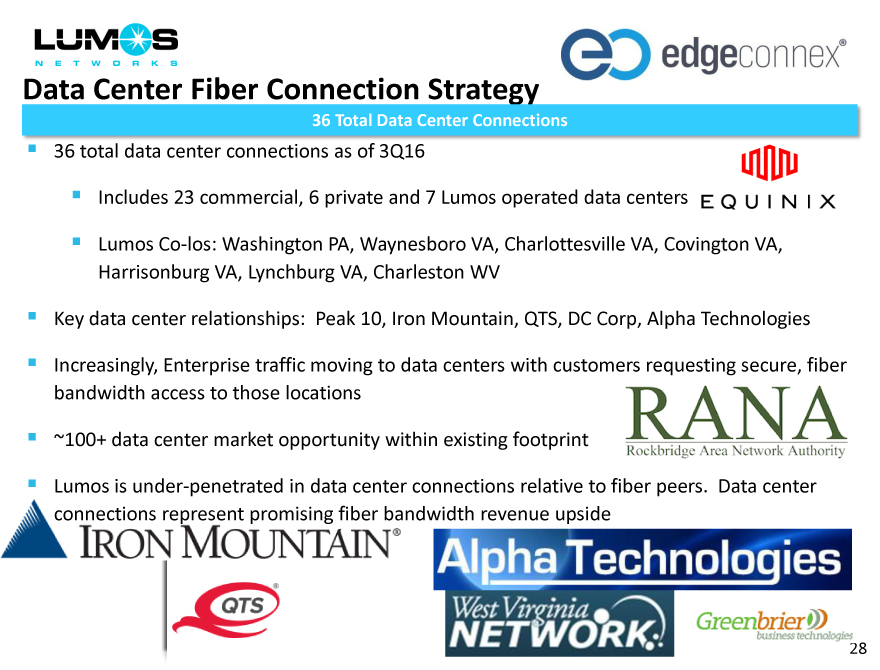
Data Center Fiber Connection Strategy
36 Total Data Center Connections
36 total data center connections as of 3Q16
Includes 23 commercial, 6 private and 7 Lumos operated data centers
Lumos Co-los: Washington PA, Waynesboro VA, Charlottesville VA, Covington VA,
Harrisonburg VA, Lynchburg VA, Charleston WV
Key data center relationships: Peak 10, Iron Mountain, QTS, DC Corp, Alpha Technologies
Increasingly, Enterprise traffic moving to data centers with customers requesting secure, fiber
bandwidth access to those locations
~100+ data center market opportunity within existing footprint
Lumos is under-penetrated in data center connections relative to fiber peers. Data center
dwidth revenue upside
28
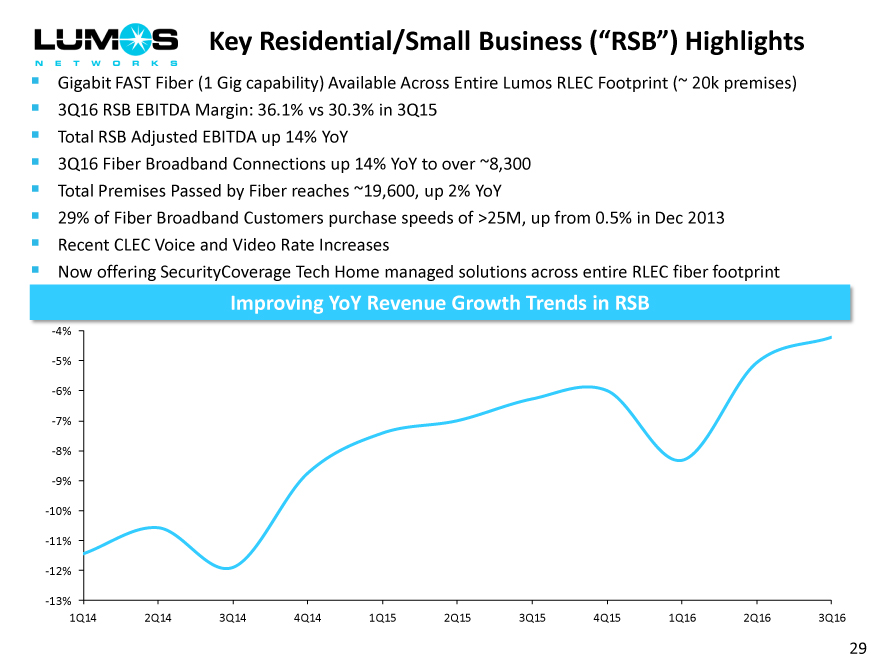
Key Residential/Small Business (RSB ) Highlights
Gigabit FAST Fiber (1 Gig capability) Available Across Entire Lumos RLEC Footprint (~ 20k premises)
3Q16 RSB EBITDA Margin: 36.1% vs 30.3% in 3Q15
Total RSB Adjusted EBITDA up 14% YoY
3Q16 Fiber Broadband Connections up 14% YoY to over ~8,300
Total Premises Passed by Fiber reaches ~19,600, up 2% YoY
29% of Fiber Broadband Customers purchase speeds of >25M, up from 0.5% in Dec 2013
Recent CLEC Voice and Video Rate Increases
Now offering SecurityCoverage Tech Home managed solutions across entire RLEC fiber footprint
Improving YoY Revenue Growth Trends in RSB
-4%
-5%
-6%
-7%
-8%
-9%
-10%
-11%
-12%
-13%
1Q14 2Q14 3Q14 4Q14 1Q15 2Q15 3Q15 4Q15 1Q16 2Q16 3Q16
29
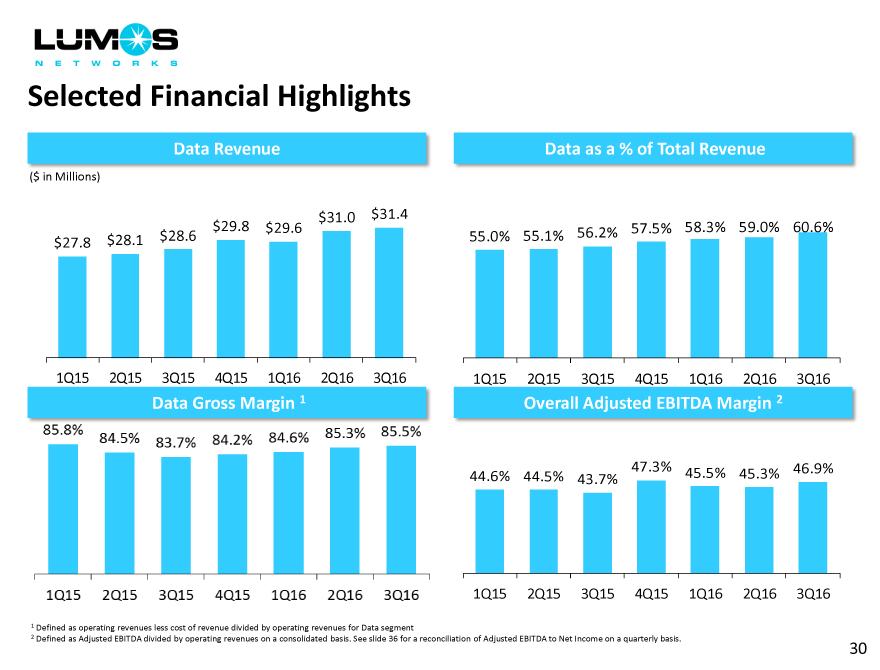
Selected Financial Highlights
Data Revenue
Data as a % of Total Revenue
($ in Millions)
$29.8 $31.0 $31.4 $29.6 56.2% 57.5% 58.3% 59.0% 60.6% $28.1 $28.6 55.0% 55.1% $27.8
1Q15 2Q15 3Q154Q151Q162Q163Q161Q152Q153Q154Q151Q162Q163Q16
Data Gross Margin 1Overall Adjusted EBITDA Margin 2
44.6% 44.5% 43.7%47.3%45.5%45.3%46.9%
1Q15 2Q15 3Q154Q151Q162Q163Q16
1 Defined as operating revenues less cost of revenue divided by operating revenues for Data segment
2 Defined as Adjusted EBITDA divided by operating revenues on a consolidated basis. See slide 36 for a reconciliation of Adjusted EBITDA to Net Income on a quarterly basis.
30
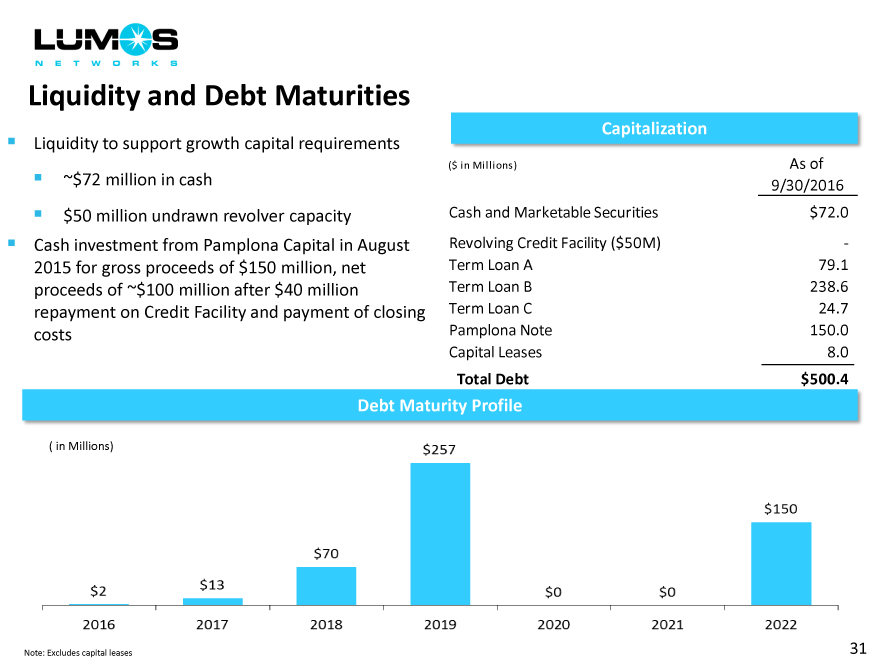
Liquidity and Debt Maturities
Liquidity to support growth capital requirements
~$72 million in cash
$50 million undrawn revolver capacity
Cash investment from Pamplona Capital in August
2015 for gross proceeds of $150 million, net
proceeds of ~$100 million after $40 million
repayment on Credit Facility and payment of closing
costs
Capitalization
($ in Millions) As of
9/30/2016
Cash and Marketable Securities $72.0
Revolving Credit Facility ($50M) -
Term Loan A 79.1
Term Loan B 238.6
Term Loan C 24.7
Pamplona Note 150.0
Capital Leases 8.0
Total Debt $500.4
Debt Maturity Profile
Note: Excludes capital leases 31
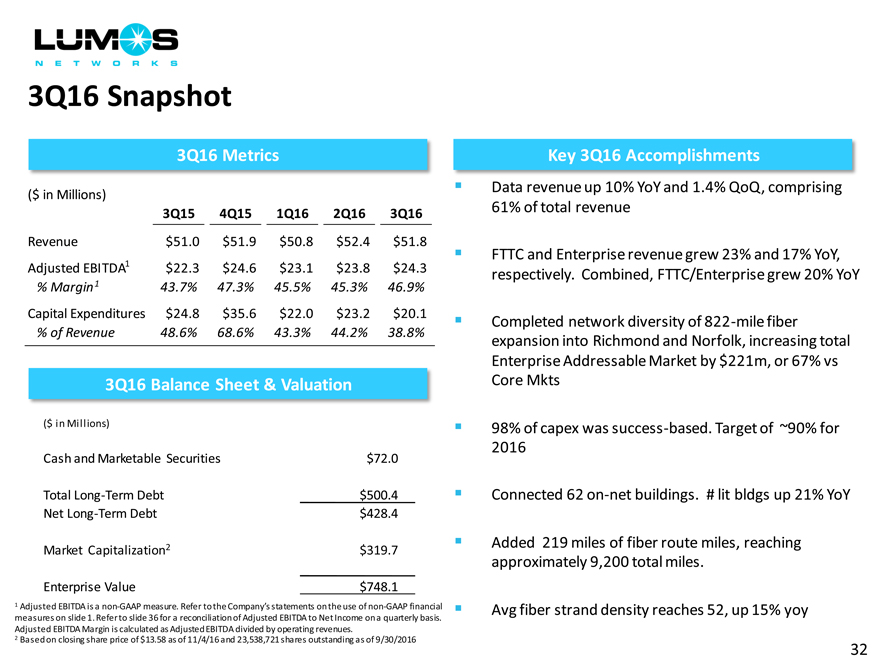
3Q16 Snapshot
3Q16 Metrics
($ in Millions)
3Q15 4Q151Q162Q163Q16
Revenue $51.0 $51.9$50.8$52.4$51.8
Adjusted EBITDA1 $22.3 $24.6$23.1$23.8$24.3
% Margin 1 43.7% 47.3%45.5%45.3%46.9%
Capital Expenditures $24.8 $35.6$22.0$23.2$20.1
% of Revenue 48.6% 68.6%43.3%44.2%38.8%
3Q16 Balance Sheet & Valuation
($ in Millions)
Cash and Marketable Securities $72.0
Total Long-Term Debt $500.4
Net Long-Term Debt $428.4
Market Capitalization2 $319.7
Enterprise Value $748.1
1 Adjusted EBITDA is a non-GAAP measure. Refer to the Company’s statements on the use of non-GAAP financial measures on slide 1. Refer to slide 36 for a reconciliation of Adjusted EBITDA to Net Income on a quarterly basis. Adjusted EBITDA Margin is calculated as Adjusted EBITDA divided by operating revenues.
2 Based on closing share price of $13.58 as of 11/4/16 and 23,538,721 shares outstanding as of 9/30/2016
Key 3Q16 Accomplishments
Data revenue up 10% YoY and 1.4% QoQ, comprising
61% of total revenue
FTTC and Enterprise revenue grew 23% and 17% YoY,
respectively. Combined, FTTC/Enterprise grew 20% YoY
Completed network diversity of 822-mile fiber
expansion into Richmond and Norfolk, increasing total
Enterprise Addressable Market by $221m, or 67% vs
Core Mkts
98% of capex was success-based. Target of ~90% for
2016
Connected 62 on-net buildings. # lit bldgs up 21% YoY
Added 219 miles of fiber route miles, reaching
approximately 9,200 total miles.
Avg fiber strand density reaches 52, up 15% yoy
32
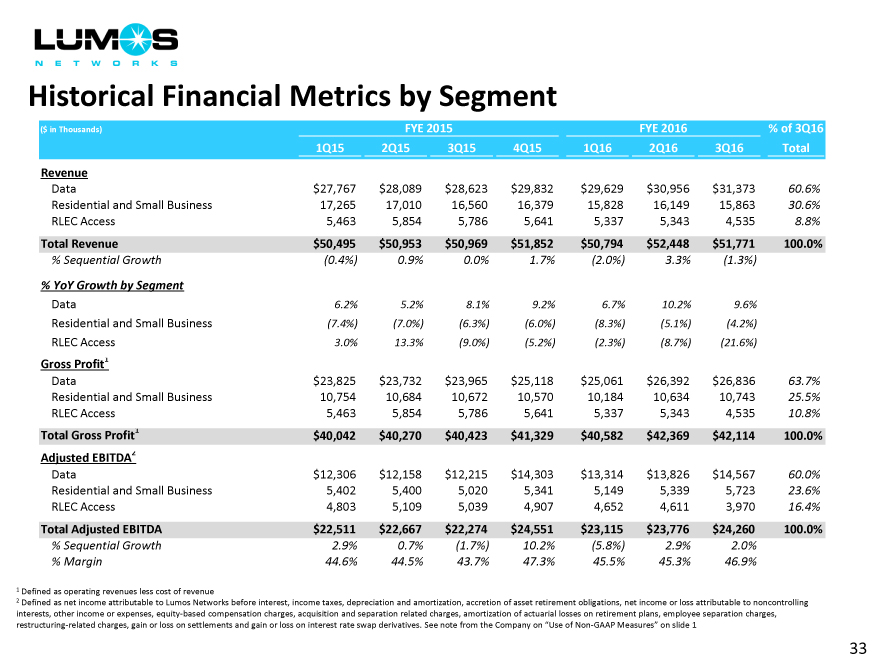
Historical Financial Metrics by Segment
($ in Thousands) FYE 2015FYE 2016% of 3Q16
1Q15 2Q153Q154Q151Q162Q163Q16Total
Revenue
Data $27,767 $28,089$28,623$29,832$29,629$30,956$31,37360.6%
Residential and Small Business 17,265 17,01016,56016,37915,82816,14915,86330.6%
RLEC Access 5,463 5,8545,7865,6415,3375,3434,5358.8%
Total Revenue $50,495 $50,953$50,969$51,852$50,794$52,448$51,771100.0%
% Sequential Growth (0.4%) 0.9%0.0%1.7%(2.0%)3.3%(1.3%)
% YoY Growth by Segment
Data 6.2% 5.2%8.1%9.2%6.7%10.2%9.6%
Residential and Small Business (7.4%) (7.0%)(6.3%)(6.0%)(8.3%)(5.1%)(4.2%)
RLEC Access 3.0% 13.3%(9.0%)(5.2%)(2.3%)(8.7%)(21.6%)
Gross Profit1
Data $23,825 $23,732$23,965$25,118$25,061$26,392$26,83663.7%
Residential and Small Business 10,754 10,68410,67210,57010,18410,63410,74325.5%
RLEC Access 5,463 5,8545,7865,6415,3375,3434,53510.8%
Total Gross Profit1 $40,042 $40,270$40,423$41,329$40,582$42,369$42,114100.0%
Adjusted EBITDA2
Data $12,306 $12,158$12,215$14,303$13,314$13,826$14,56760.0%
Residential and Small Business 5,402 5,4005,0205,3415,1495,3395,72323.6%
RLEC Access 4,803 5,1095,0394,9074,6524,6113,97016.4%
Total Adjusted EBITDA $22,511 $22,667$22,274$24,551$23,115$23,776$24,260100.0%
% Sequential Growth 2.9% 0.7%(1.7%)10.2%(5.8%)2.9%2.0%
% Margin 44.6% 44.5%43.7%47.3%45.5%45.3%46.9%
1 Defined as operating revenues less cost of revenue
2 Defined as net income attributable to Lumos Networks before interest, income taxes, depreciation and amortization, accretion of asset retirement obligations, net income or loss attributable to noncontrolling interests, other income or expenses, equity-based compensation charges, acquisition and separation related charges, amortization of actuarial losses on retirement plans, employee separation charges, restructuring-related charges, gain or loss on settlements and gain or loss on interest rate swap derivatives. See note from the Company on Use of Non-GAAP Measures on slide 1
33
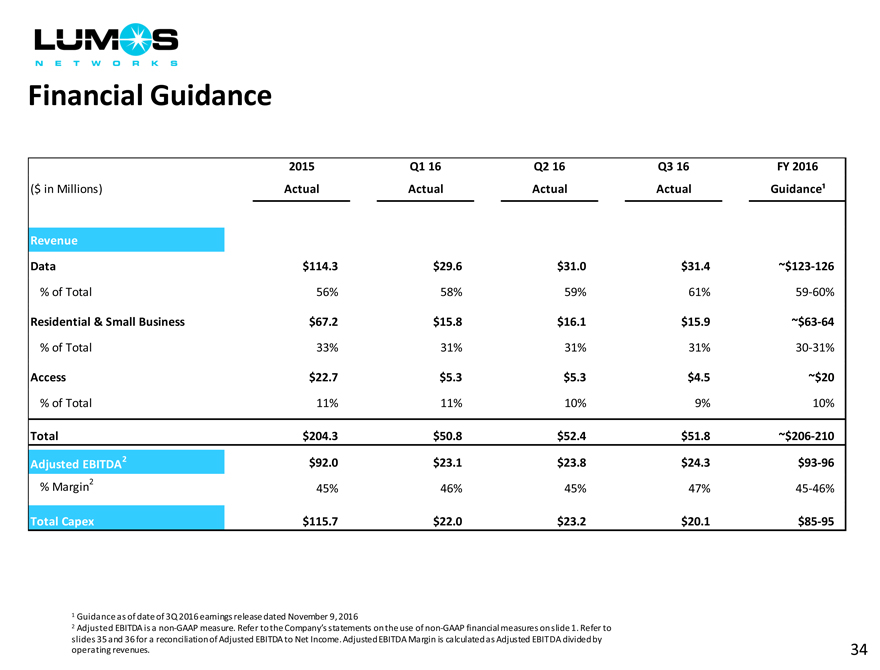
Financial Guidance
2015 Q1 16Q2 16Q3 16FY 2016
($ in Millions) Actual ActualActualActualGuidance¹
Revenue
Data $114.3 $29.6$31.0$31.4~$123-126
% of Total 56% 58%59%61%59-60%
Residential & Small Business $67.2 $15.8$16.1$15.9~$63-64
% of Total 33% 31%31%31%30-31%
Access $22.7 $5.3$5.3$4.5~$20
% of Total 11% 11%10%9%10%
Total $204.3 $50.8$52.4$51.8~$206-210
Adjusted EBITDA2 $92.0 $23.1$23.8$24.3$93-96
% Margin2 45% 46%45%47%45-46%
Total Capex $115.7 $22.0$23.2$20.1$85-95
1 Guidance as of date of 3Q 2016 earnings release dated November 9, 2016
2 Adjusted EBITDA is a non-GAAP measure. Refer to the Company’s statements on the use of non-GAAP financial measures on slide 1. Refer to
slides 35 and 36 for a reconciliation of Adjusted EBITDA to Net Income. Adjusted EBITDA Margin is calculated as Adjusted EBITDA divided by
operating revenues. 34
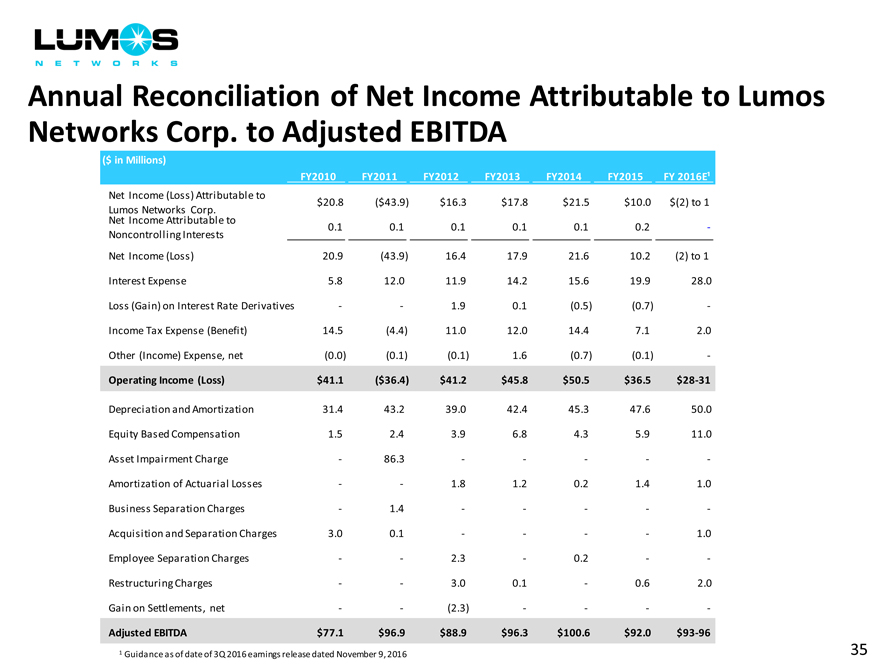
Annual Reconciliation of Net Income Attributable to Lumos Networks Corp. to Adjusted EBITDA
($ in Millions)
FY2010 FY2011FY2012FY2013FY2014FY2015FY 2016E¹
Net Income (Loss) Attributable to
$20.8 ($43.9)$16.3$17.8$21.5$10.0$(2) to 1
Lumos Networks Corp.
Net Income Attributable to
0.1 0.10.10.10.10.2-
Noncontrolling Interests
Net Income (Loss) 20.9 (43.9)16.417.921.610.2(2) to 1
Interest Expense 5.8 12.011.914.215.619.928.0
Loss (Gain) on Interest Rate Derivatives - -1.90.1(0.5)(0.7)-
Income Tax Expense (Benefit) 14.5 (4.4)11.012.014.47.12.0
Other (Income) Expense, net (0.0) (0.1)(0.1)1.6(0.7)(0.1)-
Operating Income (Loss) $41.1 ($36.4)$41.2$45.8$50.5$36.5$28-31
Depreciation and Amortization 31.4 43.239.042.445.347.650.0
Equity Based Compensation 1.5 2.43.96.84.35.911.0
Asset Impairment Charge - 86.3-----
Amortization of Actuarial Losses - -1.81.20.21.41.0
Business Separation Charges - 1.4-----
Acquisition and Separation Charges 3.0 0.1----1.0
Employee Separation Charges - -2.3-0.2--
Restructuring Charges - -3.00.1-0.62.0
Gain on Settlements, net - -(2.3)----
Adjusted EBITDA $77.1 $96.9$88.9$96.3$100.6$92.0$93-96
1 Guidance as of date of 3Q 2016 earnings release dated November 9, 2016 35
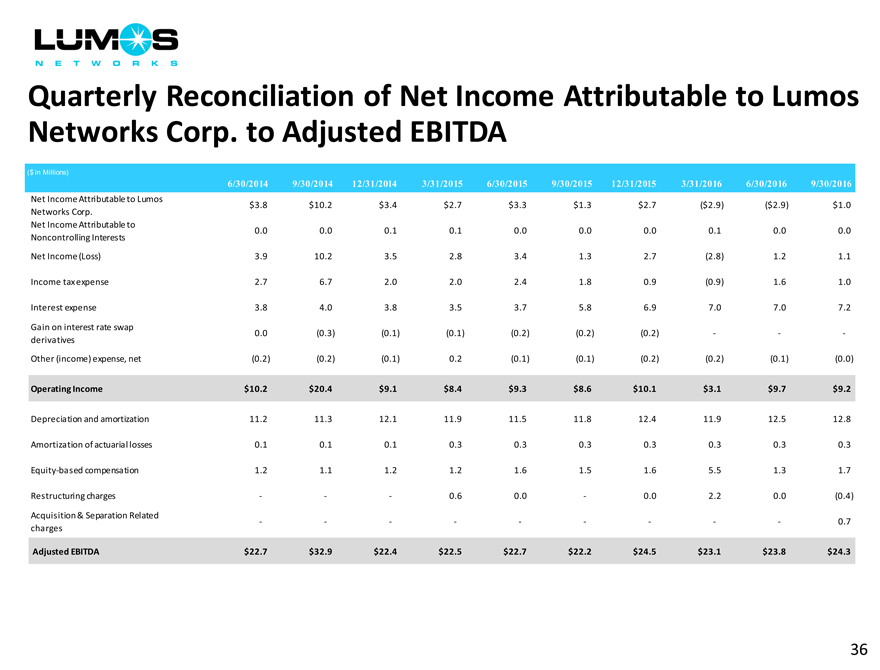
Quarterly Reconciliation of Net Income Attributable to Lumos Networks Corp. to Adjusted EBITDA
($ in M illions)
6/30/2014 9/30/201412/31/20143/31/20156/30/20159/30/201512/31/20153/31/20166/30/20169/30/2016
Net Income Attributable to Lumos
$3.8 $10.2$3.4$2.7$3.3$1.3$2.7($2.9)($2.9)$1.0
Networks Corp.
Net Income Attributable to
0.0 0.00.10.10.00.00.00.10.00.0
Noncontrolling Interests
Net Income (Loss) 3.9 10.23.52.83.41.32.7(2.8)1.21.1
Income tax expense 2.7 6.72.02.02.41.80.9(0.9)1.61.0
Interest expense 3.8 4.03.83.53.75.86.97.07.07.2
Gain on interest rate swap
0.0 (0.3)(0.1)(0.1)(0.2)(0.2)(0.2)---
derivatives
Other (income) expense, net (0.2) (0.2)(0.1)0.2(0.1)(0.1)(0.2)(0.2)(0.1)(0.0)
Operating Income $10.2 $20.4$9.1$8.4$9.3$8.6$10.1$3.1$9.7$9.2
Depreciation and amortization 11.2 11.312.111.911.511.812.411.912.512.8
Amortization of actuarial losses 0.1 0.10.10.30.30.30.30.30.30.3
Equity-based compensation 1.2 1.11.21.21.61.51.65.51.31.7
Restructuring charges - --0.60.0-0.02.20.0(0.4)
Acquisition & Separation Related
- --------0.7
charges
Adjusted EBITDA $22.7 $32.9$22.4$22.5$22.7$22.2$24.5$23.1$23.8$24.3
36