Exhibit 99.2

Slide: 1 Title: First Quarter 2012 Earnings Call Body: April 24th, 2012
Slide: 2 Other Placeholder: Other Placeholder: 2 This presentation, as well as other statements made by Delphi Automotive (“Delphi” or the “Company”), contain forward-looking statements that reflect, when made, the Company’s current views with respect to current events and financial performance. Such forward-looking statements are subject to many risks, uncertainties and factors relating to the Company’s operations and business environment, which may cause the actual results of the Company to be materially different from any future results, express or implied, by such forward-looking statements. All statements that address future operating, financial or business performance or the Company’s strategies or expectations are forward-looking statements. In some cases, you can identify these statements by forward-looking words such as “may,” “might,” “will,” “should,” “expects,” “plans,” “anticipates,” “believes,” “estimates,” “predicts,” “projects,” “potential,” “outlook” or “continue,” and other comparable terminology. Factors that could cause actual results to differ materially from these forward-looking statements include, but are not limited to, the following: global economic conditions, including conditions affecting the credit market, the cyclical nature of automotive sales and production; the potential disruptions in the supply of and changes in the competitive environment for raw material integral to our products; the Company’s ability to maintain contracts that are critical to its operations; the ability of the Company to attract, motivate and/or retain key executives; the ability of the Company to avoid or continue to operate during a strike, or partial work stoppage or slow down by any of its unionized employees or those of its principal customers, and the ability of the Company to attract and retain customers. Additional factors are discussed under the captions “Risk Factors” and “Management’s Discussion and Analysis of Financial Condition and Results of Operations” in the Company’s filings with the Securities and Exchange Commission. New risks and uncertainties arise from time to time, and it is impossible for us to predict these events or how they may affect the Company. It should be remembered that the price of the ordinary shares and any income from them can go down as well as up. Delphi disclaims any intention or obligation to update or revise any forward-looking statements, whether as a result of new information, future events and/or otherwise, except as may be required by law. Forward-Looking Statements 2
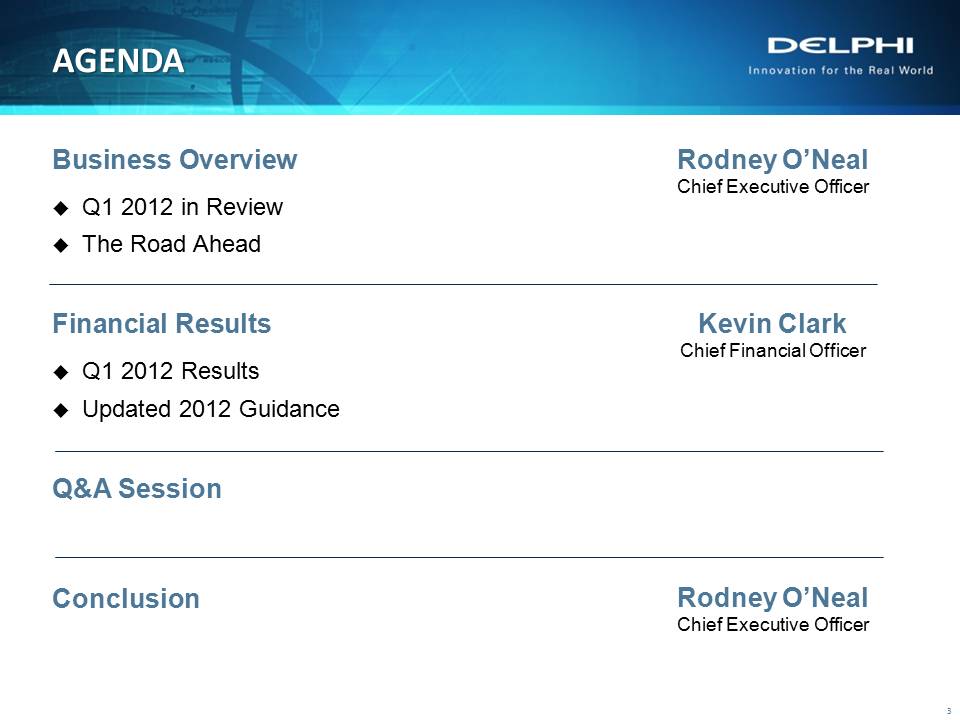
Slide: 3 Other Placeholder: Other Placeholder: 3 AGENDA 3 Business Overview Q1 2012 in ReviewThe Road AheadFinancial Results Q1 2012 ResultsUpdated 2012 GuidanceQ&A SessionConclusion Rodney O’Neal Chief Executive Officer Kevin Clark Chief Financial Officer Rodney O’Neal Chief Executive Officer

Slide: 4 Title: Rodney O’Neal Body: Business Overview
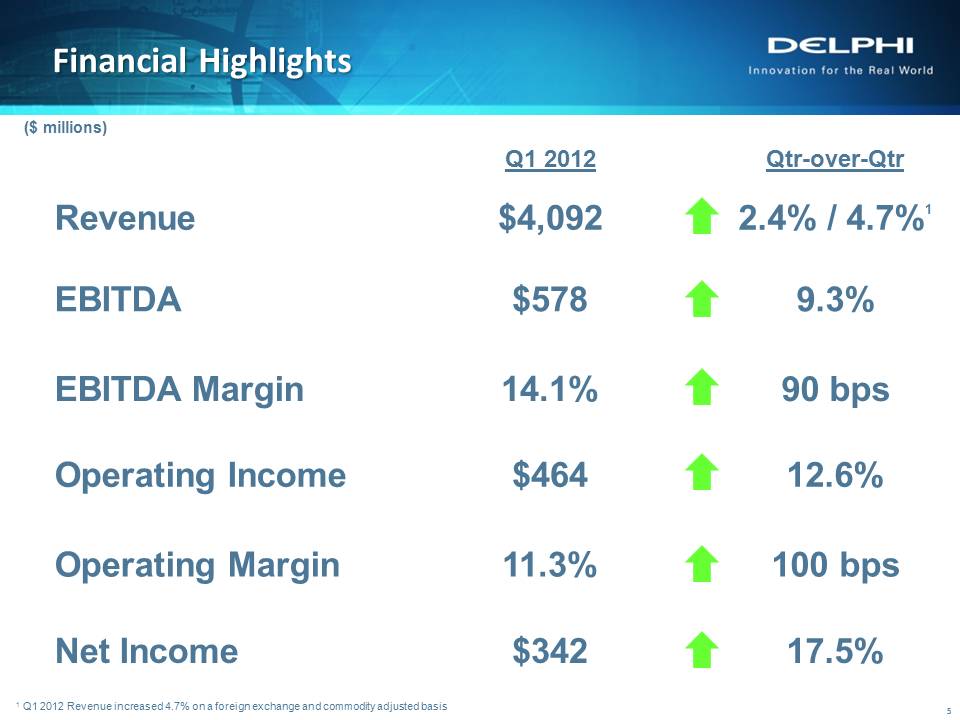
Financial Highlights Q1 2012 Qtr-over-Qtr Revenue $4,092 2.4% / 4.7%1 EBITDA $578 9.3% EBITDA Margin 14.1% 90 bps Operating Income $464 12.6% Operating Margin 11.3% 100 bps Net Income $342 17.5% 5 ($ millions) 1 Q1 2012 Revenue increased 4.7% on a foreign exchange and commodity adjusted basis

Slide: 6 Q1 New Model Debuts Featuring Delphi Product Content 6 DetroitN.A. Int’l Auto Show GenevaMotor Show New DelhiAuto Expo India Audi A6 AllroadAudi A3BMW 6 Series Gran CoupeDacia LodgyFiat 500LFerrari F12 BerlinettaFord B-MaxFord KugaJaguar XF Sport BrakeKia Cee’dMercedes Benz A-ClassOpel MokkaPeugeot 208Porsche Boxster Ford FusionBentley Continental GT V8BMW 3 Series SedanBuick EncoreCadillac ATSChevrolet SonicDodge DartLexus LX 570Mercedes-Benz E400 HybridMercedes-Benz SL Mahindra XUV 500BMW MiniChevrolet EnjoyChevrolet MPVChevrolet SailChevrolet Tavera Neo 3Fiat LineaFiat PuntoFord EcoSport SUVHyundai SonataPeugot 508Skoda RapidNissan Vanette

Slide: 7 Growing our Emerging Market Footprint 7 New Delphi Electrical / Electronic Architecture Wuhan, China Facility (Gp:) Shanghai (Gp:) Suzhou (Gp:) Wuhan (Gp:) Beijing (Gp:) Shenyang (Gp:) Changchun (Gp:) Baicheng (Gp:) Guangzhou (Gp:) Yantai (Gp:) Wuhu
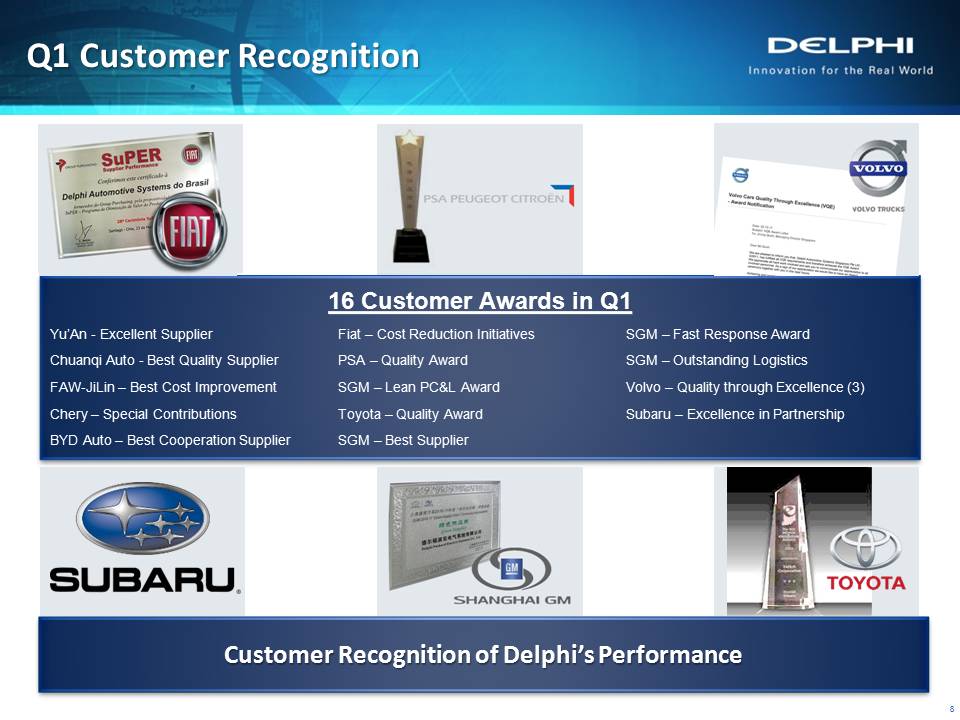
Slide: 8 16 Customer Awards in Q1Yu’An - Excellent Supplier Fiat – Cost Reduction Initiatives SGM – Fast Response Award Chuanqi Auto - Best Quality Supplier PSA – Quality Award SGM – Outstanding LogisticsFAW-JiLin – Best Cost Improvement SGM – Lean PC&L Award Volvo – Quality through Excellence (3)Chery – Special Contributions Toyota – Quality Award Subaru – Excellence in PartnershipBYD Auto – Best Cooperation Supplier SGM – Best Supplier Title: Q1 Customer Recognition Other Placeholder: 8 Customer Recognition of Delphi’s Performance

Slide: 9 PACE Industry Recognition 9 Premium Low Noise High Pressure GDi Pump – ProductL-Shape Crimp – Electrical/Electronic Architecture – ProductMulti Port Folded Tube Condenser – Manufacturing ProcessWiring Harness Bend Fatigue Simulation Software – Design Process Four Finalist Nominations
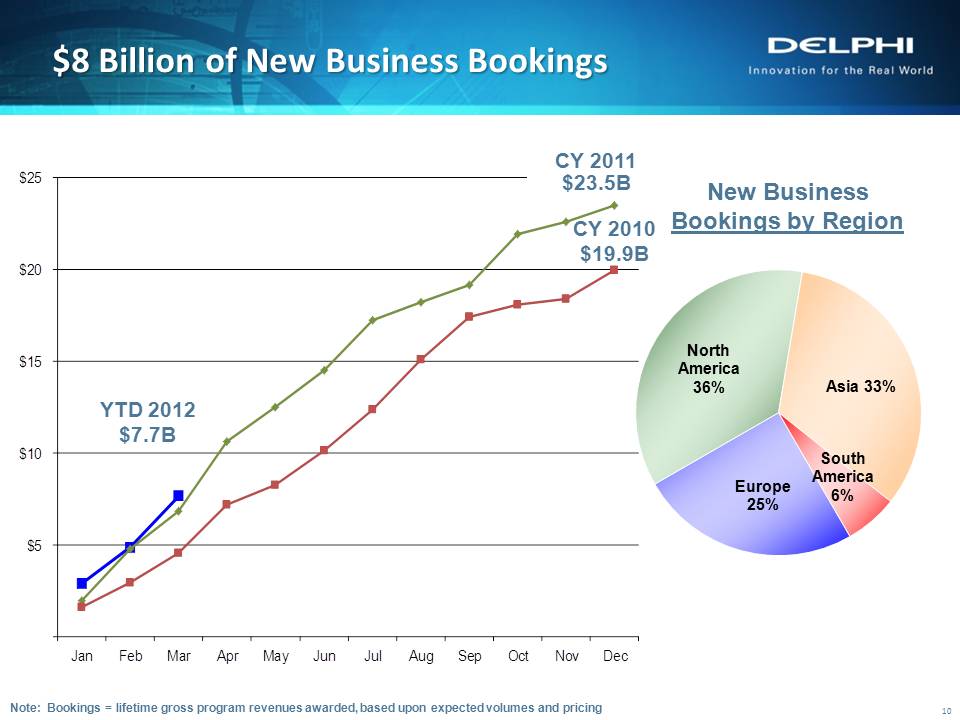
Slide: 10 YTD 2012$7.7B 10 New Business Bookings by Region CY 2010 $19.9B $8 Billion of New Business Bookings 10 Note: Bookings = lifetime gross program revenues awarded, based upon expected volumes and pricing CY 2011 $23.5B
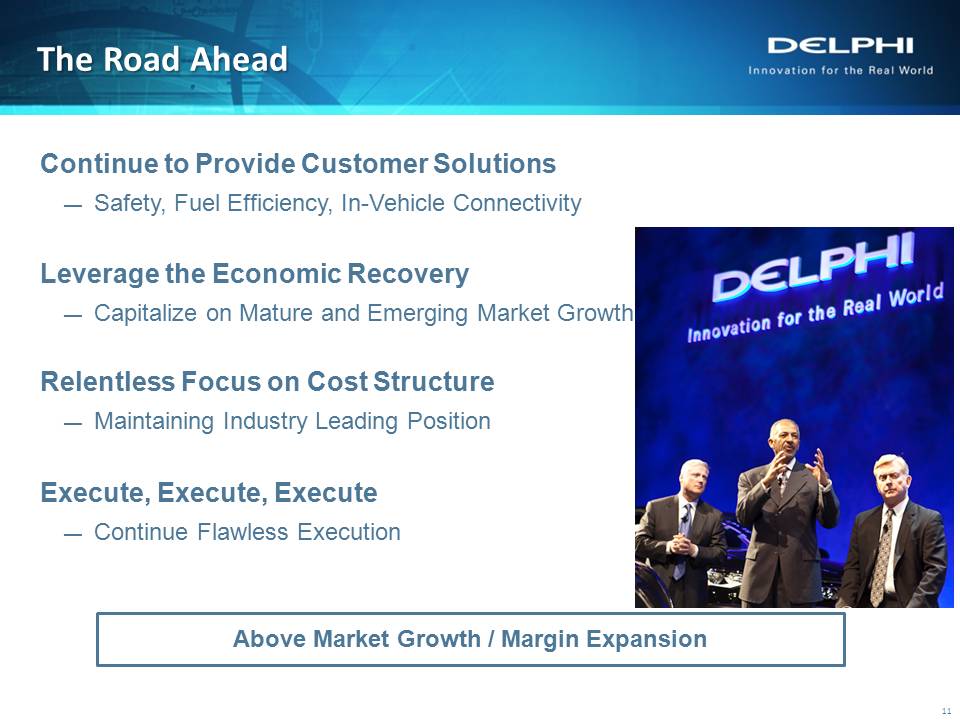
Slide: 11 Title: The Road Ahead Other Placeholder: Continue to Provide Customer SolutionsSafety, Fuel Efficiency, In-Vehicle ConnectivityLeverage the Economic RecoveryCapitalize on Mature and Emerging Market GrowthRelentless Focus on Cost StructureMaintaining Industry Leading PositionExecute, Execute, ExecuteContinue Flawless Execution Above Market Growth / Margin Expansion 11
Slide: 12 Title: Kevin Clark Body: Financial Results
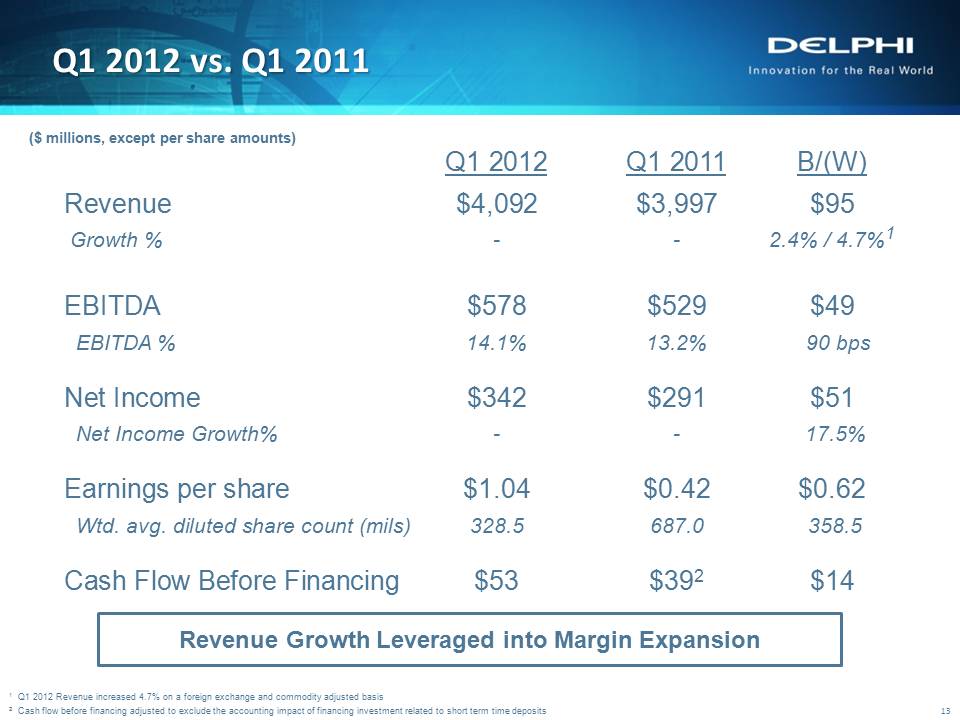
Slide: 13 Other Placeholder: 13 Q1 2012 Q1 2011 B/(W)Revenue $4,092 $3,997 $95 Growth % - - 2.4% / 4.7%1EBITDA $578 $529 $49 EBITDA % 14.1% 13.2% 90 bpsNet Income $342 $291 $51 Net Income Growth% - - 17.5%Earnings per share $1.04 $0.42 $0.62 Wtd. avg. diluted share count (mils) 328.5 687.0 358.5Cash Flow Before Financing $53 $392 $14 ($Mil’s) Q1 2012 vs. Q1 2011 13 1 Q1 2012 Revenue increased 4.7% on a foreign exchange and commodity adjusted basis2 Cash flow before financing adjusted to exclude the accounting impact of financing investment related to short term time deposits Revenue Growth Leveraged into Margin Expansion ($ millions, except per share amounts)
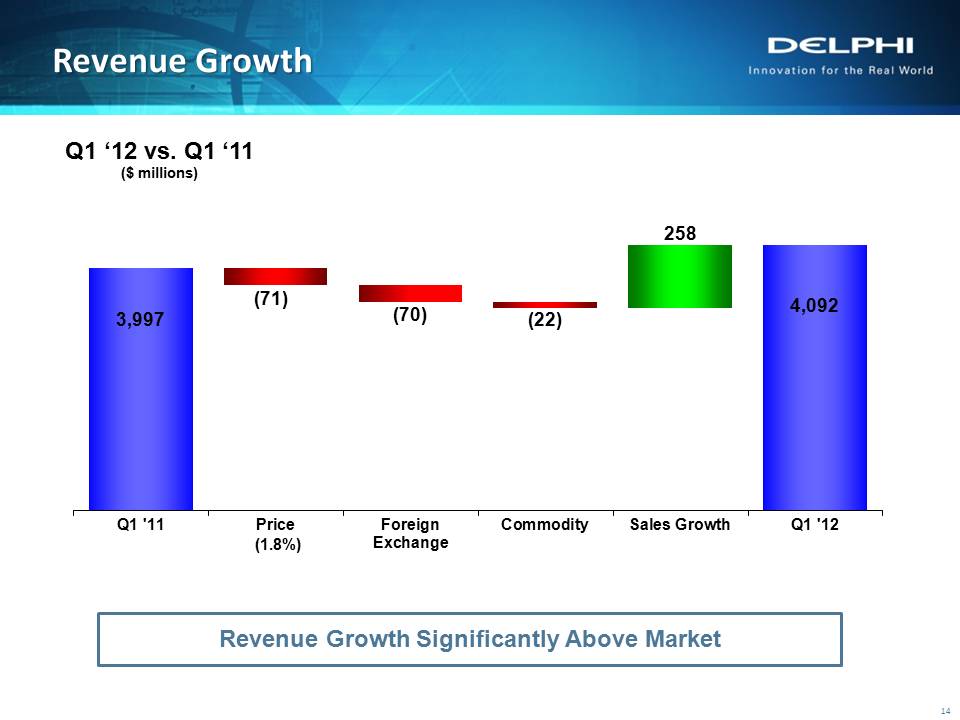
Slide: 14 Other Placeholder: 14 Revenue Growth Q1 ‘12 vs. Q1 ‘11($ millions) 14 (1.8%) Revenue Growth Significantly Above Market
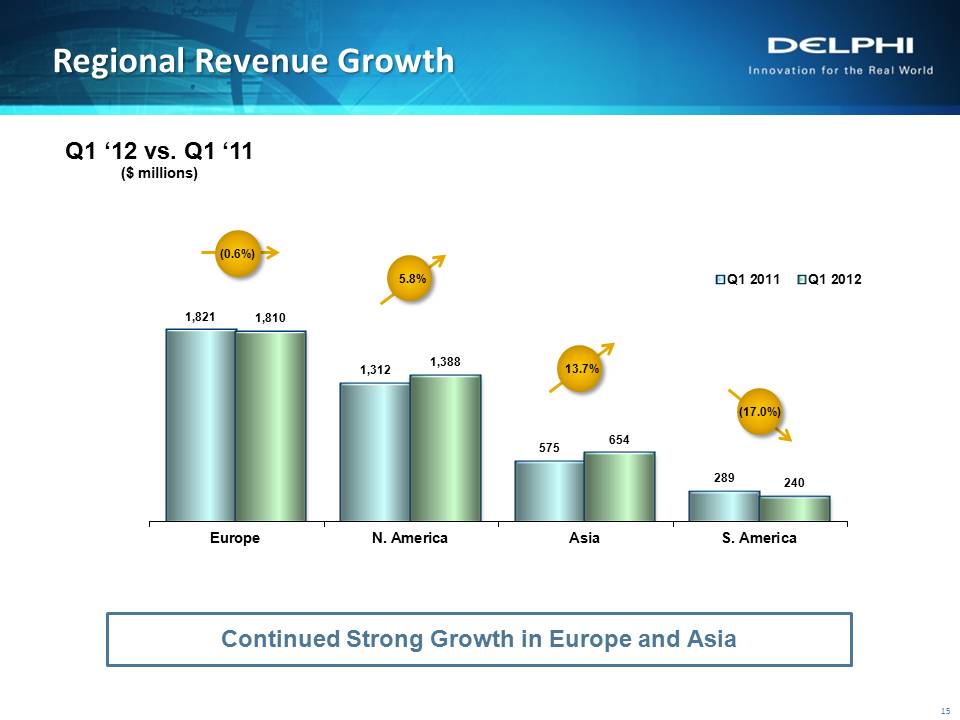
Slide: 15 Other Placeholder: 15 Q3 ‘11 vs. Q3 ‘10Regional Revenue($millions) Regional Revenue Growth Q1 ‘12 vs. Q1 ‘11($ millions) 15 Continued Strong Growth in Europe and Asia (Gp:) 5.8% (Gp:) 13.7% (Gp:) (17.0%) (Gp:) (0.6%)
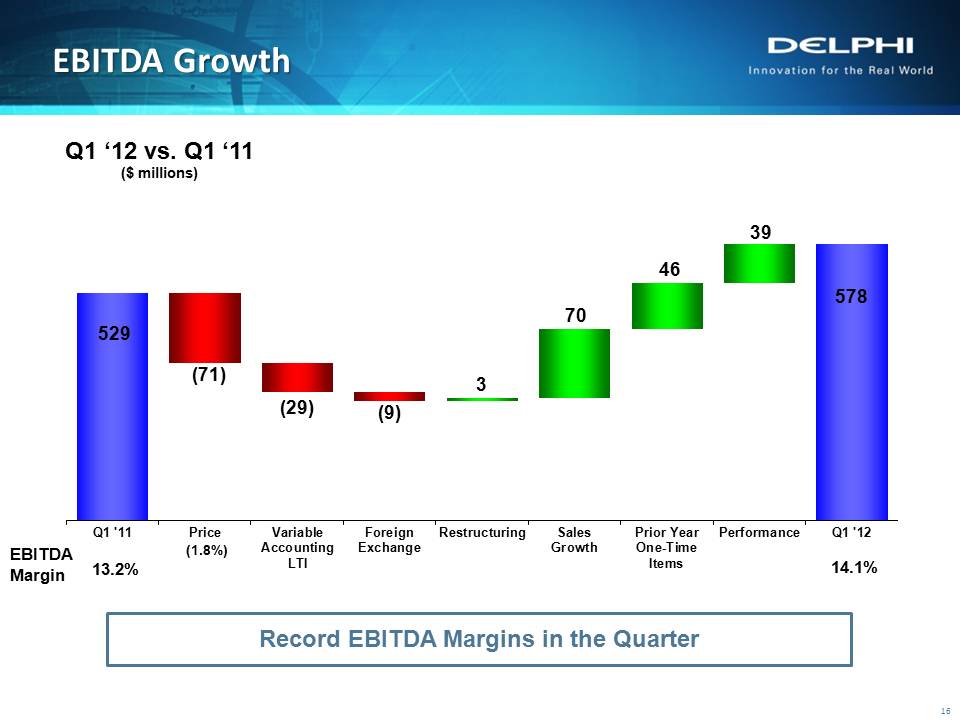
Slide: 16 16 Q3 ‘11 vs. Q3 ‘10Segment EBITDA ($ Millions) EBITDA Growth EBITDA = Operating Income + Depreciation/Amortization 16 (Gp:) 14.1% (Gp:) 13.2% (Gp:) EBITDAMargin (Gp:) (1.8%) Q1 ‘12 vs. Q1 ‘11($ millions) Record EBITDA Margins in the Quarter
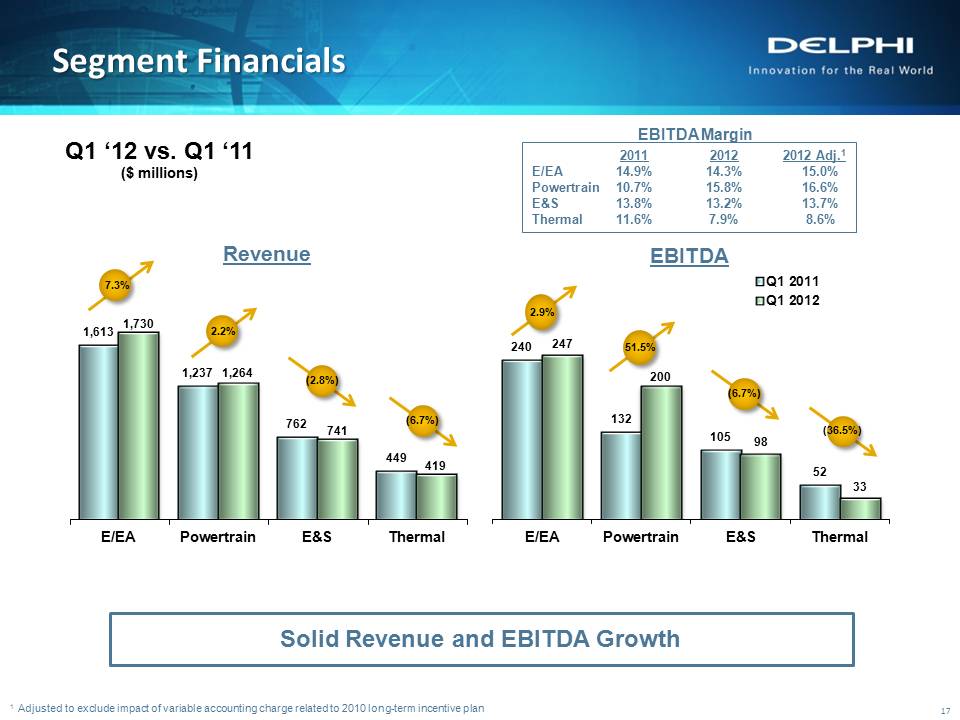
Slide: 17 (Gp:) 2.9% Other Placeholder: 17 Segment Financials 17 (Gp:) 7.3% (Gp:) 2.2% (Gp:) 51.5% (Gp:) (6.7%) Revenue EBITDA (Gp:) (2.8%) (Gp:) (6.7%) (Gp:) (36.5%) EBITDA Margin 2011 2012 2012 Adj.1E/EA 14.9% 14.3% 15.0%Powertrain 10.7% 15.8% 16.6%E&S 13.8% 13.2% 13.7%Thermal 11.6% 7.9% 8.6% Q1 ‘12 vs. Q1 ‘11($ millions) Solid Revenue and EBITDA Growth 1 Adjusted to exclude impact of variable accounting charge related to 2010 long-term incentive plan
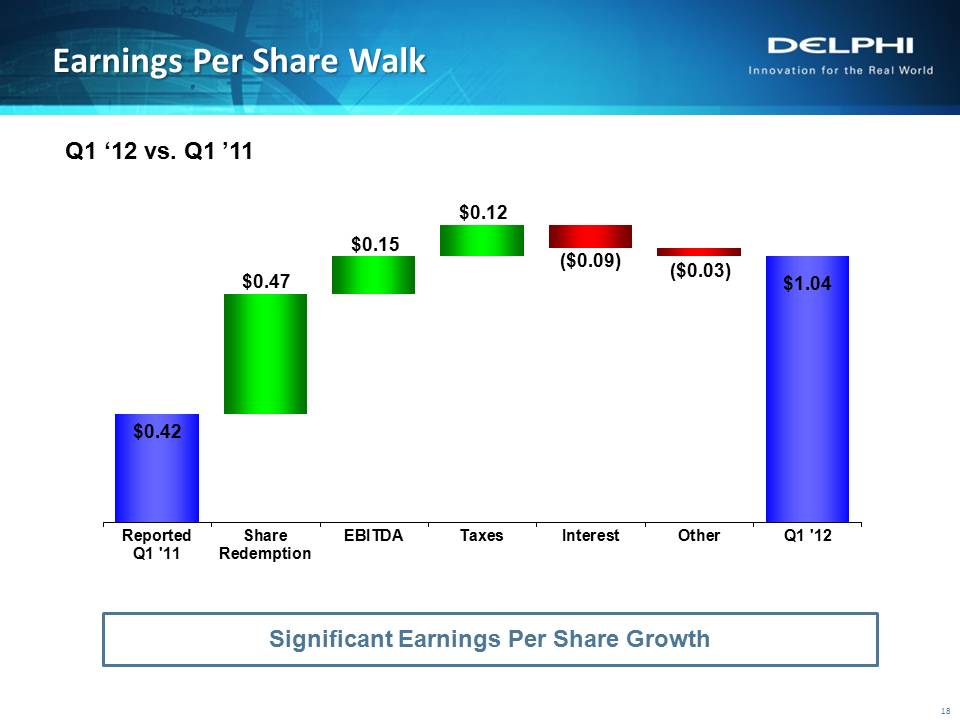
Slide: 18 Other Placeholder: 18 Earnings Per Share Walk 18 Significant Earnings Per Share Growth Q1 ‘12 vs. Q1 ’11
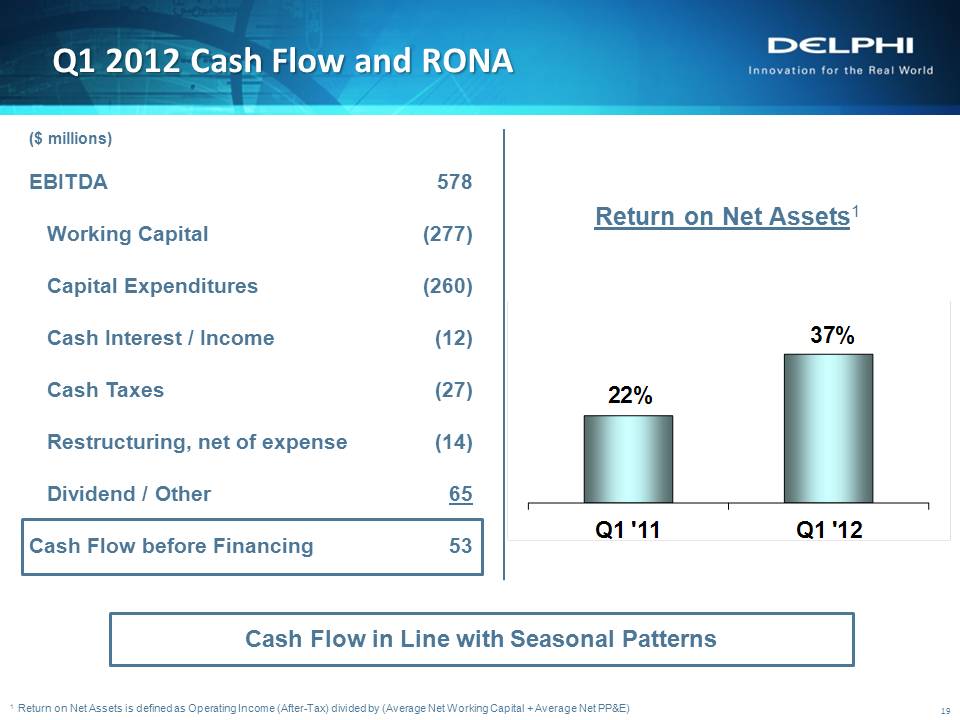
Slide: 19 EBITDA 578 Working Capital (277) Capital Expenditures (260) Cash Interest / Income (12)Cash Taxes (27) Restructuring, net of expense (14) Dividend / Other 65Cash Flow before Financing 53 Q1 2012 Cash Flow and RONA 19 ($ millions) Uses of cash4 Return on Net Assets1 1 Return on Net Assets is defined as Operating Income (After-Tax) divided by (Average Net Working Capital + Average Net PP&E) Cash Flow in Line with Seasonal Patterns
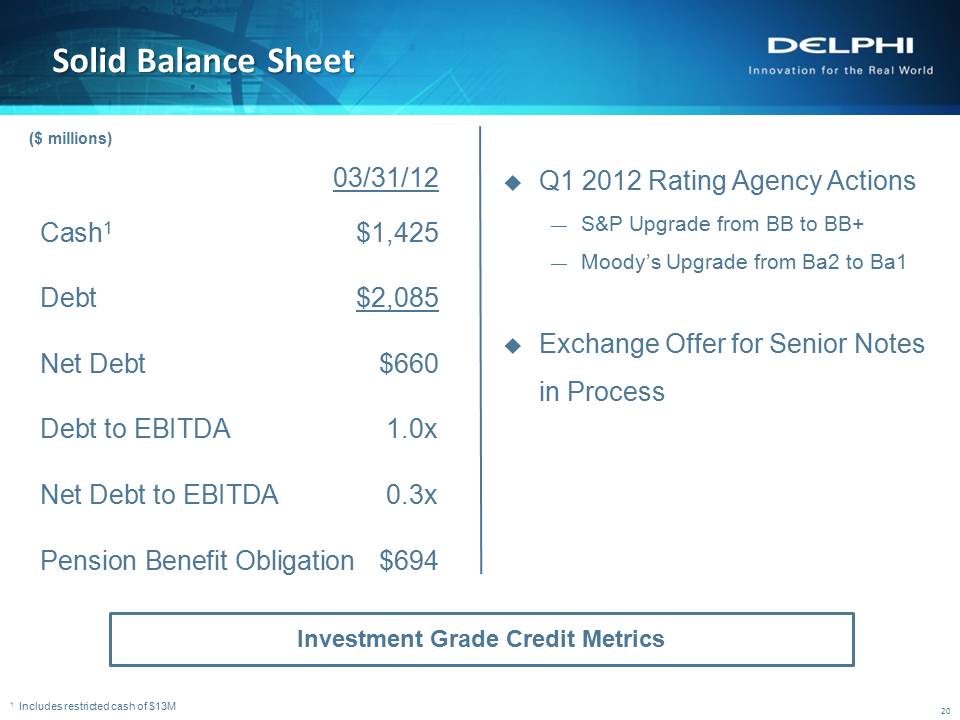
Slide: 20 Other Placeholder: 20 Global Liquidity ($ Millions) Solid Balance Sheet 20 03/31/12 Cash1 $1,425Debt $2,085Net Debt $660Debt to EBITDA 1.0xNet Debt to EBITDA 0.3xPension Benefit Obligation $694 1 Includes restricted cash of $13M Uses of cash4Q1 2012 Rating Agency ActionsS&P Upgrade from BB to BB+Moody’s Upgrade from Ba2 to Ba1Exchange Offer for Senior Notes in Process ($ millions) Investment Grade Credit Metrics
Solid Balance Sheet 20 03/31/12 Cash1 $1,425 Debt $2,085 Net Debt $660 Debt to EBITDA 1.0x Net Debt to EBITDA 0.3x Pension Benefit Obligation $694 1 Includes restricted cash of $13M Uses of cash4 Q1 2012 Rating Agency Actions — S&P Upgrade from BB to BB+ — Moody’s Upgrade from Ba2 to Ba1 Exchange Offer for Senior Notes in Process ($ millions) Investment Grade Credit Metrics
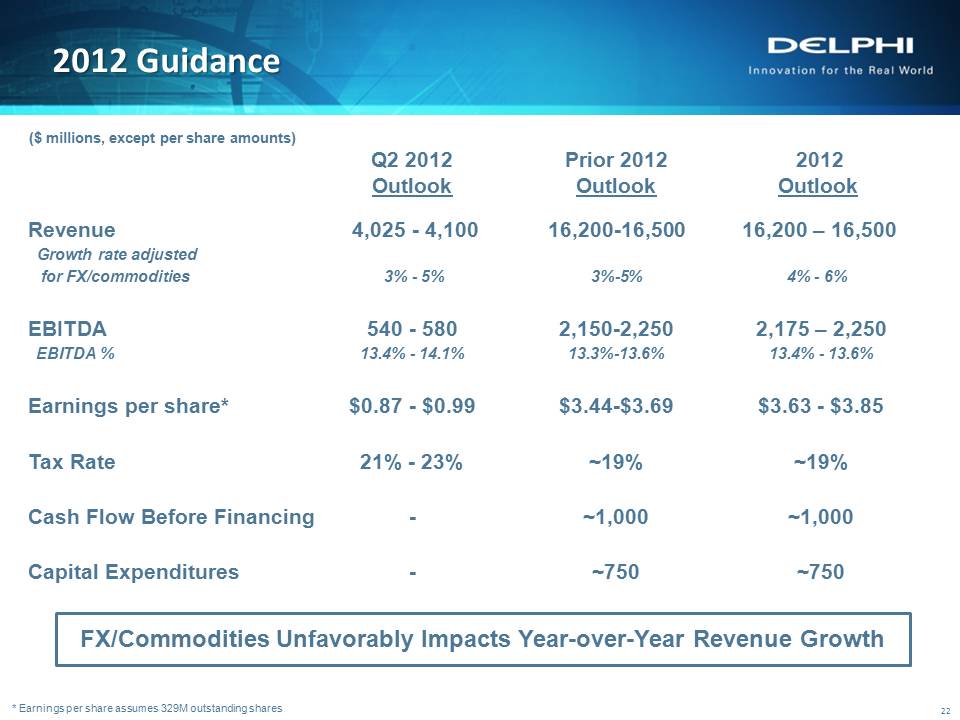
Slide: 22 Other Placeholder: 22 Q2 2012 Prior 2012 2012 Outlook Outlook Outlook Revenue 4,025 - 4,100 16,200-16,500 16,200 – 16,500 Growth rate adjusted for FX/commodities 3% - 5% 3%-5% 4% - 6%EBITDA 540 - 580 2,150-2,250 2,175 – 2,250 EBITDA % 13.4% - 14.1% 13.3%-13.6% 13.4% - 13.6%Earnings per share* $0.87 - $0.99 $3.44-$3.69 $3.63 - $3.85Tax Rate 21% - 23% ~19% ~19%Cash Flow Before Financing - ~1,000 ~1,000Capital Expenditures - ~750 ~750 2012 Guidance 22 ($ millions, except per share amounts) FX/Commodities Unfavorably Impacts Year-over-Year Revenue Growth * Earnings per share assumes 329M outstanding shares
Slide: 23 Full $300M Authorization Still Available for Share Repurchase ProgramIntend to file the 2012 Q1 10Q by April 27thOther Placeholder: 23 Other Items 23

Slide: 24 Title: Rodney O’Neal Body: Conclusion

Slide: 25 Title: Appendix
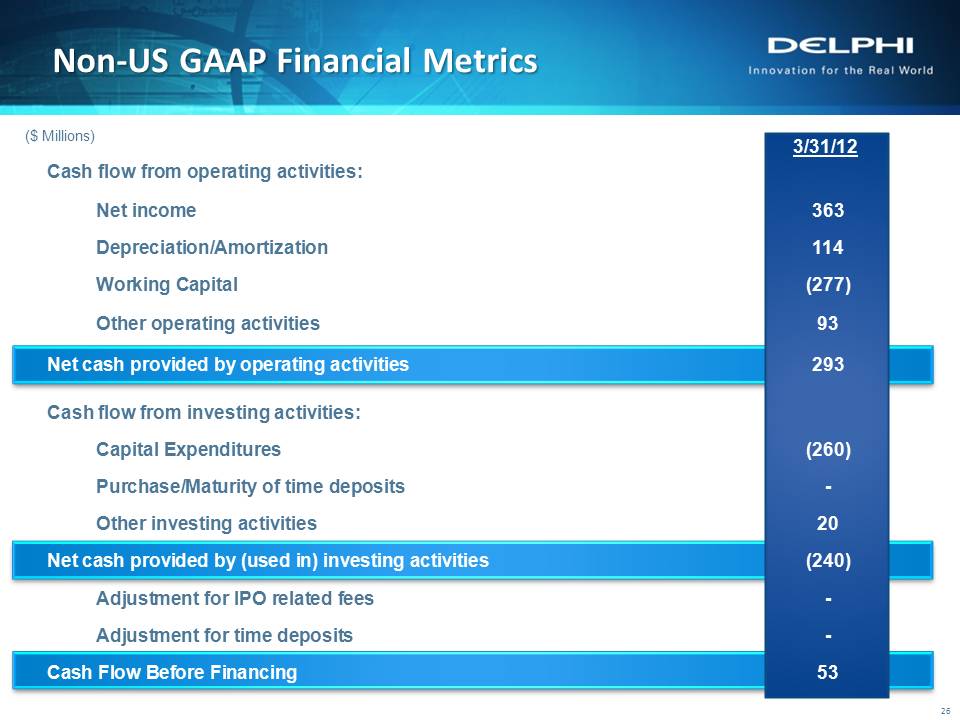
Slide: 26 Other Placeholder: 26 Non-US GAAP Financial Metrics 26 ($ Millions) 3/31/12Cash flow from operating activities: Net income 363 Depreciation/Amortization 114 Working Capital (277) Other operating activities 93Net cash provided by operating activities 293Cash flow from investing activities: Capital Expenditures (260) Purchase/Maturity of time deposits - Other investing activities 20Net cash provided by (used in) investing activities (240) Adjustment for IPO related fees - Adjustment for time deposits - Cash Flow Before Financing 53
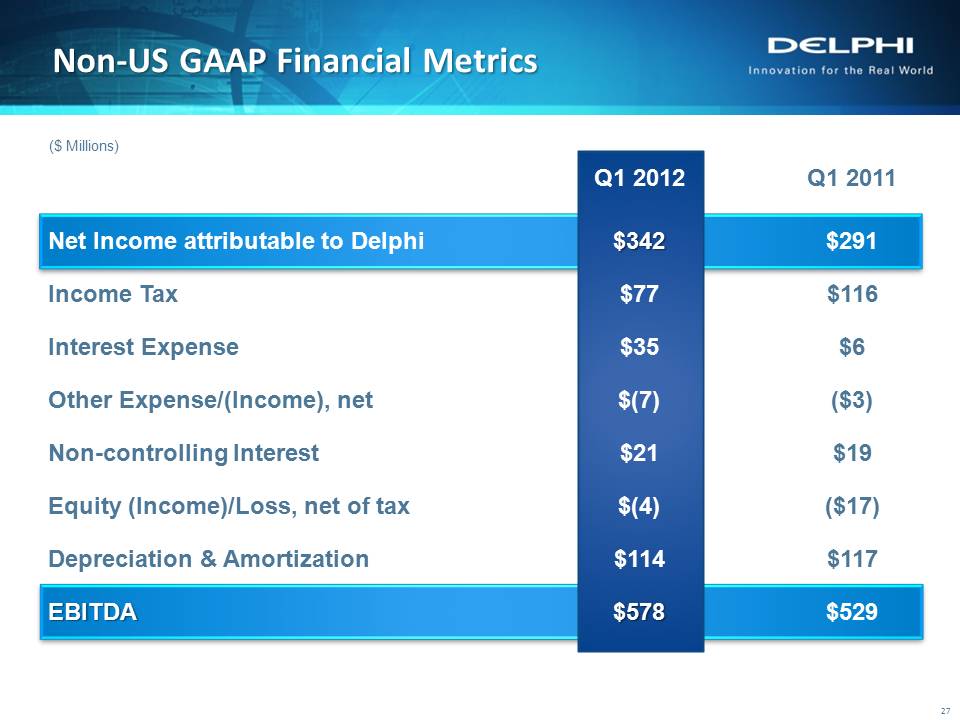
Q1 2012 Q1 2011 Net Income attributable to Delphi $342 $291 Income Tax $77 $116 Interest Expense $35 $6 Other Expense/(Income), net $(7) ($3) Non-controlling Interest $21 $19 Equity (Income)/Loss, net of tax $(4) ($17) Depreciation & Amortization $114 $117 EBITDA $578 $529 ($ Millions) 27 Non‐US GAAP Financial Metrics
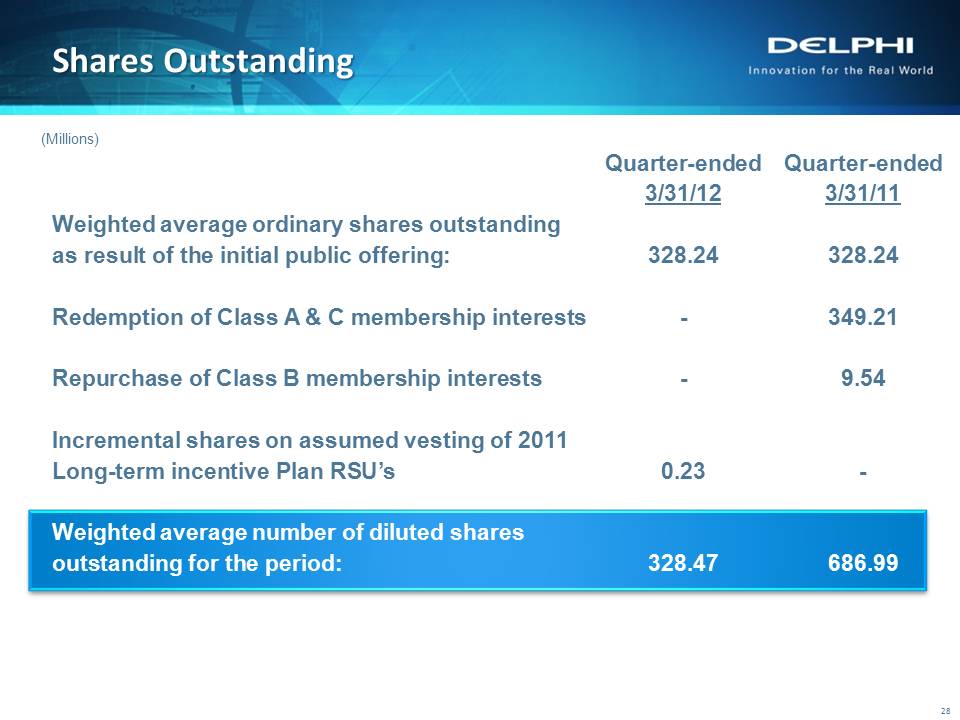
Slide: 28 Quarter-ended Quarter-ended 3/31/12 3/31/11Weighted average ordinary shares outstanding as result of the initial public offering: 328.24 328.24Redemption of Class A & C membership interests - 349.21Repurchase of Class B membership interests - 9.54Incremental shares on assumed vesting of 2011Long-term incentive Plan RSU’s 0.23 -Weighted average number of diluted shares outstanding for the period: 328.47 686.99 Other Placeholder: 28 Shares Outstanding 28 (Millions)
Slide: 29 Delphi Innovation for the Real World Other Placeholder: 29