Third Quarter 2012 Earnings Call November 1st, 2012 Exhibit 99.2
This presentation, as well as other statements made by Delphi Automotive PLC (the “Company”), contain forward-looking statements that reflect, when made, the Company’s current views with respect to current events and financial performance. Such forward-looking statements are subject to many risks, uncertainties and factors relating to the Company’s operations and business environment, which may cause the actual results of the Company to be materially different from any future results. All statements that address future operating, financial or business performance or the Company’s strategies or expectations are forward-looking statements. Factors that could cause actual results to differ materially from these forward-looking statements are discussed under the captions “Risk Factors” and “Management’s Discussion and Analysis of Financial Condition and Results of Operations” in the Company’s filings with the Securities and Exchange Commission. New risks and uncertainties arise from time to time, and it is impossible for us to predict these events or how they may affect the Company. It should be remembered that the price of the ordinary shares and any income from them can go down as well as up. The Company disclaims any intention or obligation to update or revise any forward-looking statements, whether as a result of new information, future events and/or otherwise, except as may be required by law. Forward-Looking Statements 2
Agenda 3 Business Overview Q3 2012 in Review Financial Results Q3 2012 Results Updated 2012 Guidance Wrap-Up Q&A Session Rodney O’Neal Chief Executive Officer Kevin Clark Chief Financial Officer Rodney O’Neal Chief Executive Officer

Rodney O’Neal Business Overview
Overview 5 Strong Financial Results in an Increasingly Challenging Environment – Revenue Growth Flat – EBITDA Margin Increased to 13.7%1 – EPS Increased by 12.7%1 Positioned for Continued Organic Revenue Growth and Margin Expansion in 2013 – Implementing Restructuring Initiatives – Continued Focus on Optimizing Cost Structure Solid Performance Includes Continued Investment in Growth Initiatives – China Footprint Expansion – New Technologies to Address Safe, Green and Connected Trends – Completion of the MVL Acquisition 1 Excludes impact of $21M (pre-tax) of Variable Accounting Long Term Incentive (LTI). This represents 60 bps of EBITDA Margin and $0.05 of EPS.
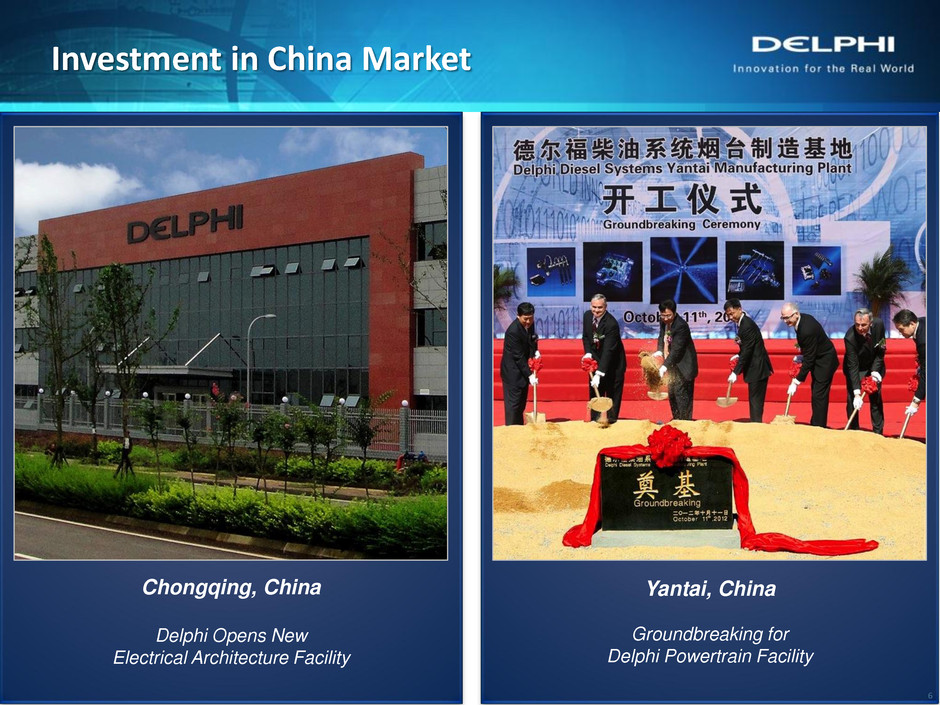
Chongqing, China Delphi Opens New Electrical Architecture Facility Yantai, China Groundbreaking for Delphi Powertrain Facility Investment in China Market 6

Investment in New Technologies Connected Vehicle Safety Pilot Program 7

Investment in Product Portfolio – MVL Acquisition 8 Broadens Leading Position in the High Growth and High Margin Global Automotive Connectors Market Enhances Position with High Growth Customers Expands Footprint and Capabilities in Fast Growing Asia Market Significant Operating and Revenue Synergies Accretive to Margins and EPS in 2013

Automotive News PACE Award Finalists 9 F2e Distributed Pump Common Rail System MyFi® Connected Navigation Radio HEV/EV Vehicle Proximity Alert Gen 4 Manifold Air Pressure Sensor – Manufacturing Process Delphi Had More 2013 PACE Award Finalists Than Any Other Company
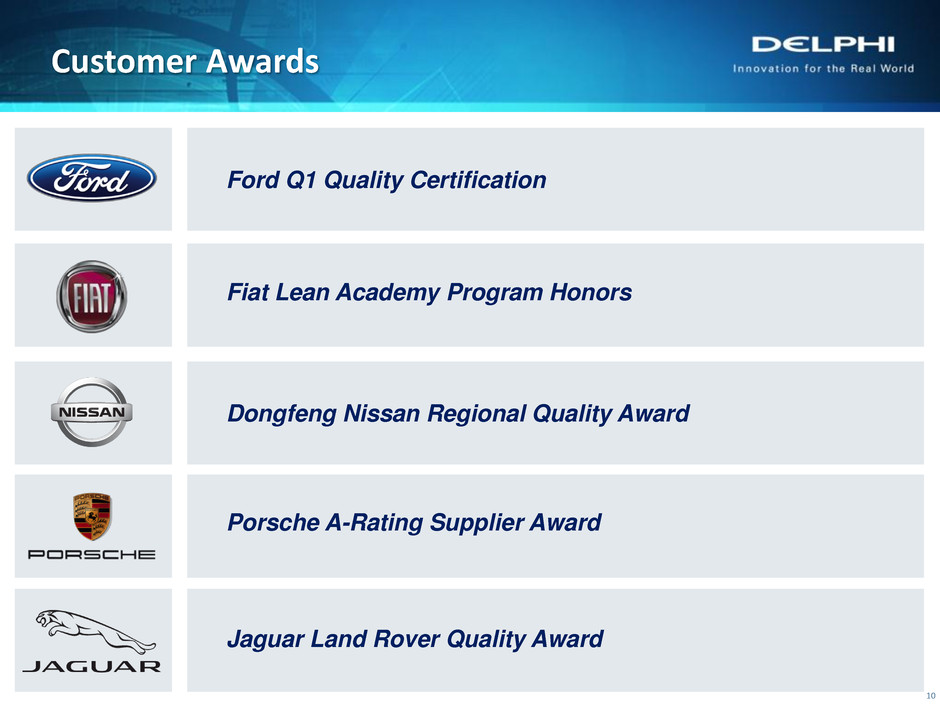
Customer Awards Dongfeng Nissan Regional Quality Award Ford Q1 Quality Certification Fiat Lean Academy Program Honors Porsche A-Rating Supplier Award Jaguar Land Rover Quality Award 10
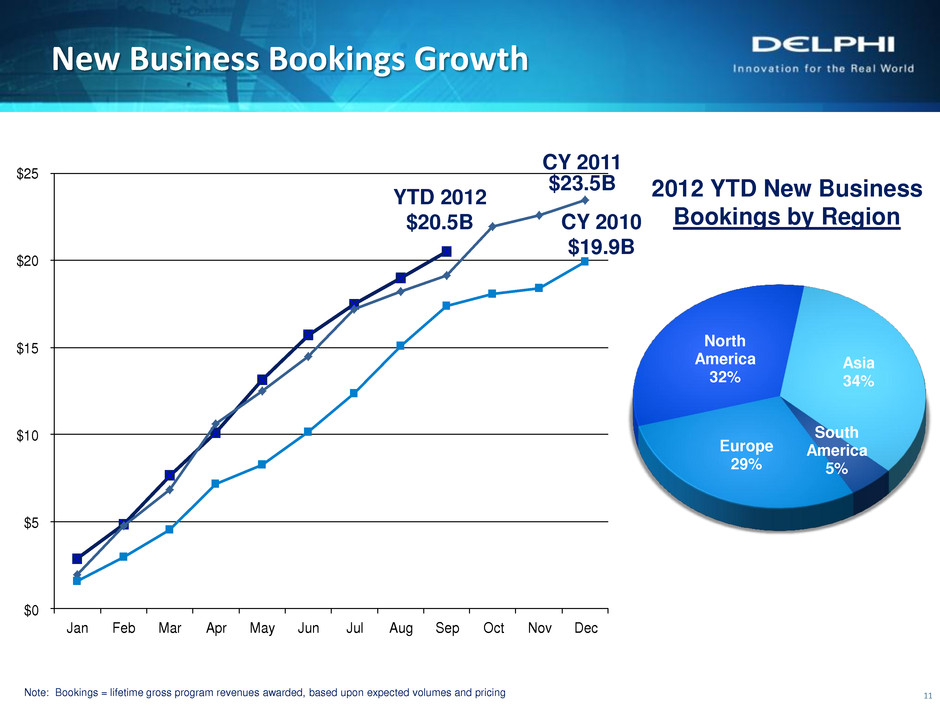
Europe 29% North America 32% Asia 34% South America 5% YTD 2012 $20.5B 2012 YTD New Business Bookings by Region CY 2010 $19.9B New Business Bookings Growth 11 Note: Bookings = lifetime gross program revenues awarded, based upon expected volumes and pricing CY 2011 $23.5B $0 $5 $10 $15 $20 $25 Jan Feb Mar Apr May Jun Jul Aug Sep Oct Nov Dec
Continue to Focus on Operating Execution 12 Enterprise Operating System – Disciplined, Structured Process – Driving Margin Expansion Implementing Restructuring Programs to Optimize Cost Structure – Manufacturing Footprint Rotation – Engineering Rotation – Administrative Reductions – MVL Integration

Kevin Clark Financial Results
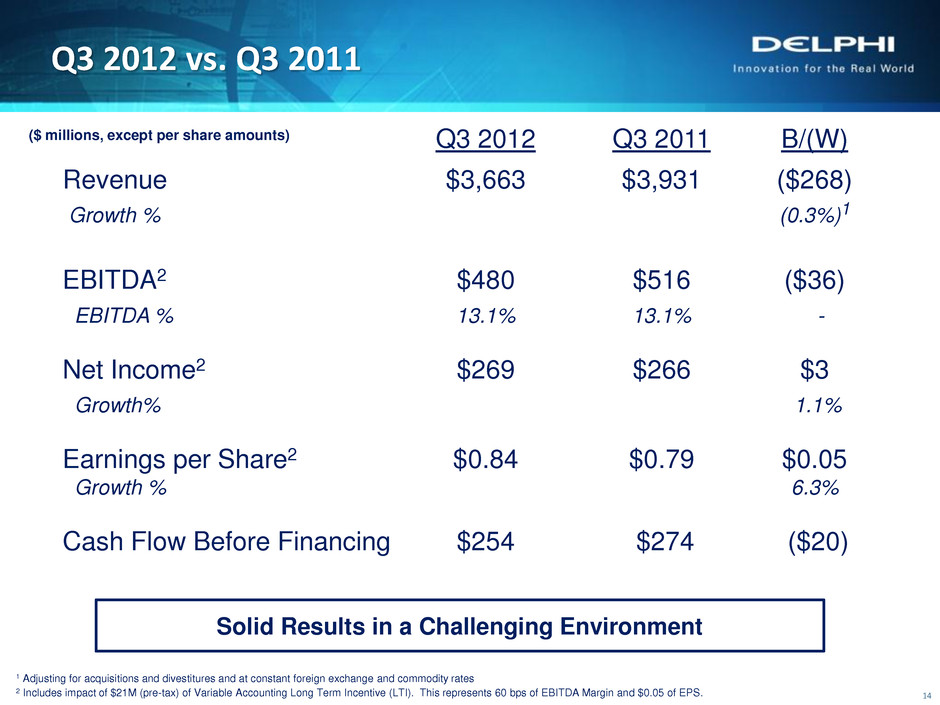
Q3 2012 Q3 2011 B/(W) Revenue $3,663 $3,931 ($268) Growth % (0.3%)1 EBITDA2 $480 $516 ($36) EBITDA % 13.1% 13.1% - Net Income2 $269 $266 $3 Growth% 1.1% Earnings per Share2 $0.84 $0.79 $0.05 Growth % 6.3% Cash Flow Before Financing $254 $274 ($20) Q3 2012 vs. Q3 2011 14 Solid Results in a Challenging Environment ($ millions, except per share amounts) 1 Adjusting for acquisitions and divestitures and at constant foreign exchange and commodity rates 2 Includes impact of $21M (pre-tax) of Variable Accounting Long Term Incentive (LTI). This represents 60 bps of EBITDA Margin and $0.05 of EPS.

Revenue $3,931 ($212) ($72) ($39) ($7) $62 $3,663 2,000.00 3,000.00 4,000.00 Q3 '11 Foreign Exchange Price Commodity Acquisitions/ Divestitures Sales Growth Q3 '12 Q3 ‘12 vs. Q3 ‘11 ($ millions) 15 (1.8%) Solid Revenue Despite Macro Headwinds Year-over-Year Growth by Region Reported Adjusted1 Q3 2012 Q3 2012 Europe (16.8%) (6.1%) N. America 2.0% 2.9% Asia 10.2% 11.8% S. America (20.9%) (5.4%) Total (6.8%) (0.3%) 1 Growth rates adjusted for acquisitions and divestitures and at constant foreign exchange and commodity rates
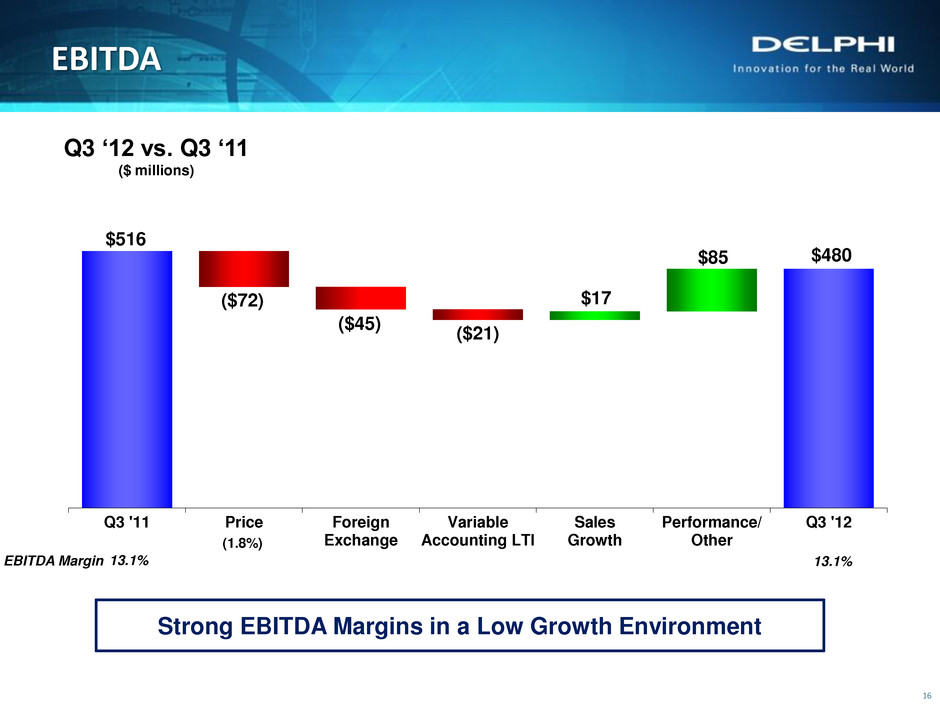
Strong EBITDA Margins in a Low Growth Environment EBITDA 16 Q3 ‘12 vs. Q3 ‘11 ($ millions) $516 ($72) ($45) ($21) $17 $85 $480 - 100.00 200.00 300.00 400.00 500.00 600.00 Q3 '11 Price Foreign Exchange Variable Accounting LTI Sales Growth Performance/ Other Q3 '12 13.1% EBITDA Margin 13.1% (1.8%)
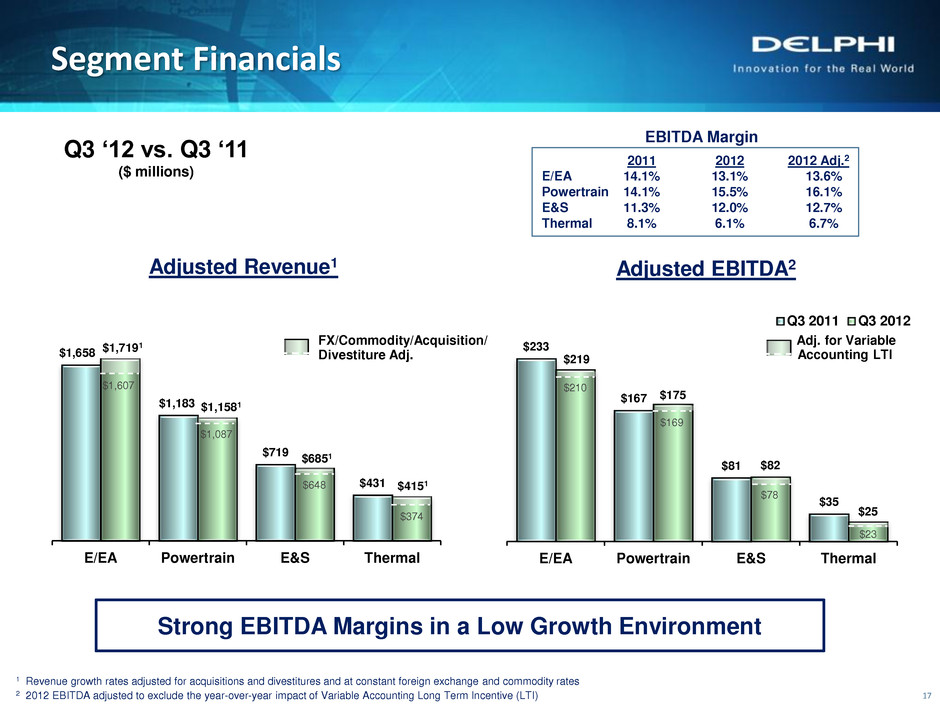
Adjusted Revenue1 $233 $167 $81 $35 $219 $175 $82 $25 E/EA Powertrain E&S Thermal Q3 2011 Q3 2012 $1,658 $1,183 $719 $431 $1,7191 $1,1581 $6851 $4151 E/EA Powertrain E&S Thermal Segment Financials Adjusted EBITDA2 Q3 ‘12 vs. Q3 ‘11 ($ millions) 1 Revenue growth rates adjusted for acquisitions and divestitures and at constant foreign exchange and commodity rates 2 2012 EBITDA adjusted to exclude the year-over-year impact of Variable Accounting Long Term Incentive (LTI) EBITDA Margin 2011 2012 2012 Adj.2 E/EA 14.1% 13.1% 13.6% Powertrain 14.1% 15.5% 16.1% E&S 11.3% 12.0% 12.7% Thermal 8.1% 6.1% 6.7% $1,607 $1,087 $648 $374 17 Strong EBITDA Margins in a Low Growth Environment $210 $169 $78 $23 FX/Commodity/Acquisition/ Divestiture Adj. Adj. for Variable Accounting LTI

$0.79 ($0.18) $(0.11) ($0.05) $0.04 $0.04 $0.10 $0.21 $0.84 - 0.20 0.40 0.60 0.80 1.00 Foreign Exchange Share Repurchase Taxes/ Interest Q3 '12 Earnings Per Share Q3 ‘12 vs. Q3 ‘11 18 Continued Earnings Per Share Growth Price Variable Accounting LTI Sales Growth Performance/ Other Q3 '11 Note: Changes in EPS assume 18.7% Q3 2012 YTD effective tax rate and 321M Q3 2012 weighted average shares outstanding

$534 $642 YTD '11 YTD '12 EBITDA $1,639 Working Capital ($178) Capital Expenditures ($563) Net Cash Interest ($60) Cash Taxes ($228) Restructuring, net of cash paid ($45) Other $77 Cash Flow Before Financing $642 2012 YTD Cash Flow 19 ($ millions) Cash Flow Before Financing ($ millions) +20% Continued Strong Cash Flow Conversion
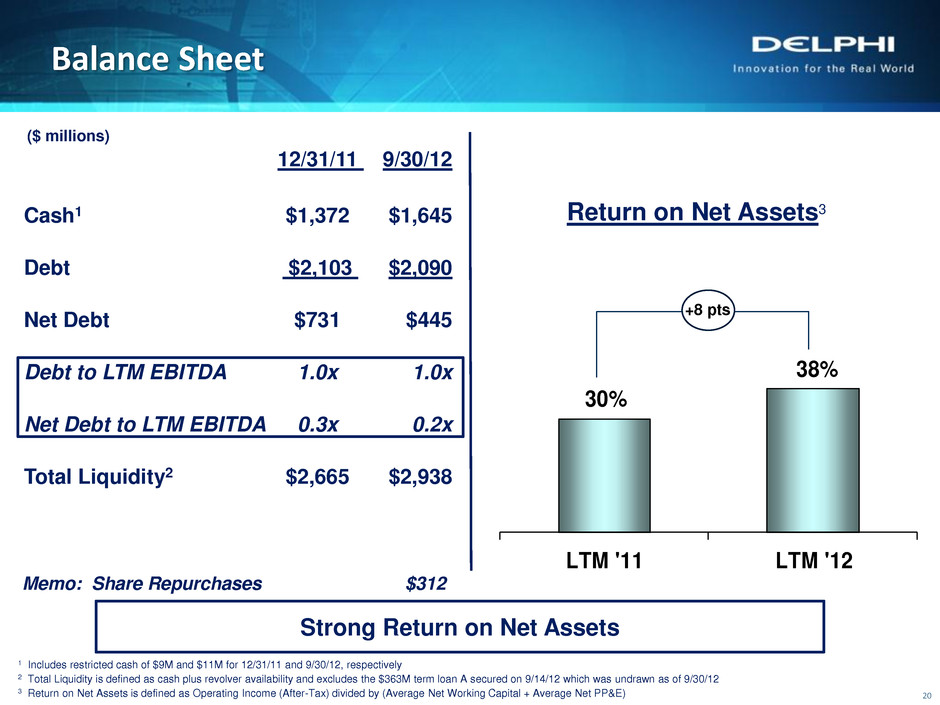
12/31/11 9/30/12 Cash1 $1,372 $1,645 Debt $2,103 $2,090 Net Debt $731 $445 Debt to LTM EBITDA 1.0x 1.0x Net Debt to LTM EBITDA 0.3x 0.2x Total Liquidity2 $2,665 $2,938 30% 38% LTM '11 LTM '12 Balance Sheet 20 ($ millions) Return on Net Assets3 1 Includes restricted cash of $9M and $11M for 12/31/11 and 9/30/12, respectively 2 Total Liquidity is defined as cash plus revolver availability and excludes the $363M term loan A secured on 9/14/12 which was undrawn as of 9/30/12 3 Return on Net Assets is defined as Operating Income (After-Tax) divided by (Average Net Working Capital + Average Net PP&E) +8 pts Strong Return on Net Assets Memo: Share Repurchases $312
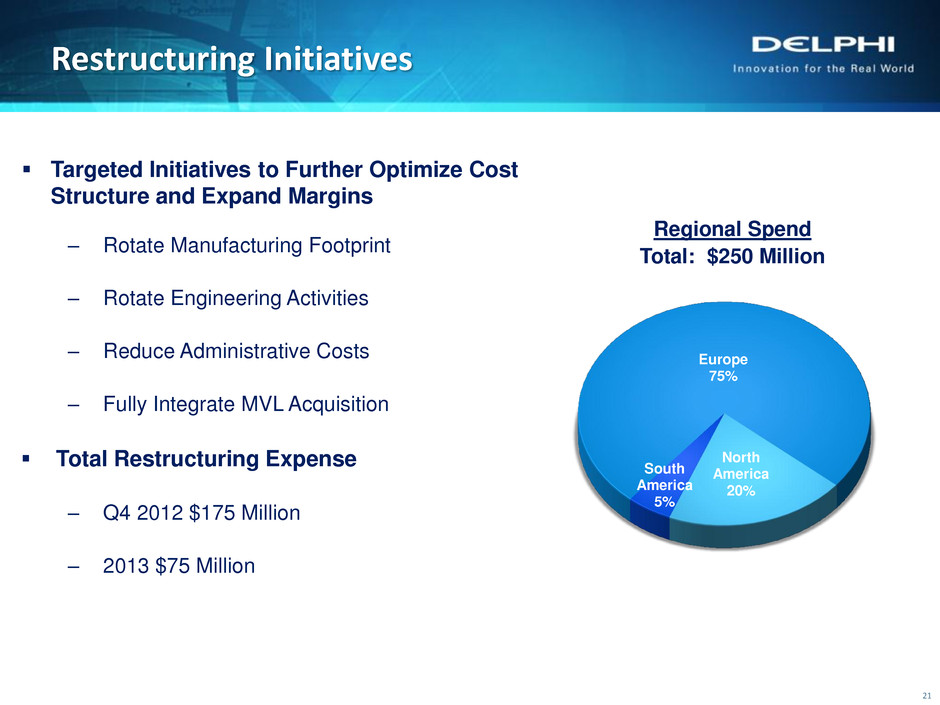
North America 20% South America 5% Europe 75% Regional Spend Total: $250 Million Restructuring Initiatives Targeted Initiatives to Further Optimize Cost Structure and Expand Margins – Rotate Manufacturing Footprint – Rotate Engineering Activities – Reduce Administrative Costs – Fully Integrate MVL Acquisition Total Restructuring Expense – Q4 2012 $175 Million – 2013 $75 Million 21
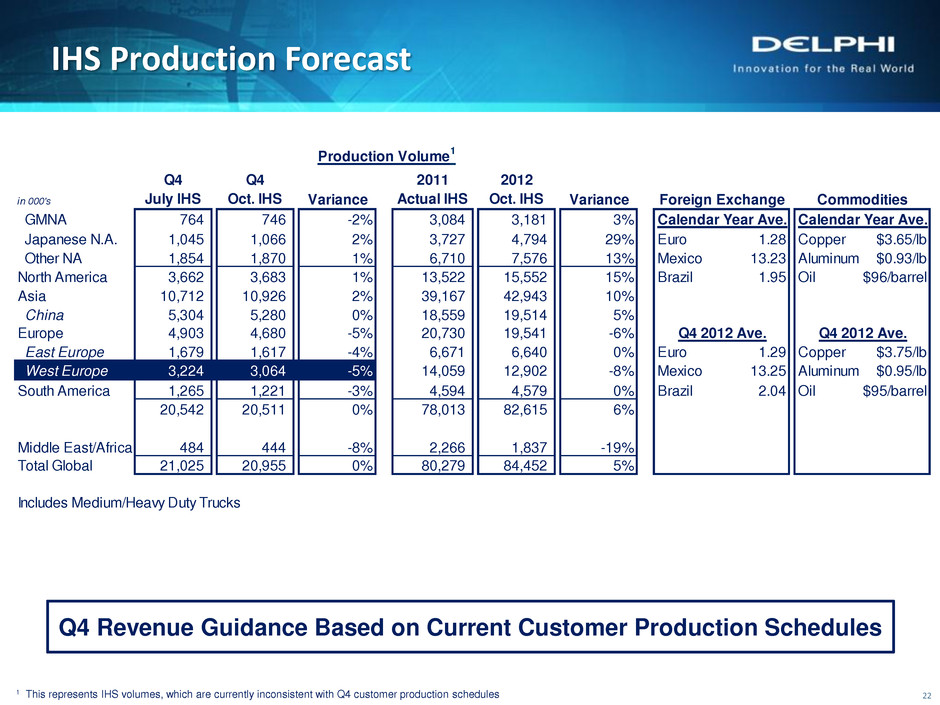
in 000's Q4 July IHS Q4 Oct. IHS Variance 2011 Actual IHS 2012 Oct. IHS Variance GMNA 764 746 -2% 3,084 3,181 3% Japanese N.A. 1,045 1,066 2% 3,727 4,794 29% Euro 1.28 Copper $3.65/lb Other NA 1,854 1,870 1% 6,710 7,576 13% Mexico 13.23 Aluminum $0.93/lb North America 3,662 3,683 1% 13,522 15,552 15% Brazil 1.95 Oil $96/barrel Asia 10,712 10,926 2% 39,167 42,943 10% China 5,304 5,280 0% 18,559 19,514 5% Europe 4,903 4,680 -5% 20,730 19,541 -6% East Europe 1,679 1,617 -4% 6,671 6,640 0% Euro 1.29 Copper $3.75/lb West Europe 3,224 3,064 -5% 14,059 12,902 -8% Mexico 13.25 Aluminum $0.95/lb South America 1,265 1,221 -3% 4,594 4,579 0% Brazil 2.04 Oil $95/barrel 20,542 20,511 0% 78,013 82,615 6% Middle East/Africa 484 444 -8% 2,266 1,837 -19% Total Global 21,025 20,955 0% 80,279 84,452 5% Includes Medium/Heavy Duty Trucks Production Volume 1 Foreign Exchange Commodities Calendar Year Ave. Calendar Year Ave. Q4 2012 Ave. Q4 2012 Ave. IHS Production Forecast 22 Q4 Revenue Guidance Based on Current Customer Production Schedules 1 This represents IHS volumes, which are currently inconsistent with Q4 customer production schedules
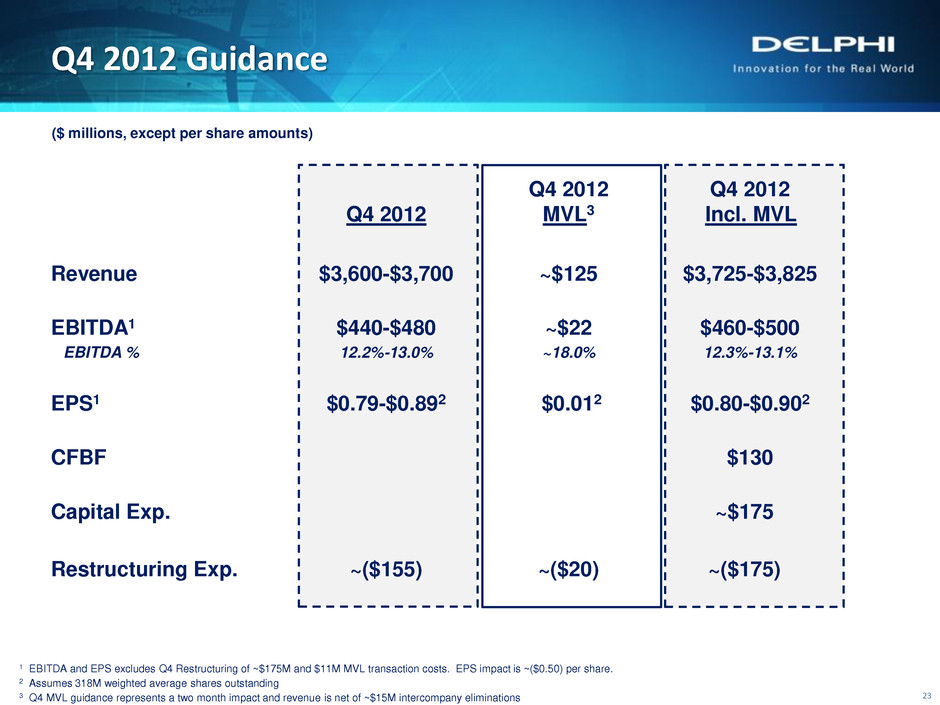
Q4 2012 Q4 2012 Q4 2012 MVL3 Incl. MVL Revenue $3,600-$3,700 ~$125 $3,725-$3,825 EBITDA1 $440-$480 ~$22 $460-$500 EBITDA % 12.2%-13.0% ~18.0% 12.3%-13.1% EPS1 $0.79-$0.892 $0.012 $0.80-$0.902 CFBF $130 Capital Exp. ~$175 Restructuring Exp. ~($155) ~($20) ~($175) Q4 2012 Guidance ($ millions, except per share amounts) 1 EBITDA and EPS excludes Q4 Restructuring of ~$175M and $11M MVL transaction costs. EPS impact is ~($0.50) per share. 2 Assumes 318M weighted average shares outstanding 3 Q4 MVL guidance represents a two month impact and revenue is net of ~$15M intercompany eliminations 23
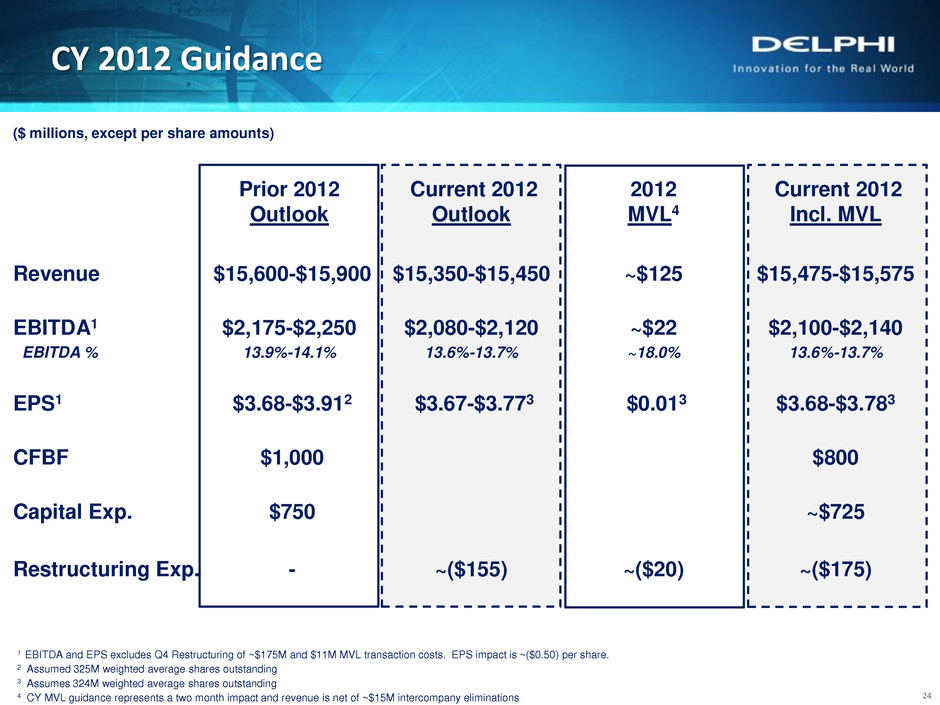
Prior 2012 Current 2012 2012 Current 2012 Outlook Outlook MVL4 Incl. MVL Revenue $15,600-$15,900 $15,350-$15,450 ~$125 $15,475-$15,575 EBITDA1 $2,175-$2,250 $2,080-$2,120 ~$22 $2,100-$2,140 EBITDA % 13.9%-14.1% 13.6%-13.7% ~18.0% 13.6%-13.7% EPS1 $3.68-$3.912 $3.67-$3.773 $0.013 $3.68-$3.783 CFBF $1,000 $800 Capital Exp. $750 ~$725 Restructuring Exp. - ~($155) ~($20) ~($175) CY 2012 Guidance 24 ($ millions, except per share amounts) 1 EBITDA and EPS excludes Q4 Restructuring of ~$175M and $11M MVL transaction costs. EPS impact is ~($0.50) per share. 2 Assumed 325M weighted average shares outstanding 3 Assumes 324M weighted average shares outstanding 4 CY MVL guidance represents a two month impact and revenue is net of ~$15M intercompany eliminations

Rodney O’Neal Wrap-Up
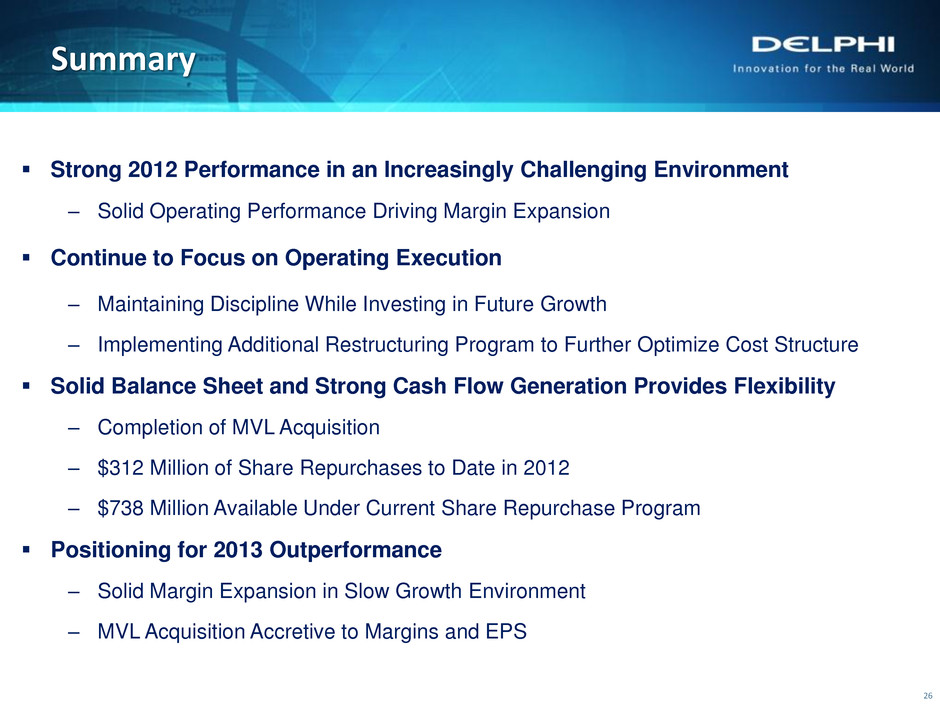
Summary 26 Strong 2012 Performance in an Increasingly Challenging Environment – Solid Operating Performance Driving Margin Expansion Continue to Focus on Operating Execution – Maintaining Discipline While Investing in Future Growth – Implementing Additional Restructuring Program to Further Optimize Cost Structure Solid Balance Sheet and Strong Cash Flow Generation Provides Flexibility – Completion of MVL Acquisition – $312 Million of Share Repurchases to Date in 2012 – $738 Million Available Under Current Share Repurchase Program Positioning for 2013 Outperformance – Solid Margin Expansion in Slow Growth Environment – MVL Acquisition Accretive to Margins and EPS

Appendix
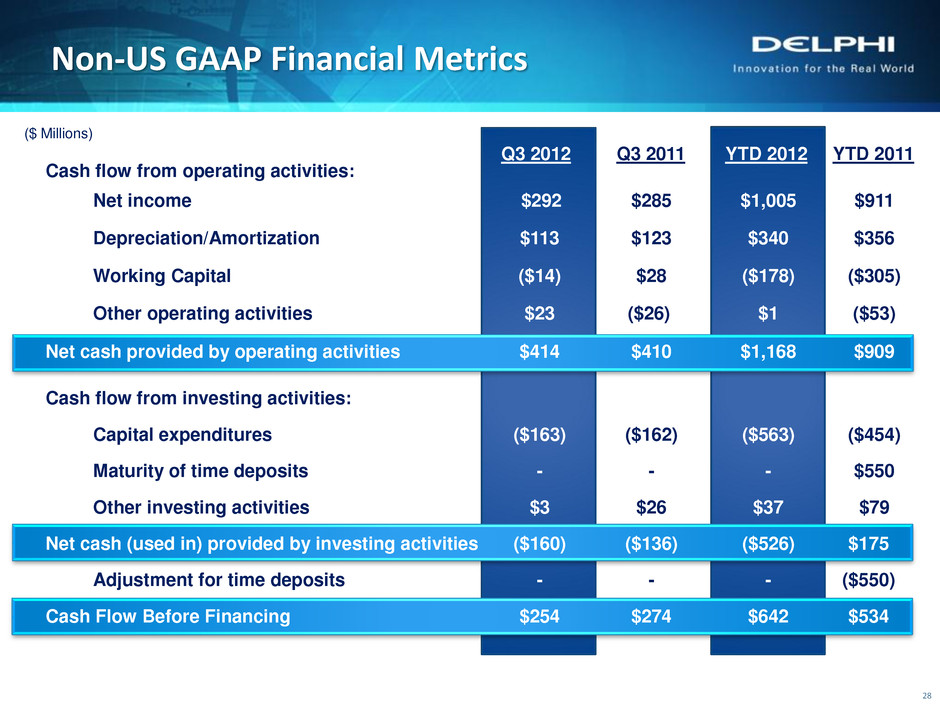
Non-US GAAP Financial Metrics 28 ($ Millions) Q3 2012 Q3 2011 YTD 2012 YTD 2011 Cash flow from operating activities: Net income $292 $285 $1,005 $911 Depreciation/Amortization $113 $123 $340 $356 Working Capital ($14) $28 ($178) ($305) Other operating activities $23 ($26)3 $1 ($53) Net cash provided by operating activities $414 $410 $1,168 $909 Cash flow from investing activities: Capital expenditures ($163) ($162) ($563) ($454) Maturity of time deposits - - - $550 Other investing activities $3 $26 $37 $79 Net cash (used in) provided by investing activities ($160) ($136) ($526) $175 Adjustment for time deposits - - - ($550) Cash Flow Before Financing $254 $274 $642 $534
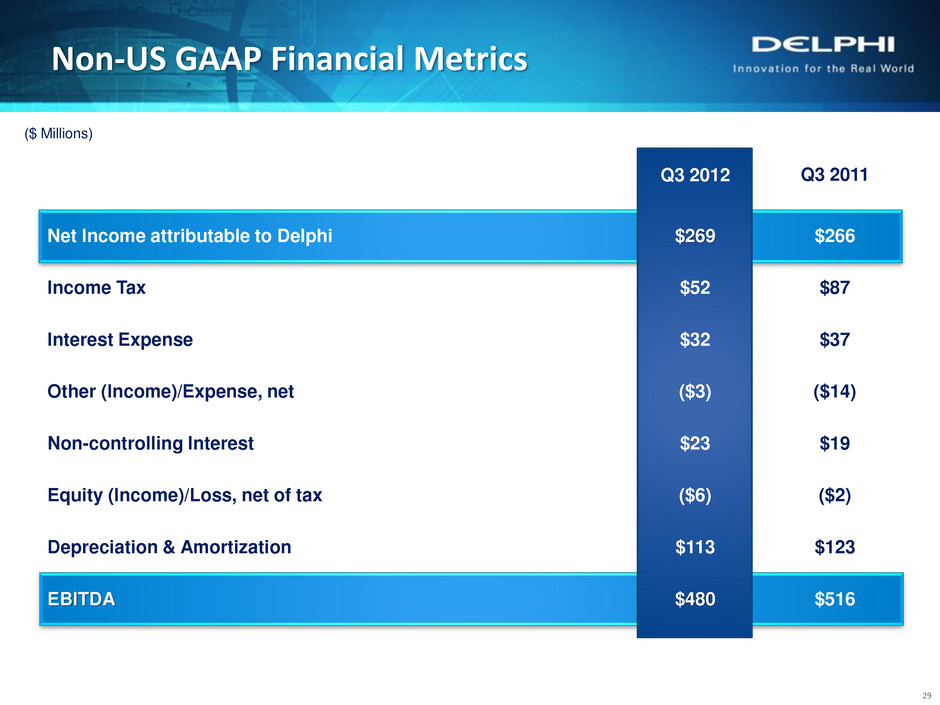
29 Non-US GAAP Financial Metrics Q3 2012 Q3 2011 Net Income attributable to Delphi $269 $266 Income Tax $52 $87 Interest Expense $32 $37 Other (Income)/Expense, net ($3) ($14) Non-controlling Interest $23 $19 Equity (Income)/Loss, net of tax ($6) ($2) Depreciation & Amortization $113 $123 EBITDA $480 $516 ($ Millions)
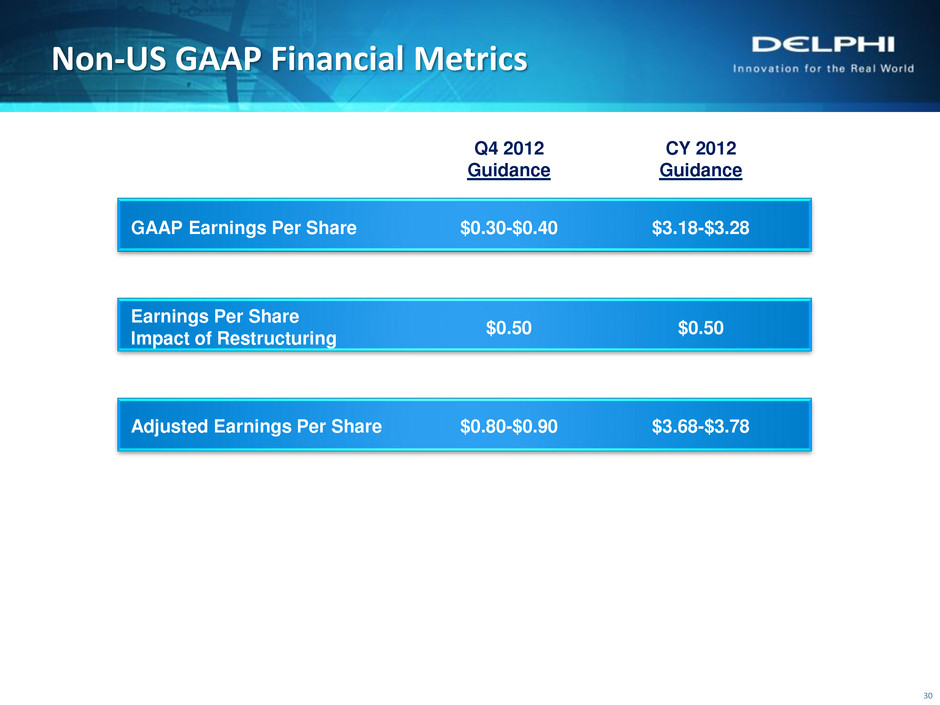
Q4 2012 Guidance CY 2012 Guidance GAAP Earnings Per Share $0.30-$0.40 $3.18-$3.28 Earnings Per Share Impact of Restructuring $0.50 $0.50 Adjusted Earnings Per Share $0.80-$0.90 $3.68-$3.78 30 Non-US GAAP Financial Metrics
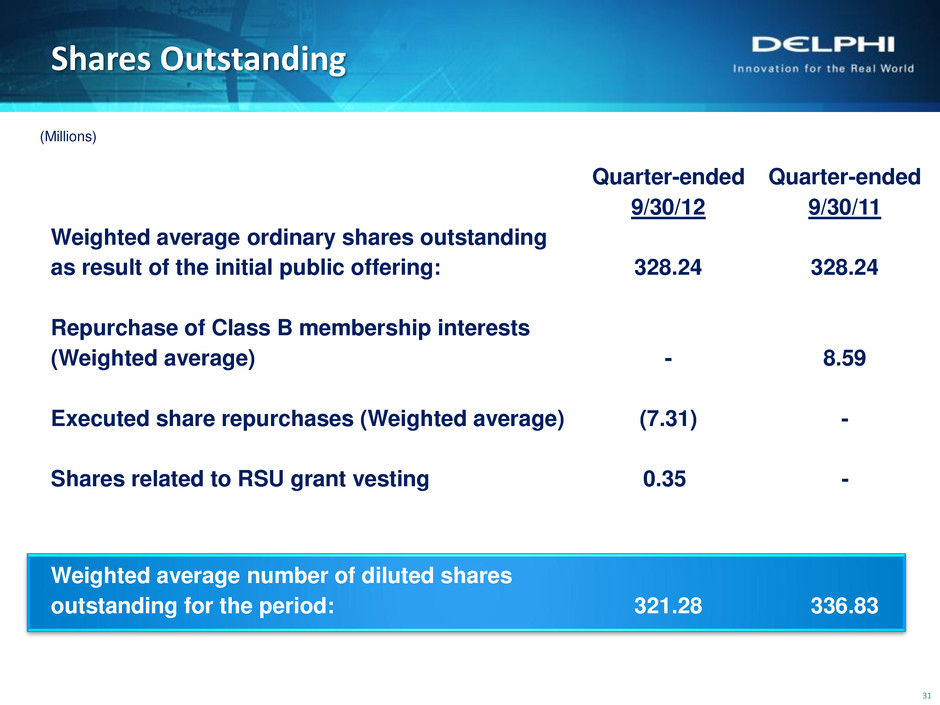
Quarter-ended Quarter-ended 9/30/12 9/30/11 Weighted average ordinary shares outstanding as result of the initial public offering: 328.24 328.24 Repurchase of Class B membership interests (Weighted average) - 8.59 Executed share repurchases (Weighted average) (7.31) - Shares related to RSU grant vesting 0.35 - Weighted average number of diluted shares outstanding for the period: 321.28 336.83 Shares Outstanding 31 (Millions)
32


