Deutsche Bank Global Auto Industry Conference January 14, 2014 Exhibit 99.1
Forward-looking statements 2 This presentation, as well as other statements made by Delphi Automotive PLC (the “Company”), contain forward- looking statements that reflect, when made, the Company’s current views with respect to current events and financial performance. Such forward-looking statements are subject to many risks, uncertainties and factors relating to the Company’s operations and business environment, which may cause the actual results of the Company to be materially different from any future results. All statements that address future operating, financial or business performance or the Company’s strategies or expectations are forward-looking statements. Factors that could cause actual results to differ materially from these forward-looking statements are discussed under the captions “Risk Factors” and “Management’s Discussion and Analysis of Financial Condition and Results of Operations” in the Company’s filings with the Securities and Exchange Commission. New risks and uncertainties arise from time to time, and it is impossible for us to predict these events or how they may affect the Company. It should be remembered that the price of the ordinary shares and any income from them can go down as well as up. The Company disclaims any intention or obligation to update or revise any forward-looking statements, whether as a result of new information, future events and/or otherwise, except as may be required by law.
Rodney O’Neal Chief Executive Officer and President

2013 highlights 4 Increased shareholder value • Further rotated Western European footprint • MVL integration running ahead of schedule • Expanded margins and increased earnings • Returned significant cash to shareholders • Upgraded to investment grade by S&P and Fitch
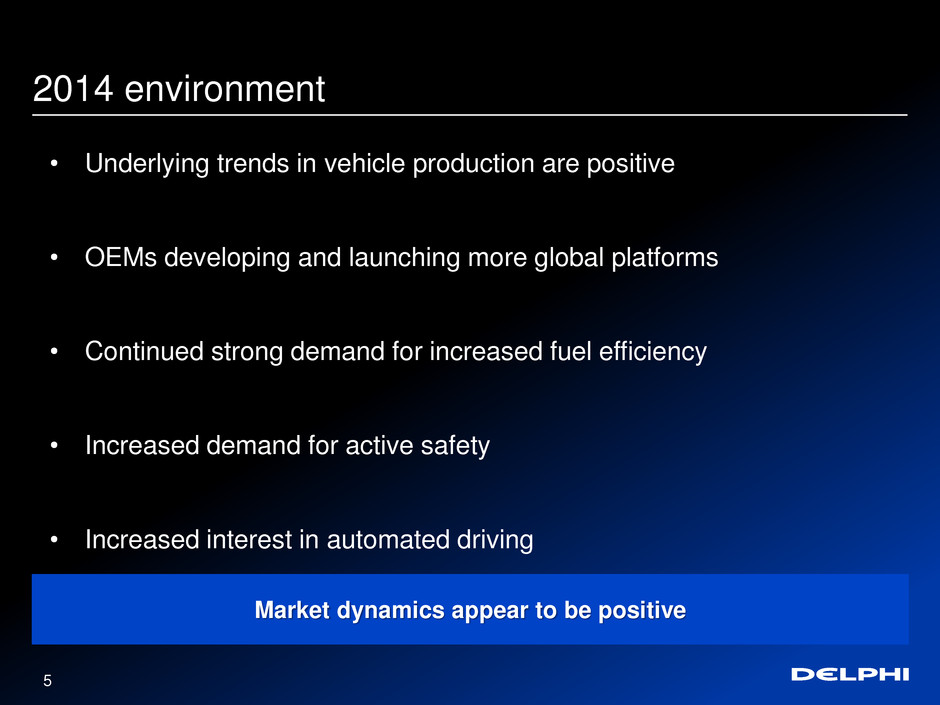
2014 environment 5 Market dynamics appear to be positive • Underlying trends in vehicle production are positive • OEMs developing and launching more global platforms • Continued strong demand for increased fuel efficiency • Increased demand for active safety • Increased interest in automated driving
2014 priorities 6 Further increase shareholder value • Disciplined above market revenue growth • Further optimize operating footprint • Accelerate introduction of advanced technologies • Further expand margins and increase earnings • Disciplined capital allocation
7 Revenue growth across all segments 2014 priorities Disciplined revenue growth • Increased vehicle production • Continued growth in new products Gasoline Direct injection (GDi) Diesel Common Rail Connected Safety Systems • Continued strong growth in China

Continuing to rotate footprint 8 2014 priorities Optimize operating footprint • Rationalizing cost structure Rotating footprint from W. Europe to E. Europe and N. Africa • Adding capacity to support growth Expansion in China
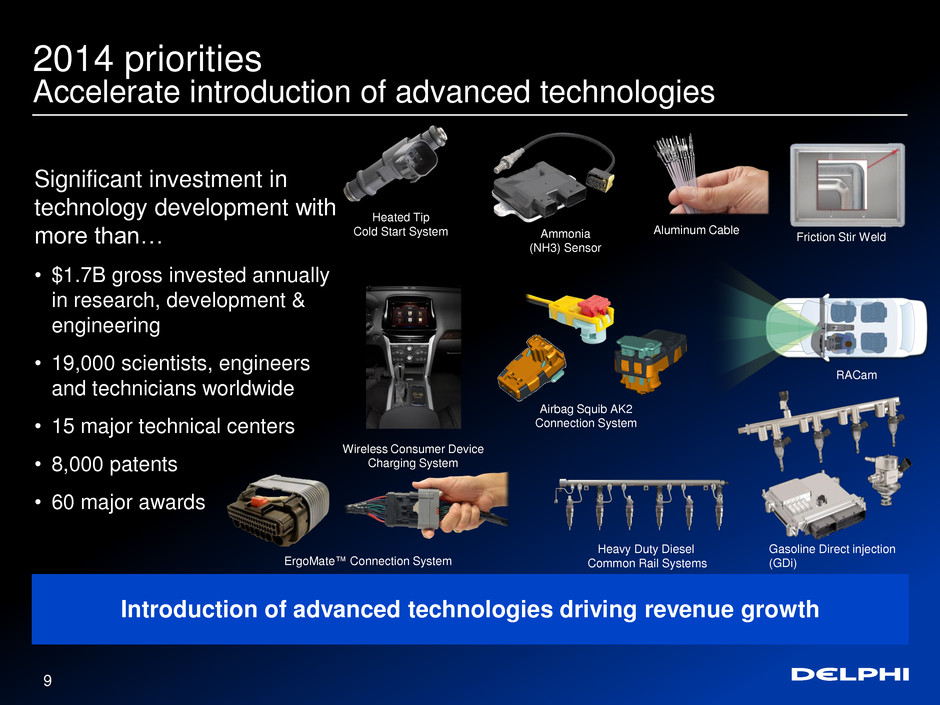
9 Introduction of advanced technologies driving revenue growth 2014 priorities Accelerate introduction of advanced technologies ErgoMate™ Connection System Aluminum Cable Airbag Squib AK2 Connection System Ammonia (NH3) Sensor Heated Tip Cold Start System Heavy Duty Diesel Common Rail Systems RACam Wireless Consumer Device Charging System Significant investment in technology development with more than… • $1.7B gross invested annually in research, development & engineering • 19,000 scientists, engineers and technicians worldwide • 15 major technical centers • 8,000 patents • 60 major awards Friction Stir Weld Gasoline Direct injection (GDi)

10 2014 Consumer Electronics Show Featuring our technology solutions
Kevin Clark Executive Vice President and Chief Financial Officer
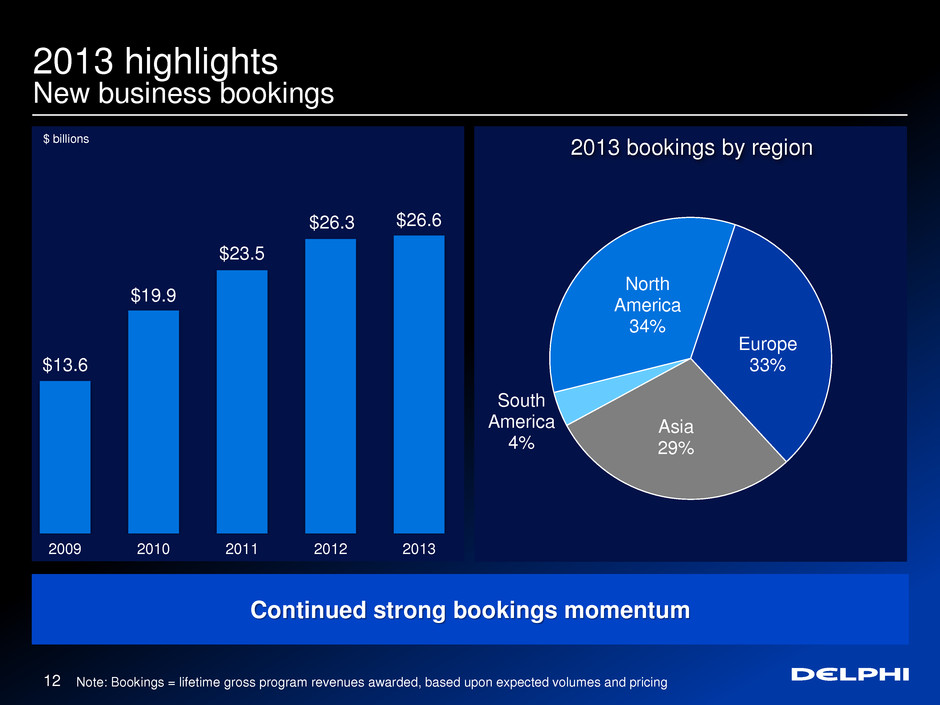
2013 highlights New business bookings 12 Further increase shareholder value Continued strong bookings momentum 2013 bookings by region North America 34% Europe 33% Asia 29% South America 4% $13.6 $19.9 $23.5 $26.3 $26.6 2009 2010 2011 2012 2013 Note: Bookings = lifetime gross program revenues awarded, based upon expected volumes and pricing $ billions
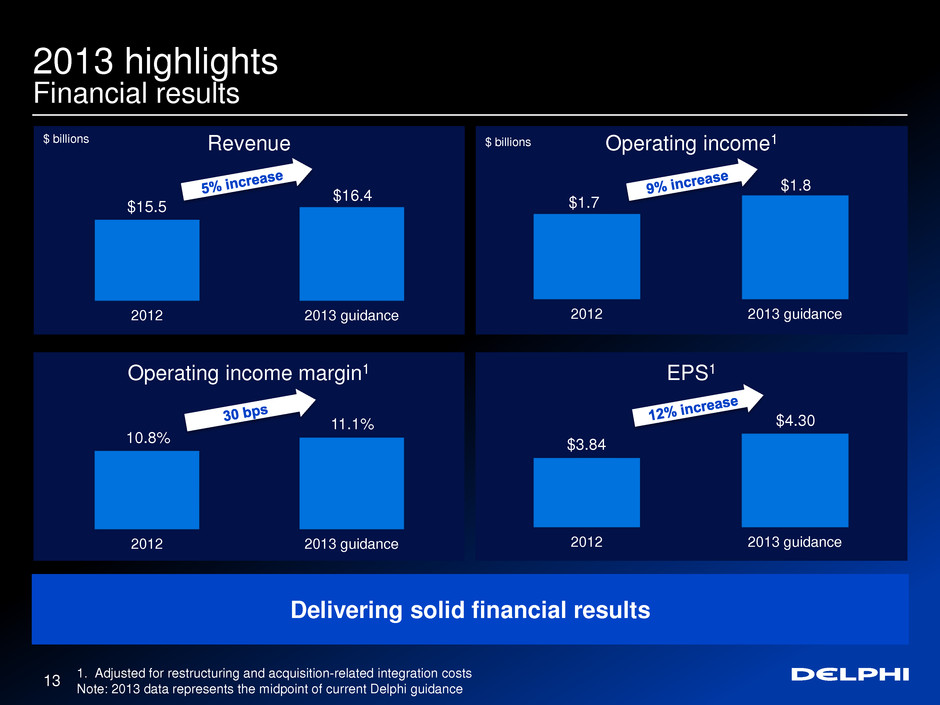
13 Operating income1 Revenue $15.5 $16.4 2012 2013 guidance EPS1 Operating income margin1 Delivering solid financial results $3.84 $4.30 2012 2013 guidance $ billions 1. Adjusted for restructuring and acquisition-related integration costs Note: 2013 data represents the midpoint of current Delphi guidance 10.8% 11.1% 2012 2013 guidance 2013 highlights Financial results $ billions $1.7 $1.8 2012 2013 guidance

EBIT margin EBITDA margin 5.3% 7.8% 11.1% Peer range Peer average Delphi consensus 12.3% Industry-leading financial metrics 14 2013 highlights Financial metrics comparison ROIC 12% 18% 33% 21% Peer range Peer average Delphi consensus FCF % to EBIT Note: Range and averages are for a peer group consisting of: ALV, BWA, HAR, JCI, LEA, TEN and TRW (excludes Delphi); data represents Capital IQ consensus estimates / J.P. Morgan North America Equity Research 19% 44% 58% Peer range Peer average Delphi consensus 72% Conversion 30% higher 7.0% 10.6% 14.4% Peer range Peer average Delphi consensus 16.4%
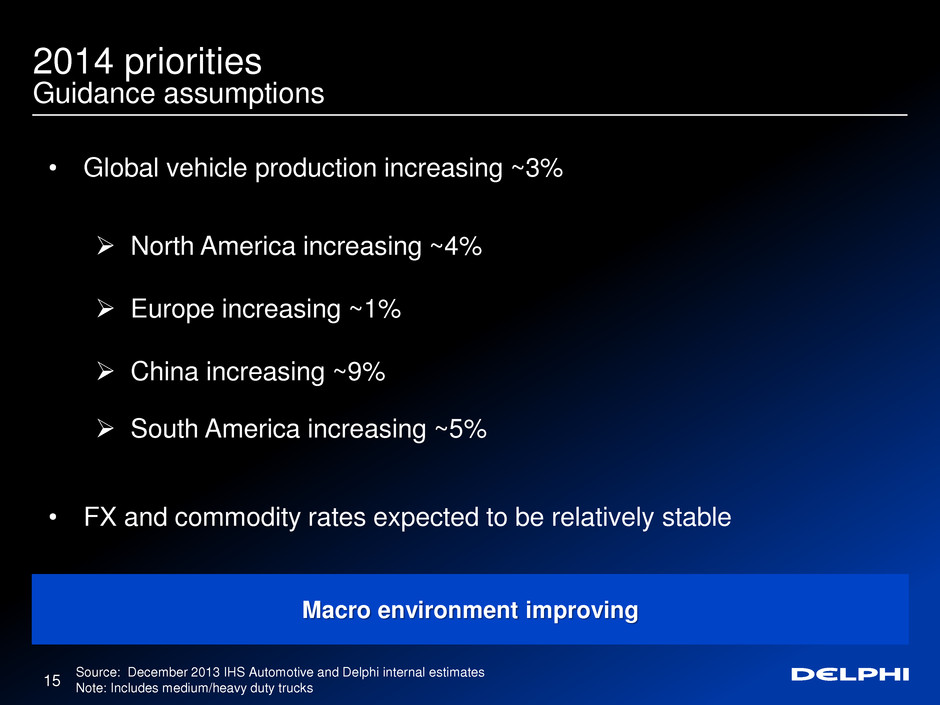
2014 priorities Guidance assumptions 15 Macro environment improving • Global vehicle production increasing ~3% North America increasing ~4% Europe increasing ~1% China increasing ~9% South America increasing ~5% • FX and commodity rates expected to be relatively stable Source: December 2013 IHS Automotive and Delphi internal estimates Note: Includes medium/heavy duty trucks
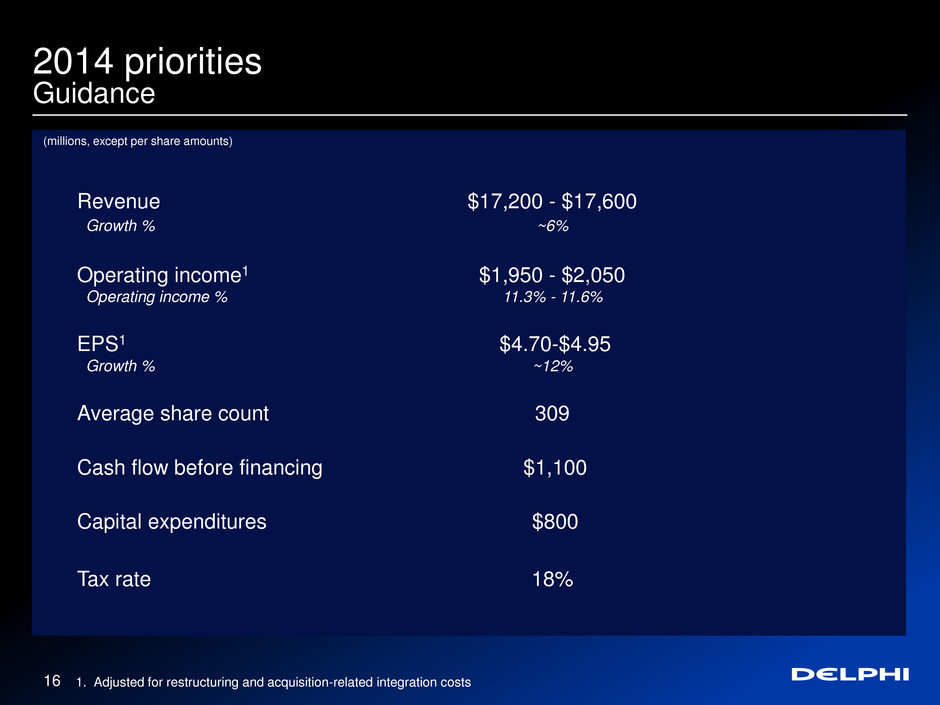
Revenue $17,200 - $17,600 Growth % ~6% Operating income1 $1,950 - $2,050 Operating income % 11.3% - 11.6% EPS1 $4.70-$4.95 Growth % ~12% Average share count 309 Cash flow before financing $1,100 Capital expenditures $800 Tax rate 18% 16 2014 priorities Guidance 1. Adjusted for restructuring and acquisition-related integration costs (millions, except per share amounts)

Drives additional shareholder value 2014 priorities Disciplined capital allocation 17 • Increase annual dividend payout from $0.68 to $1.00 per share Increase of approximately 50% Total spend of $310M • Board authorized a new $1.0 billion share repurchase program ~$200M remaining on current $750M program Continue to opportunistically repurchase stock
2014 priorities 18 Further increase shareholder value • Disciplined above market revenue growth • Further optimize operating footprint • Accelerate introduction of advanced technologies • Further expand margins and increase earnings • Disciplined capital allocation

Appendix

20 2012 Net income attributable to Delphi $1,077 Income tax expense $212 Interest expense $136 Other income, net ($5) Noncontrolling interest $83 Equity income, net of tax ($27) Restructuring $171 Asset impairments $15 Other acquisition-related costs $9 Adjusted operating income $1,671 Revenue $15,519 Adjusted operating income margin 10.8% The company’s full year 2013 and 2014 guidance was determined using a consistent manner and methodology Non-US GAAP financial metrics ($ millions)
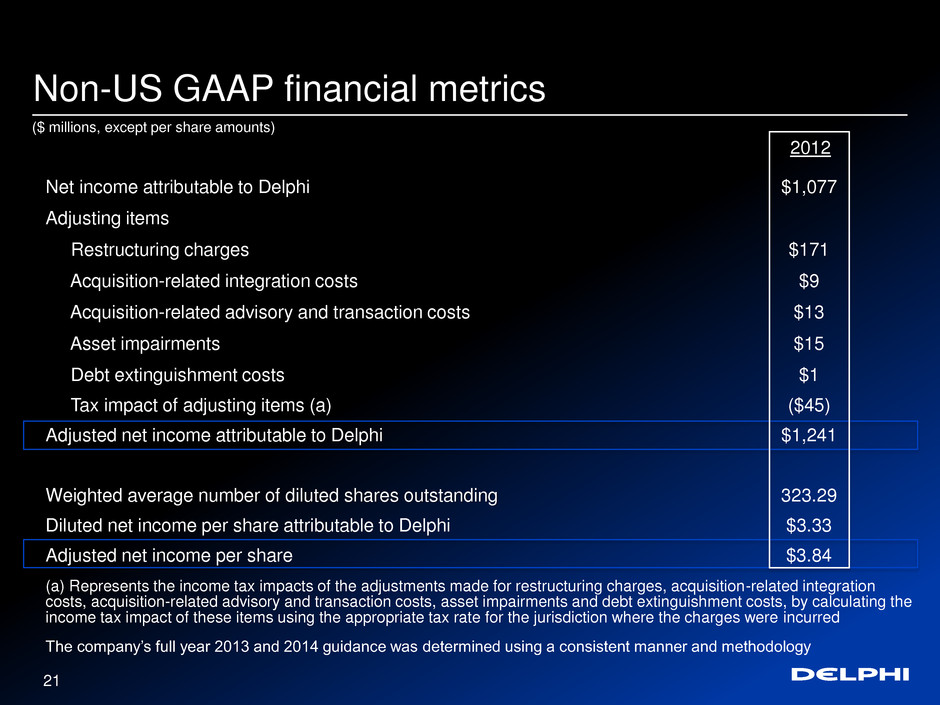
21 2012 Net income attributable to Delphi $1,077 Adjusting items Restructuring charges $171 Acquisition-related integration costs $9 Acquisition-related advisory and transaction costs $13 Asset impairments $15 Debt extinguishment costs $1 Tax impact of adjusting items (a) ($45) Adjusted net income attributable to Delphi $1,241 Weighted average number of diluted shares outstanding 323.29 Diluted net income per share attributable to Delphi $3.33 Adjusted net income per share $3.84 (a) Represents the income tax impacts of the adjustments made for restructuring charges, acquisition-related integration costs, acquisition-related advisory and transaction costs, asset impairments and debt extinguishment costs, by calculating the income tax impact of these items using the appropriate tax rate for the jurisdiction where the charges were incurred The company’s full year 2013 and 2014 guidance was determined using a consistent manner and methodology Non-US GAAP financial metrics ($ millions, except per share amounts)
