Financial overview Mark Murphy Chief Financial Officer and Executive Vice President Exhibit 99.1
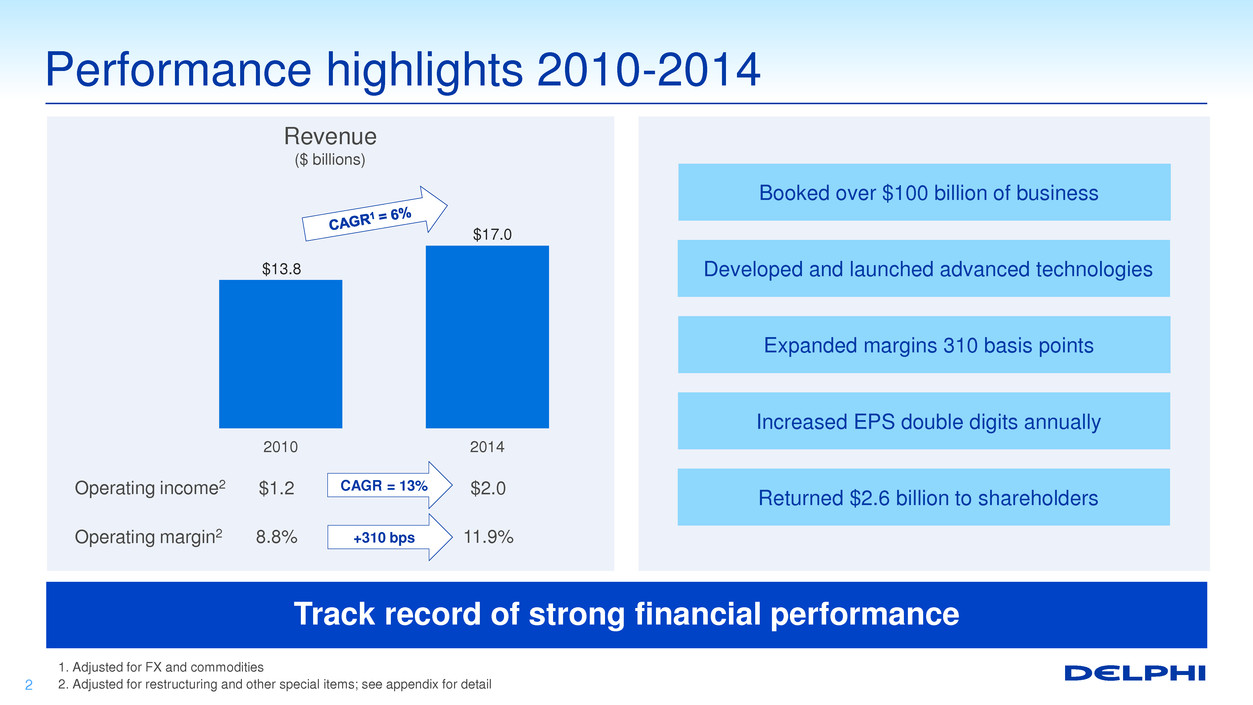
Performance highlights 2010-2014 2 1. Adjusted for FX and commodities 2. Adjusted for restructuring and other special items; see appendix for detail $13.8 $17.0 2010 2014 Booked over $100 billion of business Developed and launched advanced technologies Expanded margins 310 basis points Increased EPS double digits annually Returned $2.6 billion to shareholders $1.2 $2.0 8.8% 11.9% Operating income2 Operating margin2 CAGR = 13% +310 bps Revenue ($ billions) Track record of strong financial performance
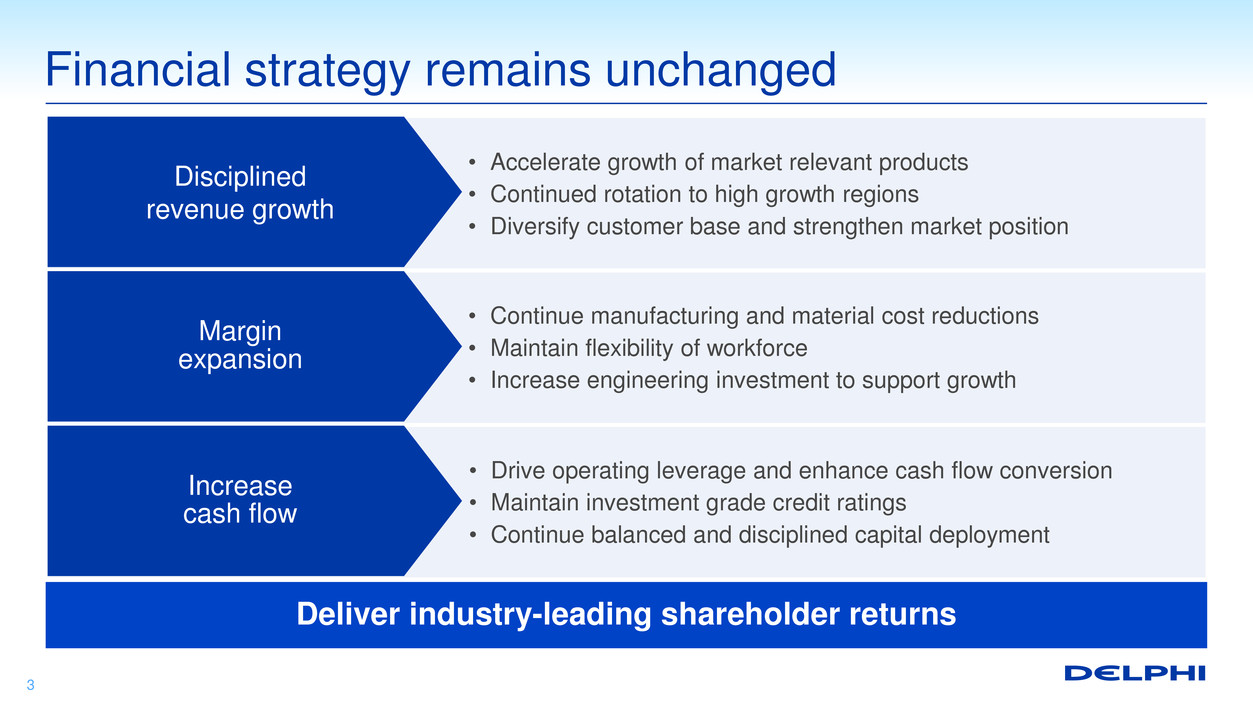
Financial strategy remains unchanged 3 Disciplined revenue growth Margin expansion Increase cash flow • Accelerate growth of market relevant products • Continued rotation to high growth regions • Diversify customer base and strengthen market position • Continue manufacturing and material cost reductions • Maintain flexibility of workforce • Increase engineering investment to support growth • Drive operating leverage and enhance cash flow conversion • Maintain investment grade credit ratings • Continue balanced and disciplined capital deployment Deliver industry-leading shareholder returns
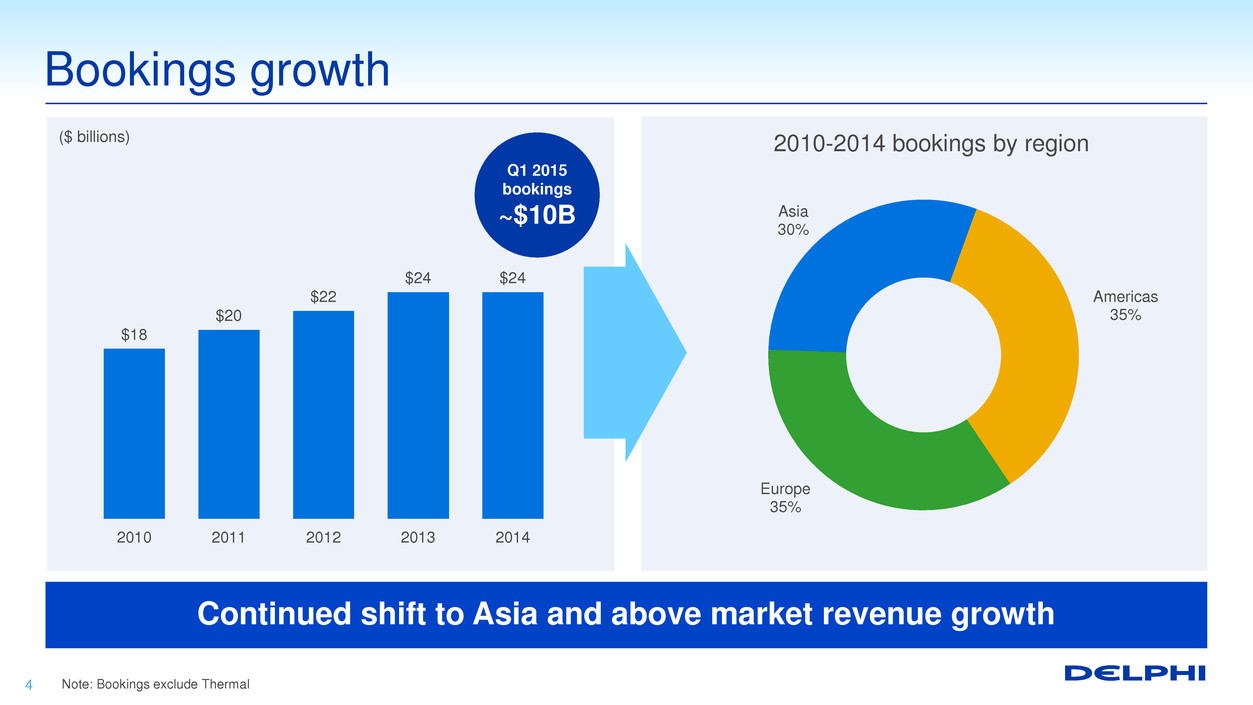
Bookings growth 4 Note: Bookings exclude Thermal $18 $20 $22 $24 $24 2010 2011 2012 2013 2014 ($ billions) Europe 35% Asia 30% Americas 35% 2010-2014 bookings by region Continued shift to Asia and above market revenue growth Q1 2015 bookings ~$10B

2015-2017 net new business by region Accelerating net new business 5 Note: Net new business excludes Thermal 2015-2017 net new business by segment Electronics & Safety 35% Electrical Architecture 40% Powertrain 25% Asia 45% Americas 32% Europe 23% $1.1 $1.7 $1.9 2015 2016 2017 ~$4.7 billion of cumulative net new business ($ billions)
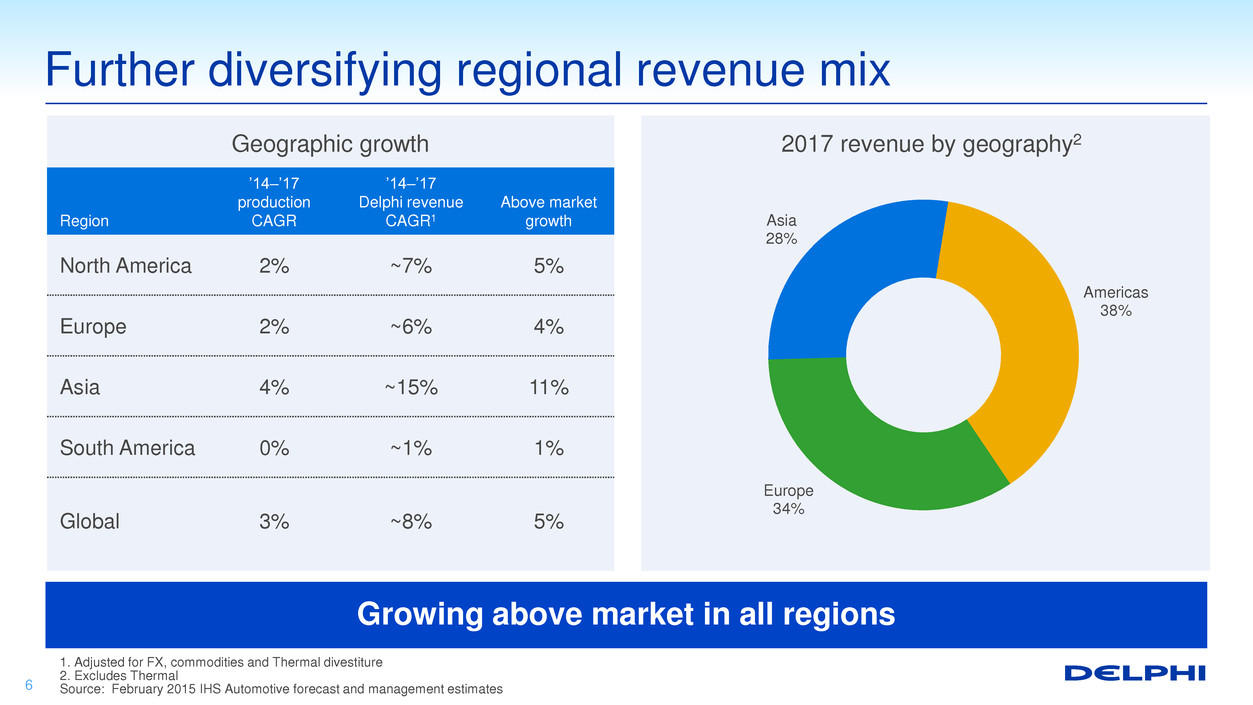
Europe 34% Asia 28% Americas 38% Further diversifying regional revenue mix 6 1. Adjusted for FX, commodities and Thermal divestiture 2. Excludes Thermal Source: February 2015 IHS Automotive forecast and management estimates Region ’14–’17 production CAGR ’14–’17 Delphi revenue CAGR1 Above market growth North America 2% ~7% 5% Europe 2% ~6% 4% Asia 4% ~15% 11% South America 0% ~1% 1% Global 3% ~8% 5% 2017 revenue by geography2 Geographic growth Growing above market in all regions

Manufacturing expense % of revenue 20.5% 20.0% ~18.2% 2010 2014 2017 Further improving cost structure 7 1. Represents gross engineering expenditures less rebills to customers and government agencies; 2014 gross engineering was $1.7B Note: 2017 excludes Thermal Material cost % of revenue 53.3% 50.1% ~48.6% 2010 2014 2017 $1.0 $1.3 ~$1.5 2010 2014 2017 Net engineering spend1 ($ billions) 7.5% 7.5% 7.8% Net spend % of revenue Lean cost structure allows for investment in engineering to drive growth

Revenue ($ billions) Revenue and EBITDA outlook 8 1. Adjusted for FX and commodities 2. Adjusted for FX, commodities and Thermal divestiture 3. Adjusted for restructuring and other special items; see appendix for detail Note: 2017 excludes Thermal Above market growth and operating leverage drive margin expansion EBITDA margin3 11.8% 15.3% ~17.5% Operating margin3 8.8% 11.9% ~14.0% $13.8 $17.0 ~$19.0 2010 2014 2017 ~17.5% 2017 15.3% 2014 Performance including restructuring Price / economics Leverage volume growth Growth investment/ engineering Portfolio realignment (Thermal) EBITDA3
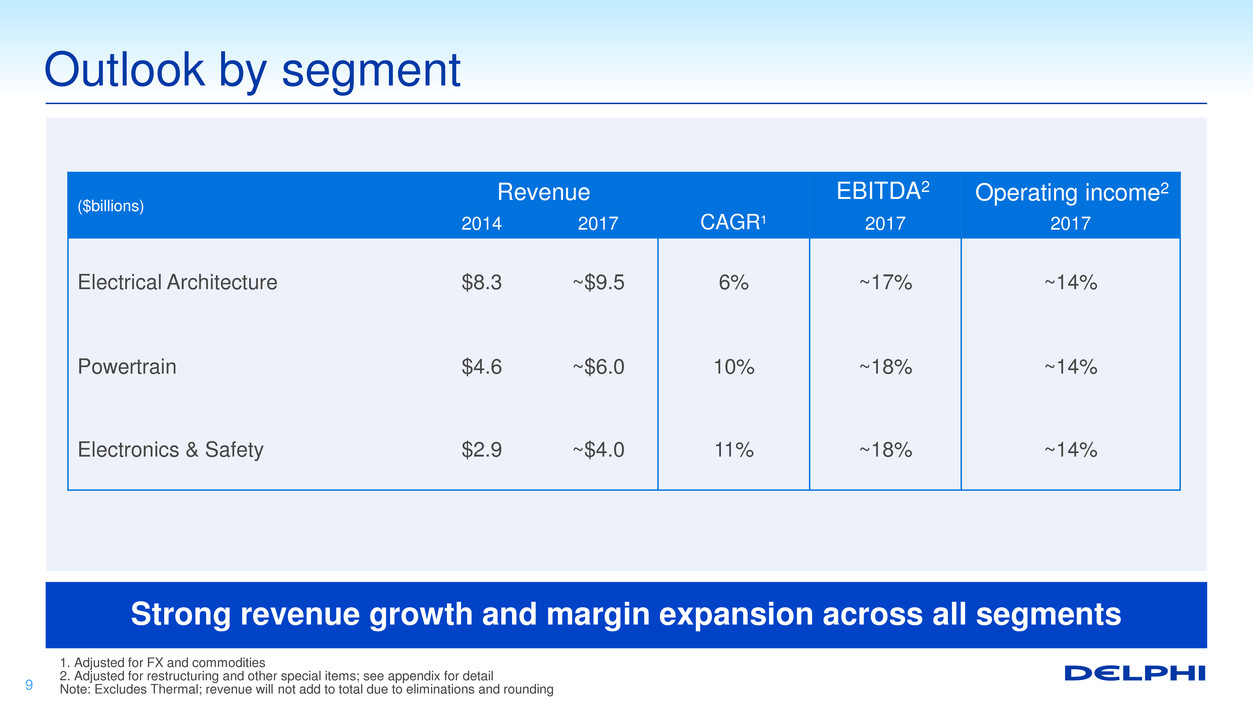
Outlook by segment 9 ($billions) 2014 2017 CAGR1 2017 2017 Electrical Architecture $8.3 ~$9.5 6% ~17% ~14% Powertrain $4.6 ~$6.0 10% ~18% ~14% Electronics & Safety $2.9 ~$4.0 11% ~18% ~14% Revenue EBITDA2 Operating income2 1. Adjusted for FX and commodities 2. Adjusted for restructuring and other special items; see appendix for detail Note: Excludes Thermal; revenue will not add to total due to eliminations and rounding Strong revenue growth and margin expansion across all segments

Robust business model 10 1. Adjusted for restructuring and other special items; see appendix for detail Note: 2017 excludes Thermal $17.0 ~ $19.0 ~$17 ~$21 2014 2017 2017 Risks Opportunities + Additional volume + Operating leverage + Acquisitions EBITDA1 % 15.3% ~17.5% Upside ~19% Downside ~16% Revenue ($ billions) - Lower industry volume - Foreign exchange headwinds - Commodity headwinds Positioned to seize opportunities and manage risks +/-10% volume
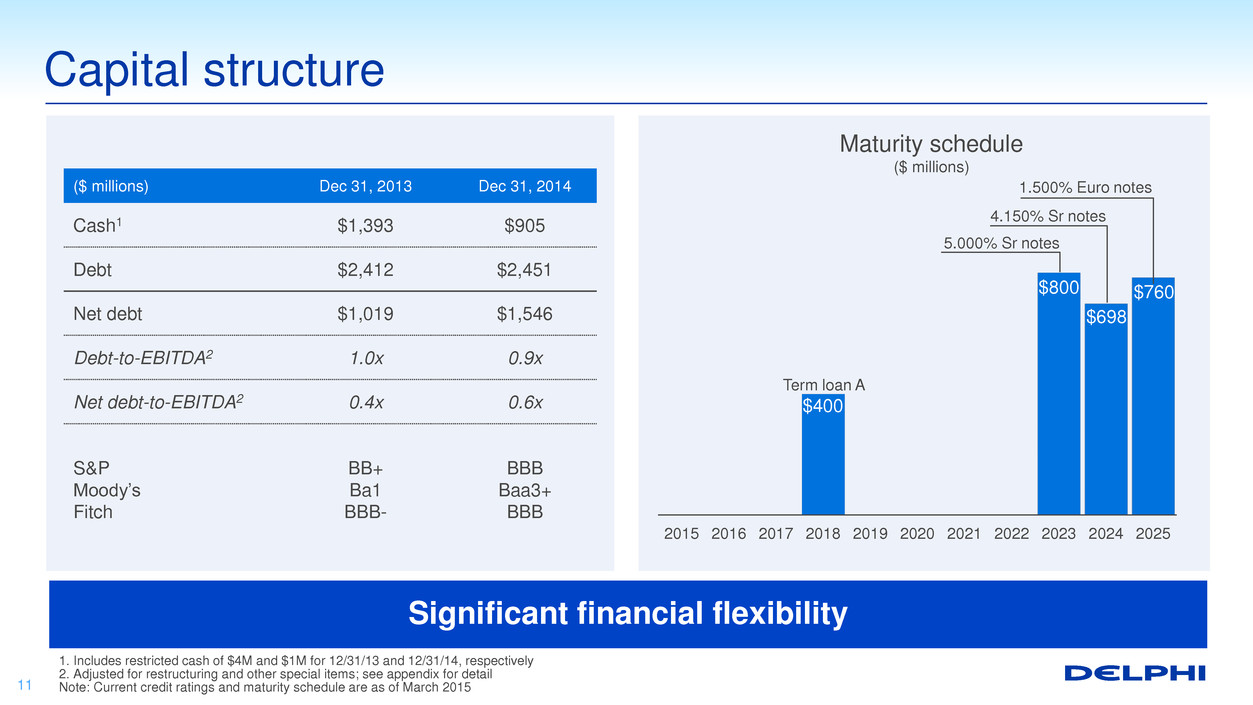
Capital structure 11 1. Includes restricted cash of $4M and $1M for 12/31/13 and 12/31/14, respectively 2. Adjusted for restructuring and other special items; see appendix for detail Note: Current credit ratings and maturity schedule are as of March 2015 ($ millions) Dec 31, 2013 Dec 31, 2014 Cash1 $1,393 $905 Debt $2,412 $2,451 Net debt $1,019 $1,546 Debt-to-EBITDA2 1.0x 0.9x Net debt-to-EBITDA2 0.4x 0.6x S&P Moody’s Fitch BB+ Ba1 BBB- BBB Baa3+ BBB Significant financial flexibility 2015 2016 2017 2018 2019 2020 2021 2022 2023 2024 2025 Maturity schedule ($ millions) $400 Term loan A 5.000% Sr notes 4.150% Sr notes $698 $800 1.500% Euro notes $760
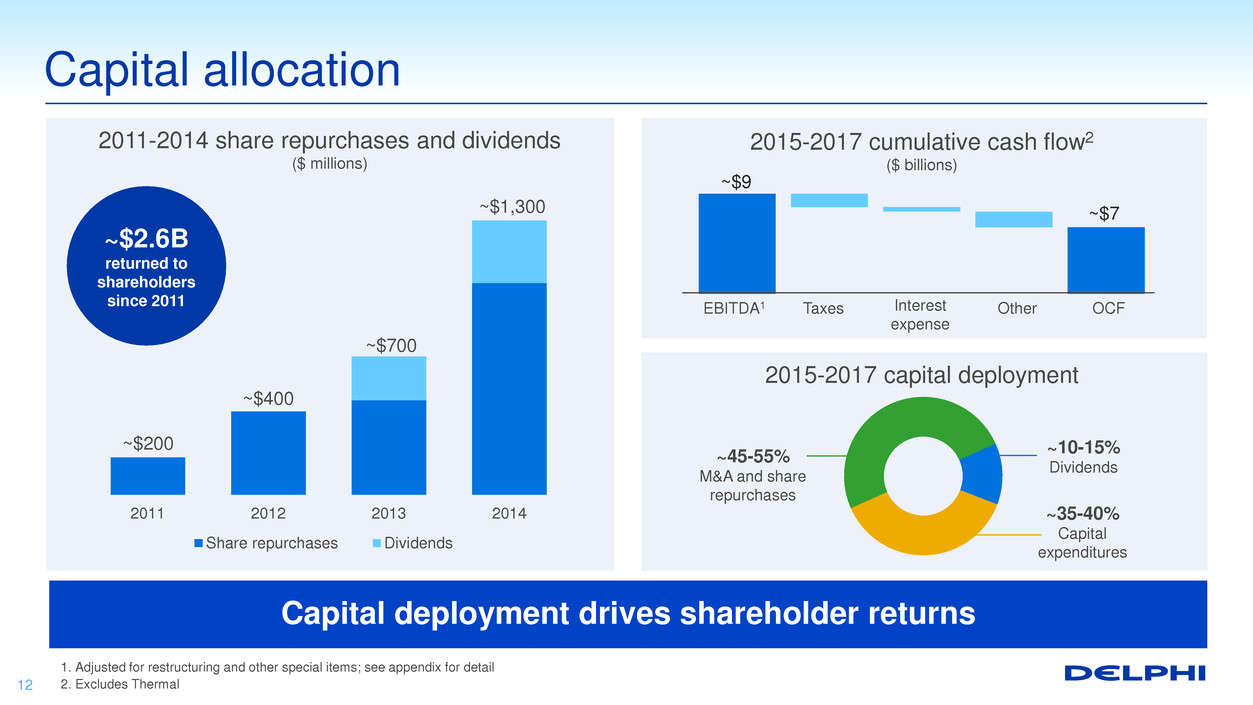
Capital allocation 12 1. Adjusted for restructuring and other special items; see appendix for detail 2. Excludes Thermal 2011-2014 share repurchases and dividends ($ millions) ~$200 ~$400 ~$1,300 ~$700 2011 2012 2013 2014 Share repurchases Dividends ~$2.6B returned to shareholders since 2011 2015-2017 cumulative cash flow2 ($ billions) ~$9 ~$7 EBITDA1 Taxes Interest expense Other OCF Capital deployment drives shareholder returns 2015-2017 capital deployment ~45-55% M&A and share repurchases ~35-40% Capital expenditures ~10-15% Dividends
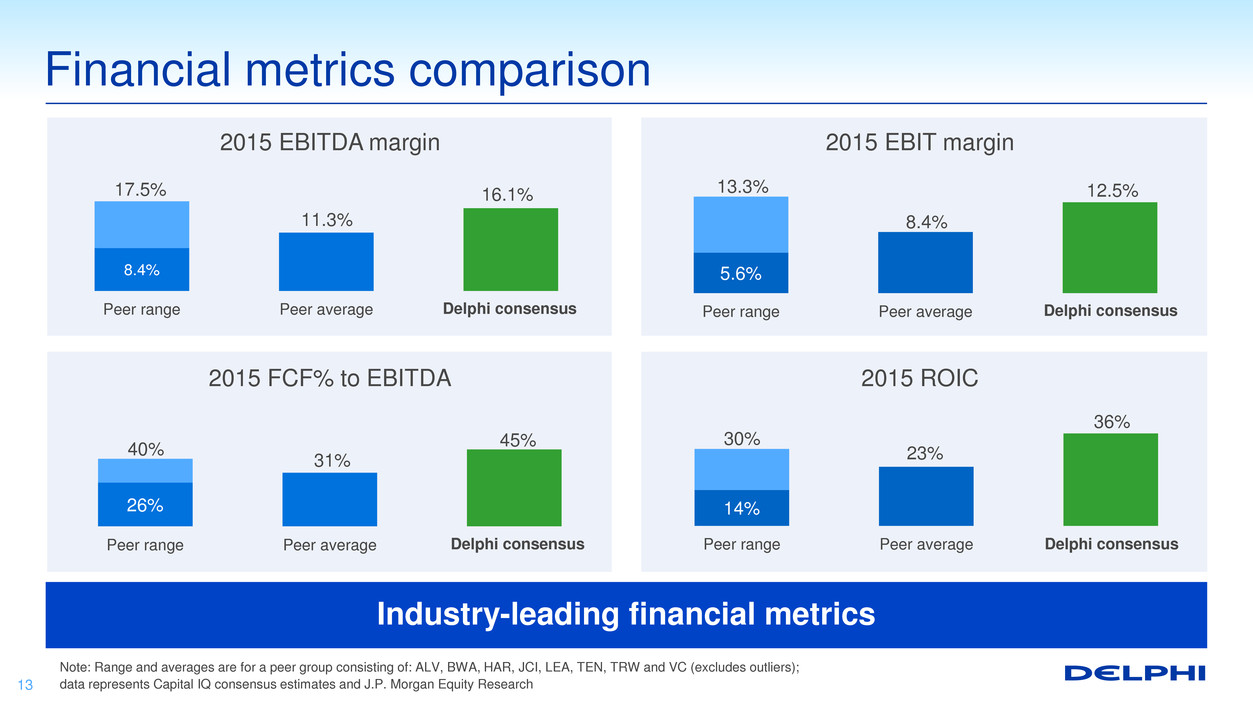
Financial metrics comparison 13 Note: Range and averages are for a peer group consisting of: ALV, BWA, HAR, JCI, LEA, TEN, TRW and VC (excludes outliers); data represents Capital IQ consensus estimates and J.P. Morgan Equity Research 2015 EBIT margin 2015 EBITDA margin 2015 ROIC 2015 FCF% to EBITDA 8.4% 17.5% Peer range Peer average 11.3% 16.1% 5.6% 8.4% 12.5% Peer range Peer average 13.3% 26% 31% 45% Peer range Peer average 40% 14% 23% 36% Peer range Peer average 30% Delphi consensus Delphi consensus Delphi consensus Delphi consensus Industry-leading financial metrics
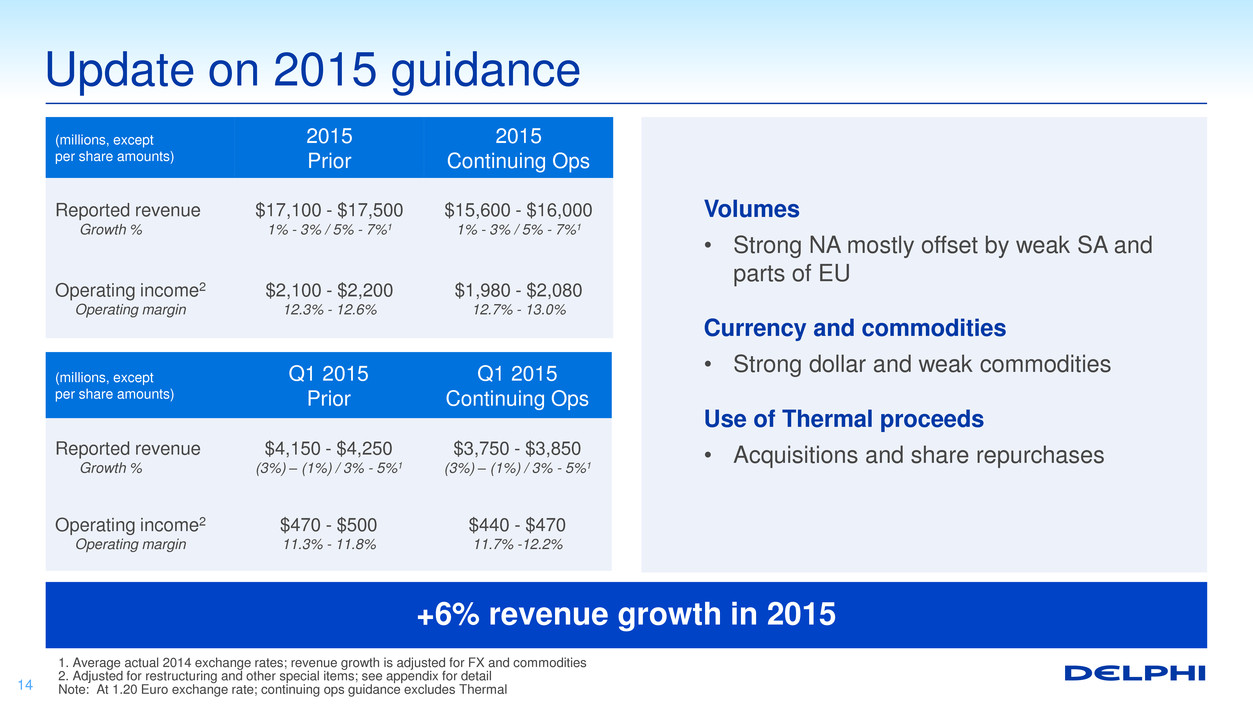
(millions, except per share amounts) 2015 Prior 2015 Continuing Ops Reported revenue Growth % $17,100 - $17,500 1% - 3% / 5% - 7%1 $15,600 - $16,000 1% - 3% / 5% - 7%1 Operating income2 Operating margin $2,100 - $2,200 12.3% - 12.6% $1,980 - $2,080 12.7% - 13.0% Update on 2015 guidance 14 1. Average actual 2014 exchange rates; revenue growth is adjusted for FX and commodities 2. Adjusted for restructuring and other special items; see appendix for detail Note: At 1.20 Euro exchange rate; continuing ops guidance excludes Thermal (millions, except per share amounts) Q1 2015 Prior Q1 2015 Continuing Ops Reported revenue Growth % $4,150 - $4,250 (3%) – (1%) / 3% - 5%1 $3,750 - $3,850 (3%) – (1%) / 3% - 5%1 Operating income2 Operating margin $470 - $500 11.3% - 11.8% $440 - $470 11.7% -12.2% Volumes • Strong NA mostly offset by weak SA and parts of EU Currency and commodities • Strong dollar and weak commodities Use of Thermal proceeds • Acquisitions and share repurchases +6% revenue growth in 2015

What you heard today • Strategically focused portfolio of relevant technologies • Revenue growth continues to accelerate • Driving operational excellence • Continued margin expansion and earnings growth • Balanced and disciplined capital allocation plan 15 Well positioned to drive value
Appendix
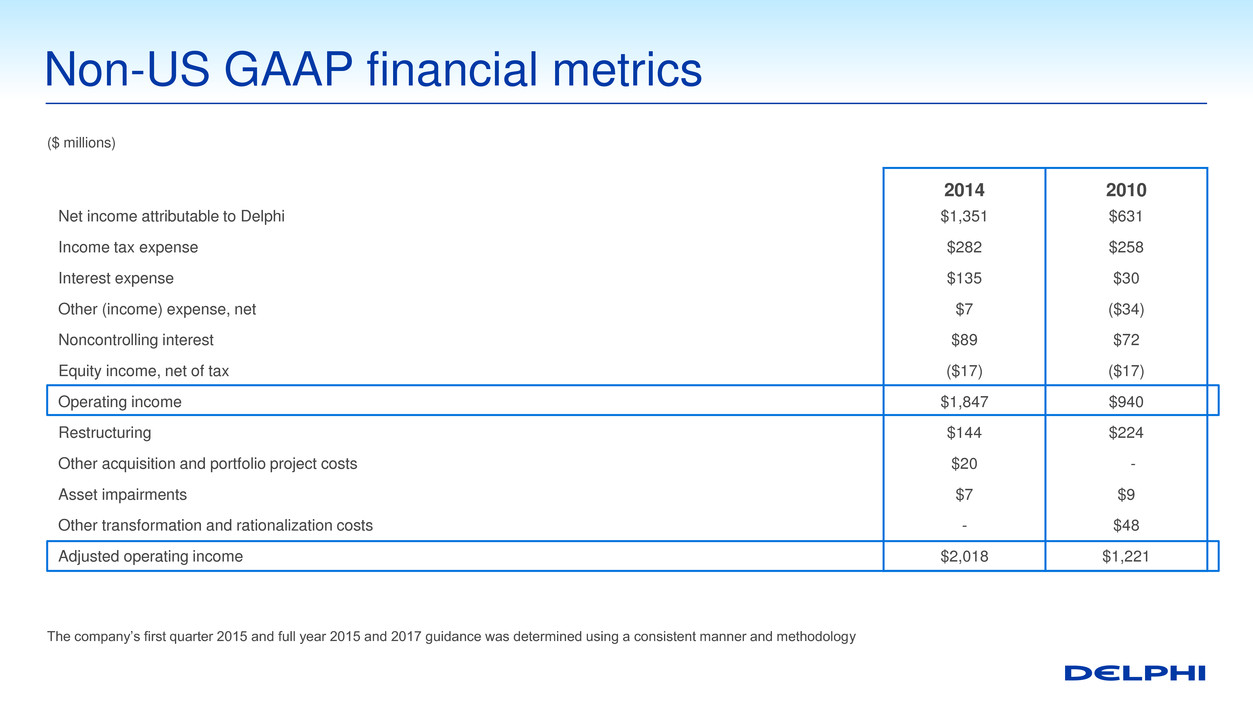
2014 2010 Net income attributable to Delphi $1,351 $631 Income tax expense $282 $258 Interest expense $135 $30 Other (income) expense, net $7 ($34) Noncontrolling interest $89 $72 Equity income, net of tax ($17) ($17) Operating income $1,847 $940 Restructuring $144 $224 Other acquisition and portfolio project costs $20 - Asset impairments $7 $9 Other transformation and rationalization costs - $48 Adjusted operating income $2,018 $1,221 Non-US GAAP financial metrics The company’s first quarter 2015 and full year 2015 and 2017 guidance was determined using a consistent manner and methodology ($ millions) 17

2014 2010 Net income attributable to Delphi $1,351 $631 Income tax expense $282 $258 Interest expense $135 $30 Other (income) expense, net $7 ($34) Noncontrolling interest $89 $72 Equity income, net of tax ($17) ($17) Operating income $1,847 $940 Depreciation and amortization $587 $421 EBITDA $2,434 $1,361 Restructuring $144 $224 Other acquisition and portfolio project costs $20 - Other transformation and rationalization costs - $48 Adjusted EBITDA $2,598 $1,633 Non-US GAAP financial metrics The company’s 2017 guidance was determined using a consistent manner and methodology ($ millions) 18


