Strategic overview Kevin Clark President and Chief Executive Officer Exhibit 99.1

Evolution of Delphi DLPH evolution 2011 - Initial public offering; value creation opportunity for shareholders 2012 - MVL acquisition; strengthening core connector offering 2013 - Streamlining operational efficiencies; continued margin expansion 2014 - Antaya/Unwired acquisitions; enhancing connectivity offerings 2015 - Accelerated portfolio modifications – divestitures, acquisitions, investments 2016 - On track to deliver commitments; compelling five year outlook Highlights 2010 - 2015 2010 - Private company; aligning cost footprint and product portfolio Booked over $130 billion of business Developed and launched advanced technologies Expanded margins 420 basis points Double-digit EPS CAGR Returned $4.0 billion to shareholders Strong track record of plan execution
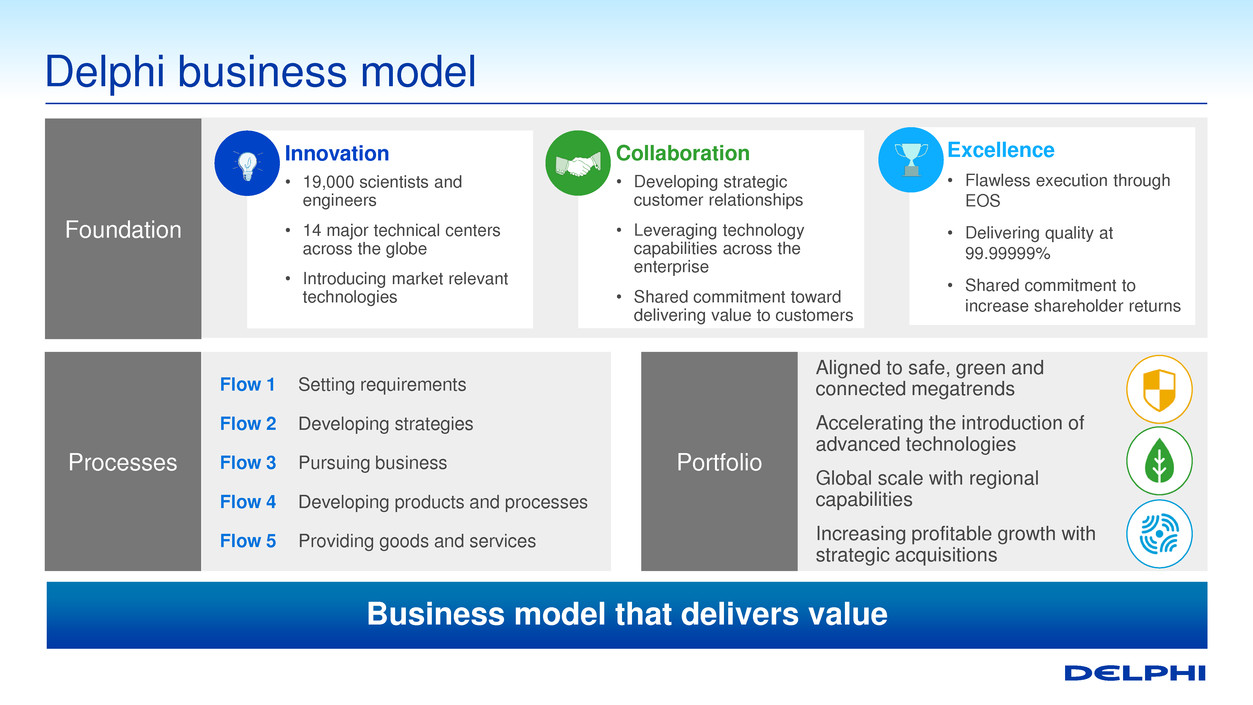
Aligned to safe, green and connected megatrends Accelerating the introduction of advanced technologies Global scale with regional capabilities Increasing profitable growth with strategic acquisitions Processes Delphi business model Foundation Innovation • 19,000 scientists and engineers • 14 major technical centers across the globe • Introducing market relevant technologies Collaboration • Developing strategic customer relationships • Leveraging technology capabilities across the enterprise • Shared commitment toward delivering value to customers Excellence • Flawless execution through EOS • Delivering quality at 99.99999% • Shared commitment to increase shareholder returns Flow 1 Setting requirements Flow 2 Developing strategies Flow 3 Pursuing business Flow 4 Developing products and processes Flow 5 Providing goods and services Portfolio Business model that delivers value

Delphi Enterprise Operating System 1. Adjusted for FX, commodities, the E&S divestiture and HellermannTyton in 2016 2. Adjusted for restructuring and other special items; see appendix to Financial overview for detail; growth off 2015 base year Setting robust goals: • Operating targets • Financial targets – 8-10%1 revenue CAGR; >1502 bps margin improvement by 2020 • Strong shareholder returns • Increased customer satisfaction Fully integrated lean operating system Developing strategies: • Resource alignment • Footprint rotation • Margin expansion • Cash flow generation Bookings targets: • Market relevant portfolio • Enhanced customer intimacy • Win rate > 50% • Over $130B of new business since 2010 Flawless launch: • Global engineering footprint • Increased engineering resources • Increased material and manufacturing performance • ~95% flawless launches Quality performance: • Right part, right time, right quantity • Manufacturing performance focus • 99.99999% quality Flow 1 Managing stakeholders’ requirements Set requirements Flow 2 Developing strategies & capabilities Advanced technology development Flow 3 Pursuing business Sell products Flow 4 Developing products & processes Design products Flow 5 Providing goods & services Build and ship products
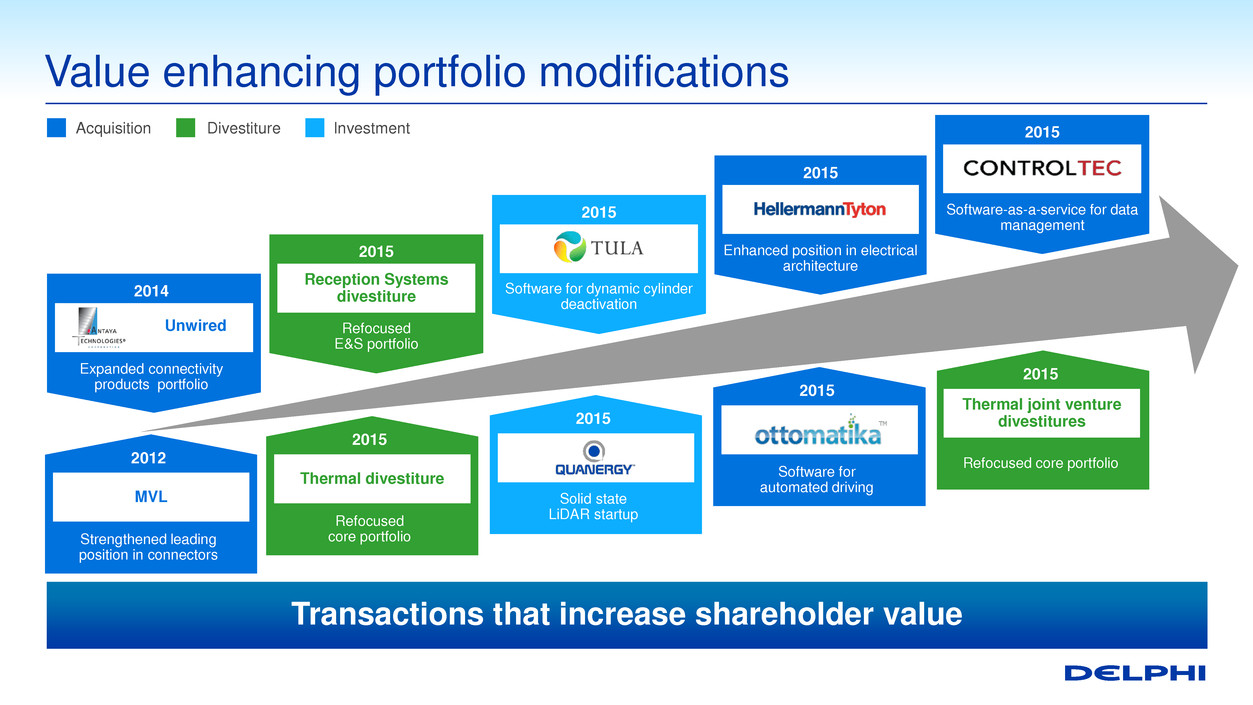
Value enhancing portfolio modifications 2012 MVL Strengthened leading position in connectors 2015 Thermal divestiture Refocused core portfolio 2015 Solid state LiDAR startup 2015 Software for automated driving 2015 Thermal joint venture divestitures Refocused core portfolio 2015 Software-as-a-service for data management 2014 Expanded connectivity products portfolio 2015 Reception Systems divestiture Refocused E&S portfolio 2015 Software for dynamic cylinder deactivation 2015 Enhanced position in electrical architecture Investment Divestiture Acquisition Unwired Transactions that increase shareholder value
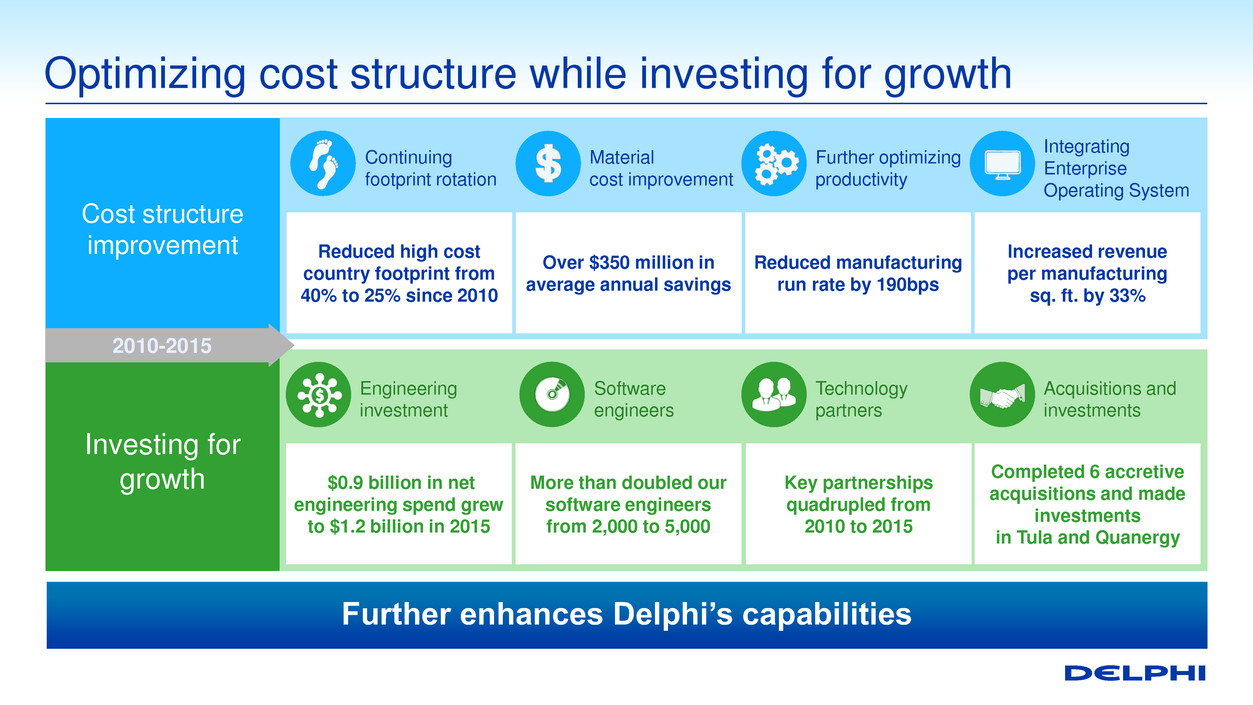
Optimizing cost structure while investing for growth Continuing footprint rotation Reduced high cost country footprint from 40% to 25% since 2010 Cost structure improvement Investing for growth Over $350 million in average annual savings Reduced manufacturing run rate by 190bps Increased revenue per manufacturing sq. ft. by 33% Material cost improvement Further optimizing productivity Integrating Enterprise Operating System $0.9 billion in net engineering spend grew to $1.2 billion in 2015 Completed 6 accretive acquisitions and made investments in Tula and Quanergy Engineering investment Technology partners Acquisitions and investments Key partnerships quadrupled from 2010 to 2015 Software engineers More than doubled our software engineers from 2,000 to 5,000 2010-2015 Further enhances Delphi’s capabilities
Today’s Delphi More technology More diverse More balanced More efficient More profitable More cash generative More predictable Well positioned to drive value
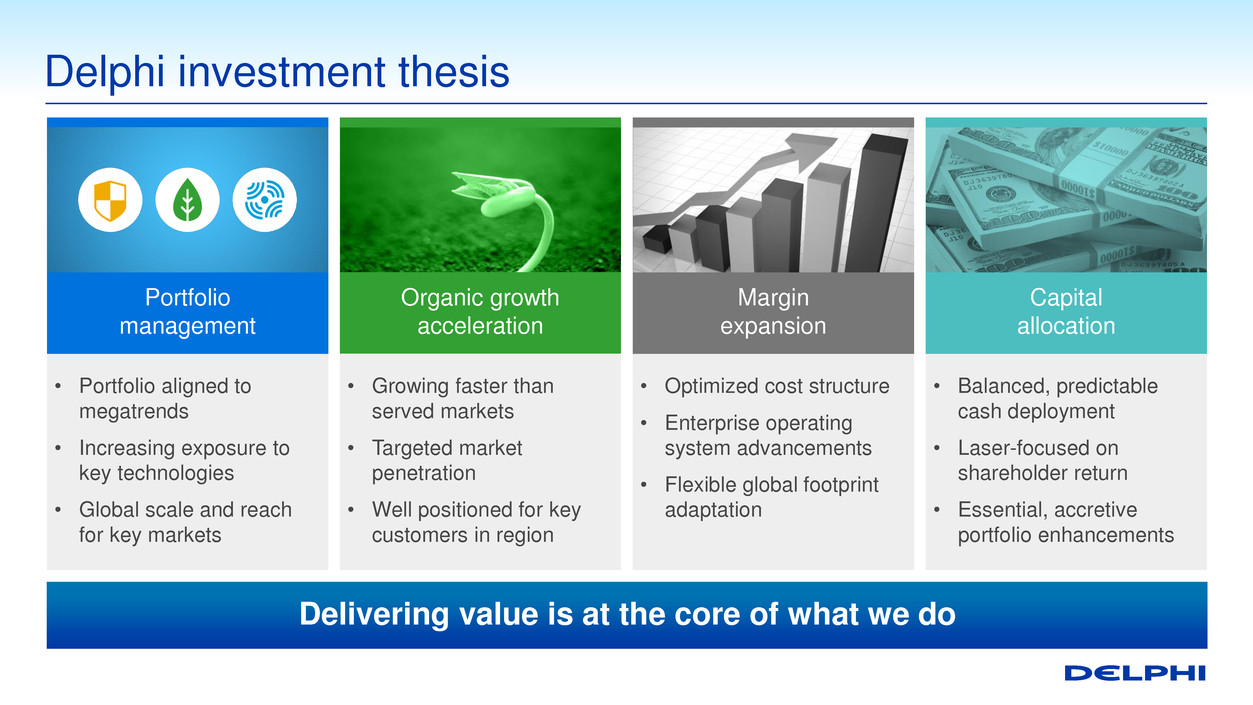
Delphi investment thesis Organic growth acceleration • Growing faster than served markets • Targeted market penetration • Well positioned for key customers in region • Optimized cost structure • Enterprise operating system advancements • Flexible global footprint adaptation • Balanced, predictable cash deployment • Laser-focused on shareholder return • Essential, accretive portfolio enhancements Margin expansion Capital allocation • Portfolio aligned to megatrends • Increasing exposure to key technologies • Global scale and reach for key markets Portfolio management Delivering value is at the core of what we do
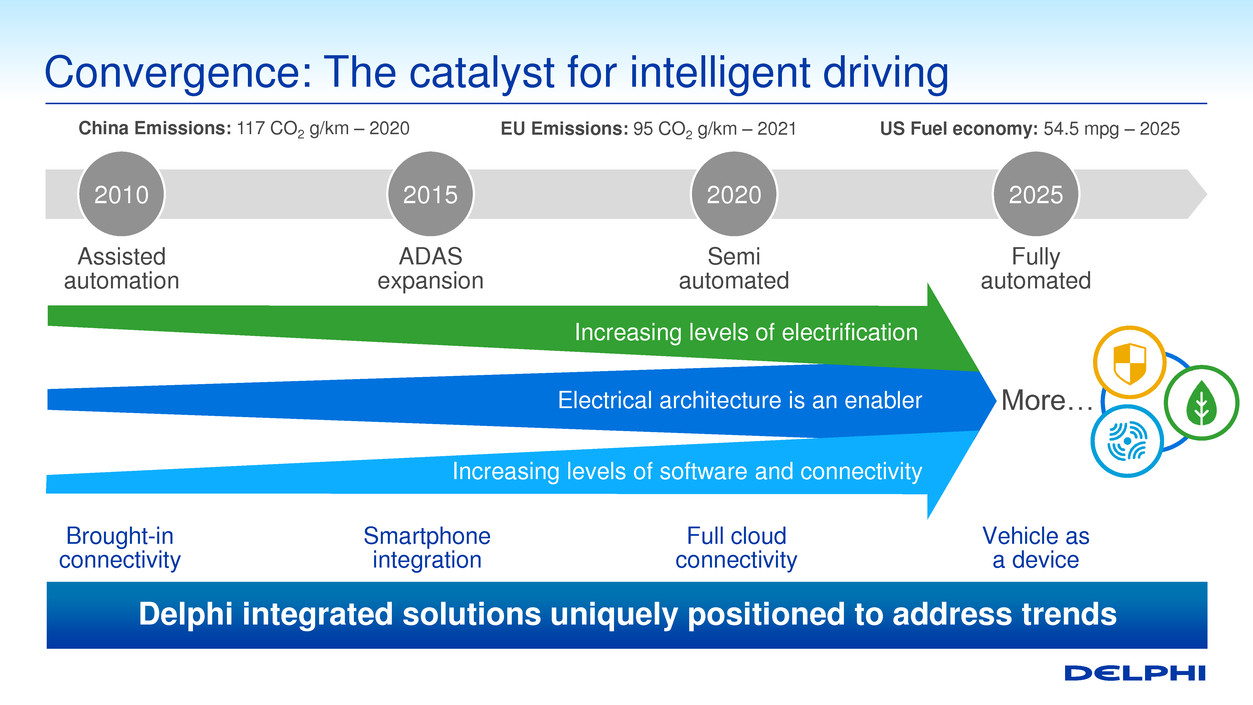
Convergence: The catalyst for intelligent driving 2010 2020 2025 2015 Semi automated Assisted automation ADAS expansion Fully automated Full cloud connectivity Brought-in connectivity Smartphone integration Vehicle as a device Increasing levels of electrification Electrical architecture is an enabler Increasing levels of software and connectivity More… US Fuel economy: 54.5 mpg – 2025 EU Emissions: 95 CO2 g/km – 2021 China Emissions: 117 CO2 g/km – 2020 Delphi integrated solutions uniquely positioned to address trends
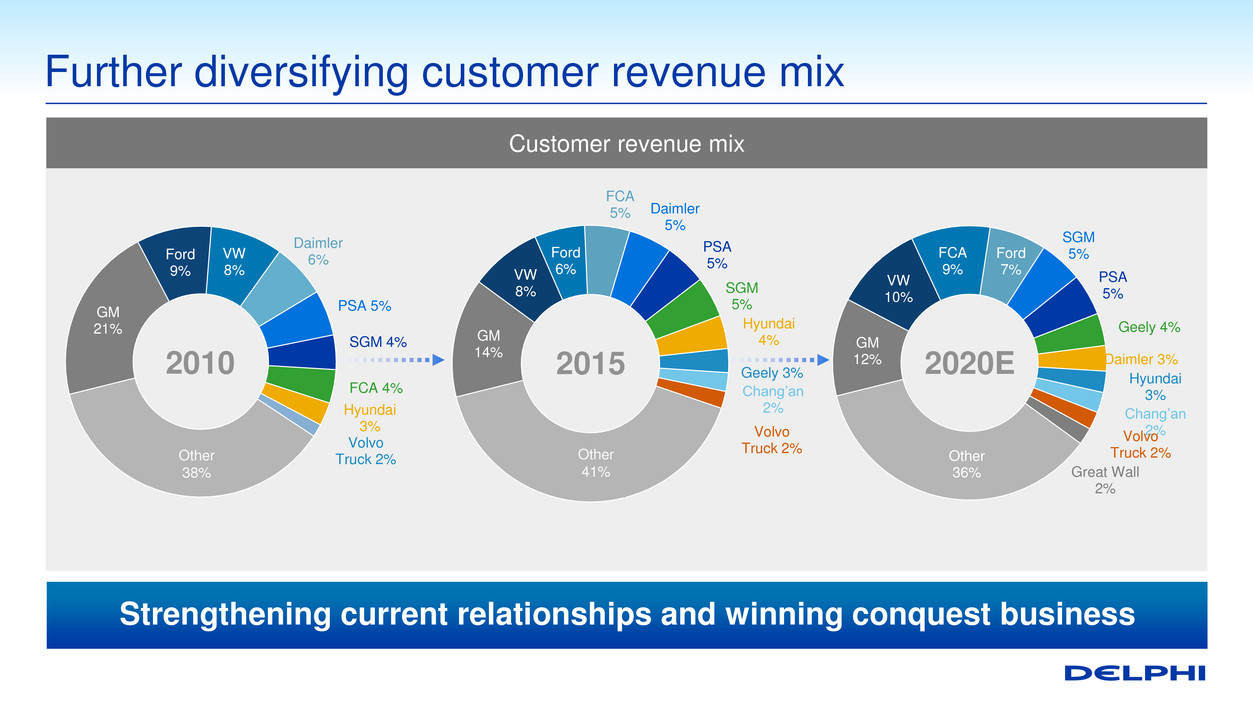
GM 12% VW 10% FCA 9% Ford 7% SGM 5% PSA 5% Geely 4% Daimler 3% Hyundai 3% Chang’an 2% Volvo Truck 2% Great Wall 2% Other 36% GM 14% VW 8% Ford 6% FCA 5% Daimler 5% PSA 5% SGM 5% Hyundai 4% Geely 3% Chang’an 2% Volvo Truck 2% GM 21% Ford 9% VW 8% Daimler 6% PSA 5% SGM 4% FCA 4% Hyundai 3% Volvo Truck 2% Further diversifying customer revenue mix Customer revenue mix 2020E 2015 2010 Other 38% Other 41% Strengthening current relationships and winning conquest business

Europe 33% Asia 31% Americas 36% Further diversifying regional revenue mix Regional revenue mix 2020E 2010 Europe 35% Asia 25% Americas 40% Europe 43% Asia 16% Americas 41% 2015 Continue rotation to high growth markets
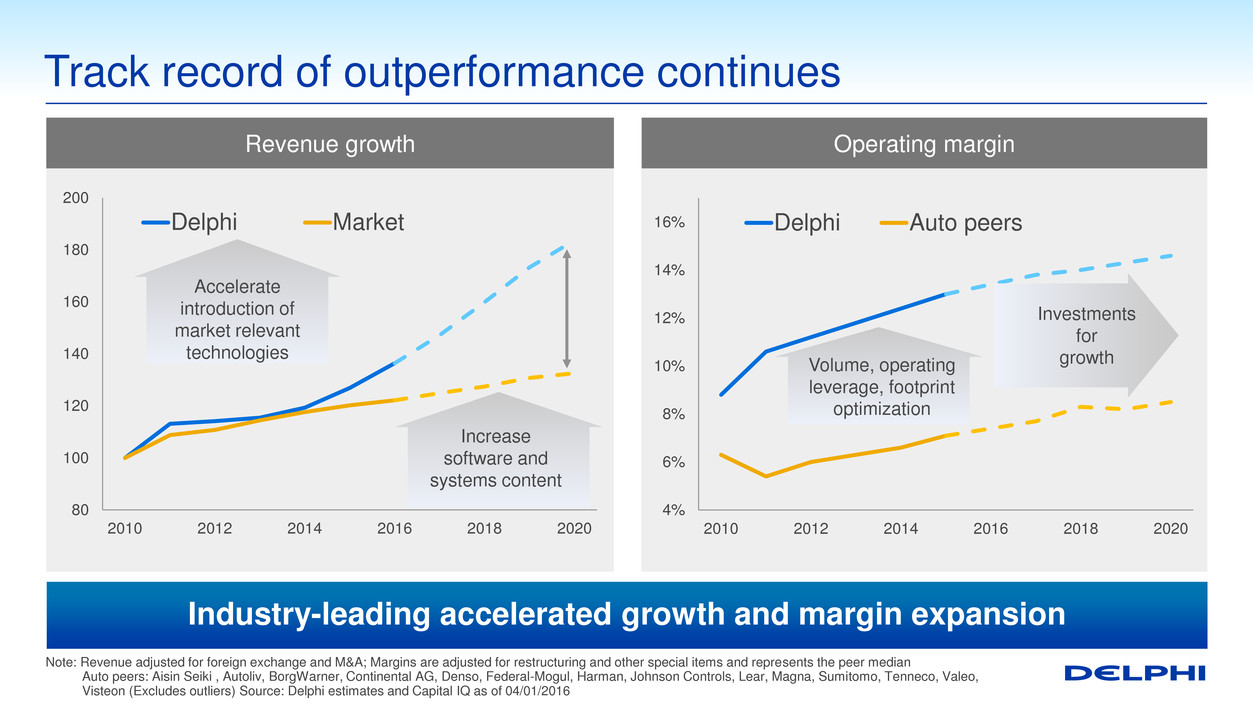
Track record of outperformance continues Note: Revenue adjusted for foreign exchange and M&A; Margins are adjusted for restructuring and other special items and represents the peer median Auto peers: Aisin Seiki , Autoliv, BorgWarner, Continental AG, Denso, Federal-Mogul, Harman, Johnson Controls, Lear, Magna, Sumitomo, Tenneco, Valeo, Visteon (Excludes outliers) Source: Delphi estimates and Capital IQ as of 04/01/2016 4% 6% 8% 10% 12% 14% 16% 2010 2012 2014 2016 2018 2020 Delphi Auto peers Operating margin Revenue growth 80 100 120 140 160 180 200 2010 2012 2014 2016 2018 2020 Delphi Market Accelerate introduction of market relevant technologies Increase software and systems content Volume, operating leverage, footprint optimization Investments for growth Industry-leading accelerated growth and margin expansion

Strategic imperatives towards 2020 • Enhance portfolio of market relevant products • Balanced regional growth • Further diversify customer base and platform mix • Maintain investment grade ratings • Continue investment in organic and acquisition growth • Return cash to shareholders Disciplined revenue growth • Continue footprint rotation to best cost countries • Further integrate EOS across the enterprise • Increase leverage in operating model Cost structure optimization Increase cash flow Strategy remains unchanged
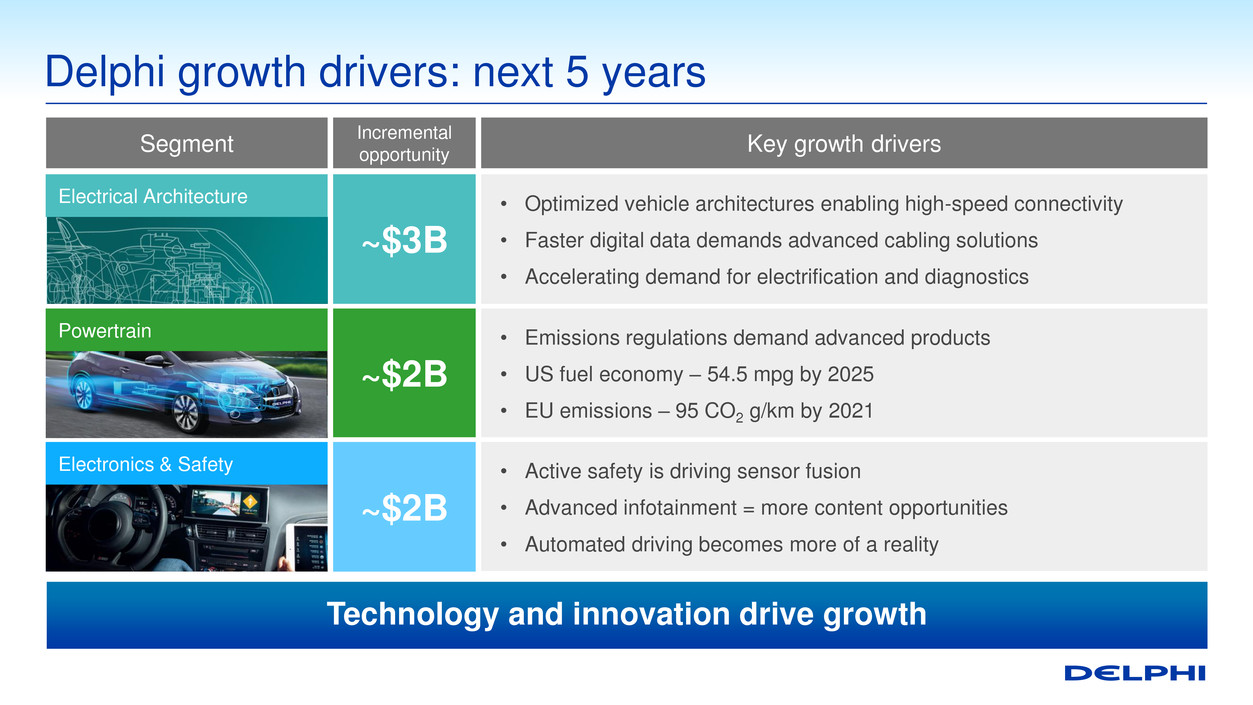
Delphi growth drivers: next 5 years ~$3B ~$2B ~$2B • Optimized vehicle architectures enabling high-speed connectivity • Faster digital data demands advanced cabling solutions • Accelerating demand for electrification and diagnostics • Emissions regulations demand advanced products • US fuel economy – 54.5 mpg by 2025 • EU emissions – 95 CO2 g/km by 2021 • Active safety is driving sensor fusion • Advanced infotainment = more content opportunities • Automated driving becomes more of a reality Key growth drivers Segment Incremental opportunity Electronics & Safety Electrical Architecture Powertrain Technology and innovation drive growth
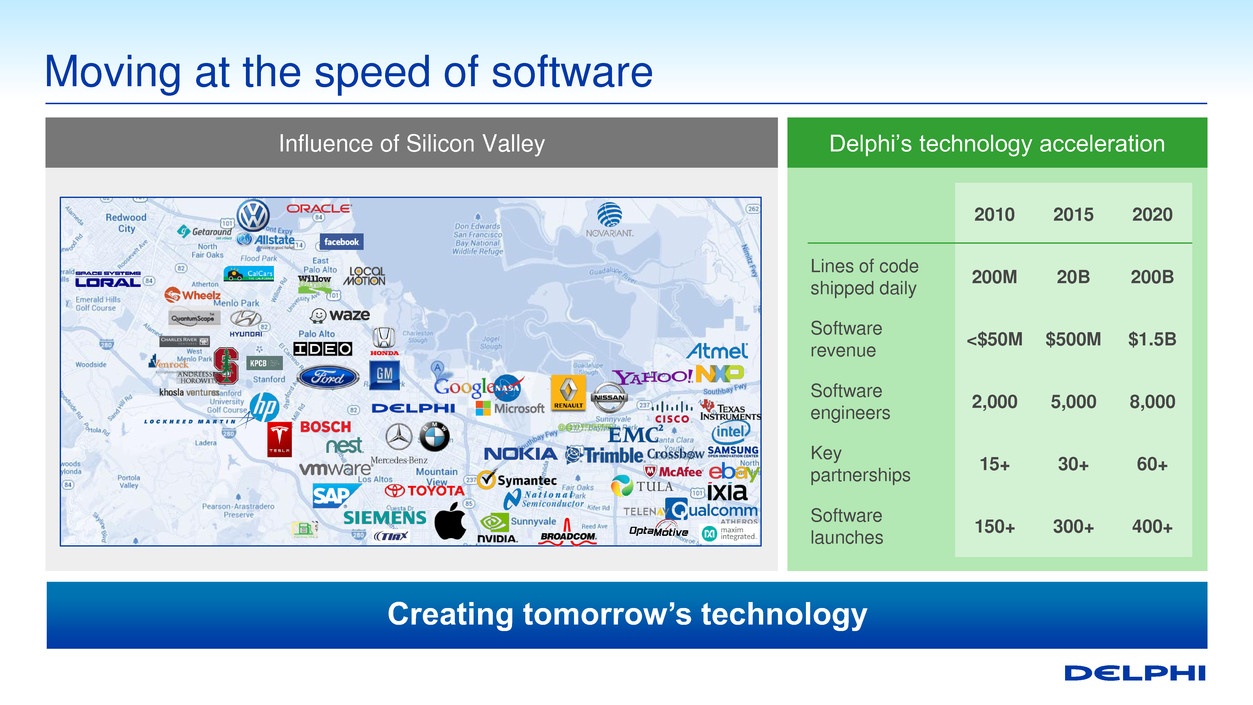
Influence of Silicon Valley Moving at the speed of software 2010 2015 2020 Lines of code shipped daily 200M 20B 200B Software revenue <$50M $500M $1.5B Software engineers 2,000 5,000 8,000 Key partnerships 15+ 30+ 60+ Software launches 150+ 300+ 400+ Delphi’s technology acceleration Creating tomorrow’s technology
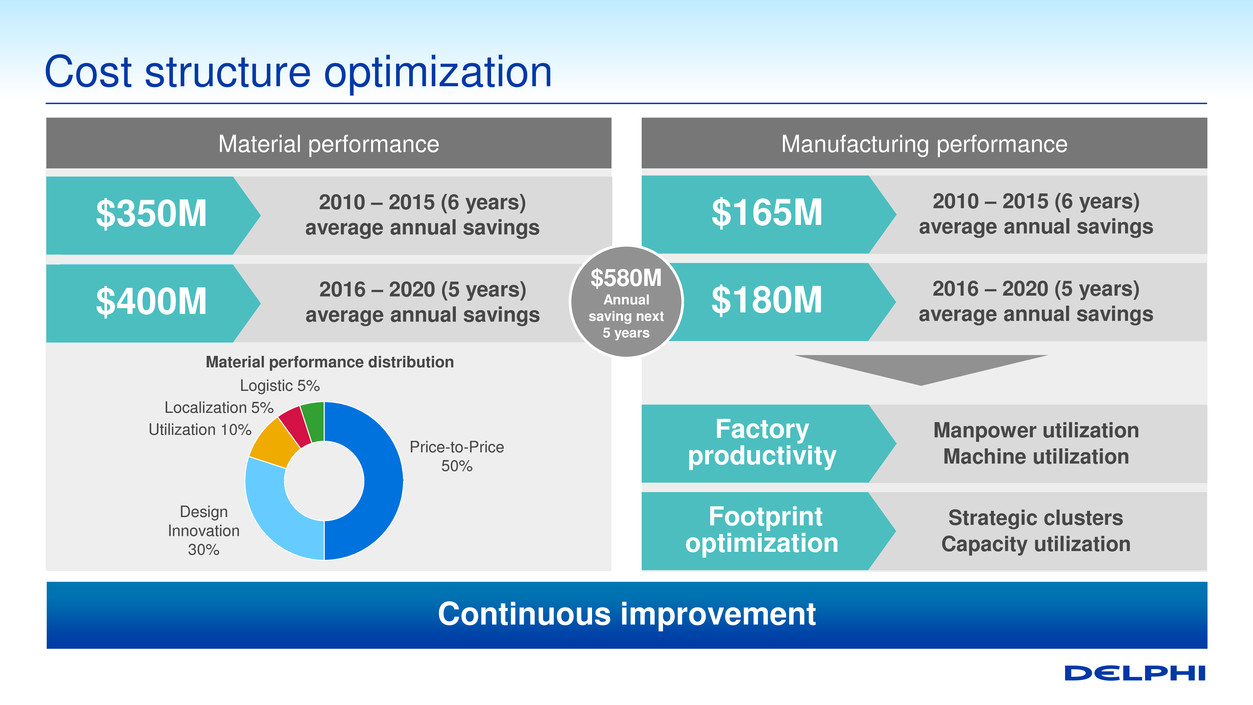
Cost structure optimization Price-to-Price 50% Design Innovation 30% Utilization 10% Localization 5% Logistic 5% 2010 – 2015 (6 years) average annual savings $350M 2016 – 2020 (5 years) average annual savings $400M 2010 – 2015 (6 years) average annual savings $165M 2016 – 2020 (5 years) average annual savings $180M Material performance distribution Manufacturing performance Material performance Manpower utilization Machine utilization Factory productivity Strategic clusters Capacity utilization Footprint optimization $580M Annual saving next 5 years Continuous improvement
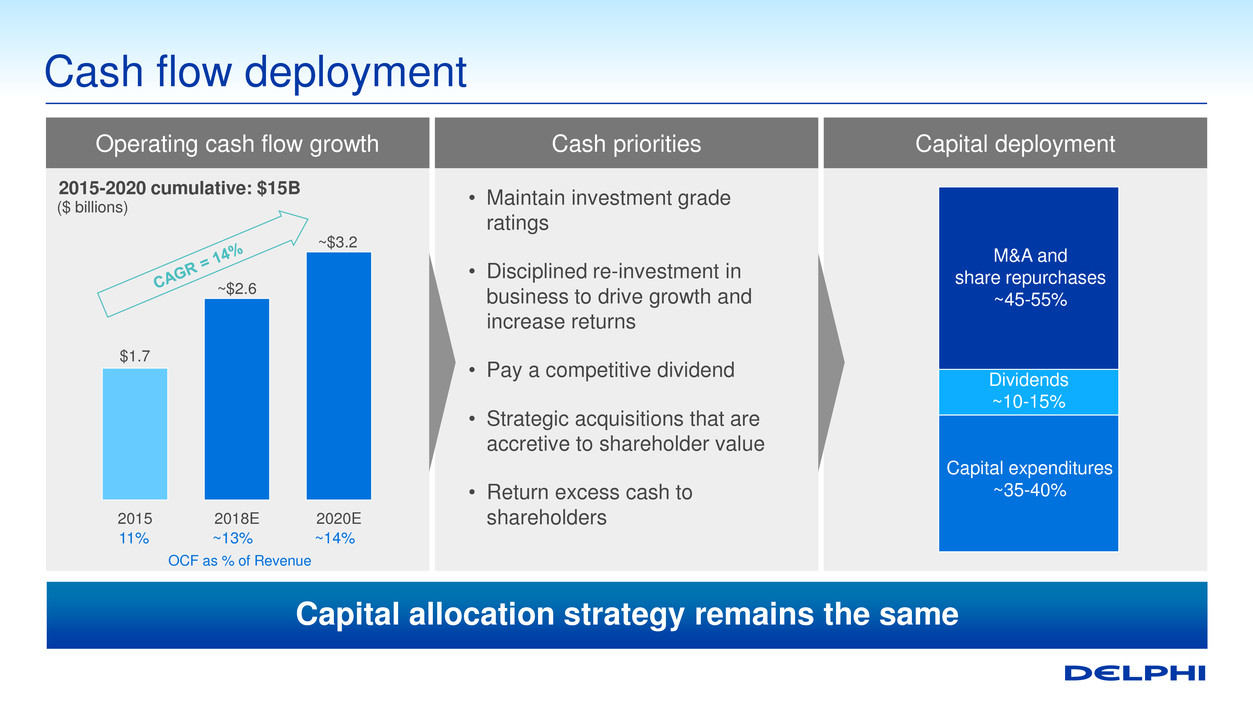
Capital deployment Operating cash flow growth Cash priorities Cash flow deployment 17 $1.7 ~$2.6 ~$3.2 2015 2018E 2020E • Maintain investment grade ratings • Disciplined re-investment in business to drive growth and increase returns • Pay a competitive dividend • Strategic acquisitions that are accretive to shareholder value • Return excess cash to shareholders M&A and share repurchases ~45-55% Dividends ~10-15% Capital expenditures ~35-40% 2015-2020 cumulative: $15B ($ billions) 11% ~13% ~14% OCF as % of Revenue Capital allocation strategy remains the same
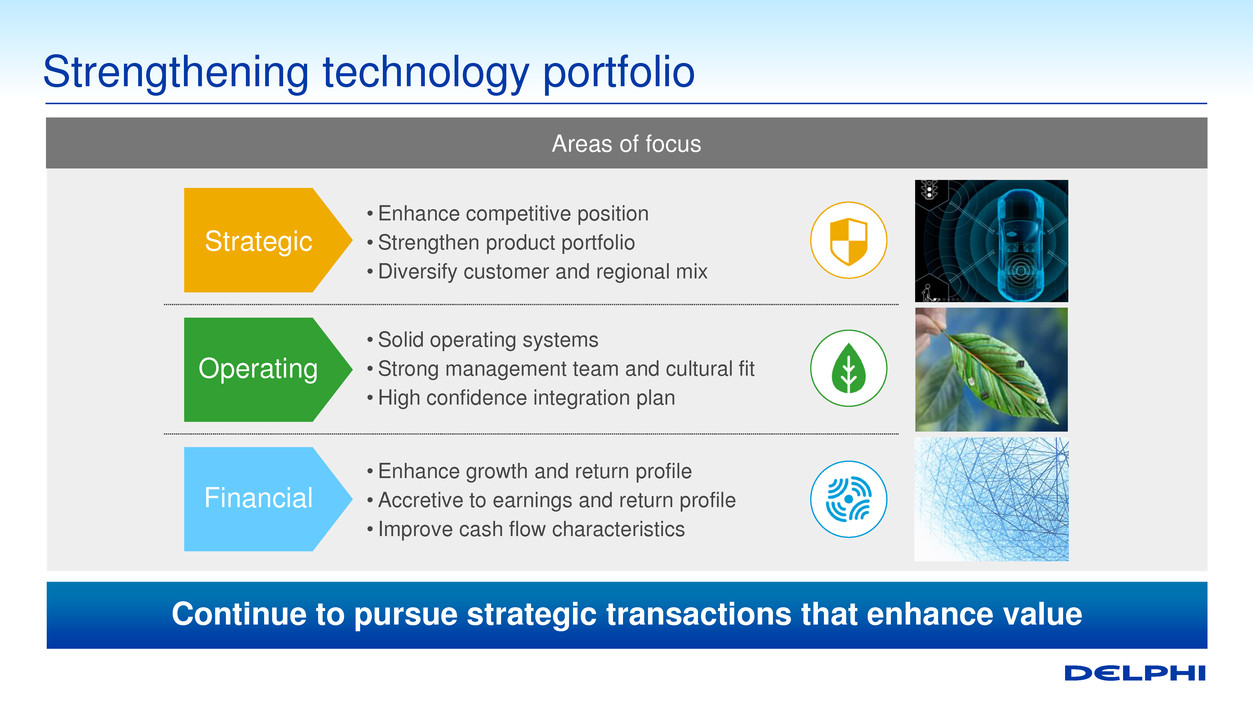
Strengthening technology portfolio Areas of focus Operating • Solid operating systems • Strong management team and cultural fit •High confidence integration plan Strategic • Enhance competitive position • Strengthen product portfolio •Diversify customer and regional mix Financial • Enhance growth and return profile •Accretive to earnings and return profile • Improve cash flow characteristics Continue to pursue strategic transactions that enhance value
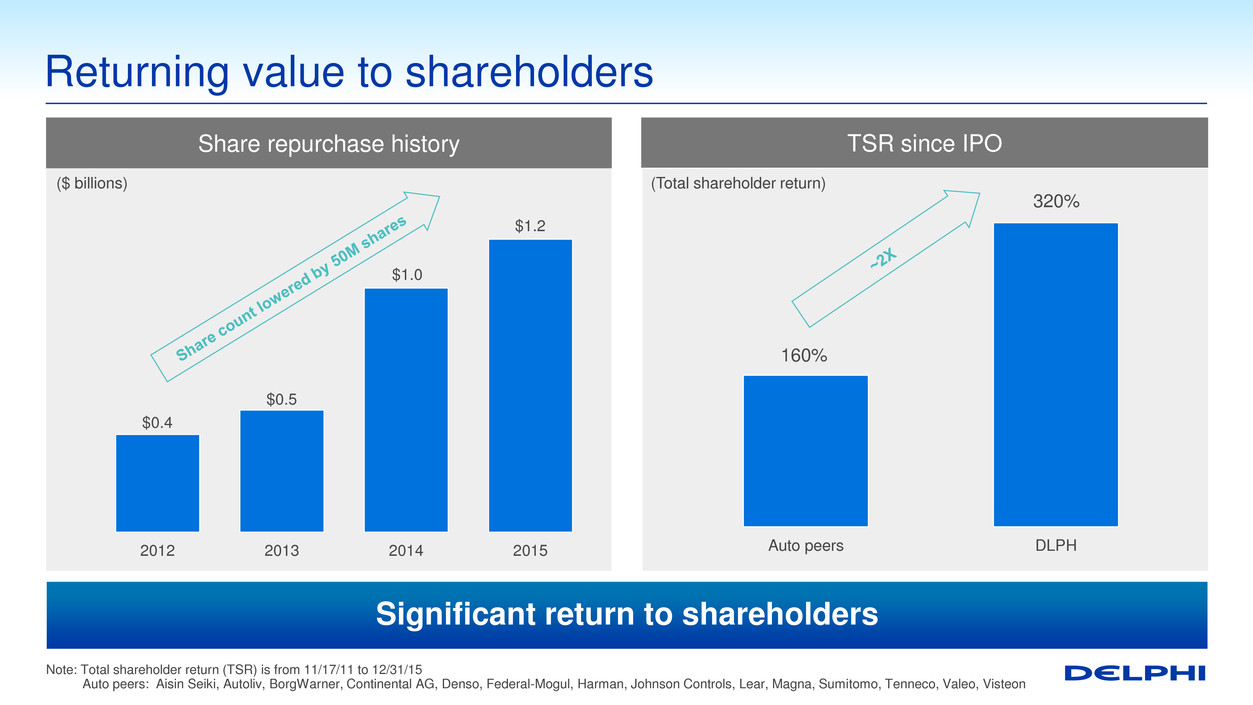
TSR since IPO Returning value to shareholders Auto peers DLPH 320% 160% $0.4 $0.5 $1.0 $1.2 2012 2013 2014 2015 (Total shareholder return) Share repurchase history ($ billions) Note: Total shareholder return (TSR) is from 11/17/11 to 12/31/15 Auto peers: Aisin Seiki, Autoliv, BorgWarner, Continental AG, Denso, Federal-Mogul, Harman, Johnson Controls, Lear, Magna, Sumitomo, Tenneco, Valeo, Visteon Significant return to shareholders
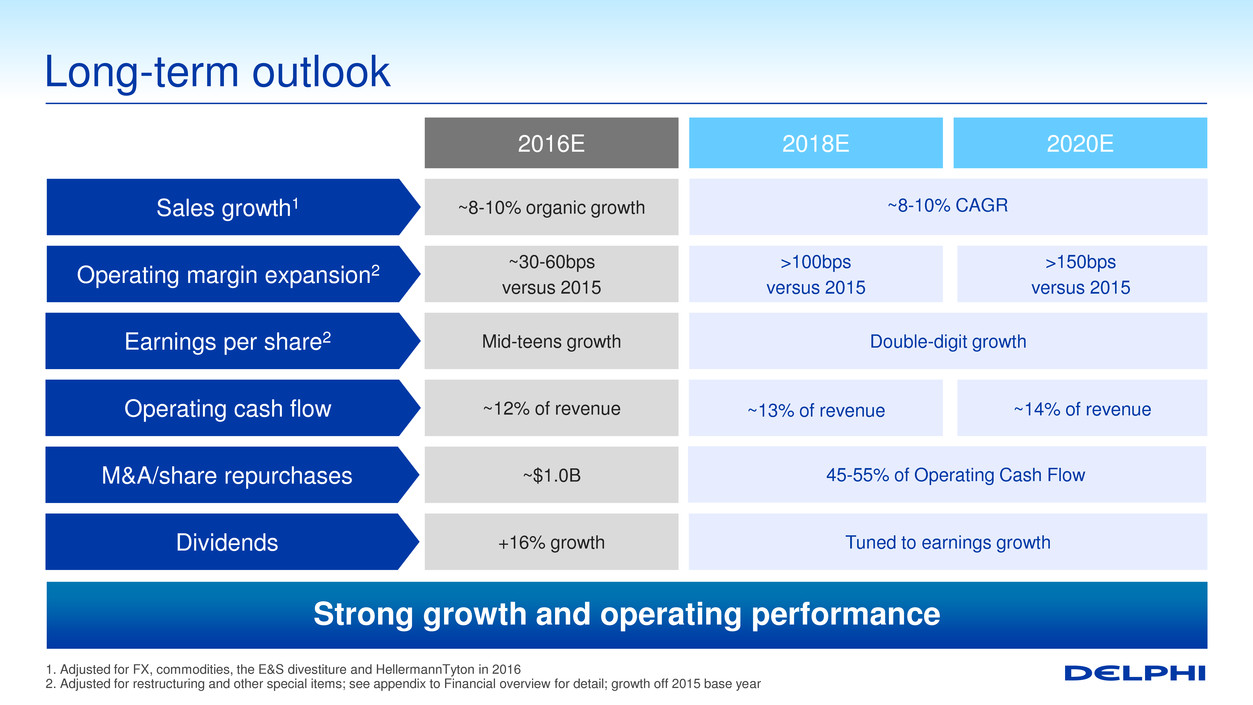
Long-term outlook 1. Adjusted for FX, commodities, the E&S divestiture and HellermannTyton in 2016 2. Adjusted for restructuring and other special items; see appendix to Financial overview for detail; growth off 2015 base year ~8-10% organic growth Sales growth1 Operating margin expansion2 Earnings per share2 Operating cash flow Dividends M&A/share repurchases ~30-60bps versus 2015 ~12% of revenue ~$1.0B +16% growth Mid-teens growth ~8-10% CAGR >100bps versus 2015 Tuned to earnings growth Double-digit growth >150bps versus 2015 2016E 2018E 2020E ~13% of revenue ~14% of revenue 45-55% of Operating Cash Flow Strong growth and operating performance
Why Delphi will outperform Track record of delivering on commitments Macro trends are a catalyst for growth Disciplined cost focus translates into more margin expansion Effective and accretive cash deployment Well positioned in a transformed and growing industry Consistent strategy; delivering outperformance; attractive returns

Financial overview Joe Massaro Chief Financial Officer and Senior Vice President
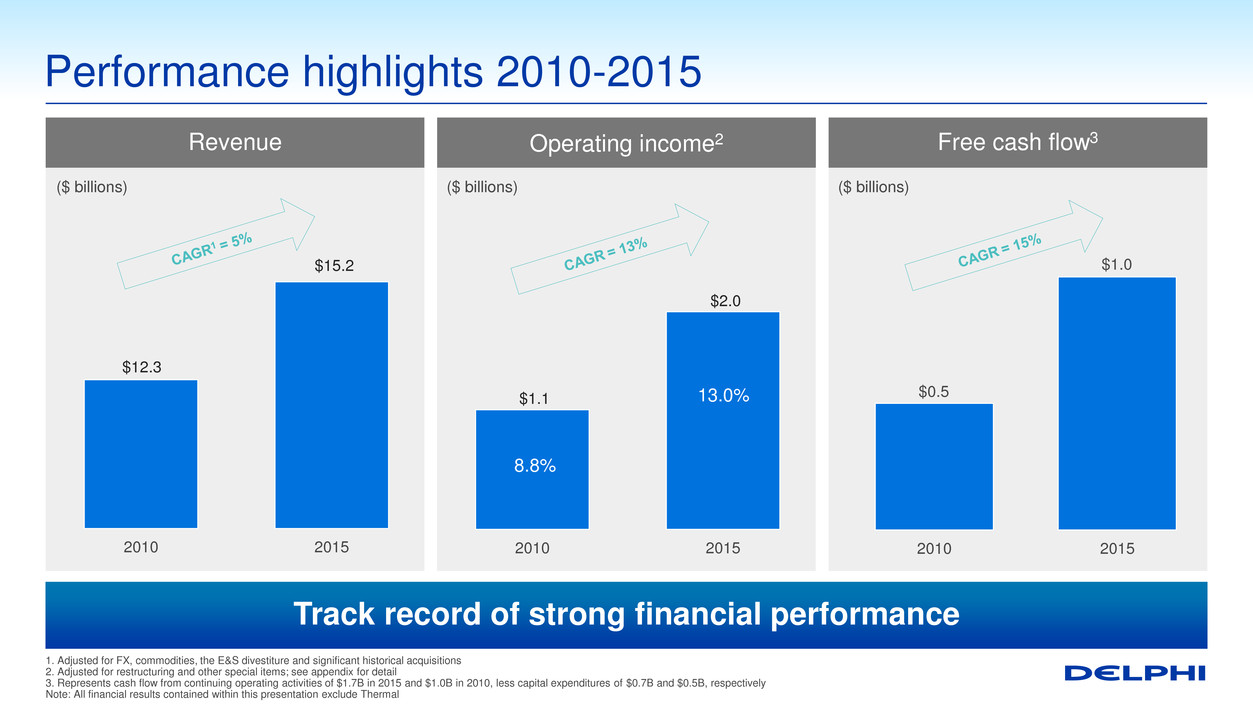
Performance highlights 2010-2015 1. Adjusted for FX, commodities, the E&S divestiture and significant historical acquisitions 2. Adjusted for restructuring and other special items; see appendix for detail 3. Represents cash flow from continuing operating activities of $1.7B in 2015 and $1.0B in 2010, less capital expenditures of $0.7B and $0.5B, respectively Note: All financial results contained within this presentation exclude Thermal Track record of strong financial performance $12.3 $15.2 2010 2015 $1.1 $2.0 2010 2015 8.8% 13.0% 2010 2015 Operating income2 Free cash flow3 Revenue $0.5 $1.0 ($ billions) ($ billions) ($ billions)
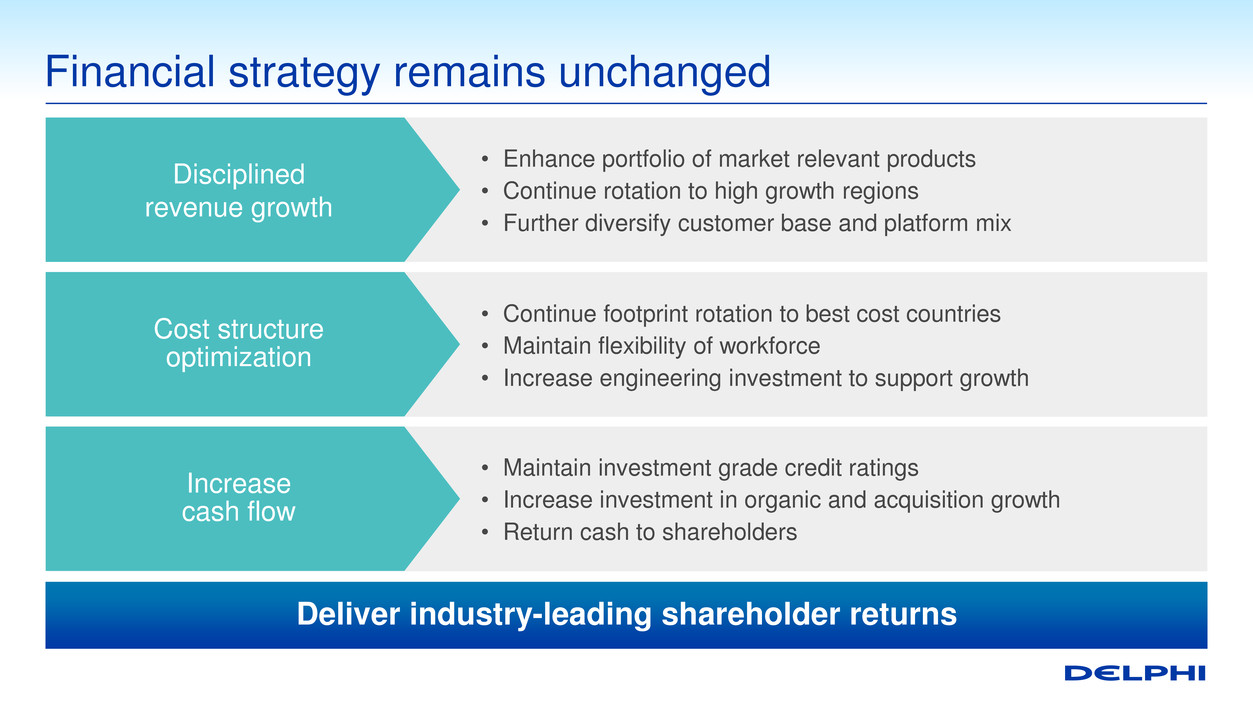
Financial strategy remains unchanged Disciplined revenue growth Cost structure optimization Increase cash flow • Enhance portfolio of market relevant products • Continue rotation to high growth regions • Further diversify customer base and platform mix • Continue footprint rotation to best cost countries • Maintain flexibility of workforce • Increase engineering investment to support growth • Maintain investment grade credit ratings • Increase investment in organic and acquisition growth • Return cash to shareholders Deliver industry-leading shareholder returns
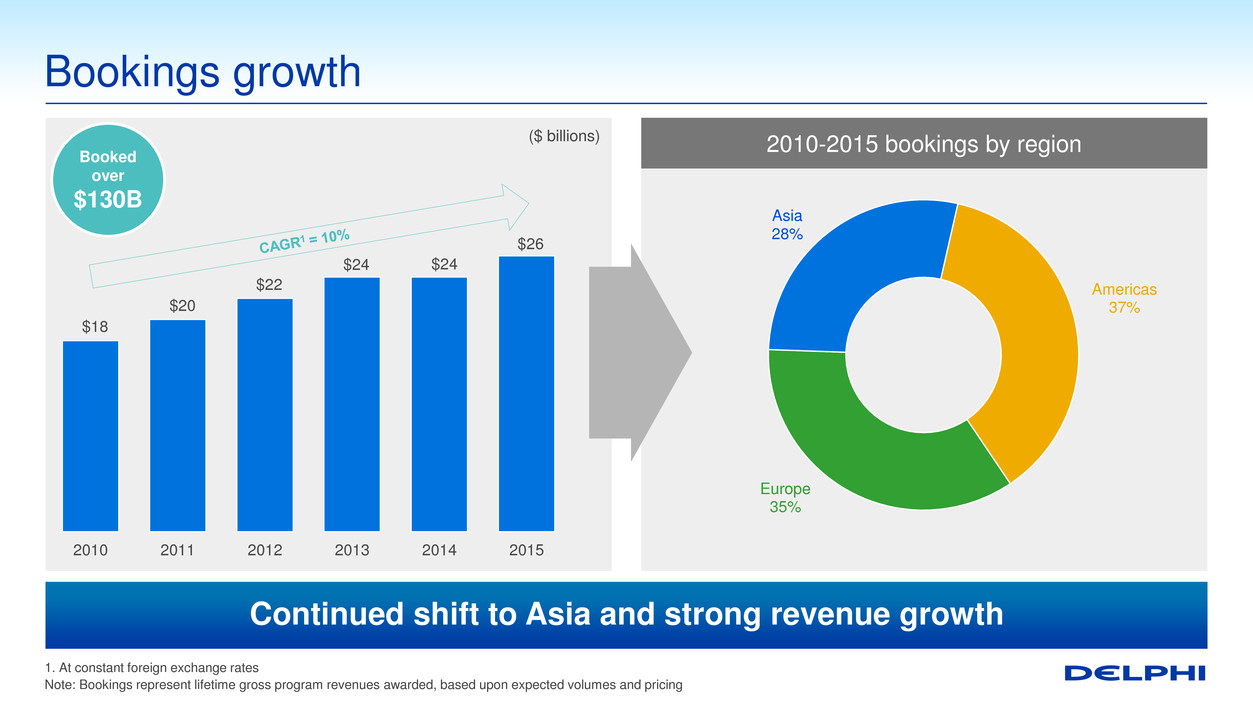
2010-2015 bookings by region Bookings growth 1. At constant foreign exchange rates Note: Bookings represent lifetime gross program revenues awarded, based upon expected volumes and pricing ($ billions) $26 $20 $22 $24 $24 $18 2010 2011 2012 2013 2014 2015 Europe 35% Asia 28% Americas 37% Booked over $130B Continued shift to Asia and strong revenue growth
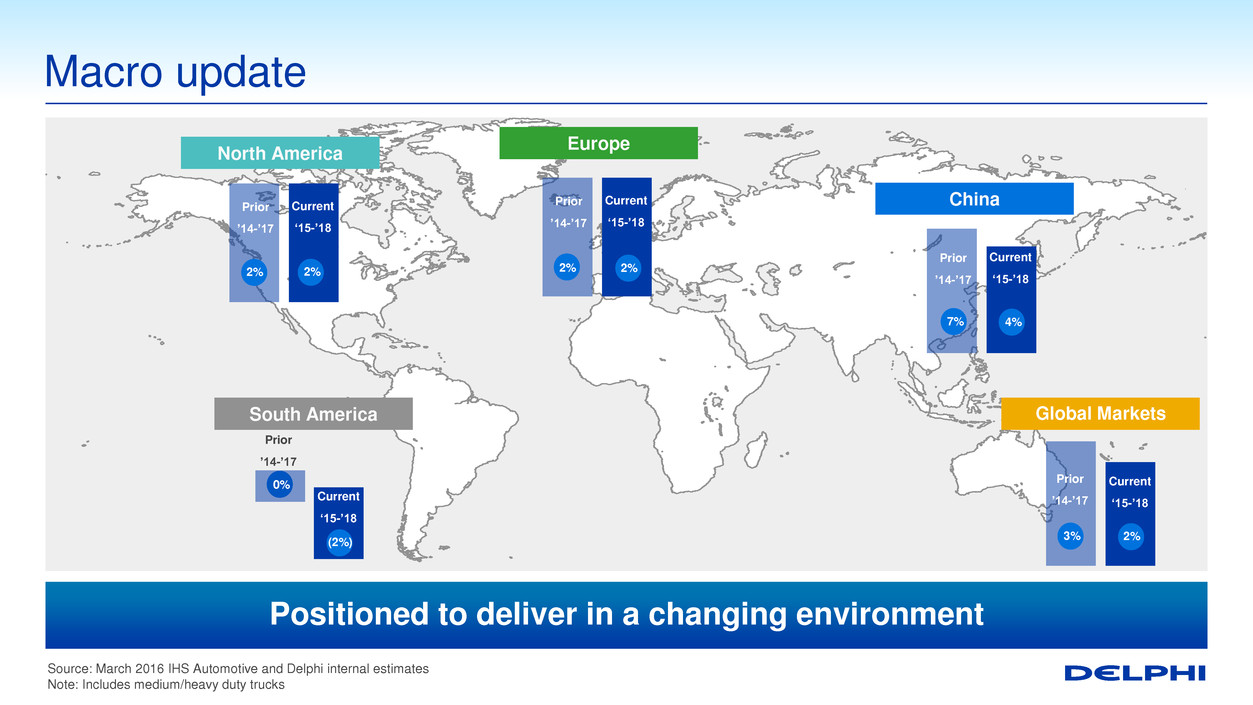
Europe China South America Source: March 2016 IHS Automotive and Delphi internal estimates Note: Includes medium/heavy duty trucks Macro update North America Global Markets 93.6 mil units Prior ’14-’17 Current ‘15-’18 2% 2% Prior ’14-’17 Current ‘15-’18 4% 7% Prior ’14-’17 Current ‘15-’18 3% 2% Prior ’14-’17 Current ‘15-’18 2% 2% (2%) Current ‘15-’18 Prior ’14-’17 0% Positioned to deliver in a changing environment
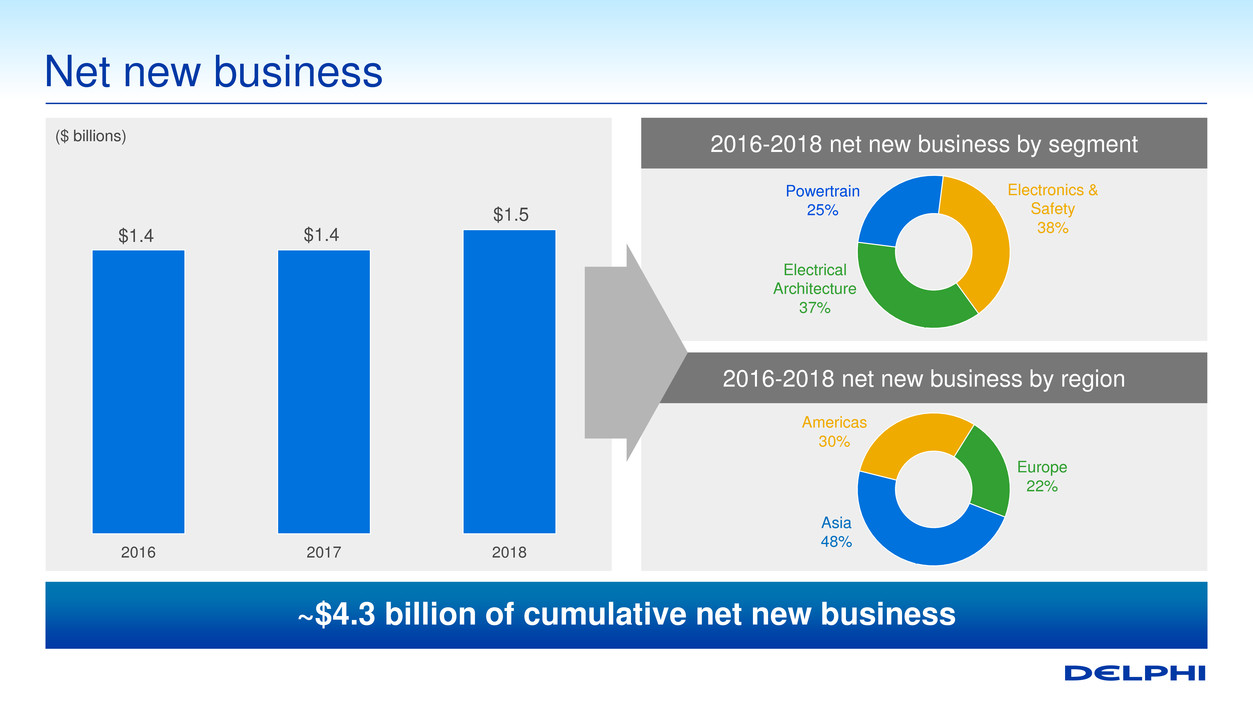
2016-2018 net new business by region 2016-2018 net new business by segment Net new business ($ billions) Electronics & Safety 38% Electrical Architecture 37% Powertrain 25% Asia 48% Americas 30% Europe 22% $1.4 $1.4 $1.5 2016 2017 2018 ~$4.3 billion of cumulative net new business
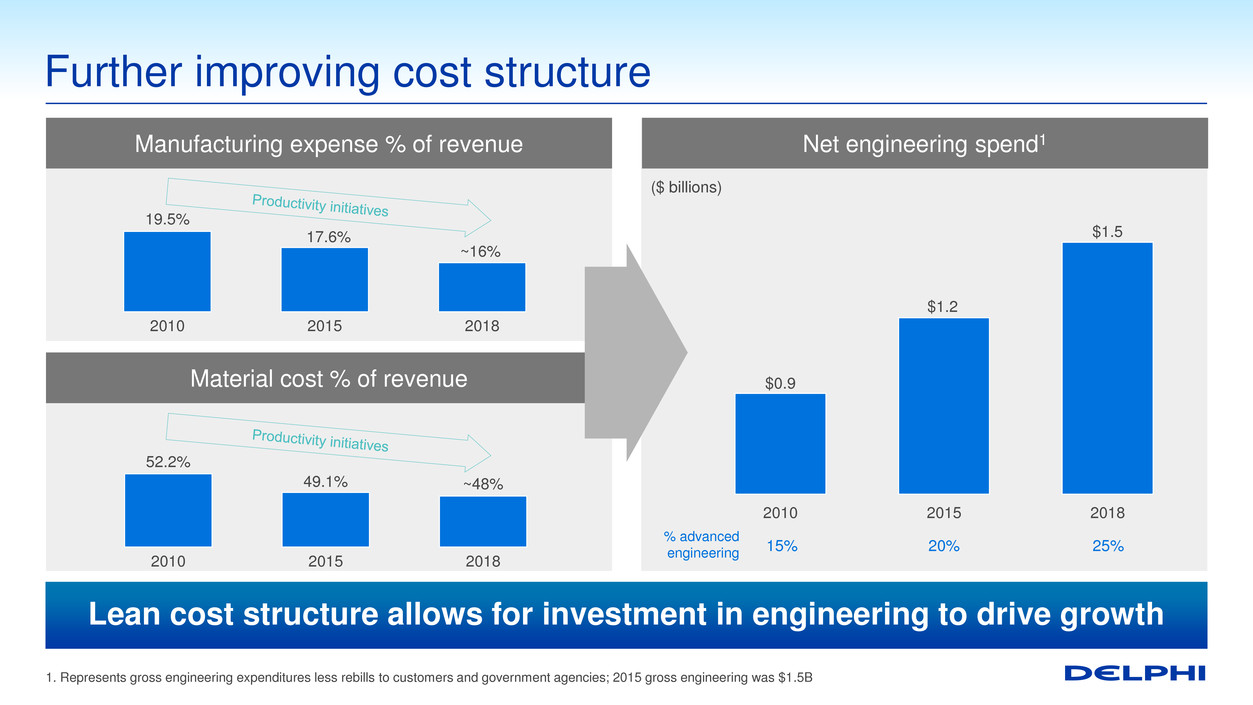
$0.9 $1.2 $1.5 2010 2015 2018 Net engineering spend1 Further improving cost structure ($ billions) 1. Represents gross engineering expenditures less rebills to customers and government agencies; 2015 gross engineering was $1.5B Material cost % of revenue Manufacturing expense % of revenue 19.5% 17.6% ~16% 2010 2015 2018 52.2% 49.1% ~48% 2010 2015 2018 % advanced engineering 15% 20% 25% Lean cost structure allows for investment in engineering to drive growth
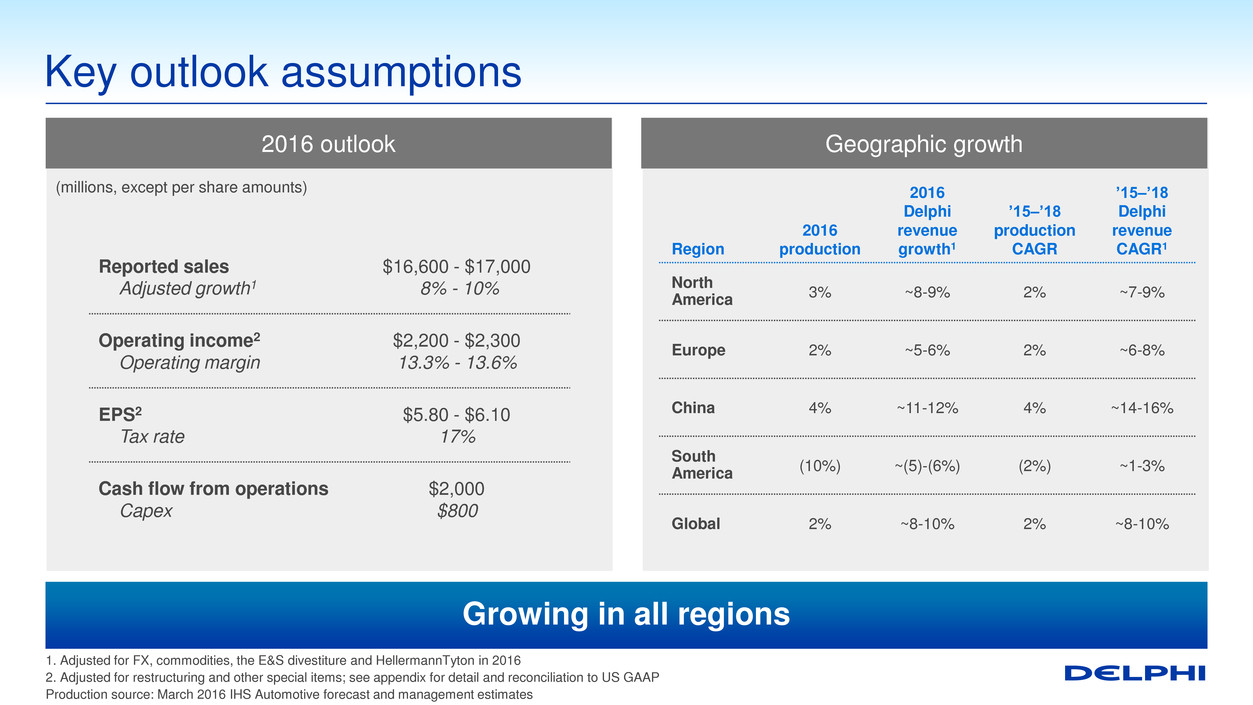
2016 outlook Key outlook assumptions 1. Adjusted for FX, commodities, the E&S divestiture and HellermannTyton in 2016 2. Adjusted for restructuring and other special items; see appendix for detail and reconciliation to US GAAP Production source: March 2016 IHS Automotive forecast and management estimates Reported sales Adjusted growth1 $16,600 - $17,000 8% - 10% Operating income2 Operating margin $2,200 - $2,300 13.3% - 13.6% EPS2 Tax rate $5.80 - $6.10 17% Cash flow from operations Capex $2,000 $800 (millions, except per share amounts) Geographic growth Region 2016 production 2016 Delphi revenue growth1 ’15–’18 production CAGR ’15–’18 Delphi revenue CAGR1 North America 3% ~8-9% 2% ~7-9% Europe 2% ~5-6% 2% ~6-8% China 4% ~11-12% 4% ~14-16% South America (10%) ~(5)-(6%) (2%) ~1-3% Global 2% ~8-10% 2% ~8-10% Growing in all regions

Operating margin2 Revenue Revenue and margin outlook 1. Adjusted for FX, commodities, the E&S divestiture and HellermannTyton in 2016; growth off 2015 base year; revenue rounded to nearest half billion 2. Adjusted for restructuring and other special items; see appendix for detail and reconciliation to US GAAP Revenue CAGR1 8-10% 8-10% 8-10% EBITDA margin2 17.5% >18% >18.5% Operating margin2 13.5% >14% >14.5% $16.8 ~$20.0 ~$22.5 2016 2018 2020 13.5% 2016 2020 >14.5% Performance including restructuring Price / economics Leverage volume growth Growth investment/ engineering Portfolio modifications ($ billions) Strong growth and operating leverage drive margin expansion
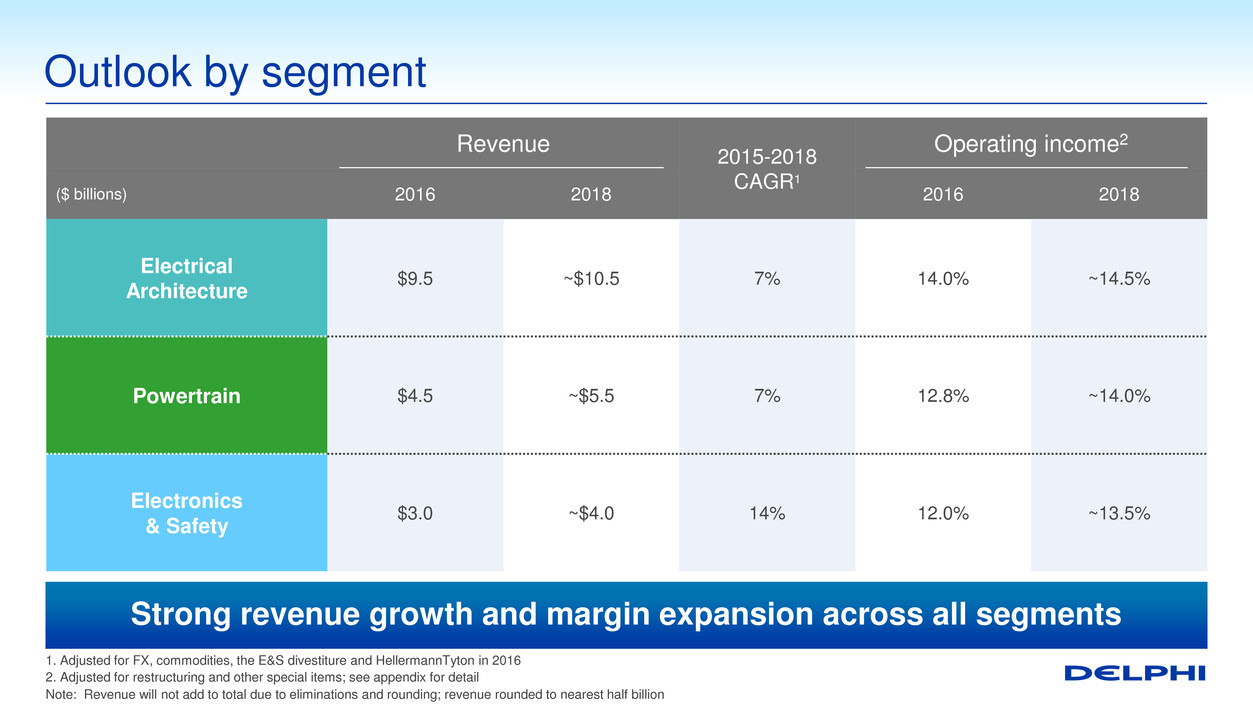
Revenue 2015-2018 CAGR1 Operating income2 ($ billions) 2016 2018 2016 2018 Electrical Architecture $9.5 ~$10.5 7% 14.0% ~14.5% Powertrain $4.5 ~$5.5 7% 12.8% ~14.0% Electronics & Safety $3.0 ~$4.0 14% 12.0% ~13.5% Outlook by segment 1. Adjusted for FX, commodities, the E&S divestiture and HellermannTyton in 2016 2. Adjusted for restructuring and other special items; see appendix for detail Note: Revenue will not add to total due to eliminations and rounding; revenue rounded to nearest half billion Strong revenue growth and margin expansion across all segments
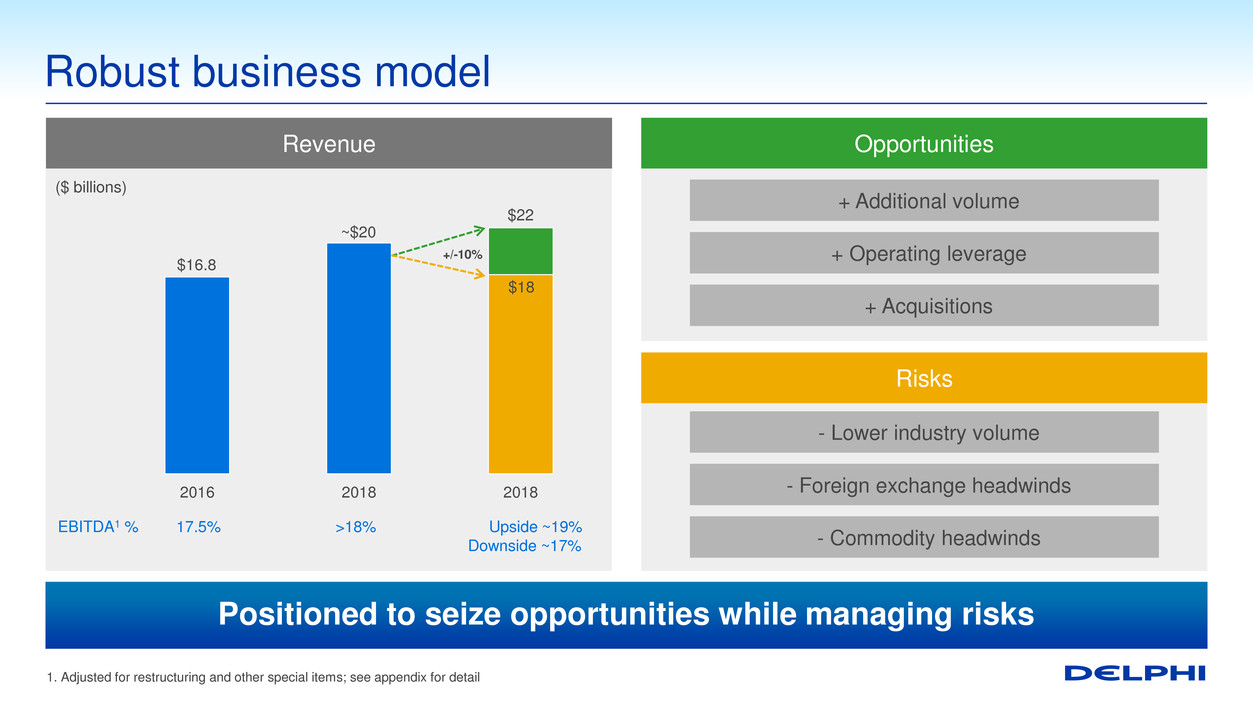
Risks Opportunities Robust business model 1. Adjusted for restructuring and other special items; see appendix for detail $16.8 ~$20 $18 $22 2016 2018 2018 EBITDA1 % 17.5% >18% Upside ~19% Downside ~17% +/-10% + Additional volume + Operating leverage + Acquisitions - Lower industry volume - Foreign exchange headwinds - Commodity headwinds Revenue ($ billions) Positioned to seize opportunities while managing risks
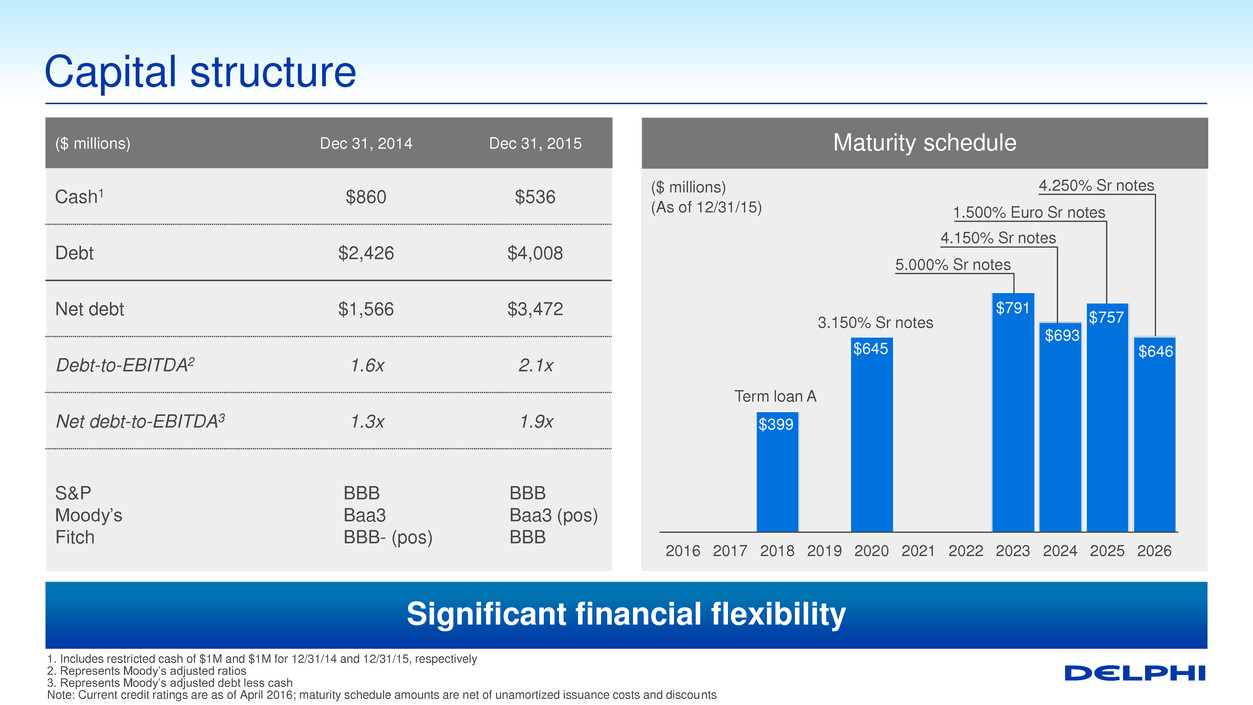
2016 2017 2018 2019 2020 2021 2022 2023 2024 2025 2026 Maturity schedule ($ millions) Dec 31, 2014 Dec 31, 2015 Cash1 $860 $536 Debt $2,426 $4,008 Net debt $1,566 $3,472 Debt-to-EBITDA2 1.6x 2.1x Net debt-to-EBITDA3 1.3x 1.9x S&P Moody’s Fitch BBB Baa3 BBB- (pos) BBB Baa3 (pos) BBB Capital structure 1. Includes restricted cash of $1M and $1M for 12/31/14 and 12/31/15, respectively 2. Represents Moody’s adjusted ratios 3. Represents Moody’s adjusted debt less cash Note: Current credit ratings are as of April 2016; maturity schedule amounts are net of unamortized issuance costs and discounts $399 Term loan A 5.000% Sr notes 4.150% Sr notes $757 $693 1.500% Euro Sr notes $646 3.150% Sr notes 4.250% Sr notes $645 $791 ($ millions) (As of 12/31/15) Significant financial flexibility
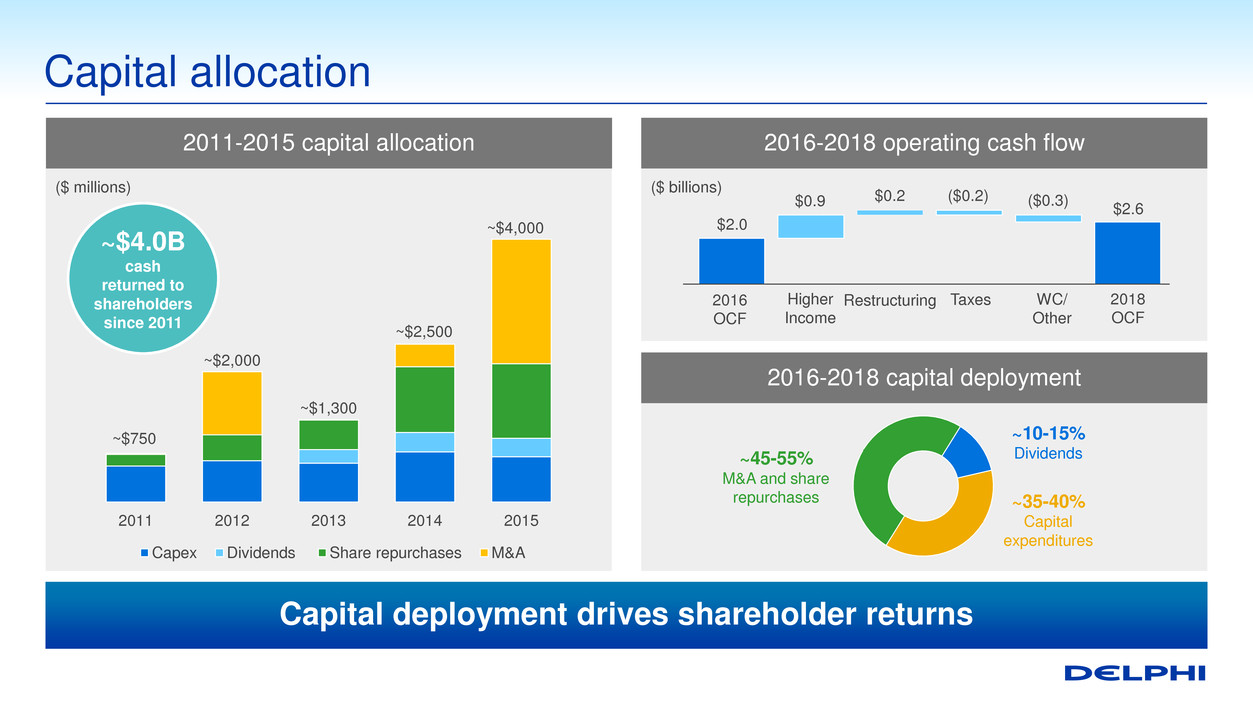
2016-2018 capital deployment 2016-2018 operating cash flow Capital allocation ~$750 ~$2,000 ~$2,500 ~$1,300 2011 2012 2013 2014 2015 Capex Dividends Share repurchases M&A ~45-55% M&A and share repurchases ~35-40% Capital expenditures ~10-15% Dividends ~$4.0B cash returned to shareholders since 2011 ~$4,000 $2.0 2016 OCF Higher Income Taxes WC/ Other 2018 OCF $0.9 ($0.2) ($0.3) $2.6 $0.2 Restructuring 2011-2015 capital allocation ($ billions) ($ millions) Capital deployment drives shareholder returns
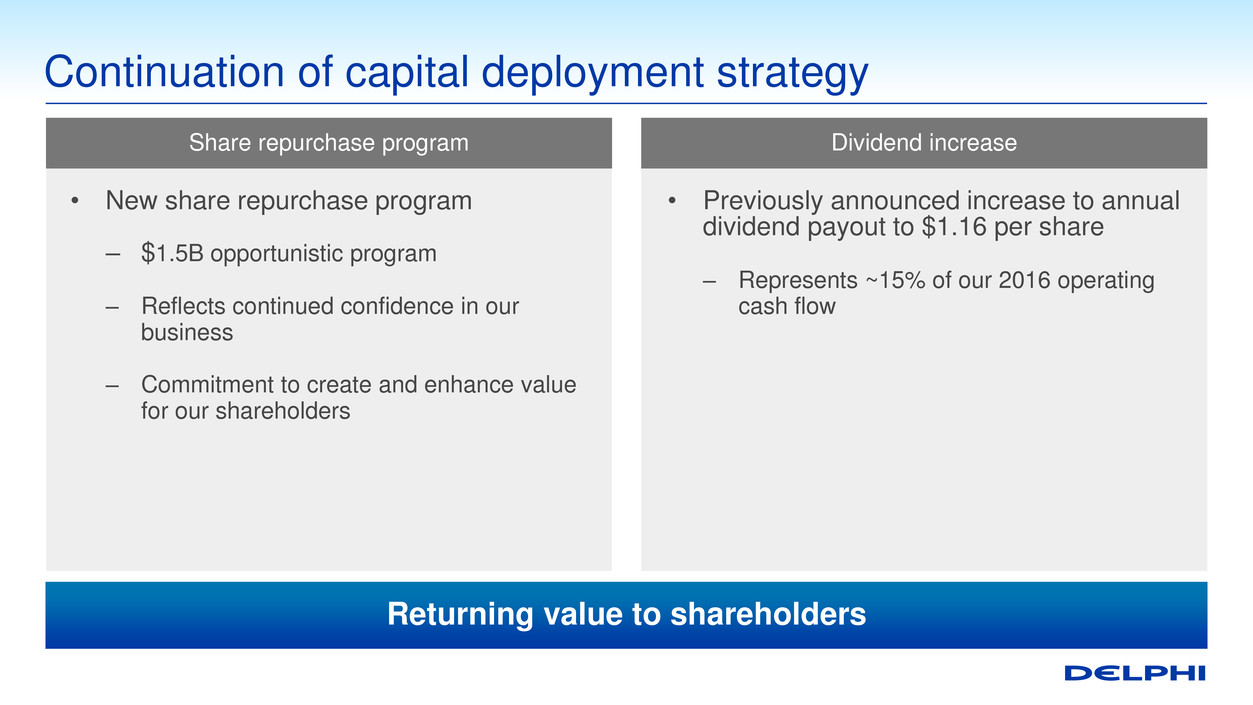
Continuation of capital deployment strategy • New share repurchase program – $1.5B opportunistic program – Reflects continued confidence in our business – Commitment to create and enhance value for our shareholders • Previously announced increase to annual dividend payout to $1.16 per share – Represents ~15% of our 2016 operating cash flow Dividend increase Share repurchase program Returning value to shareholders

2016 spending profile 2016 major programs Capital spend Capital spending 2014 2015 2016 • Gas Direct injection programs • Euro 6 diesel programs • Restructuring and integration capital • IT investments and facility expansions Growth 50% 5.0% 4.6% 4.8% % of Revenue Efficiencies 10% Footprint/ restructuring 10% Maintenance 30% ($ billions) Lean cost structure enables growth investment $0.8 $0.7 $0.8

Acquisition/ divestiture date 2015-2018 revenue CAGR 2015-2018 EBITDA Margins Synergy achievement Explanation Q4 2012 ~5% ~30% 1.5x EBITDA margins over plan Synergies in excess of plan Q4 2014 ~30% ~20% 1.5x Bookings ahead of plan Revenue growth well over plan Synergies in excess of plan Q4 2014 ~20% ~40% 1.0x Bookings ahead of plan Synergies in line with plan Q2 2015 ~10% ~10% N/A Non-core divestiture to focus on higher margin segments Q3 2015 ~(25%) ~5% N/A Divestiture refocuses E&S portfolio Q4 2015 ~40% ~45% N/A2 Penetrating new customers and expanding into new lines of business Q4 2015 ~10% ~20% 1.0x Bookings ahead of plan Revenue growth over plan Portfolio realignment track record Note: MVL includes Connection Systems product line results 1. Thermal and Reception Systems represent projection estimates prior to divestiture 2. Cost synergies not included in investment thesis; revenue synergies not quantified at time of transaction Thermal1 Reception Systems1 MVL Delivering incremental value through seamless execution
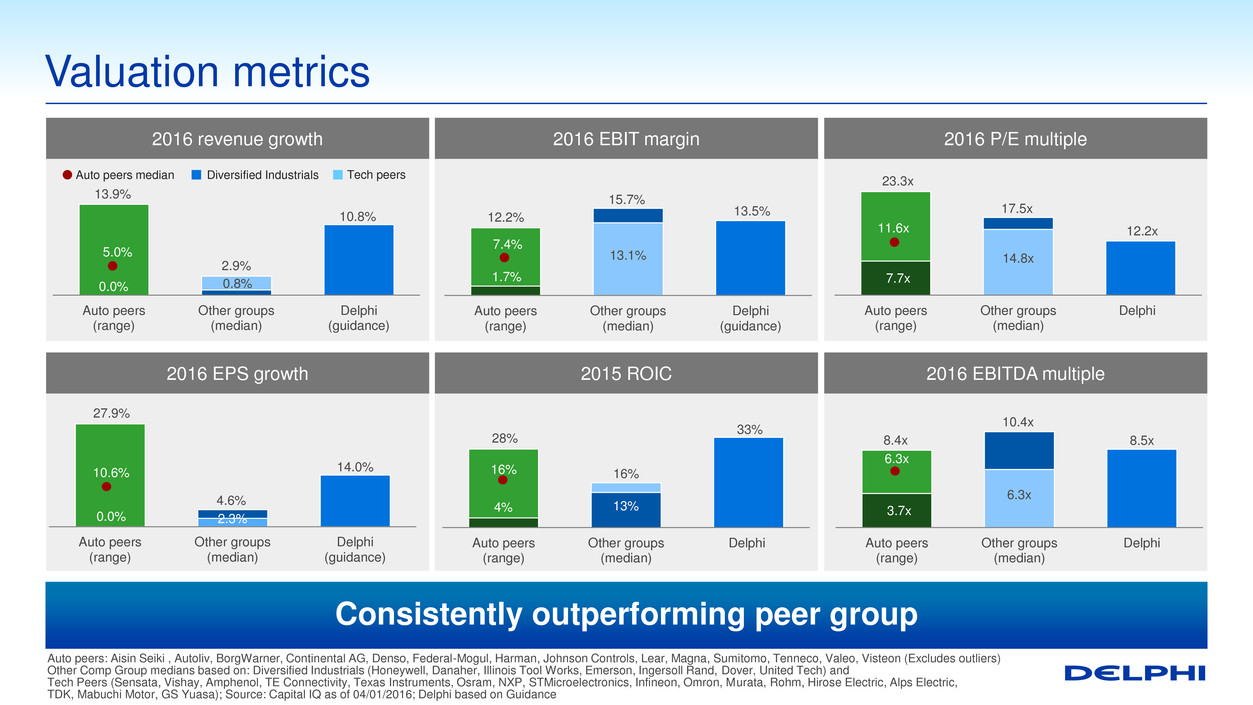
0.0% 0.8% 10.8% 13.9% 2.9% Auto peers (range) Other groups (median) Delphi (guidance) Valuation metrics Auto peers: Aisin Seiki , Autoliv, BorgWarner, Continental AG, Denso, Federal-Mogul, Harman, Johnson Controls, Lear, Magna, Sumitomo, Tenneco, Valeo, Visteon (Excludes outliers) Other Comp Group medians based on: Diversified Industrials (Honeywell, Danaher, Illinois Tool Works, Emerson, Ingersoll Rand, Dover, United Tech) and Tech Peers (Sensata, Vishay, Amphenol, TE Connectivity, Texas Instruments, Osram, NXP, STMicroelectronics, Infineon, Omron, Murata, Rohm, Hirose Electric, Alps Electric, TDK, Mabuchi Motor, GS Yuasa); Source: Capital IQ as of 04/01/2016; Delphi based on Guidance 2016 EBITDA multiple 2016 P/E multiple 2015 ROIC 2016 EBIT margin 2016 EPS growth 2016 revenue growth Diversified Industrials Tech peers Auto peers median 5.0% 1.7% 13.1% 13.5% 12.2% 15.7% Auto peers (range) Other groups (median) Delphi (guidance) 7.4% 7.7x 14.8x 12.2x 23.3x 17.5x Auto peers (range) Other groups (median) Delphi 11.6x 0.0% 2.3% 14.0% 27.9% 4.6% Auto peers (range) Other groups (median) Delphi (guidance) 10.6% 4% 13% 28% 16% 33% Auto peers (range) Other groups (median) Delphi 16% 3.7x 6.3x 8.5x 8.4x 10.4x Auto peers (range) Other groups (median) Delphi 6.3x Consistently outperforming peer group
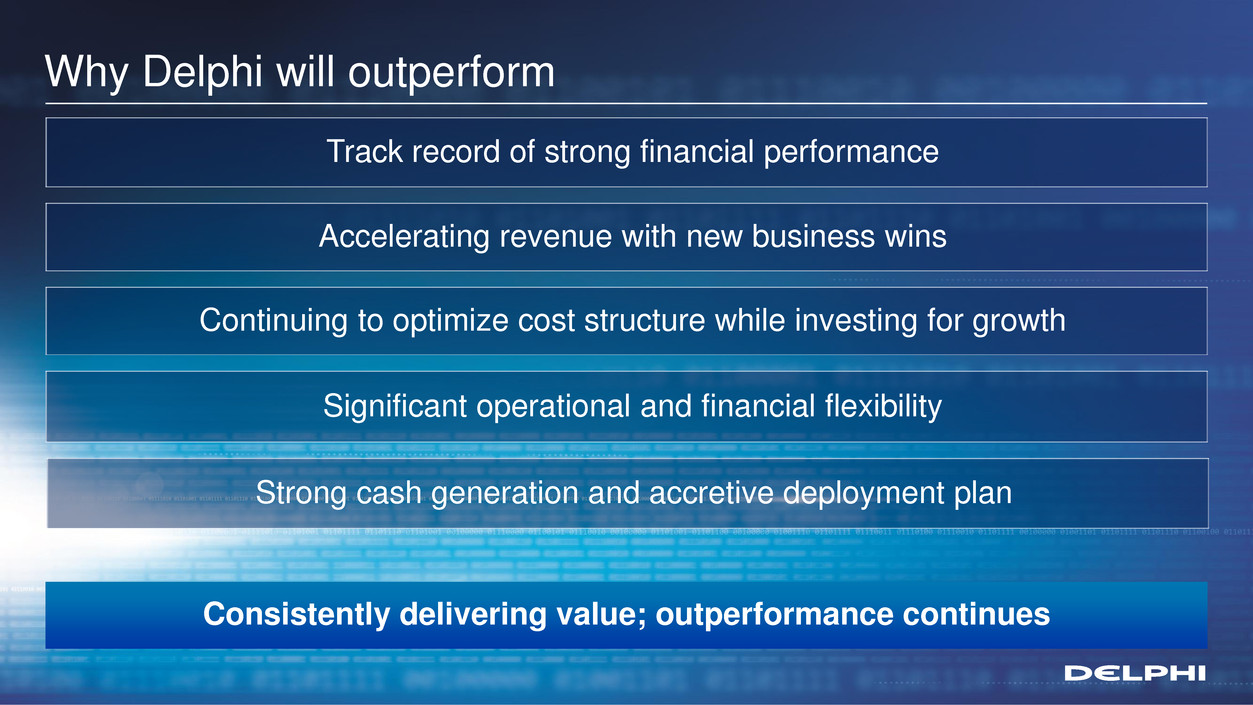
Why Delphi will outperform Track record of strong financial performance Accelerating revenue with new business wins Continuing to optimize cost structure while investing for growth Significant operational and financial flexibility Strong cash generation and accretive deployment plan Consistently delivering value; outperformance continues
Appendix
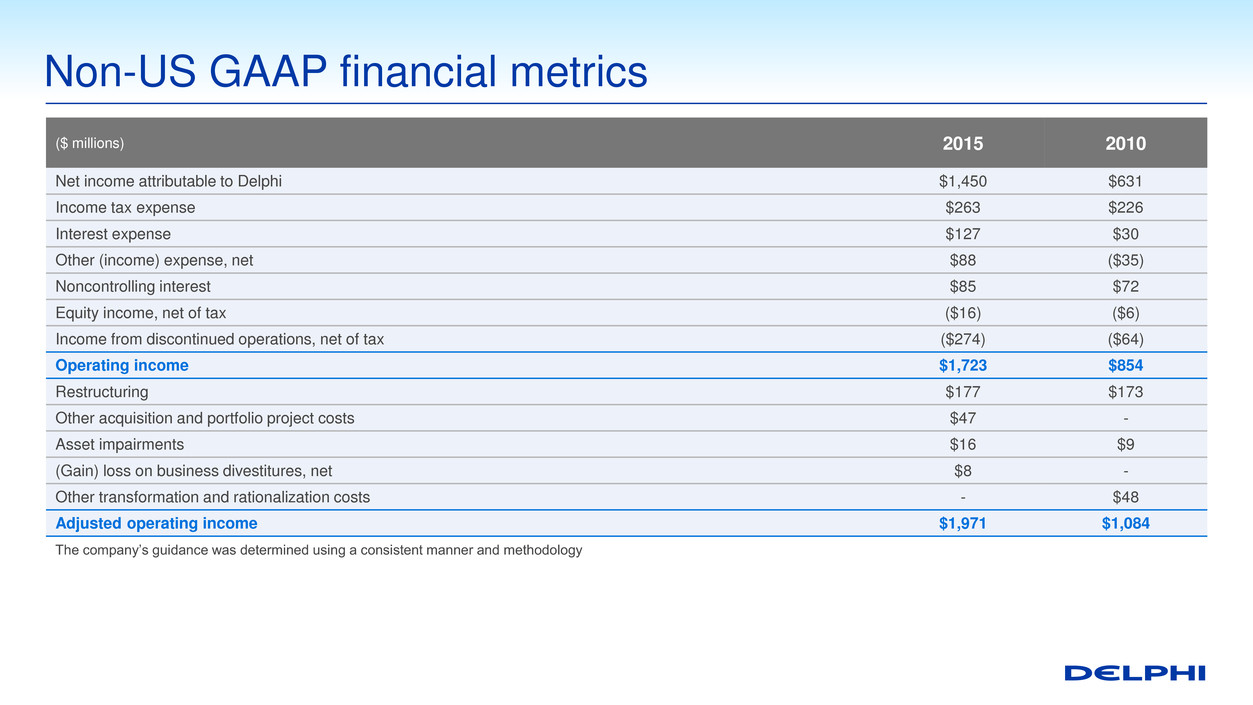
($ millions) 2015 2010 Net income attributable to Delphi $1,450 $631 Income tax expense $263 $226 Interest expense $127 $30 Other (income) expense, net $88 ($35) Noncontrolling interest $85 $72 Equity income, net of tax ($16) ($6) Income from discontinued operations, net of tax ($274) ($64) Operating income $1,723 $854 Restructuring $177 $173 Other acquisition and portfolio project costs $47 - Asset impairments $16 $9 (Gain) loss on business divestitures, net $8 - Other transformation and rationalization costs - $48 Adjusted operating income $1,971 $1,084 The company’s guidance was determined using a consistent manner and methodology Non-US GAAP financial metrics
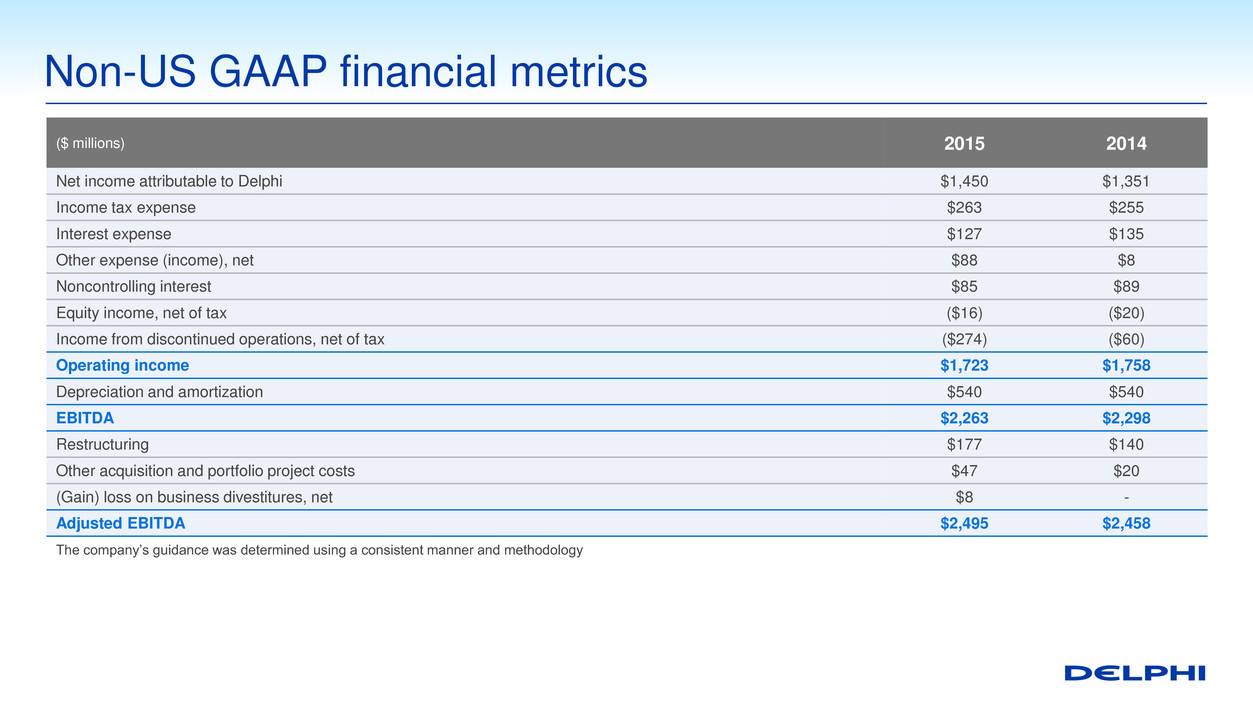
($ millions) 2015 2014 Net income attributable to Delphi $1,450 $1,351 Income tax expense $263 $255 Interest expense $127 $135 Other expense (income), net $88 $8 Noncontrolling interest $85 $89 Equity income, net of tax ($16) ($20) Income from discontinued operations, net of tax ($274) ($60) Operating income $1,723 $1,758 Depreciation and amortization $540 $540 EBITDA $2,263 $2,298 Restructuring $177 $140 Other acquisition and portfolio project costs $47 $20 (Gain) loss on business divestitures, net $8 - Adjusted EBITDA $2,495 $2,458 The company’s guidance was determined using a consistent manner and methodology Non-US GAAP financial metrics
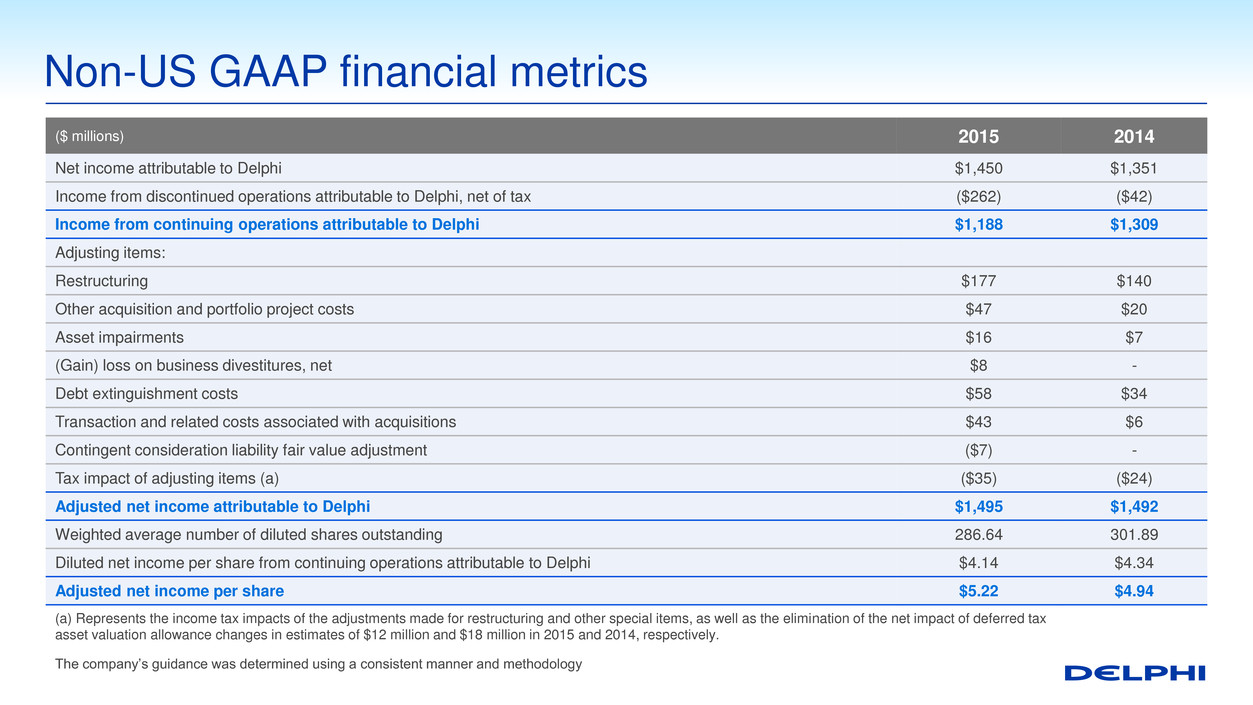
($ millions) 2015 2014 Net income attributable to Delphi $1,450 $1,351 Income from discontinued operations attributable to Delphi, net of tax ($262) ($42) Income from continuing operations attributable to Delphi $1,188 $1,309 Adjusting items: Restructuring $177 $140 Other acquisition and portfolio project costs $47 $20 Asset impairments $16 $7 (Gain) loss on business divestitures, net $8 - Debt extinguishment costs $58 $34 Transaction and related costs associated with acquisitions $43 $6 Contingent consideration liability fair value adjustment ($7) - Tax impact of adjusting items (a) ($35) ($24) Adjusted net income attributable to Delphi $1,495 $1,492 Weighted average number of diluted shares outstanding 286.64 301.89 Diluted net income per share from continuing operations attributable to Delphi $4.14 $4.34 Adjusted net income per share $5.22 $4.94 (a) Represents the income tax impacts of the adjustments made for restructuring and other special items, as well as the elimination of the net impact of deferred tax asset valuation allowance changes in estimates of $12 million and $18 million in 2015 and 2014, respectively. The company’s guidance was determined using a consistent manner and methodology Non-US GAAP financial metrics


