UNITED STATES
SECURITIES AND EXCHANGE COMMISSION
Washington, D.C. 20549
FORM N-CSR
CERTIFIED SHAREHOLDER REPORT OF REGISTERED MANAGEMENT INVESTMENT COMPANIES
Investment Company Act file number 811-22562
Babson Capital Global Short Duration High Yield Fund
(Exact name of registrant as specified in charter)
550 South Tryon Street, Charlotte, NC 28202
(Address of principal executive offices) (Zip code)
Janice M. Bishop
Secretary and Chief Legal Officer
c/o Babson Capital Management LLC
Independence Wharf
470 Atlantic Avenue
Boston, MA 02210
(Name and address of agent for service)
704-805-7200
Registrant's telephone number, including area code
Date of fiscal year end: December 31
Date of reporting period: December 31, 2012
Item 1. Reports to Stockholders.
| | | |
| | | |
| | | |
| | Babson Capital Global Short Duration High Yield Fund | |
| | c / o Babson Capital Management LLC | |
| | 550 South Tryon St. | |
| | Charlotte, NC 28202 | |
| | 704.805.7200 | |
| | http://www.BabsonCapital.com/bgh | |
| | | |
| | ADVISER | |
| | Babson Capital Management LLC | |
| | 550 South Tryon St. | |
| | Suite 3300 | |
| | Charlotte, NC 28202 | |
| | | |
| | SUB-ADVISOR | |
| | Babson Capital Global Advisors Limited | |
| | 61 Aldwych | |
| | London, UK | |
| | WC2B 4AE | |
| | | |
| | COUNSEL TO THE FUND | |
| | Ropes & Gray LLP | |
| | Prudential Tower | |
| | 800 Boylston Street | |
| | Boston, Massachusetts 02110 | |
| | | |
| | INDEPENDENT REGISTERED PUBLIC ACCOUNTING FIRM | |
| | KPMG LLP | |
| | Two Financial Center | |
| | 60 South Street | |
| | Boston, Massachusetts 02111 | |
| | | |
| | CUSTODIAN | |
| | US Bank | |
| | MK-WI-S302 | |
| | 1555 N. River Center Drive | |
| | Milwaukee, WI 53212 | |
| | | |
| | TRANSFER AGENT & REGISTRAR | |
| | U.S. Bancorp Fund Services, LLC | |
| | 615 E. Michigan St. | |
| | Milwaukee, WI 53202 | |
| | | |
| | FUND ADMINISTRATION/ACCOUNTING | |
| | U.S. Bancorp Fund Services, LLC | |
| | 615 E. Michigan St. | |
| | Milwaukee, WI 53202 | |
| | | |
| | | |
| | | |
| | PROXY VOTING POLICIES & PROCEDURES | |
| | The Trustees of Babson Capital Global Short Duration High Yield Fund (the “Fund”) have delegated proxy voting responsibilities relating to the voting of securities held by the Fund to Babson Capital Management LLC (“Babson Capital”). A description of Babson Capital���s proxy voting policies and procedures is available (1) without charge, upon request, by calling, toll-free 1-866-399-1516; (2) on the Fund’s website at http://www.BabsonCapital.com/bgh; and (3) on the U.S. Securities and Exchange Commission’s (“SEC”) website at http://www.sec.gov. | |
| | | |
| | FORM N-Q | |
| | The Fund will file its complete schedule of portfolio holdings with the SEC for the first and third quarters of each fiscal year on Form N-Q. This information is available (i) on the SEC’s website at http://www.sec.gov; and (ii) at the SEC’s Public Reference Room in Washington, DC (which information on their operation may be obtained by calling 1-800-SEC-0330). A complete schedule of portfolio holdings as of each quarter-end is available on the Trust’s website at http://www.BabsonCapital.com/bgh or upon request by calling, toll-free, 1-866-399-1516. | |
OFFICERS OF THE FUND
Russell Morrison
President and Principal Executive Officer
Patrick Hoefling
Chief Financial Officer and Principal Financial
and Accounting Officer
Andrew Lennon
Treasurer
Michael Freno
Vice President
Sean Feeley
Vice President
Scott Roth
Vice President
Melissa LaGrant
Chief Compliance Officer
Janice Bishop
Secretary/Chief Legal Officer
Michele Manha
Assistant Secretary
BABSON CAPITAL GLOBAL SHORT DURATION HIGH YIELD FUND
Babson Capital Global Short Duration High Yield Fund is a closed-end investment company, first offered to the public in 2012, whose shares are traded on the New York Stock Exchange.
INVESTMENT OBJECTIVE & POLICY
Babson Capital Global Short Duration High Yield Fund (the “Fund”) was organized as a business trust under the laws of the Commonwealth of Massachusetts on May 20, 2011, and commenced operations on October 26, 2012. The Fund is registered under the Investment Company Act of 1940, as amended, as a non-diversified, closed-end management investment company with its own investment objective. The Fund’s common shares are listed on the New York Stock Exchange under the symbol “BGH”.
The Fund’s primary investment objective is to seek as high a level of current income as the Adviser (as defined herein) determines is consistent with capital preservation. The Fund seeks capital appreciation as a secondary investment objective when consistent with its primary investment objective. There can be no assurance that the Fund will achieve its investment objectives.
The Fund will seek to take advantage of inefficiencies between geographies, primarily the North American and Western European high yield bond and loan markets and within capital structures between bonds and loans. For example, the Fund will seek to take advantage of differences in pricing between bonds and loans of an issuer denominated in U.S. dollars and substantially similar bonds and loans of the same issuer denominated in Euros, potentially allowing the Fund to achieve a higher relative return for the same credit risk exposure.
Babson Capital Global Short Duration High Yield Fund 2012 Annual Report
DEAR FELLOW SHAREHOLDERS,
We are excited to provide you with the Annual Report for the Fund, Babson Capital Management LLC’s most recent closed-end fund offering. It has been over two decades since our last offering in the closed-end fund market and this most recent Fund provides retail investors direct access to the Global High Yield Investments Group within Babson Capital. We believe we have one of the largest global high yield investment teams in the market with the capability to offer investors unique and timely investment products. As our investment experience in the global high yield markets spans multiple credit cycles, we believed that 2012 was an opportune time to offer an attractive portfolio of global high yield assets to fulfill investors’ search for yield in the current low interest rate environment. We believe the global high yield asset class provides investors an adequate risk-reward premium, especially when focusing on the short duration spectrum of the market. This strategy allows investors to take advantage of expected low default rates while reducing interest rate risk.
The global nature of the portfolio, primarily focusing on North American and Western European credits, provides investors with additional benefits compared to a U.S. only portfolio such as higher quality, increased yield, and lower duration credits. We emphasize higher-rated, high yield assets coupled with a limit of 10% on CCC-rated credits. By leveraging over 70 investment professionals in the U.S. and U.K., we are able to primarily focus on North American and Western European credits with a fundamental bottom-up research approach and provide investors with what we believe to be our best relative value opportunities across jurisdictions, industries, credit quality and within corporate capital structures. We believe this approach and our seasoned team of investment professionals can potentially provide investors with attractive dividend yields for years to come.
Market Review
2012 proved to be a challenging market environment for investors. With investors searching for yield in the current low interest rate environment, appetite for the global high yield market increased, which ultimately had a positive effect on performance. Actions by central banks in the U.S. and Europe played a large role in the second half of 2012 and led to risk assets rallying. Specifically, the Federal Reserve made aggressive commitments to open-ended and unlimited asset purchase programs until the labor market strengthens, and pledged to maintain near zero rates for a considerable period of time. In Europe, tail risks were reduced significantly following the European Central Bank’s stance on ‘doing whatever it takes to preserve the Euro’. Both of these actions contributed to the significant rally in the global high yield market.
Yields in the global high yield bond market have reached record lows in recent months. However, spreads remain close to their historical average despite the positive fundamental backdrop. We believe credit fundamentals have remained relatively stable, following significant balance sheet improvements over the last three years, and we expect default rates to remain below their historical averages in the near-term.
Momentum in both supply and demand for global high yield assets has lent to a favorable technical environment. The 2012 new issuance total surpassed the levels experienced in 2011. Retail investors continue to invest in high yield, with recent fund flows remaining positive and holding strong.
Additionally, the European market offers investors more yield and spread, higher ratings, lower leverage profile and shorter durations. The Fund’s non-U.S. dollar dominated securities are hedged back to U.S. dollars, reducing the currency exposure to investors.
Babson Capital Global Short Duration High Yield Fund Overview and Performance
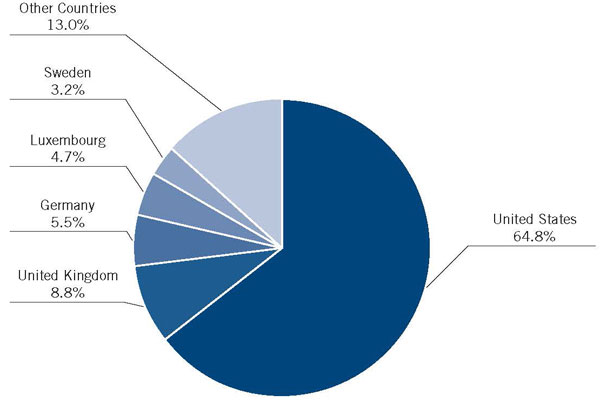
After the initial public offering of the Fund in October, the portfolio management team prudently invested the capital in both the U.S. and Western European credit markets primarily by taking advantage of attractive relative value opportunities in the secondary market. The Fund ended the year with a well-diversified portfolio of 121 issuers. A majority of the issuers are domiciled in the U.S. (64.5%) followed by the U.K. (8.8%) and Germany (5.5%) - see Country Composition chart on page 4. A focus of this Fund is to find attractive relative value opportunities in the global high yield market and the Fund invested in a number of issuers in the European region with attractive yield potential. From a fundamental bottom-up credit analysis standpoint, many of these issuers are stable credits that exhibit strong free cash flow generation along with global revenue streams, which can potentially help the issuers withstand additional European economic headwinds.
Babson Capital Global Short Duration High Yield Fund 2012 Annual Report
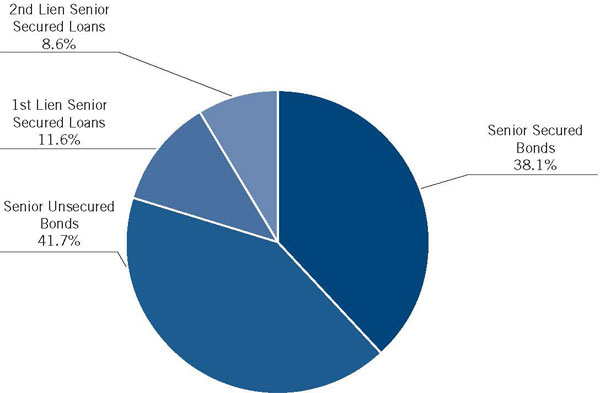
The Fund ended 2012 well positioned from a quality standpoint: 68.3% B-rated, 20.2% BB-rated, and 9.9% CCC-rated, with almost 60% of the portfolio consisting of secured obligations. Within the CCC-rated and below category, the majority of these assets are senior secured 2nd lien loans. Based on our experience within the current market environment, we believe these senior secured 2nd lien loan assets offer a tremendous amount of value and being senior secured by nature offers additional protection to investors. Note that 90% of the Fund’s European exposure consists of secured obligations.
In December, the Fund recorded its first dividend payment of $0.1677 per share, comprised of net investment income. Based on the Fund’s initial public offering price of $25.00 per share, the distribution represents an annualized yield of 8.05% per share. Assets acquired through leverage, which represented 17% at year-end, were accretive to net investment income and benefitted shareholders. From an NAV performance standpoint, the Fund increased +2.69% since inception.
In Conclusion
In general, we believe global high yield credit fundamentals are likely to remain relatively stable. It is our opinion that the central banks’ recent commitments to maintain low interest rates for the foreseeable future will also help sustain solid performance in the high yield market. We also expect global default rates to generally remain below their historical averages and as a result, we believe that the global high yield market will continue to offer attractive opportunities, despite the recent decline in yields.
We continue to believe that our bottom-up fundamental approach to investing will allow us to capture attractive investment opportunities for the Fund. So far, the Fund has gotten off to a strong start since the initial offering and we believe the Fund’s dividend will continue to be attractive for the foreseeable future.
Thank you again for supporting Babson Capital, the Global High Yield Investments Group, and the Fund this year. We look forward to a successful 2013 for our shareholders.
Sincerely,
Russell Morrison
President and Principal Executive Officer
Babson Capital Global Short Duration High Yield Fund
Cautionary Notice: Certain statements contained in this report may be “forward looking” statements. Investors are cautioned not to place undue reliance on forward-looking statements, which speak only as of the date in which they are made and which reflect management’s current estimates, projections, expectations or beliefs, and which are subject to risks and uncertainties that may cause actual results to differ materially. These statements are subject to change at any time based upon economic, market or other conditions and may not be relied upon as investment advice or an indication of the Trust’s trading intent. References to specific securities are not recommendations of such securities, and may not be representative of the Fund’s current or future investments. We undertake no obligation to publicly update forward looking statements, whether as a result of new information, future events, or otherwise.
Babson Capital Global Short Duration High Yield Fund 2012 Annual Report
PORTFOLIO COMPOSITION (% OF ASSETS*)
COUNTRY COMPOSITION (% OF ASSETS*)
| | |
| * | Percentage of assets are expressed by market value excluding cash and may vary over time. The percentages shown above represent a percentage of the Fund’s invested assets as of December 31, 2012. |
Babson Capital Global Short Duration High Yield Fund 2012 Annual Report
This page left intentionally blank.
| | | | |
| | | | |
| | | | |
| | | | |
| | | | |
| | | | |
| | BABSON CAPITAL GLOBAL SHORT DURATION HIGH YIELD FUND | | |
| | | | |
| | Financial Report | | |
| | | | |
| | Statement of Assets and Liabilities | 7 | |
| | | | |
| | Statement of Operations | 8 | |
| | | | |
| | Statement of Cash Flows | 9 | |
| | | | |
| | Statements of Changes in Net Assets | 10 | |
| | | | |
| | Selected Financial Highlights | 11 | |
| | | | |
| | Schedule of Investments | 12-18 | |
| | | | |
| | Notes to Financial Statements | 19-24 | |
| | | | |
| | Report of Independent Registered Public Accounting Firm | 25 | |
| | | | |
| | Independent Trustees | 27 | |
| | | | |
| | Officers of the Fund | 28-29 | |
| | | | |
| | Approval of Investment Management Agreement and Sub-Advisory Agreement | 30 | |
| | | | |
| | Fund Dividend Reinvestment Plan | 31 | |
| | | | |
| | Joint Privacy Notice | 32 | |
| | | | |
| | | | |
| | | | |
| | | | |
| | | | |
| | | | |
| | | | |
Babson Capital Global Short Duration High Yield Fund 2012 Annual Report
STATEMENT OF ASSETS AND LIABILITIES | | | | | |
| | | December 31, 2012 | |
| | | | | |
| Assets | | | | |
| Investments, at fair value (cost $573,257,886) | | $ | 584,620,319 | |
| Cash | | | 34,199,451 | |
| Foreign currency, at fair value (cost $6,047,699) | | | 6,039,161 | |
| Receivable for investments sold | | | 2,032,936 | |
| Interest receivable | | | 8,679,103 | |
| Prepaid expenses and other assets | | | 19,660 | |
| Total assets | | | 635,590,630 | |
| | | | | |
| Liabilities | | | | |
| Unrealized depreciation on forward foreign exchange contracts | | | 2,711,229 | |
| Payable for investments purchased | | | 41,213,009 | |
| Payable to adviser | | | 842,094 | |
| Dividend payable | | | 3,361,505 | |
| Accrued expenses and other liabilities | | | 458,186 | |
| Note payable | | | 100,000,000 | |
| Total liabilities | | | 148,586,023 | |
| Total net assets | | $ | 487,004,607 | |
| | | | | |
| Net Assets | | | | |
| Common stock, $0.00001 par value; 20,044,750 shares issued and outstanding (unlimited shares authorized) | | $ | 200 | |
| Additional paid-in capital | | | 477,565,969 | |
| Undistributed net investment income | | | 462,699 | |
| Accumulated net realized gain | | | 302,820 | |
| Net unrealized appreciation | | | 8,672,919 | |
| Total net assets | | $ | 487,004,607 | |
| Net asset value per share | | $ | 24.30 | |
See accompanying Notes to Financial Statements
Babson Capital Global Short Duration High Yield Fund 2012 Annual Report
| | | | | |
| | | Period from October 26, 2012 (1) through December 31, 2012 | |
| | | | | |
| Investment Income | | | | |
| Interest income | | $ | 5,109,116 | |
| Total investment income | | | 5,109,116 | |
| | | | | |
| Operating Expenses | | | | |
| Advisory fees | | | 842,094 | |
| Professional fees | | | 175,500 | |
| Administrator fees | | | 252,628 | |
| Interest expense | | | 78,934 | |
| Printing and mailing expense | | | 20,000 | |
Directors’ fees | | | 7l,750 | |
| Total operating expenses | | | 1,440, 906 | |
| Net investment income | | | 3,668,210 | |
| | | | | |
| Realized and Unrealized Gains (Losses) on Investments | | | | |
| Net realized gain on investments | | | 302,820 | |
| Net realized loss on forward foreign exchange contracts | | | (35,846 | ) |
| Net realized gain on foreign currency and translation | | | 191,840 | |
| Net realized gain on investments | | | 458,814 | |
| Net unrealized appreciation of investments | | | 11,362,433 | |
| Net unrealized depreciation of forward foreign exchange contracts | | | (2,711,229 | ) |
| Net unrealized appreciation of foreign currency and translation | | | 21,715 | |
| Net unrealized appreciation on investments | | | 8,672,919 | |
| Net realized and unrealized gains on investments | | | 9,131,733 | |
| Net increase in net assets resulting from operations | | $ | 12,799,943 | |
| (1) | Commencement of operations. |
See accompanying Notes to Financial Statements
Babson Capital Global Short Duration High Yield Fund 2012 Annual Report
| | | | |
| | | Period from October 26, 2012 (1) through December 31, 2012 | |
| | | | |
| Reconciliation of net increase in net assets resulting from operations to net cash used in operating activities | | | |
| Net increase in net assets applicable to common shareholders resulting from operations | | $ | 12,799,943 | |
| Adjustments to reconcile net increase in net assets applicable to common shareholders resulting from operations to net cash used in operating activities: | | | | |
| Purchases of long-term investments | | | (590,043,866 | ) |
| Proceeds from sales of long-term investments | | | 17,146,547 | |
| Purchases of foreign currency, net | | | (6,047,699 | ) |
| Forward exchange contracts, net | | | 2,711,229 | |
| Net unrealized depreciation | | | (11,353,895 | ) |
| Net realized gain | | | (448,564 | ) |
| Amortization and acretion | | | 87,997 | |
| Changes in operating assets and liabilities: | | | | |
| Increase in interest receivable | | (8,679,103 | ) |
| Increase in prepaid expenses and other assets | | | (19,660 | ) |
| Increase in receivable for investments sold | | | (2,032,936 | ) |
| Increase in payable for investments purchased | | | 41,213,009 | |
| Increase in payable to adviser | | | 842,094 | |
| Increase in accrued expenses and other liabilities | | | 458,186 | |
| Net cash used in operating activities | | | (543,366,718 | ) |
| | | | | |
| | | | | |
| Cash Flows From Financing Activities | | | | |
| Advances from note payable | | | 100,000,000 | |
| Issuance of common shares | | | 501,013,750 | |
| Common stock issuance costs | | | (23,547,646 | ) |
| Net cash provided by financing activities | | | 577,466,104 | |
| | | | | |
| | | | | |
| Net change in cash | | | 34,099,386 | |
| Cash beginning of period | | | 100,065 | |
| Cash end of period | | $ | 34,199,451 | |
| (1) | Commencement of operations. |
See accompanying Notes to Financial Statements
Babson Capital Global Short Duration High Yield Fund 2012 Annual Report
STATEMENT OF CHANGES IN NET ASSETS | | | | | |
| | | Period from October 26, 2012 (1) through December 31, 2012 | |
| | | | | |
| Operations | | | | |
| Net investment income | | $ | 3,668,210 | |
| Net realized gain on investments | | | 458,814 | |
| Net unrealized appreciation on investments | | | 8,672,919 | |
| Net increase in net assets resulting from operations | | | 12,799,943 | |
| | | | | |
| Dividends to Common Shareholders | | | | |
| Net investment income | | | (3,361,505 | ) |
| Total dividends to common shareholders | | | (3,361,505 | ) |
| | | | | |
| Capital Share Transactions | | | | |
| Net proceeds from sale of shares | | | 477,466,104 | (2) |
| Net increase in net assets capital stock transactions | | | 477,466,104 | |
| Total increase in net assets | | | 486,904,542 | |
| | | | | |
| Net Assets | | | | |
| Beginning of period | | | 100,065 | |
| End of period (including undistributed net investment income of 462,699) | | $ | 487,004,607 | |
| (1) | Commencement of operations. |
| (2) | Proceeds from sale of shares of $501,013,750 net of sales load paid and offering costs of $23,547,646. |
See accompanying Notes to Financial Statements
Babson Capital Global Short Duration High Yield Fund 2012 Annual Report
| | | | | |
| | | Period From
October 26, 2012 (1)
through
December 31, 2012 | |
| | | | | |
Per Common Share Data (2) | | | | |
| Net asset value, beginning of period | | $ | 23.82 | (3) |
| Income from investment operations: | | | | |
| Net investment income | | | 0.18 | |
| Net realized and unrealized gains on investments | | | 0.47 | |
| Total decrease from investment operations | | | 0.65 | |
| Less dividends to common shareholders: | | | | |
| Net investment income | | | (0.17 | ) |
| Total dividends to common shareholders | | | (0.17 | ) |
| Net asset value, end of period | | $ | 24.30 | |
| Per common share market value, end of period | | $ | 23.77 | |
Total investment return based on net asset value (2)(4) | | | 2.69 | % |
Total investment return based on market value (2)(4) | | | (4.27 | )% |
| Supplemental Data and Ratios | | | | |
| Net assets, end of period (000’s) | | $ | 487,005 | |
Ratio of expenses to average net assets (5) | | | 1.85 | % |
Ratio of net investment income to average net assets (5) | | | 4.70 | % |
Portfolio turnover rate (2) | | | 4.74 | % |
| (1) | Commencement of operations. |
| (2) | Not annualized. |
| (3) | Net asset value at the beginning of the period reflects the deduction of the sales load and offering costs of $1.18 per share paid by the shareholder from the $25.00 offering price. |
| (4) | Total investment return calculation assumes reinvestment of dividends at actual prices pursuant to the Fund’s dividend reinvestment plan. Total investment return does not reflect brokerage commissions. |
| (5) | Annualized for periods less than one full year. |
See accompanying Notes to Financial Statements
Babson Capital Global Short Duration High Yield Fund 2012 Annual Report
December 31, 2012
| | | | | | | | | | | | | | | | | |
| | | Effective Interest Rate ‡ | | Due Date | | Principal | | Cost | | Fair Value | |
| Fixed Income — 120.04%*: | | | | | | | | | | | | | | | | |
| | | | | | | | | | | | | | | | | |
| Bank Loans — 24.20%*§: | | | | | | | | | | | | | | | | |
| | | | | | | | | | | | | | | | | |
| Automobile — 1.58%*: | | | | | | | | | | | | | | | | |
| Shaeffler Finance+ | | 5.00 | % | | l/27/2017 | | | $ | 4,500,000 | | $ | 5,870,460 | | $ | 5,976,935 | |
| Shaeffler Finance | | 4.75 | | | 2/27/2017 | | | | 1,690,255 | | | 1,687,719 | | | 1,712,972 | |
| Total Automobile | | | | | | | | | 6,190,255 | | | 7,558,179 | | | 7,689,907 | |
| | | | | | | | | | | | | | | | | |
| Beverage, Food and Tobacco — 0.19%*: | | | | | | | | | | | | | | | | |
| Blue Buffalo Company, Ltd | | 6.50 | | | 8/8/2019 | | | | 922,951 | | | 922,970 | | | 927,953 | |
| Total Beverage, Food and Tobacco | | | | | | | | | 922,951 | | | 922,970 | | | 927,953 | |
| | | | | | | | | | | | | | | | | |
| Broadcasting and Entertainment — 0.30%*: | | | | | | | | | | | | | | | | |
| Deluxe Entertainment Services Group, Inc. | | 8.00 | | | 7/3/2017 | | | | 1,702,076 | | | 1,585,719 | | | 1,458,117 | |
| Total Broadcasting and Entertainment | | | | | | | | | 1,702,076 | | | 1,585,719 | | | 1,458,117 | |
| | | | | | | | | | | | | | | | | |
| Buildings and Real Estate — 0.79%*: | | | | | | | | | | | | | | | | |
| Tomkins Air Distribution | | 9.25 | | | 5/9/2020 | | | | 3,773,513 | | | 3,716,929 | | | 3,848,983 | |
| Total Buildings and Real Estate | | | | | | | | | 3,773,513 | | | 3,716,929 | | | 3,848,983 | |
| | | | | | | | | | | | | | | | | |
| Chemicals, Plastics and Rubber — 1.37%*: | | | | | | | | | | | | | | | | |
| Houghton International Inc. | | 5.25 | | | 11/30/2019 | | | | 2,837,229 | | | 2,808,857 | | | 2,860,296 | |
| Pinnacle Operating Corp | | 11.50 | | | 5/13/2019 | | | | 4,000,000 | | | 3,801,553 | | | 3,800,000 | |
| Total Chemicals, Plastics and Rubber | | | | | | | | | 6,837,229 | | | 6,610,410 | | | 6,660,296 | |
| | | | | | | | | | | | | | | | | |
| Diversified/Conglomerate Manufacturing — 2.98%*: | | | | | | | | | | | | | | | | |
| Alliance Laundry Systems LLC | | 9.50 | | | 11/30/2019 | | | | 2,113,136 | | | 2,092,023 | | | 2,134,268 | |
| Navistar International Corp | | 7.00 | | | 7/30/2017 | | | | 2,571,429 | | | 2,581,007 | | | 2,577,857 | |
| Northern Tool & Equiptment Company, Inc. | | 5.75 | | | 12/6/2018 | | | | 6,000,000 | | | 5,880,000 | | | 6,000,000 | |
| ValleyCrest | | 6.25 | | | 10/5/2016 | | | | 3,840,627 | | | 3,840,627 | | | 3,811,822 | |
| Total Diversified/Conglomerate Manufacturing | | | | | | | | | 14,525,192 | | | 14,393,657 | | | 14,523,947 | |
| | | | | | | | | | | | | | | | | |
| Diversified/Conglomerate Service — 2.40%*: | | | | | | | | | | | | | | | | |
| Endurance International Group Inc. | | 6.25 | | | 10/18/2017 | | | | 6,000,000 | | | 5,940,019 | | | 5,995,020 | |
| Redprarie Corporation | | 6.75 | | | 12/14/2018 | | | | 3,000,000 | | | 2,940,000 | | | 2,996,250 | |
| Redprarie Corporation | | 11.25 | | | 12/14/2019 | | | | 2,702,244 | | | 2,648,199 | | | 2,717,998 | |
| Total Diversified/Conglomerate Service | | | | | | | | | 11,702,244 | | | 11,528,218 | | | 11,709,268 | |
| | | | | | | | | | | | | | | | | |
| Diversified Natural Resources, Precious Metals and Minerals — 0.74%*: | | | | | | | | | | | | | | |
| Osmose Holdings, Inc. | | 5.50 | | | 5/2/2018 | | | | 3,616,486 | | | 3,607,446 | | | 3,616,486 | |
| Total Diversified Natural Resources, | | | | | | | | | | | | | | | | |
| Precious Metals and Minerals | | | | | | | | | 3,616,486 | | | 3,607,446 | | | 3,616,486 | |
| | | | | | | | | | | | | | | | | |
| Electronics — 1.56%*: | | | | | | | | | | | | | | | | |
| Kronos, Inc. | | 9.75 | | | 4/26/2020 | | | | 7,500,000 | | | 7,425,012 | | | 7,579,725 | |
| Total Electronics | | | | | | | | | 7,500,000 | | | 7,425,012 | | | 7,579,725 | |
Babson Capital Global Short Duration High Yield Fund 2012 Annual Report
SCHEDULE OF INVESTMENTS(CONTINUED)
December 31, 2012
| | | | | | | | | | | | | | | | | |
| | | Effective Interest Rate ‡ | | Due Date | | Principal | | Cost | | Fair Value | |
Bank Loans (Continued) | | | | | | | | | | | | | | | | |
| | | | | | | | | | | | | | | | | |
| Finance — 1.55%*: | | | | | | | | | | | | | | | | |
| Confie Seguros Holding | | 10.25 | % | | 5/8/2019 | | | $ | 1,500,000 | | $ | 1,470,338 | | $ | 1,491,255 | |
| Cunningham Lindsey Group, Inc. | | 9.25 | | | 4/18/2020 | | | | 3,000,000 | | | 3,071,000 | | | 3,052,500 | |
| Transfirst Holdings Inc. | | 9.75 | | | 6/30/2018 | | | | 1,004,072 | | | 973,950 | | | 987,334 | |
| Wall Street Systems Inc. | | 8.00 | | | 4/24/2020 | | | | 2,000,000 | | | 2,010,000 | | | 1,993,340 | |
| Total Finance | | | | | | | | | 7,504,072 | | | 7,525,288 | | | 7,524,429 | |
| | | | | | | | | | | | | | | | | |
| Healthcare, Education and Childcare — 3.39%*: | | | | | | | | | | | | | | | | |
| Air Medical Group Holdings | | 6.50 | | | 6/20/2018 | | | | 2,256,154 | | | 2,233,606 | | | 2,273,075 | |
| Gentiva Health Services Inc. | | 6.50 | | | 8/17/2016 | | | | 3,934,426 | | | 3,885,347 | | | 3,872,459 | |
| PRA International | | 8.00 | | | 11/30/2019 | | | | 1,743,299 | | | 1,708,433 | | | 1,754,195 | |
| Sage Products Holdings Iii, LLC | | 5.25 | | | 11/30/2019 | | | | 2,000,000 | | | 1,980,008 | | | 2,010,000 | |
| Sage Products Holdings Iii, LLC | | 9.25 | | | 5/31/2020 | | | | 3,325,292 | | | 3,275,431 | | | 3,325,292 | |
| TriZetto Group | | 8.50 | | | 3/27/2019 | | | | 3,325,000 | | | 3,309,162 | | | 3,291,750 | |
| Total Healthcare, Education and Childcare | | | | | | | | | 16,584,171 | | | 16,391,987 | | | 16,526,771 | |
| | | | | | | | | | | | | | | | | |
| Leisure, Amusement, Motion Pictures and Entertainment — 0.61%*: | | | | | | | | | | | | | |
| Jacob’s Entertainment | | 6.25 | | | 9/19/2018 | | | | 2,992,500 | | | 2,948,372 | | | 2,962,575 | |
| Total Leisure, Amusement, | | | | | | | | | | | | | | | | |
| Motion Pictures and Entertainment | | | | | | | | | 2,992,500 | | | 2,948,372 | | | 2,962,575 | |
| | | | | | | | | | | | | | | | | |
| Mining, Steel, Iron and Non-Precious Metals — 0.77%*: | | | | | | | | | | | | | | | | |
| Boomerang Tube, LLC | | 11.00 | | | 10/11/2017 | | | | 1,987,500 | | | 1,948,439 | | | 1,957,688 | |
| Constellium Holdco B.V.+ | | 9.25 | | | 5/22/2018 | | | | 1,795,489 | | | 1,795,467 | | | 1,795,489 | |
| Total Mining, Steel, Iron and Non-Precious Metals | | | | | | | | | 3,782,989 | | | 3,743,906 | | | 3,753,177 | |
| | | | | | | | | | | | | | | | | |
| Oil and Gas — 2.67%*: | | | | | | | | | | | | | | | | |
| Chesapeake Energy Corporation | | 5.75 | | | 12/2/2017 | | | | 2,000,000 | | | 1,967,500 | | | 2,000,500 | |
| EP Energy | | 4.50 | | | 4/30/2019 | | | | 5,000,000 | | | 4,987,514 | | | 5,010,700 | |
| Vantage Drilling Company | | 6.25 | | | 10/17/2017 | | | | 2,962,500 | | | 2,886,572 | | | 2,949,554 | |
| Venoco, Inc. | | 8.50 | | | 6/30/2017 | | | | 3,000,000 | | | 3,072,839 | | | 3,048,750 | |
| Total Oil and Gas | | | | | | | | | 12,962,500 | | | 12,914,425 | | | 13,009,504 | |
| | | | | | | | | | | | | | | | | |
| Retail Store — 3.30%*: | | | | | | | | | | | | | | | | |
| Academy, Ltd. | | 4.75 | | | 8/3/2018 | | | | 4,987,500 | | | 4,987,500 | | | 5,013,335 | |
BJ’s Wholesale Club, Inc. | | 9.75 | | | 3/13/2020 | | | | 4,000,000 | | | 4,153,093 | | | 4,095,000 | |
| FleetPride | | 9.25 | | | 5/8/2020 | | | | 3,000,000 | | | 2,940,573 | | | 2,938,140 | |
| Smart & Final Holdings Corp. | | 10.50 | | | 11/8/2020 | | | | 4,000,000 | | | 3,880,697 | | | 4,030,000 | |
| Total Retail Store | | | | | | | | | 15,987,500 | | | 15,961,863 | | | 16,076,475 | |
| | | | | | | | | | | | | | | | | |
| Total Bank Loans | | | | | | | | | 116,583,678 | | | 116,834,381 | | | 117,867,613 | |
Babson Capital Global Short Duration High Yield Fund 2012 Annual Report
SCHEDULE OF INVESTMENTS (CONTINUED)
December 31, 2012
| | | Effective | | | | | | | | | | |
| | | Interest Rate ‡ | | Due Date | | Principal | | Cost | | Fair Value | |
| Corporate Bonds — 95.84%*: | | | | | | | | | | | | | | | | |
| | | | | | | | | | | | | | | | | |
Aerospace and Defense* — 0.59%*: | | | | | | | | | | | | | | | | |
| CPI International, Inc. | | 8.00 | % | | 2/15/2018 | | | $ | 485,000 | | $ | 469,713 | | $ | 473,481 | |
| Ducommun Inc. | | 9.75 | | | 7/15/2018 | | | | 2,230,000 | | | 2,408,465 | | | 2,397,250 | |
| Total Aerospace and Defense | | | | | | | | | 2,715,000 | | | 2,878,178 | | | 2,870,731 | |
| | | | | | | | | | | | | | | | | |
| Automobile — 7.77%*: | | | | | | | | | | | | | | | | |
| Accuride Corp | | 9.50 | | | 8/1/2018 | | | | 2,175,000 | | | 2,114,041 | | | 2,098,875 | |
| Affinia Group, Inc. | | 9.00 | | | 11/30/2014 | | | | 12,000,000 | | | 12,062,195 | | | 12,000,000 | |
| Atu Auto-teile-ung+^ | | 11.00 | | | 5/15/2014 | | | | 4,320,000 | | | 5,397,848 | | | 5,673,706 | |
| Continental Rubber+^ | | 4.50 | | | 9/15/2019 | | | | 5,000,000 | | | 5,030,952 | | | 5,116,970 | |
| J.B. Poindexter & Co. Inc.^ | | 9.00 | | | 4/1/2022 | | | | 4,500,000 | | | 4,624,499 | | | 4,651,875 | |
| Meritor, Inc. | | 10.63 | | | 3/15/2018 | | | | 3,000,000 | | | 3,066,283 | | | 3,127,500 | |
| UCI International, Inc. | | 8.63 | | | 2/15/2019 | | | | 5,215,000 | | | 5,175,888 | | | 5,169,369 | |
| Total Automobile | | | | | | | | | 36,210,000 | | | 37,471,706 | | | 37,838,295 | |
| | | | | | | | | | | | | | | | | |
| Broadcasting and Entertainment — 0.59%*: | | | | | | | | | | | | | | | | |
| CET 21 Spol Sro+^ | | 9.00 | | | 11/1/2017 | | | | 2,000,000 | | | 2,795,855 | | | 2,877,508 | |
| Total Broadcasting and Entertainment | | | | | | | | | 2,000,000 | | | 2,795,855 | | | 2,877,508 | |
| | | | | | | | | | | | | | | | | |
| Buildings and Real Estate — 5.71%*: | | | | | | | | | | | | | | | | |
| Ainsworth Lumber Ltd+^ | | 7.50 | | | 12/15/2017 | | | | 5,750,000 | | | 5,770,831 | | | 6,023,125 | |
| Cemex International Capital LLC+^ | | 8.88 | | | 5/12/2017 | | | | 1,000,000 | | | 1,315,075 | | | 1,399,155 | |
| Cemex International Capital LLC+^ | | 9.88 | | | 4/30/2019 | | | | 2,890,000 | | | 3,820,531 | | | 4,119,814 | |
| Lyon Williams Homes, Inc.^ | | 8.50 | | | 11/15/2020 | | | | 8,000,000 | | | 8,058,546 | | | 8,320,000 | |
| Roofing Supply LLC^ | | 10.00 | | | 6/1/2020 | | | | 4,605,000 | | | 5,094,744 | | | 5,157,600 | |
| Xefin Lux SCA+ | | 8.00 | | | 6/1/2018 | | | | 2,000,000 | | | 2,610,859 | | | 2,798,310 | |
| Total Buildings and Real Estate | | | | | | | | | 24,245,000 | | | 26,670,586 | | | 27,818,004 | |
| | | | | | | | | | | | | | | | | |
| Cargo Transport — 3.81%*: | | | | | | | | | | | | | | | | |
| CEVA Group PLC+^ | | 8.375 | | | 12/1/2017 | | | | 5,000,000 | | | 4,872,933 | | | 4,925,000 | |
| Kenan Advantage Group, Inc.^ | | 8.375 | | | 12/15/2018 | | | | 8,000,000 | | | 8,000,000 | | | 8,160,000 | |
| Moto Hospitality Limited+^ | | 10.25 | | | 3/15/2017 | | | | 2,000,000 | | | 3,087,643 | | | 3,248,916 | |
| Quality Distribution Inc. | | 9.88 | | | 11/1/2018 | | | | 2,040,000 | | | 2,197,109 | | | 2,203,200 | |
| Total Cargo Transport | | | | | | | | | 17,040,000 | | | 18,157,685 | | | 18,537,116 | |
| | | | | | | | | | | | | | | | | |
| Chemicals, Plastics and Rubber — 7.45%*: | | | | | | | | | | | | | | | | |
| Calumet Specialty Products | | 9.38 | | | 5/1/2019 | | | | 7,365,000 | | | 7,937,177 | | | 7,991,025 | |
| Ciech Group Finance+^ | | 9.50 | | | 11/30/2019 | | | | 1,200,000 | | | 1,538,876 | | | 1,734,425 | |
| Omnova Solutions, Inc. | | 7.88 | | | 11/1/2018 | | | | 1,630,000 | | | 1,671,447 | | | 1,680,938 | |
| Perstorp Holding AB+^ | | 9.00 | | | 5/15/2017 | | | | 7,030,000 | | | 9,096,114 | | | 9,650,475 | |
| TPC Group, Inc.^ | | 8.75 | | | 12/15/2020 | | | | 6,065,000 | | | 6,145,416 | | | 6,110,488 | |
| Tronox Worldwide LLC^ | | 6.38 | | | 8/15/2020 | | | | 9,000,000 | | | 8,932,161 | | | 9,090,000 | |
| Total Chemicals, Plastics and Rubber | | | | | | | | | 32,290,000 | | | 35,321,191 | | | 36,257,351 | |
Babson Capital Global Short Duration High Yield Fund 2012 Annual Report
SCHEDULE OF INVESTMENTS (CONTINUED)
December 31, 2012
| | | Effective | | | | | | | | | | | | | |
| | | Interest Rate ‡ | | Due Date | | Principal | | Cost | | Fair Value | |
Corporate Bonds (Continued) | | | | | | | | | | | | | | | | |
| | | | | | | | | | | | | | | | | |
| Containers, Packaging and Glass — 1.76%*: | | | | | | | | | | | | | | | | |
| Bormioli Rocco & Figlio S.P.A.+^ | | 10.00 | % | | 8/1/2018 | | | $ | 1,500,000 | | $ | 1,996,919 | | $ | 2,103,683 | |
| Pretium Packaging, LLC | | 11.50 | | | 4/1/2016 | | | | 6,265,000 | | | 6,451,984 | | | 6,460,781 | |
| Total Containers, Packaging and Glass | | | | | | | | | 7,765,000 | | | 8,448,903 | | | 8,564,464 | |
| | | | | | | | | | | | | | | | | |
| Diversified/Conglomerate Manufacturing — 2.01%*: | | | | | | | | | | | | | | | | |
| Milacron LLC^ | | 8.38 | | | 5/15/2019 | | | | 5,800,000 | | | 5,961,673 | | | 5,945,000 | |
| Navistar International Corp | | 8.25 | | | 11/1/2021 | | | | 4,000,000 | | | 3,772,467 | | | 3,860,000 | |
| Total Diversified/Conglomerate Manufacturing | | | | | | | | | 9,800,000 | | | 9,734,140 | | | 9,805,000 | |
| | | | | | | | | | | | | | | | | |
| Diversified/Conglomerate Service — 3.34%*: | | | | | | | | | | | | | | | | |
| Brickman Group Holdings, Inc.^ | | 9.13 | | | 11/1/2018 | | | | 6,670,000 | | | 6,829,500 | | | 6,986,825 | |
| Verisure Holdings+^ | | 6.69 | | | 9/1/2018 | | | | 3,500,000 | | | 4,479,284 | | | 4,596,753 | |
| Verisure Holdings+^ | | 8.75 | | | 9/1/2018 | | | | 3,240,000 | | | 4,456,008 | | | 4,661,563 | |
| Total Diversified/Conglomerate Service | | | | | | | | | 13,410,000 | | | 15,764,792 | | | 16,245,141 | |
| | | | | | | | | | | | | | | | | |
| Diversified Natural Resources, Precious Metals and Minerals — .74%*: | | | | | | | | | | | | | |
| Lecta S.A.+^ | | 8.88 | | | 5/15/2019 | | | | 1,090,000 | | | 1,434,494 | | | 1,543,064 | |
| Lecta S.A.+^ | | 5.69 | | | 5/15/2018 | | | | 1,600,000 | | | 2,036,396 | | | 2,080,253 | |
| Total Diversified Natural Resources, | | | | | | | | | | | | | | | | |
| Precious Metals and Minerals | | | | | | | | | 2,690,000 | | | 3,470,890 | | | 3,623,317 | |
| | | | | | | | | | | | | | | | | |
| Electronics — 1.45%*: | | | | | | | | | | | | | | | | |
| International Wire Group, Inc.^ | | 8.50 | | | 10/15/2017 | | | | 7,000,000 | | | 7,169,215 | | | 7,070,000 | |
| Total Electronics | | | | | | | | | 7,000,000 | | | 7,169,215 | | | 7,070,000 | |
| | | | | | | | | | | | | | | | | |
| Finance — 5.45%*: | | | | | | | | | | | | | | | | |
| Cabot Financial+^ | | 10.38 | | | 10/1/2019 | | | | 5,000,000 | | | 8,441,126 | | | 8,954,824 | |
| Evertec, Inc. | | 11.00 | | | 10/1/2018 | | | | 11,000,000 | | | 12,208,009 | | | 12,155,000 | |
| Lowell Group Financing PLC+^ | | 10.75 | | | 4/1/2019 | | | | 2,000,000 | | | 3,417,872 | | | 3,573,807 | |
| TMF Group Holding+^ | | 5.56 | | | 12/1/2018 | | | | 1,400,000 | | | 1,802,552 | | | 1,847,941 | |
| Total Finance | | | | | | | | | 19,400,000 | | | 25,869,559 | | | 26,531,572 | |
| | | | | | | | | | | | | | | | | |
| Healthcare, Education and Childcare — 5.78%*: | | | | | | | | | | | | | | | | |
| Alere Inc.^ | | 7.25 | | | 7/1/2018 | | | | 6,000,000 | | | 6,035,942 | | | 6,015,000 | |
| Care UK Health+^ | | 9.75 | | | 8/1/2017 | | | | 2,300,000 | | | 3,878,784 | | | 4,025,813 | |
| Crown Newco PLC+ | | 8.88 | | | 2/15/2019 | | | | 4,500,000 | | | 7,391,201 | | | 7,529,362 | |
| Prospect Medical Holdings Inc^ | | 8.38 | | | 5/1/2019 | | | | 5,000,000 | | | 5,098,542 | | | 5,262,500 | |
| Warner Chilcott Company, LLC+ | | 7.75 | | | 9/15/2018 | | | | 5,000,000 | | | 5,276,378 | | | 5,325,000 | |
| Total Healthcare, Education and Childcare | | | | | | | | | 22,800,000 | | | 27,680,847 | | | 28,157,675 | |
| | | | | | | | | | | | | | | | | |
| Hotels, Motels, Inns and Gaming — 1.95%*: | | | | | | | | | | | | | | | | |
| Gala Group Finance+ | | 8.88 | | | 9/1/2018 | | | | 5,500,000 | | | 8,834,303 | | | 9,470,589 | |
| Total Hotels, Motels, Inns and Gaming | | | | | | | | | 5,500,000 | | | 8,834,303 | | | 9,470,589 | |
Babson Capital Global Short Duration High Yield Fund 2012 Annual Report
SCHEDULE OF INVESTMENTS (CONTINUED)
December 31, 2012
| | | Effective | | | | | | | | | | | | | |
| | | Interest Rate ‡ | | Due Date | | Principal | | Cost | | Fair Value | |
Corporate Bonds (Continued) | | | | | | | | | | | | | | | | |
| | | | | | | | | | | | | | | | | |
| Leisure, Amusement, Motion Pictures and Entertainment — 1.57%*: | | | | | | | | | | | | | | |
| Odeon & Uci Finco+ | | 9.00 | % | | 8/1/2018 | | | $ | 4,200,000 | | $ | 6,974,912 | | $ | 7,129,745 | |
| WMG Acquisition Corp. | | 11.50 | | | 10/1/2018 | | | | 460,000 | | | 519,207 | | | 531,300 | |
| Total Leisure, Amusement, | | | | | | | | | | | | | | | | |
| Motion Pictures and Entertainment | | | | | | | | | 4,660,000 | | | 7,494,119 | | | 7,661,045 | |
| | | | | | | | | | | | | | | | | |
| | | | | | | | | | | | | | | | | |
| Machinery (Non-Agriculture, Non-Construct, Non-Electronic) — 2.06%*: | | | | | | | | | | | | | |
| Cleaver-Brooks, Inc.^ | | 8.75 | | | 12/15/2019 | | | | 4,740,000 | | | 4,883,815 | | | 4,894,050 | |
| Hellerman Tyton+^ | | 5.44 | | | 12/15/2017 | | | | 2,370,000 | | | 3,067,299 | | | 3,140,044 | |
| KM Germany Holding+^ | | 8.75 | | | 12/15/2020 | | | | 1,450,000 | | | 1,876,585 | | | 2,009,636 | |
| Total Machinery | | | | | | | | | | | | | | | | |
| (Non-Agriculture, Non-Construct, Non-Electronic) | | | | | | | | | 8,560,000 | | | 9,827,699 | | | 10,043,730 | |
| | | | | | | | | | | | | | | | | |
| Mining, Steel, Iron and Non-Precious Metals — 5.73%*: | | | | | | | | | | | | | |
| Alpha Natural Resources, Inc. | | 9.75 | | | 4/15/2018 | | | | 3,000,000 | | | 3,117,767 | | | 3,240,000 | |
| Ausdrill Finance Pty Ltd.+^ | | 6.88 | | | 11/1/2019 | | | | 6,000,000 | | | 6,000,000 | | | 5,940,000 | |
| Fortescue Metals Group Resources Ltd.+^ | | 6.00 | | | 4/1/2017 | | | | 2,000,000 | | | 1,941,250 | | | 2,040,000 | |
| Fortescue Metals Group Resources Ltd.+^ | | 8.25 | | | 11/1/2019 | | | | 5,000,000 | | | 5,121,270 | | | 5,325,000 | |
| Inmet Mining Corporation+^ | | 7.50 | | | 6/1/2021 | | | | 3,500,000 | | | 3,514,945 | | | 3,631,250 | |
| Kaiser Aluminum Corporation | | 8.25 | | | 6/1/2020 | | | | 800,000 | | | 872,042 | | | 872,000 | |
| New World Resources N.V.+^ | | 7.88 | | | 5/1/2018 | | | | 3,350,000 | | | 4,316,552 | | | 4,569,991 | |
| Rain CII Carbon LLC^ | | 8.25 | | | 1/15/2021 | | | | 1,390,000 | | | 1,390,000 | | | 1,421,275 | |
| Rain CII Carbon LLC^ | | 8.50 | | | 1/15/2021 | | | | 650,000 | | | 855,139 | | | 875,432 | |
| Total Mining, Steel, Iron and Non-Precious Metals | | | | | | | | | 25,690,000 | | | 27,128,965 | | | 27,914,948 | |
| | | | | | | | | | | | | | | | | |
| Oil and Gas — 22.30%*: | | | | | | | | | | | | | | | | |
| Alta Mesa Holdings, LP | | 9.63 | | | 10/15/2018 | | | | 3,500,000 | | | 3,570,598 | | | 3,605,000 | |
| CHC Helicopter+ | | 9.25 | | | 10/15/2020 | | | | 4,620,000 | | | 4,742,334 | | | 4,862,550 | |
| Chesapeake Oilfield Operating LLC^ | | 6.63 | | | 11/15/2019 | | | | 6,000,000 | | | 5,764,028 | | | 5,655,000 | |
| Era Group Inc.^ | | 7.75 | | | 12/15/2022 | | | | 3,000,000 | | | 2,949,330 | | | 2,947,500 | |
| Ferrellgas Partners LP | | 8.63 | | | 6/15/2020 | | | | 7,135,000 | | | 6,989,281 | | | 7,135,000 | |
| Halcon Resources Corporation^ | | 9.75 | | | 7/15/2020 | | | | 8,000,000 | | | 8,472,895 | | | 8,640,000 | |
| Headwaters, Inc. | | 7.63 | | | 4/1/2019 | | | | 3,000,000 | | | 3,133,254 | | | 3,187,500 | |
| Hercules Offshore, Inc.^ | | 10.25 | | | 4/1/2019 | | | | 6,865,000 | | | 7,231,724 | | | 7,517,175 | |
| Magnum Hunter Resources, Corp^ | | 9.75 | | | 5/15/2020 | | | | 3,000,000 | | | 3,059,823 | | | 3,112,500 | |
| Midstates Petroleum Company Inc.^ | | 10.75 | | | 10/1/2020 | | | | 5,000,000 | | | 5,296,487 | | | 5,312,500 | |
| Niska Gas Storage | | 8.88 | | | 3/15/2018 | | | | 6,500,000 | | | 6,744,726 | | | 6,678,750 | |
| Northern Tier Energy LLC^ | | 7.13 | | | 11/15/2020 | | | | 6,000,000 | | | 6,000,000 | | | 6,210,000 | |
| Pbf Holding Company LLC^ | | 8.25 | | | 2/15/2020 | | | | 6,000,000 | | | 6,296,335 | | | 6,465,000 | |
| Quicksilver Resources, Inc. | | 8.25 | | | 8/1/2015 | | | | 3,000,000 | | | 2,795,360 | | | 2,775,000 | |
| Resolute Energy Corp.^ | | 8.50 | | | 5/1/2020 | | | | 7,285,000 | | | 7,449,268 | | | 7,339,638 | |
| Samson Investment Company^ | | 9.75 | | | 2/15/2020 | | | | 6,000,000 | | | 6,385,324 | | | 6,345,000 | |
| Shelf Drilling Holdings Ltd+^ | | 8.63 | | | 11/1/2018 | | | | 6,000,000 | | | 6,083,455 | | | 6,150,000 | |
Babson Capital Global Short Duration High Yield Fund 2012 Annual Report
SCHEDULE OF INVESTMENTS (CONTINUED)
December 31, 2012
| | | | | | | | | | | | | | | | | |
| | | Effective | | | | | | | | | | | | | |
| | | Interest Rate ‡ | | Due Date | | Principal | | Cost | | Fair Value | |
Corporate Bonds (Continued) | | | | | | | | | | | | | | | | |
| | | | | | | | | | | | | | | | | |
Oil and Gas (Continued) | | | | | | | | | | | | | | | | |
| Unit Corporation | | 6.63 | % | | 5/15/2021 | | | $ | 3,000,000 | | $ | 3,089,743 | | $ | 3,078,750 | |
| Venoco, Inc. | | 11.50 | | | 10/1/2017 | | | | 5,500,000 | | | 5,567,518 | | | 5,761,250 | |
| Welltec+^ | | 8.00 | | | 2/1/2019 | | | | 5,500,000 | | | 5,747,106 | | | 5,830,000 | |
| Total Oil and Gas | | | | | | | | | 104,905,000 | | | 107,368,589 | | | 108,608,113 | |
| | | | | | | | | | | | | | | | | |
| Personal and Nondurable Consumer Products (Manufacturing Only) — 1.85%*: | | | | | | | | | | | |
| Grohe Holdings+^ | | 8.75 | | | 12/15/2017 | | | | 6,530,000 | | | 8,663,869 | | | 9,028,742 | |
| Total Personal and Nondurable | | | | | | | | | | | | | | | | |
| Consumer Products (Manufacturing Only) | | | | | | | | | 6,530,000 | | | 8,663,869 | | | 9,028,742 | |
| | | | | | | | | | | | | | | | | |
| | | | | | | | | | | | | | | | | |
| | | | | | | | | | | | | | | | | |
| Printing and Publishing — 2.39%*: | | | | | | | | | | | | | | | | |
| Cenveo Corporation | | 8.88 | | | 2/1/2018 | | | | 5,750,000 | | | 5,211,096 | | | 5,462,500 | |
| R.R. Donnelley & Sons Company | | 7.25 | | | 5/15/2018 | | | | 6,375,000 | | | 6,245,257 | | | 6,151,875 | |
| Total Printing and Publishing | | | | | | | | | 12,125,000 | | | 11,456,353 | | | 11,614,375 | |
| | | | | | | | | | | | | | | | | |
| Retail Store — 5.63%*: | | | | | | | | | | | | | | | | |
| GRD Holding Corp.^ | | 10.75 | | | 6/1/2019 | | | | 2,000,000 | | | 2,059,527 | | | 2,005,000 | |
| HD Supply, Inc.^ | | 11.50 | | | 7/15/2020 | | | | 5,000,000 | | | 5,302,276 | | | 5,631,250 | |
| House Fraser PLC+^ | | 8.88 | | | 8/15/2018 | | | | 4,000,000 | | | 6,497,343 | | | 6,822,723 | |
| Matalan Finance PLC+^ | | 8.88 | | | 4/29/2016 | | | | 4,000,000 | | | 6,471,906 | | | 6,692,766 | |
| Pantry, Inc^ | | 8.38 | | | 8/1/2020 | | | | 875,000 | | | 910,399 | | | 914,375 | |
| Spencer Spirit Holdings, Inc.^ | | 11.00 | | | 5/1/2017 | | | | 5,000,000 | | | 5,388,716 | | | 5,362,500 | |
| Total Retail Store | | | | | | | | | 20,875,000 | | | 26,630,167 | | | 27,428,614 | |
| | | | | | | | | | | | | | | | | |
| Telecommunications — 4.41%*: | | | | | | | | | | | | | | | | |
| Numericable Finance+^ | | 8.08 | | | 10/15/2018 | | | | 5,500,000 | | | 7,088,086 | | | 7,441,262 | |
| Nara Cable FDG Ltd+^ | | 8.88 | | | 12/1/2018 | | | | 8,000,000 | | | 7,543,835 | | | 8,020,000 | |
| Wind Acquisition+^ | | 7.38 | | | 2/15/2018 | | | | 1,000,000 | | | 1,246,206 | | | 1,339,757 | |
| Wind Acquisition+^ | | 7.38 | | | 2/15/2018 | | | | 3,565,000 | | | 4,414,349 | | | 4,670,357 | |
| Total Telecommunications | | | | | | | | | 18,065,000 | | | 20,292,476 | | | 21,471,376 | |
| | | | | | | | | | | | | | | | | |
| Textiles & Leather — 1.50%*: | | | | | | | | | | | | | | | | |
| Perry Ellis International Inc | | 7.88 | | | 4/1/2019 | | | | 7,000,000 | | | 7,293,418 | | | 7,315,000 | |
| Total Textiles & Leather | | | | | | | | | 7,000,000 | | | 7,293,418 | | | 7,315,000 | |
| | | | | | | | | | | | | | | | | |
| Total Corporate Bonds | | | | | | | | | 411,275,000 | | | 456,423,505 | | | 466,752,706 | |
| | | | | | | | | | | | | | | | | |
| Total Fixed Income | | | | | | | | | 527,858,678 | | | 573,257,886 | | | 584,620,319 | |
| | | | | | | | | | | | | | | | | |
| Other liabilities and assets — (20.04)% | | | | | | | | | | | | | | | | |
| | | | | | | | | | | | | | | | (97,615,712 | ) |
| | | | | | | | | | | | | | | | | |
| Net Assets — 100% | | | | | | | | | | | | | | $ | 487,004,607 | |
Babson Capital Global Short Duration High Yield Fund 2012 Annual Report
SCHEDULE OF INVESTMENTS (CONTINUED)
December 31, 2012
| ‡ | The effective interest rates are based on settled commitment amount. |
| * | Calculated as a percentage of net assets applicable to common shareholders. |
| + | Foreign security. |
| | Distributions of investments by country of issue (excluding temporary cash investments) as a percentage of total investment in securities, is as follows: |
| | US | United States | 64.8 | % |
| | GB | United Kingdom | 8.8 | % |
| | DE | Germany | 5.5 | % |
| | LU | Luxembourg | 4.7 | % |
| | SE | Sweden | 3.2 | % |
| | CA | Canada | 2.5 | % |
| | AU | Australia | 2.3 | % |
| | NL | Netherlands | 1.9 | % |
| | ES | Spain | 1.4 | % |
| | AE | United Arab Emirates | 1.1 | % |
| | DK | Denmark | 1.0 | % |
| | Other (Individually less than 1%) | 2.8 | % |
| | | | 100.0 | % |
| ^ | Security exempt from registration under Rule 144a of the Securities Act of 1933. These securities may only be resold in transactions exempt from registration, normally to qualified institutional buyers. |
| § | Bank loans are exempt from registration under the Securities Act of 1933, as amended, but contain certain restrictions on resale and cannot be sold publicly. These loans pay interest at rates which adjust periodically. The interest rates shown for bank loans are the current interest rates at December 31, 2012. Bank loans are also subject to mandatory and/or optional prepayment which cannot be predicted. As a result, the remaining maturity may be substantially less than the stated maturity shown. |
See accompanying Notes to Financial Statements
Babson Capital Global Short Duration High Yield Fund 2012 Annual Report
NOTES TO THE FINANCIAL STATEMENTS December 31, 2012
| | | |
| 1. | Organization |
| | |
| | Babson Capital Global Short Duration High Yield Fund (the “Fund”) was organized as a business trust under the laws of the Commonwealth of Massachusetts on May 20, 2011, and commenced operations on October 26, 2012. The Fund is registered under the Investment Company Act of 1940, as amended (the “1940 Act”), as a non-diversified, closed-end management investment company. |
| | | |
| | Babson Capital Management LLC (the “Adviser”), a wholly-owned indirect subsidiary of Massachusetts Mutual Life Insurance Company, is a registered investment adviser under the Investment Advisers Act of 1940, as amended, and serves as investment adviser to the Fund. |
| | | |
| | Babson Capital Global Advisers Limited (“Sub-Adviser”), an indirect wholly-owned subsidiary of Babson Capital Management LLC will serve as a sub-adviser with respect to the Fund’s European investments. |
| | | |
| | The Fund’s primary investment objective is to seek as high a level of current income as the Adviser (as defined herein) determines is consistent with capital preservation. The Fund seeks capital appreciation as a secondary investment objective when consistent with its primary investment objective. There can be no assurance that the Fund will achieve its investment objectives. The Fund will seek to take advantage of inefficiencies between geographies, primarily the North American and Western European high yield bond and loan markets and within capital structures between bonds and loans. Under normal market conditions, the Fund will invest at least 80% of its managed assets in bonds, loans and other income-producing instruments that are, at the time of purchase, rated below investment grade (below Baa3 by Moody’s Investors Service, Inc. or below BBB- by either Standard & Poor’s Rating Services, a division of the McGraw-Hill Company, Inc. or Fitch, Inc.) or unrated but judged by the Adviser or Sub-Adviser to be of comparable quality. |
| | | |
| 2. | Significant Accounting Policies |
| | | |
| | The following is a summary of significant accounting policies followed consistently by the Fund in the preparation of its financial statements in conformity with accounting principles generally accepted in the United States of America (“U.S. GAAP”). |
| | | |
| | A. | Valuation of Investments |
| | | |
| | The Fund’s investments in fixed income securities are generally valued using the prices provided directly by independent third party services or provided directly from one or more broker dealers or market makers, each in accordance with the valuation policies and procedures approved by the Fund’s Board of Trustees (the “Board”). |
| | | |
| | The pricing services may use valuation models or matrix pricing, which consider yield or prices with respect to comparable bond quotations from bond dealers or by reference to other securities that are considered comparable in such characteristics as credit rating, interest rates and maturity date, to determine the current value. |
| | |
| | The Fund’s investments in bank loans are normally valued at the bid quotation obtained from dealers in loans by an independent pricing service in accordance with the Fund’s valuation policies and procedures approved by the Board. |
| | |
| | In certain cases authorized pricing service vendors may not provide prices for a security held by the Fund, or the price provided by such pricing service vendor is deemed unreliable by the Adviser. In such cases, the Fund may use market maker quotations provided by an established market maker for that security (i.e., broker quotes) to value the security if the Adviser has experience obtaining quotations from the market maker and the Adviser determines that quotations obtained from the market maker in the past have generally been reliable (or, if the Adviser has no such experience with respect to a market maker, it determines based on other information available to it that quotations to be obtained by it from the market maker are reasonably likely to be reliable). In any such case, the Adviser will review any market quotations so obtained in light of other information in its possession for their general reliability. |
| | |
| | Bank loans in which the Fund may invest have similar risks to lower-rated fixed income securities. Changes in the financial condition of the borrower or economic conditions or other circumstances may reduce the capacity of the borrower to make principal and interest payments on such instruments and may lead to defaults. Senior secured bank loans are supported by collateral; however, the value of the collateral may be insufficient to cover the amount owed to the Fund. By relying on a third party to administer a loan, the Fund is subject to the risk that the third party will fail to perform its obligations. The loans in which the Fund will invest are largely floating rate instruments; therefore, the interest rate risk generally is lower than for fixed-rate debt obligations. However, an increase in interest rates may adversely affect the borrower’s financial condition. Due to the unique and customized nature of loan agreements evidencing loans and the private syndication thereof, loans are not as easily purchased or sold as publicly traded securities. Although the range of investors in loans has broadened in recent years, there can be no assurance that future levels of supply and demand in loan trading will provide the degree of liquidity which currently exists in the market. In addition, the terms of the loans may restrict their transferability without borrower consent. These factors may have an adverse effect on the market price and the Fund’s ability to dispose of particular |
Babson Capital Global Short Duration High Yield Fund 2012 Annual Report
NOTES TO THE FINANCIAL STATEMENTS (CONTINUED)
December 31, 2012
| | |
| | portfolio investments. A less liquid secondary market also may make it more difficult for the Fund to obtain valuations of the loans in its portfolio. |
| | |
| | Fair value is defined as the price that the Fund would receive upon selling an investment in a timely transaction to an independent buyer in the principal or most advantageous market for the investment. A three-tier hierarchy is utilized to maximize the use of observable market data and minimize the use of unobservable inputs and to establish classification of fair value measurements for disclosure purposes. Inputs refer broadly to the assumptions that market participants would use in pricing the asset or liability, including assumptions about risk. For example, market participants would consider the risk inherent in a particular valuation technique used to measure fair value, such as a pricing model, and/or the risk inherent in the inputs to the valuation technique. Inputs may be observable or unobservable. Observable inputs are inputs that reflect the assumptions market participants would use in pricing the asset or liability and are developed based on market data obtained from sources independent of the reporting entity. Unobservable inputs are inputs that reflect the reporting entity’s own assumptions about the assumptions market participants would use in pricing the asset or liability and are developed based on the best information available in the circumstances. The three-tier hierarchy of inputs is summarized in the three broad levels listed below. |
| | |
| | Level 1 – quoted prices in active markets for identical securities |
| | |
| | Level 2 – other significant observable inputs (including quoted prices for similar securities, interest rates, prepayment speeds, credit risk, etc.) |
| | |
| | Level 3 – significant unobservable inputs (including the Fund’s own assumptions in determining the fair value of investments) |
| | |
| | The availability of observable inputs can vary from security to security and is affected by a wide variety of factors, including, for example, the type of security, whether the security is new and not yet established in the marketplace, the liquidity of markets, and other characteristics particular to the security. To the extent that valuation is based on models or inputs that are less observable or unobservable in the market, the determination of fair value requires more judgment. Accordingly, the degree of judgment exercised in determining fair value is greatest for instruments categorized in level 3. |
| | |
| | The inputs used to measure fair value may fall into different levels of the fair value hierarchy. In such cases, for disclosure purposes, the level in the fair value hierarchy within which the fair value measurement falls in its entirety is determined based on the lowest level input that is significant to the fair value measurement in its entirety. |
| | |
| | The following is a summary of the inputs used as of December 31, 2012 in valuing the Fund’s investments: |
| Description | | Level 1 | | | Level 2 | | | Level 3 | | | Total Investments |
| Assets:* | | | | | | | | | | | |
| Fixed Income: | | | | | | | | | | | |
| Bank Loans | | $ | - | | | $ | 117,867,613 | | | $ | - | | | $ | 117,867,813 | |
| Bonds | | | - | | | | 466,752,706 | | | | - | | | | 466,752,706 | |
| Total Fixed Income | | | - | | | | 584,620,319 | | | | - | | | | 584,620,319 | |
| | | | | | | | | | | | | | | | | |
| Liabilities:* | | | | | | | | | | | | | | | | |
| Derivative Securities: | | | | | | | | | | | | | | | | |
| Foreign Exchange Contracts | | | - | | | | 2,711,229 | | | | - | | | | 2,711,229 | |
| Total Derivative Securities | | | - | | | | 2,711,229 | | | | - | | | | 2,711,229 | |
| | | | | | | | | | | | | | | | | |
| Total Investments | | $ | - | | | $ | 581,909,090 | | | $ | - | | | $ | 581,909,090 | |
| * | There were no transfers between levels during 2012 |
Babson Capital Global Short Duration High Yield Fund 2012 Annual Report
NOTES TO THE FINANCIAL STATEMENTS (CONTINUED)
December 31, 2012
| | | |
| | B. | Cash and Cash Equivalents |
| | | |
| | Cash and cash equivalents consist principally of short-term investments that are readily convertible into cash and have original maturities of three months or less. At December 31, 2012, all cash and cash equivalents are held by the custodian. |
| | | |
| | C. | Investment Transactions, Related Investment Income and Expenses |
| | | |
| | Investment transactions are accounted for on a trade date basis. Interest income is recognized when earned, including the amortization of premiums and accretion of discounts on bonds held using the yield-to-maturity method. |
| | |
| | Realized gains and losses on investment transactions and unrealized appreciation and depreciation of investments are reported for financial statement and Federal income tax purposes on the identified cost method. |
| | |
| | Expenses are recorded on the accrual basis as incurred. |
| | |
| | D. | Use of Estimates |
| | | |
| | The preparation of financial statements in conformity with U.S. GAAP requires management to make estimates and assumptions that affect the reported amounts of assets and liabilities and disclosure of contingent assets and liabilities at the date of the financial statements and the reported amounts of revenues and expenses during the reporting period. Actual results could differ from those estimates. |
| | |
| | E. | Federal Income Taxation |
| | | |
| | The Fund has elected to be taxed as a Regulated Investment Company (“RIC”) under sub-chapter M of the U.S. Internal Revenue Code of 1986, as amended, and intends to maintain this qualification and to distribute substantially all of its net taxable income to its shareholders. |
| | |
| | F. | Dividends and Distributions |
| | | |
| | The Fund intends to declare and pay dividends monthly from net investment income. To the extent that these distributions exceed net investment income, they may be classified as return of capital. The Fund also pays a distribution at least annually from its net realized capital gains, if any. Dividends and distributions are recorded on the ex-dividend date. All common shares of beneficial interest have equal dividend and other distribution rights. A notice disclosing the source(s) of a distribution will be provided if payment is made from any source other than net investment income. Any such notice would be provided only for informational purposes in order to comply with the requirements of Section 19(a) of the 1940 Act and not for tax reporting purposes. The tax composition of the Fund’s distributions for each calendar year is reported on Internal Revenue Service Form 1099-DIV. |
| | |
| | Dividends from net investment income and distributions from realized gains from investment transactions have been determined in accordance with Federal income tax regulations and may differ from net investment income and realized gains recorded by the Fund for financial reporting purposes. These differences, which could be temporary or permanent in nature, may result in reclassification of distributions; however, net investment income, net realized gains and losses, and net assets are not affected. |
| | |
| | G. | Derivative Instruments |
| | | |
| | The following is a description of the derivative instruments that the Fund utilizes as part of its investment strategy, including the primary underlying risk exposures related to the instrument. |
| | |
| | Forward Foreign Exchange Contracts – The Fund is subject to foreign exchange rate risk in the normal course of pursuing its investment objectives. The Fund may use forward foreign exchange contracts to hedge against changes in the value of foreign currencies. The Fund may enter into forward foreign exchange contracts obligating the Fund to deliver or receive a currency at a specified future date. Forward foreign exchange contracts are valued daily and unrealized appreciation or depreciation is recorded daily as the difference between the contract exchange rate and the closing forward rate applied to the face amount of the contract. A realized gain or loss is recorded at the time the forward foreign exchange contract expires. Credit risk may arise as a result of the failure of the counterparty to comply with the terms of the contract. The Fund considers the creditworthiness of each counterparty to a contract in evaluating potential credit risk at least quarterly. The Fund is also subject to credit risk with respect to the counterparties to the derivative contracts which are not cleared through a central counterparty but instead are traded over-the-counter between two counterparties. If a counterparty to an over-the-counter derivative becomes bankrupt or otherwise fails to perform its obligations under a derivative contract due to financial difficulties, the Fund may experience significant delays in obtaining any recovery under the derivative contract in a bankruptcy or other reorganization proceeding. The Fund may obtain only a limited recovery or may obtain no recovery in such circumstances. The counterparty risk for cleared derivatives is generally lower than for uncleared over-the-counter derivative transactions since generally a clearing organization becomes substituted for each counterparty to a cleared derivative contract and, in effect, guarantees the parties’ performance under the contract as each party to a trade looks only to the clearing house for performance of financial |
Babson Capital Global Short Duration High Yield Fund 2012 Annual Report
NOTES TO THE FINANCIAL STATEMENTS (CONTINUED)
December 31, 2012
| | |
| | obligations. However, there can be no assurance that the clearing house, or its members, will satisfy its obligations to the Fund. In addition, in the event of a bankruptcy of a clearing house, the Fund could experience a loss of the funds deposited with such clearing house as margin and of any profits on its open positions. The counter party risk to the Fund is limited to the net unrealized gain, if any, on the contract. |
| | |
| | The use of forward foreign exchange contracts does not eliminate fluctuations in the underlying prices of the Fund’s investment securities; however, it does establish a rate of exchange that can be achieved in the future. The use of forward foreign exchange contracts involves the risk that anticipated currency movements will not be accurately predicted. A forward foreign exchange contract would limit the risk of loss due to a decline in the value of a particular currency; however it would also limit any potential gain that might result should the value of the currency increase instead of decrease. These contracts may involve market risk in excess of the amount of receivables or payables reflected on the Statement of Assets and Liabilities. |
| | |
| | During the period from October 26, 2012 through December 31, 2012, the Fund’s direct investment in derivatives consisted of forward foreign exchange contracts. |
| | |
| | The following is a summary of the fair value of derivative instruments held directly by the Fund as of December 31, 2012. Fair values of derivative instruments on the Statement of Assets and Liabilities as of December 31, 2012: |
| | | | | | | | | | |
| | | | | Statement of Assets | | | | |
| | | | | and Liabilities | | | | |
| | Derivatives | | | Location | | Fair Value | |
| | Foreign exchange contracts: | | | | | | | |
| | Forward Foreign | | | | | | | |
| | Exchange Contracts | | | Payables | | $ | 2,711,229 | |
| | Total | | | | | $ | 2,711,229 | |
| | | | | | |
| | The effect of derivative instruments on the Statement of Operations for period October 26, 2012 through December 31, 2012: Amount of Realized Gain/(Loss) on Derivatives |
| | | | | | |
| | | | Forward | |
| | | | Exchange Contracts | |
| | | | | | |
| | Derivatives | | | | |
| | Foreign exchange contracts | | $ | (35,846 | ) |
| | Total | | $ | (35,846 | ) |
| | | | | | |
| | Change in Unrealized Appreciation/(Depreciation) on Derivatives | | | | |
| | | | | | |
| | | | Forward | |
| | | | Exchange Contracts | |
| | | | | | |
| | Derivatives | | | | |
| | Foreign exchange contracts | | $ | (2,711,229 | ) |
| | Total | | $ | (2,711,229 | ) |
| | H. | Foreign Securities |
| | | |
| | Investing in securities of foreign companies and foreign governments involves special risks and considerations not typically associated with investing in U.S. companies and the U.S. government. These risks include valuation of currencies and adverse political and economic developments. Moreover, securities of many foreign companies, foreign governments, and their markets may be less liquid and their prices more volatile than those of securities of comparable U.S. companies and the U.S. government. |
| | |
| | I. | Foreign Currency Translation |
| | | |
| | The books and records of the Fund are maintained in U.S. dollars. Foreign currency transactions are translated into U.S. dollars on the following basis: (i) market value of investment securities, assets and liabilities at the daily rates of exchange, and (ii) purchases and sales of investment securities, dividend and interest income and certain expenses at the rates of exchange prevailing on the respective dates of such transactions. For financial reporting purposes, the Fund does not isolate changes in the exchange rate of investment securities from the fluctuations arising from changes in the market prices of securities. However, for Federal income tax purposes, the Fund does isolate and treat as ordinary income the effect of changes in foreign exchange rates on realized gain or loss from the sale of investment securities and payables and receivables arising from trade-date and settlement-date differences. |
Babson Capital Global Short Duration High Yield Fund 2012 Annual Report
NOTES TO THE FINANCIAL STATEMENTS (CONTINUED)
December 31, 2012
| | | |
| | J. | Counterparty Risk |
| | | |
| | The Fund helps manage counterparty credit risk by entering into agreements only with counterparties the Adviser believes have the financial resources to honor their obligations. The Adviser monitors the financial stability of the Fund’s counterparties. |
| | | |
| | K. | Recent Accounting Pronouncement |
| | | |
| | In December 2011, the Financial Accounting Standards Board issued Accounting Standards Update No. 2011-11 Disclosures about Offsetting Assets and Liabilities (“ASU 2011-11”) requiring disclosures of both gross and net information related to offsetting and related arrangements enabling users of the financial statement to understand the effect of those arrangements on the entity’s financial position. The objective of this disclosure is to facilitate comparison between those entities that prepare the financial statements on the basis of U.S. GAAP and those entities that prepare their financial statements on the basis of International Financial Reporting Standards. ASU 2011-11 is effective for public entities for interim and annual periods beginning on or after January 1, 2013. Adoption of ASU 2011-11 will have no effect on the Fund’s net assets. At this time, management is evaluating the impact ASU 2011-11 may have on the Fund’s financial statement disclosures. |
| | | |
| 3. | Advisory Fee |
| | |
| | The Fund has entered into an Investment Management Agreement (the “Agreement”) with the Adviser, a related party. Pursuant to the Agreement, the Fund has agreed to pay the Adviser a fee payable at the end of each calendar month, at an annual rate of 1.00% of the Fund’s average daily managed assets during such month. Managed assets are the total assets of the Fund, which include any assets attributable to leverage such as assets attributable to reverse repurchase agreements or bank loans, minus the sum of the Fund’s accrued liabilities (other than liabilities incurred for the purpose of leverage). Subject to the supervision of the Adviser and the Board, the Sub-Adviser manages the investment and reinvestment of a portion of the assets of the Fund, as allocated from time to time to the Sub-Adviser by a global allocation investment committee composed of representatives of the Adviser and Sub-Adviser. The Adviser (not the Fund) will pay a portion of the fees it receives to the Sub-Adviser in return for its services. |
| | |
| 4. | Administrator Fee |
| | |
| | The Fund has engaged U.S. Bancorp Fund Services, LLC (“US Bank”) to serve as the Fund’s administrator, fund accountant, and transfer agent. The Fund has engaged U.S. Bank, N.A. to serve as the Fund’s custodian. The Fund has agreed to pay US Bank a fee payable at the end of each calendar month, at an annual rate of 0.30% of the Fund’s average daily managed assets. |
| | |
| 5. | Income Taxes |
| | |
| | It is the Fund’s intention to qualify as a Registered Investment Company under sub-chapter M of the Internal Revenue Code and distribute all of its taxable income. Accordingly, no provision for federal income taxes is required in the financial statements. The tax character of dividends paid to shareholders during the tax year ended in 2012, as noted below, was as follows: |
| | | | | | | | | | |
| | | | | | | | Total | |
| | | | Net Long Term | | Distributions | |
| | Ordinary Income | | Capital Gains | | Paid | |
| | | | | | | | | | |
| | $ | 3,361,505 | | $ | - | | $ | 3,361,505 | |
| | |
| | The amount and character of income and capital gain distributions to be paid, if any, are determined in accordance with federal income tax regulations, which may differ from U.S. generally accepted accounting principles. Permanent book and tax basis differences resulted in the reclassifications of $155,944 to accumulated net investment income, $155,944 from accumulated net realized gain. |
| | |
| | The following information is provided on a tax basis as of December 31, 2012: |
| | Cost of investments | | $ | 573,258,100 | |
| | | | | | |
| | Unrealized appreciation | | | 12,624,307 | |
| | Unrealized depreciation | | | (1,262,088 | ) |
| | Net unrealized appreciation (depreciation) | | | 11,362,219 | |
| | | | | | |
| | Undistributed ordinary income | | | 539,870 | |
| | Undistributed long term gains | | | - | |
| | Distributable earnings | | | 539,870 | |
| | | | | | |
| | Other accumulated gain/(loss) | | | (2,463,651 | ) |
| | Total accumulated gain/(loss) | | | 9,438,438 | |
Babson Capital Global Short Duration High Yield Fund 2012 Annual Report
| | |
| | The Fund recognizes the tax benefits of uncertain tax positions only where the position is “more likely than not” to be sustained assuming examination by tax authorities. Management has analyzed the Fund’s tax positions, and has concluded that no liability for unrecognized tax benefits should be recorded related to uncertain tax positions taken on U.S. tax returns and state tax returns filed since inception of the Fund. No income tax returns are currently under examination. All tax years since commencement of operations remain subject to examination by the tax authorities in the United States. Due to the nature of the Fund’s investments, the Fund may be required to file income tax returns in several states. The Fund is not aware of any tax positions for which it is reasonably possible that the total amounts of unrecognized tax benefits will change materially in the next 12 months. |
| | |
| | At December 31, 2012, the Fund deferred, on a tax basis, post-October losses of $2,485,366. |
| | |
| 6. | Investment Transactions |
| | |
| | For the period from October 26, 2012 through December 31, 2012 the Fund purchased (at cost) and sold securities in the amount of $590,043,866 and $17,146,547 (excluding short term debt securities), respectively. |
| | |
| 7. | Credit Facility |
| | |
| | On November 8, 2012, the Fund entered into a $200 million credit facility with BNP Paribas Prime Brokerage International, Ltd (“BNP”). The credit facility has a variable annual interest rate equal to three-month LIBOR plus 0.90%. The credit facility is secured by the Fund’s assets. Unused portions of the credit facility will accrue a commitment fee equal to an annual rate of 0.65%. The Fund was given a 51 day grace period prior to the commitment fee accruing interest. |
| | |
| | The average principal balance and interest rate for the period during which the credit facility was utilized during the period from October 26, 2012 through December 31, 2012 was approximately $90,400,000 and 1.21%, respectively. At December 31, 2012, the principal balance outstanding was $100,000,000 at an interest rate of 1.21%. |
| | |
| 8. | Common Shares |
| | |
| | The Fund has unlimited shares authorized and 20,044,750 shares outstanding at December 31, 2012. Transactions in common shares for the period October 26, 2012 through December 31, 2012 were as follows: |
| | Shares at October 26, 2012 | | | | |
| | (commencement of operations) | | | 4,200 | |
| | | | | | |
| | Shares sold through initial public offering | | | 18,500,000 | |
| | | | | | |
| | Shares sold through additional offerings | | | 1,540,550 | |
| | | | | | |
| | Shares at December 31, 2012 | | | 20,044,750 | |
| | |
| 9. | Aggregate Remuneration Paid to Officers, Trustees and Their Affiliated Persons |
| | |
| | For the year ended December 31, 2012, the Fund paid it’s Trustees aggregate remuneration of $91,000. All of the Fund’s officers are employees of the Adviser. Pursuant to the Agreement the Fund does not compensate its officers who are employees of the Adviser (except the for the Chief Compliance Officer of the Fund unless assumed by the Adviser). For the year ended December 31, 2012, the Adviser paid the compensation of the Chief Compliance Officer of the Fund. |
| | |
| | The Fund did not make any payments to the Adviser for the year ended December 31, 2012, other than the amounts payable to the Adviser pursuant to the Agreement. |
| | |
| 10. | Subsequent Event |
| | |
| | The Fund has evaluated the possibility of subsequent events existing in this report through February 27, 2013. On January 2, 2013 the dividend payable of $3,361,505 was paid to common shareholders. In addition, on January 14, 2013 the Fund decreased the credit facility amount with BNP from $200,000,000 to $120,000,000. On January 30, 2013 the Fund increased the credit facility with BNP from $120,000,000 to $130,000,000. As of February 7, 2013 the current note payable is $130,000,000. The Fund has concluded no additional subsequent events through February 27, 2013 require recognition or disclosure. |
Babson Capital Global Short Duration High Yield Fund 2012 Annual Report
REPORT OF INDEPENDENT REGISTERED PUBLIC ACCOUNTING FIRM
| | | | | |
| | | | | |
| | | | KPMG LLP | |
| | | Two Financial Center | |
| | | 60 South Street | |
| | | Boston, MA 02111 | |
| | Report of Independent Registered Public Accounting Firm The Board of Trustees and Shareholders Babson Capital Global Short Duration High Yield Fund: We have audited the accompanying statement of assets and liabilities of Babson Capital Global Short Duration High Yield Fund (the Fund), including the schedule of investments, as of December 31, 2012, and the related statement of operations for the period then ended, the statements of changes in net assets for the period then ended, and the financial highlights for the period then ended. These financial statements and financial highlights are the responsibility of the Fund’s management. Our responsibility is to express an opinion on these financial statements and financial highlights based on our audits. We conducted our audits in accordance with the standards of the Public Company Accounting Oversight Board (United States). Those standards require that we plan and perform the audit to obtain reasonable assurance about whether the financial statements and financial highlights are free of material misstatement. An audit includes examining, on a test basis, evidence supporting the amounts and disclosures in the financial statements. Our procedures included confirmation of securities owned as of December 31, 2012, by correspondence with custodians and brokers or by other appropriate auditing procedures where replies from brokers were not received. An audit also includes assessing the accounting principles used and significant estimates made by management, as well as evaluating the overall financial statement presentation. We believe that our audits provide a reasonable basis for our opinion. In our opinion, the financial statements and financial highlights referred to above present fairly, in all material respects, the financial position of Babson Capital Global Short Duration High Yield Fund as of December 31, 2012, the results of its operations for the period then ended, the changes in its net assets for the period then ended, and the financial highlights for the period then ended, in conformity with U.S. generally accepted accounting principles. | |
| | | |
| | February 27, 2013 | |
| | | |
| | | KPMG LLP is a Delaware limited liability partnership, the U.S. member firm of KPMG International Cooperative (“KPMG International”), a Swiss entity. | |
| | | |
Babson Capital Global Short Duration High Yield Fund 2012 Annual Report
This page left intentionally blank.
Babson Capital Global Short Duration High Yield Fund 2012 Annual Report
| | Name (Age), Address | | Position(s)
Held
with Fund | | | Term of Office and
Length of Time Served | | | Principal Occupation(s)
During the Past 5 Years | | | Number of
Portfolios in
Fund Complex
Overseen by
Trustee | | | Other Directorships Held by
Trustee During Past 5 Years |
| | Rodney J. Dillman (60) 550 South Tryon Street Charlotte, NC 28202 | | Trustee | | | Indefinite / Since 2012 | | | Deputy General Counsel (2011-2012), Senior Vice President (2008-2012), Vice President (2000-2008), Massachusetts Mutual Life Insurance Company; Member of the Board of Directors and President (2008-2011), MassMutual International LLC; General Counsel (2006-2008), Babson Capital Management LLC (investment adviser). | | | 1 | | | Director (2008-2011), Compania de Seguros CorpVida S.A. (insurance company); Director (2009-2011), MassMutual Europe S.A. (insurance company); Director (2009-2010), Yingda Taihe Life Insurance Co.; Director (2008-2011), MassMutual Asia Limited (insurance company); Director(2008-2011), MassMutual Life Insurance Company; Director (2008-2010), MassMutual Mercuries Life Insurance Company; Director (2005-2010), The MassMutual Trust Company; Director (2006-2008), Jefferies Finance LLC (finance company); Director, Vice President and Secretary (2005-2008), MMHC Investment LLC (passive investor). |
| | | | | | | | | | | | | | | | |
| | Dr. Bernard A. Harris, Jr. (56) 550 South Tryon Street Charlotte, NC 28202 | | Trustee | | | Indefinite / Since 2012 | | | Chief Executive Officer and Managing Partner (since 2002), Vesalius Ventures, Inc.; Director and President(since 1998), The Space Agency; President (since 1999), The Harris Foundation; Clinical Scientist, Flight Surgeon and Astronaut (1986-1996), NASA. | | | 1 | | | Trustee (since 2011), Salient Midstream & MLP Fund and Salient MLP & Energy Infrastructure Fund; Trustee (since 2010), Salient Absolute Return Fund; Director (since 2009), Monebo Technologies Inc. (medical technology design company); Director (since 2008), US Physical Therapy (USPH: NYSE); Director (since 2012), E-Cardio, Inc. (provides services for cardiac monitoring). |
| | | | | | | | | | | | | | | | |
| | Thomas W. Okel (50) 550 South Tryon Street Charlotte, NC 28202 | | Trustee | | | Indefinite / Since 2012 | | | Executive Director (since 2011), Catawba Lands Conservancy; Global Head of Syndicated Capital Markets (1989-2010), Bank of America Merrill Lynch. | | | 1 | | | |
| | | | | | | | | | | | | | | | |
| | Martin A. Sumichrast (46) 550 South Tryon Street Charlotte, NC 28202 | | Trustee | | | Indefinite / Since 2012 | | | Managing Director (since 2002), Lomond International, Inc. | | | 1 | | | |
Babson Capital Global Short Duration High Yield Fund 2012 Annual Report
| | Name (Age), Address | | Position(s) Held
with Fund | | Term of Office and Length
of Time Served* | | Principal Occupation(s)
During the Past 5 Years |
| | Russell D. Morrison (48) 550 South Tryon Street Charlotte, NC 28202 | | President and Principal Executive Officer | | Indefinite/Since 2012 | | Head of the Global High Yield Investments Group (since 2010), Co-Head of U.S. Loan Team (2002-2010), Babson Capital. |
| | | | | | | | |
| | Patrick Hoefling (33) 550 South Tryon Street Charlotte, NC 28202 | | Chief Financial Officer and Principal Financial and Accounting Officer | | Indefinite/Since 2012 | | Member of Client and Portfolio Services team (since 2008), Babson Capital; Manager (2005-2008), Deloitte and Touche. |
| | | | | | | | |
| | Andrew Lennon (38) 550 South Tryon Street Charlotte, NC 28202 | | Treasurer | | Indefinite/Since 2013 | | Head of Client and Portfolio Services team, (since 2008), Babson Capital. |
| | | | | | | | |
| | Michael Freno (37) 550 South Tryon Street Charlotte, NC 28202 | | Vice President | | Indefinite/Since 2012 | | Member of U.S. High Yield Investments Group; co-portfolio manager for the Global Loan Fund and Global Senior Secured Bond Fund; member of Adviser’s High Yield Investment Committee (since 2010), Babson Capital. |
| | | | | | | | |
| | Sean Feeley (45) 550 South Tryon Street Charlotte, NC 28202 | | Vice President | | Indefinite/Since 2012 | | Member of U.S. High Yield Investment Committee (since 2010); lead portfolio manager for high yield bond total return strategies (since 2003), Babson Capital; Vice President (since 2011), Babson Capital Corporate Investors and Babson Capital Participation Investors (closed-end investment companies advised by Babson Capital). |
| * | Officers will hold their position with the Fund until a successor has been elected and qualified. Officers are generally elected annually by the Board. The officers were last elected on September, 14, 2012, with exception of Mr. Lennon who was elected on January 16, 2013. |
Babson Capital Global Short Duration High Yield Fund 2012 Annual Report
| | Name (Age), Address | | Position(s) Held
with Fund | | Term of Office and Length
of Time Served* | | Principal Occupation(s)
During the Past 5 Years |
| | Scott Roth (43) 550 South Tryon Street Charlotte, NC 28202 | | Vice President | | Indefinite/Since 2012 | | Member of U.S. High Yield Investment Committee (since 2010); lead portfolio manager for high yield bond total return strategies (since 2010), Babson Capital. |
| | | | | | | | |
| | Melissa LaGrant (39) 550 South Tryon Street Charlotte, NC 28202 | | Chief Compliance Officer | | Indefinite/Since 2012 | | Managing Director of Compliance and Risk Management group (since 2005), Babson Capital; Chief Compliance Officer (since 2006) of Babson Capital Corporate Investors and Babson Capital Participation Investors (closed-end investment companies advised by Babson Capital). |
| | | | | | | | |
| | Janice M. Bishop (48) 550 South Tryon Street Charlotte, NC 28202 | | Secretary/Chief Legal Officer | | Indefinite/Since 2012 | | Counsel (since 2007), Babson Capital; Associate Secretary (since 2008), Babson Capital Corporate Investors and Babson Capital Participation Investors (closed-end investment companies advised by Babson Capital). |
| | | | | | | | |
| | Michele Manha (40) 550 South Tryon Street Charlotte, NC 28202 | | Assistant Secretary | | Indefinite/Since 2012 | | Counsel (since 2008), Babson Capital. |
| * | Officers will hold their position with the Fund until a successor has been elected and qualified. Officers are generally elected annually by the Board. The officers were last elected on September, 14, 2012, with exception of Mr. Lennon who was elected on January 16, 2013. |
Babson Capital Global Short Duration High Yield Fund 2012 Annual Report
Babson Capital Global Short Duration High Yield Fund
Approval of Investment Management Agreement and Sub-Advisory Agreement
The Board of Trustees of the Fund approved the Investment Management Agreement between the Fund and Babson Capital Management LLC (“Babson Capital”), dated October 25, 2012 (the “Management Agreement”) and the Sub-Advisory Agreement between Babson Capital Management LLC and Babson Capital Global Advisors Limited (“BCGA”), dated October 25, 2012 (the “Sub-Advisory Agreement” and together with the Management Agreement, the “Agreements”) at a meeting held on October 17, 2012. In making their decision to approve the Agreements, the Trustees considered a number of factors, though they did not identify any particular factor that they considered determinative, and individual Trustees may have attributed different weights to the various factors. The factors considered by Trustees are described below.
At a meeting held on September 14, 2012, the Trustees heard from representatives of Babson Capital regarding the nature and scope of the services to be provided by Babson Capital and BCGA under the Management Agreement and Sub-Advisory Agreement, respectively. In this regard, the Trustees considered Babson Capital’s specific responsibilities in the day-to-day management of the Fund and discussed the qualifications, experience and responsibilities of the portfolio managers and other key personnel that would be involved in the day-to-day management of the Fund. The Board considered the capacity of the portfolio managers to manage the Fund’s assets and potentially additional assets. The Trustees concluded that Babson Capital and BCGA each have the personnel, resources, infrastructure, and investment methods necessary to perform its duties under the Management Agreement and Sub-Advisory Agreement, respectively.
The Trustees discussed the performance of Babson Capital and BCGA in managing strategies similar to those to be employed for the Fund as well as the performance of other funds managed by Babson Capital and BCGA, and the trading capabilities of Babson Capital. The Trustees concluded that the nature and overall quality of the management services to be provided pursuant to the Management Agreement and Sub-Advisory Agreement supported the approval of the Agreements.
The Trustees considered the investment management fee to be paid by the Fund to Babson Capital pursuant to the Management Agreement and the allocation of a portion of that fee to BCGA pursuant to the Sub-Advisory Agreement. The Trustees reviewed materials concerning advisory fees of other closed-end funds, including recently launched funds. The Trustees reviewed materials provided by Babson Capital describing fees paid by other similar accounts managed by Babson Capital, and noted that Babson Capital typically charges higher fees on its global accounts than on accounts that are invested primarily in domestic securities. The Trustees noted that for high-yield closed-end funds launched since 2006, the Fund’s management fee was below the average and median fees expressed as a percentage of net asset value. The Trustees reviewed information regarding Babson Capital’s estimated costs of managing the Fund, and the estimated profitability of the Agreements to Babson Capital and BCGA, both before and after expenses associated with the launch of the Fund. The Trustees concluded that the expected profitability of the Fund to Babson Capital and BCGA did not appear unreasonable in light of services to be rendered. The Trustees also considered potential “fall-out” benefits to Babson Capital as a result of its relationship with the Fund. The Trustees considered whether the proposed fees reflected economies of scale for the benefit of Fund investors, noting that there were no current plans to increase the Fund’s assets, except through leverage and investment performance, following its initial public offering.
After reviewing these and related factors, the Trustees concluded, within the context of their overall conclusion, that the fees to be paid under the Agreements supported approval of the Agreements.
After considering all of the information presented to them regarding the Agreements, the Trustees, at the October 17, 2012 meeting, unanimously voted to approve the Management Agreement and Sub-Advisory Agreement based on the factors discussed above.
Babson Capital Global Short Duration High Yield Fund 2012 Annual Report
| |
| INDEPENDENT TRUSTEES |
| |
| Rodney Dillman |
| Trustee |
| |
| Dr. Bernard Harris, Jr. |
| Trustee |
| |
| Thomas Okel |
| Trustee |
| |
| Martin Sumichrast |
| Trustee |
| |
| OFFICERS |
| |
| Russell Morrison |
President and Principal Executive Officer |
| |
| Patrick Hoefling |
Chief Financial Officer and Principal Financial |
| and Accounting Officer |
| |
| Andrew Lennon |
| Treasurer |
| |
| Michael Freno |
| Vice President |
| |
| Sean Feeley |
| Vice President |
| |
| Scott Roth |
| Vice President |
| |
| Melissa LaGrant |
| Chief Compliance Officer |
| |
| Janice Bishop |
| Secretary/Chief Legal Officer |
| |
| Michele Manha |
| Assistant Secretary |
The Fund offers a Dividend Reinvestment Plan (the “Plan”). The Plan provides a simple way for shareholders to add to their holdings in the Fund through the reinvestment of dividends in additional common shares of the Fund. Shareholders will have all dividends, including any capital gain dividends, reinvested automatically in additional shares of the Fund by U.S. Bancorp Fund Services, LLC, as Plan Agent, unless a shareholder elects to receive cash instead. An election to receive cash may be revoked or reinstated at the option of the shareholder. All distributions to investors who elect not to participate in the Plan (or whose broker or nominee elects not to participate on the investor’s behalf) will receive dividends and distributions in cash.
Whenever the Fund declares a dividend payable in cash or shares, the Plan Agent, acting on behalf of each participating shareholder, will take the dividend in shares only if the net asset value per Fund share is equal to or less than the market price per Fund share plus estimated brokerage commissions as of the payment date for the dividend.
When the dividend is to be taken in shares, the number of shares to be received is determined by dividing the dollar amount of the cash dividend by the net asset value per Fund share as of the dividend payment date or, if greater than the net asset value per Fund share, 95% of the closing share price on the payment date. Generally, if the net asset value per Fund share is greater than the market price per Fund share plus estimated brokerage commissions as of the dividend payment date, the Plan Agent will endeavor to buy shares on the open market at current prices promptly after the dividend payment date.
The reinvestment of dividends does not, in any way, relieve participating shareholders of any Federal, state or local tax. For Federal income tax purposes, the amount reportable in respect of a dividend received in shares of the Fund will be the fair market value of the shares received, which will be reportable as ordinary income and/or capital gains. Investors should consult with their own tax advisors for further information about the tax consequences of dividend reinvestment.
There is no brokerage charge for the reinvestment of dividends in additional Fund shares; however, all participants pay a pro rata share of brokerage commissions incurred by the Plan Agent when it makes open market purchases. There is no direct service charge to participants in the Plan, though the Fund reserves the right to amend the Plan to include a service charge payable by participants.
Additional information about the Plan may be obtained from, and any questions regarding the Plan should be addressed to, U.S. Bancorp Fund Services, Plan Agent for Babson Capital Global Short Duration High Yield Fund’s Dividend Reinvestment Plan, P.O. Box 701, Milwaukee, WI 52301.
Babson Capital Global Short Duration High Yield Fund 2012 Annual Report
BABSON CAPITAL GLOBAL SHORT DURATION HIGH YIELD FUND
When you use Babson Capital Management LLC (“Babson Capital”) as your investment adviser or invest in the Babson Capital Global Short Duration High Yield Fund (the “Fund”), you entrust us not only with your hard-earned assets but also with your personal and financial data. We consider your data to be private and confidential, and protecting its confidentiality is important to us. Our policies and procedures regarding your personal information are summarized below.
We may collect non-public personal information about you from:
| | | |
| | ■ | Applications or other forms, interviews, or by other means; |
| | | |
| | ■ | Consumer or other reporting agencies, government agencies, employers or others; |
| | | |
| | ■ | Your transactions with us, our affiliates, or others; and |
| | | |
| | ■ | Our Internet website. |
We may share the financial information we collect with our financial service affiliates, such as insurance companies, investment companies and securities broker-dealers. Additionally, so that we may continue to offer you products and services that best meet your investment needs and to effect transactions that you request or authorize, we may disclose the information we collect, as described above, to companies that perform administrative or marketing services on our behalf, such as transfer agents, custodian banks, service providers or printers and mailers that assist us in the distribution of investor materials or that provide operational support to Babson Capital entities. These companies are required to protect this information and will use this information only for the services for which we hire them, and are not permitted to use or share this information for any other purpose. Some of these companies may perform such services in jurisdictions other than the United States. We may share some or all of the information we collect with other financial institutions with whom we jointly market products. This may be done only if it is permitted in the state in which you live. Some disclosures may be limited to your name, contact and transaction information with us or our affiliates.
Any disclosures will be only to the extent permitted by federal and state law. Certain disclosures may require us to get an “opt-in” or “opt-out” from you. If this is required, we will do so before information is shared. Otherwise, we do not share any personal information about our customers or former customers unless authorized by the customer or as permitted by law.
We restrict access to personal information about you to those employees who need to know that information to provide products and services to you. We maintain physical, electronic and procedural safeguards that comply with legal standards to guard your personal information. As an added measure, we do not include personal or account information in non-secure e-mails that we send you via the Internet without your prior consent. We advise you not to send such information to us in non-secure e-mails.
This joint notice describes the privacy policies of Babson Capital and the Fund. It applies to all Babson Capital and the Fund accounts you presently have, or may open in the future, using your social security number or federal taxpayer identification number – whether or not you remain a shareholder of our Funds or as an advisory client of Babson Capital. As mandated by rules issued by the Securities and Exchange Commission, we will be sending you this notice annually, as long as you own shares in the Funds or have an account with Babson Capital.
October 2012
Babson Capital Global Short Duration High Yield Fund 2012 Annual Report
This page left intentionally blank.
Item 2. Code of Ethics.
The Registrant adopted a Code of Ethics for Senior Financials Officers (the “Code”) on October 17, 2012, which is available on the Registrant’s website at www.babsoncapital.com/bgh. During the period covered by this Form N-CSR, there were no amendments to, or waivers from, the Code.
Item 3. Audit Committee Financial Expert.
The Registrant’s Board of Trustees has determined that Dr. Bernard A. Harris, Jr., Mr. Rodney J. Dillman, Mr. Thomas W. Okel and Mr. Martin A. Sumichrast, constituting all the members of the Registrant’s Audit Committee, are audit committee financial experts. Mr. Harris, Mr. Dillman, Mr. Okel and Mr. Sumichrast are “independent” for purposes of this Item 3 as required by applicable regulation.
Item 4. Principal Accountant Fees and Services.
| Fees Billed to the Registrant: | | KPMG LLP | |
| | | Year Ended | |
| | | December 12, 2012 |
| Audit Fees | | $ | 7,800 | |
| Audit-Related Fees | | | 0 | |
| Tax Fees* | | | 14,000 | |
| All Other Fees | | | 0 | |
| Total Fees | | $ | 21,800 | |
Non-Audit Fees Billed to Babson Capital and MassMutual: | | KPMG LLP | | | KPMG LLP | |
| | | Year Ended | | | Year Ended | |
| | | December 21, 2012 | | December 31, 2011 |
| Audit-Related Fees | | $ | 55,375 | | | $ | 106,675 | |
| Tax Fees | | | 73,100 | | | | 9,000 | |
| All Other Fees | | | 0 | | | | 0 | |
| Total Fees | | $ | 128,475 | | | $ | 115,675 | |
The category "Audit-Related Fees" reflects fees billed by KPMG for various non-audit and non-tax services rendered to the Registrant and Babson Capital Management LLC ("Babson Capital"), such as SAS 70 review, IFRS consulting and agreed upon procedures reports. Preparation of Federal, state and local income tax returns and tax compliance work are representative of the fees reported in the "Tax Fees" category. The category "All Other Fees" represents fees billed by KPMG for consulting rendered to Babson Capital and MassMutual.
Item 5. Audit Committee of Listed Registrants.
The Registrant maintains an Audit Committee composed exclusively of Trustees of the Registrant who qualify as “independent” Trustees under the current listing standards of the New York Stock Exchange and the rules of the U.S Securities and Exchange Commission. The Audit Committee operates pursuant to a written Audit Committee Charter, which is available (1) on the Registrant’s website, www.babsoncapital.com/bgh, and (2) without charge, upon request, by calling, toll-free 1-866-399-1516. The current members of the Audit Committee are Dr. Bernard A. Harris, Rodney J. Dillman, Thomas W. Okel and Martin A. Sumichrast.
Item 6. Investments.
A schedule of investments for the Registrant is included as part of this report to shareholders under Item 1 of this Form N-CSR.
Item 7. Disclosure of Proxy Voting Policies and Procedures for Closed-End Management Investment Companies.
The Registrant’s Board of Trustees has delegated proxy voting responsibilities relating to the voting securities held by the Registrant to its investment adviser, Babson Capital Management LLC (“Babson Capital”). A summary of Babson Capital’s proxy voting policies and procedures are set forth below.
Summary of Babson Capital’s Proxy Voting Policy:
Babson Capital views the voting of proxies as an integral part of its investment management responsibility and believes, as a general principle, that proxies should be acted upon (voted or abstained) solely in the best interest of its clients (i.e. in a manner it believes is most likely to enhance the economic value of the underlying securities held in client accounts). To implement this general principle, Babson Capital engages a proxy service provider (the “Service Provider”) that is responsible for processing and maintaining records of proxy votes. In addition, the Service Provider will retain the services of an independent third party research provider (the “Research Provider”) to provide research and recommendations on proxies. Babson Capital’s Proxy Voting Policy is generally to vote proxies in accordance with the recommendations of the Research Provider. In circumstances where the Research Provider has not provided recommendations with respect to a proxy, Babson Capital will vote in accordance with the Research Provider’s proxy voting guidelines (the “Guidelines”). In circumstances where the Research Provider has not provided a recommendation or has not contemplated an issue within its Guidelines, the proxy will be analyzed on a case-by-case basis.
Babson Capital recognizes that there may be times when it is in the best interest of clients to vote proxies (i) against the Research Provider’s recommendations or (ii) in instances where the Research Provider has not provided a recommendation vote against the Guidelines. Babson Capital can vote, in whole or in part, against the Research Provider’s recommendations or Guidelines, as it deems appropriate. The procedures set forth in the Proxy Voting Policy are designed to ensure that votes against the Research Provider’s recommendations or Guidelines are made in the best interests of clients and are not the result of any material conflict of interest (a “Material Conflict”). For purposes of the Proxy Voting Policy, a Material Conflict is defined as any position, relationship or interest, financial or otherwise, of Babson Capital or a Babson Capital associate that could reasonably be expected to affect the independence or judgment concerning proxy voting.
Summary of Babson Capital’s Proxy Voting Procedures:
Babson Capital will vote all client proxies for which it has proxy voting discretion, where no Material Conflict exists, in accordance with the Research Provider’s recommendations or Guidelines, unless (i) Babson Capital is unable or determines not to vote a proxy in accordance with the Proxy Voting Policy or (ii) an authorized investment person or designee (a “Proxy Analyst”) determines that it is in the client’s best interests to vote against the Research Provider’s recommendations or Guidelines. In such cases where a Proxy Analyst believes a proxy should be voted against the Research Provider’s recommendations or Guidelines, Proxy Administrator will vote the proxy in accordance with the Proxy Analyst’s recommendation as long as (i) no other Proxy Analyst disagrees with such recommendation and (ii) no known Material Conflict is identified by the Proxy Analyst(s) or the Proxy Administrator. If a Material Conflict is identified by a Proxy Analysis or the Proxy Administrator, the proxy will be submitted to the Trading Practices Committee to determine how the proxy is to be voted in order to achieve that client’s best interests.
No associate, officer, director or board of managers/directors of Babson Capital or its affiliates (other than those assigned such responsibilities under the Proxy Voting Policy) can influence how Babson Capital votes client proxies, unless such person has been requested to provide assistance by a Proxy Analyst or Trading Practices Committee member and has disclosed any known Material Conflict. Pre-vote communications are prohibited. In the event that pre-vote communications occur, it should be reported to the Trading Practices Committee or Babson Capital’s Chief Compliance Officer or General Counsel prior to voting. Any questions or concerns regarding proxy-solicitor arrangements should be addressed to Babson Capital’s Chief Compliance Officer and/or General Counsel.
Investment management agreements generally delegate the authority to vote proxies to Babson Capital in accordance with Babson Capital’s Proxy Voting Policy. In the event an investment management agreement is silent on proxy voting, Babson Capital should obtain written instructions from the client as to their voting preference. However, when the client does not provide written instructions as to their voting preferences, Babson Capital will assume proxy voting responsibilities. In the event that a client makes a written request regarding voting, Babson Capital will vote as instructed.
Obtaining a Copy of the Proxy Voting Policy:
Clients may obtain a copy of Babson Capital’s Proxy Voting Policy and information about how Babson Capital voted proxies related to their securities, free of charge, by contacting the Chief Compliance Officer, Babson Capital Management LLC, 1500 Main Street, Suite 2800, P.O. Box 15189, Springfield, MA 01115-5189, or calling toll-free, 1-877-766-0014.
Item 8. Portfolio Managers of Closed-End Management Investment Companies.
The following disclosure item is made as of the date of this Form N-CSR unless otherwise indicated.
PORTFOLIO MANAGER. Russell D. Morrison serves as President of the Registrant (since 2012) and as one of its Portfolio Managers. With over 22 years of industry experience, Mr. Morrison is head of Babson Capital’s Global High Yield Investments Group (since 2009). He joined Babson Capital in 2002 and previously served as co-head of the U.S. Bank Loan Group. Since 2002, Mr. Morrison has focused on research, portfolio management and trading for U.S. and European bonds, loans and structured credit. Prior to joining Babson Capital, he was a Vice President at First Union Securities, Inc., a Manager in Ernst & Young’s Management Consulting Group and an accountant at North Carolina National Bank. Mr. Morrison holds a B.S. from Wake Forest University and an M.B.A. from Carnegie Mellon University’s Graduate School of Industrial Administration.
PORTFOLIO MANAGEMENT TEAM. Mr. Morrison has primary responsibility for overseeing the investments of the Registrant’s portfolio, with the day-to-day investment management responsibility of the Registrant’s portfolio being shared with the following Babson Capital and Babson Capital Europe investment professional (together with the Portfolio Manager, the “Portfolio Team”).
Sean Feeley serves as a Vice President of the Registrant (since 2012). Mr. Feeley is a Managing Director of Babson Capital and head of the High Yield Research Team with over 23 years of industry experience in high yield bonds and loans in various investment strategies. Prior to joining Babson Capital in 2003, he was a Vice President at Cigna Investment Management in project finance and a Vice President at Credit Suisse in leveraged loan finance. He also currently serves as a Vice President of Babson Capital Corporate Investors and Babson Capital Participation Investors, both closed-end investment companies managed by Babson Capital. Mr. Feeley holds a B.S. from Canisius College and an M.B.A. from Cornell University. Mr. Feeley is a Certified Public Accountant (inactive) and a Chartered Financial Analyst.
Michael Freno serves as a Vice President of the Registrant (since 2012). With over 13 years of industry experience, Mr. Freno is a head of Babson Capital’s Loan Total Returns Fund. He joined Babson Capital in 2005. Prior to joining Babson Capital, he served as a research analyst at Mangan & McColl Partners, LLC and a Manager a PricewaterhouseCoopers. He holds a B.A. from Furman University and an M.B.A from Wake Forest Babcock School of Business.
Kam Tugnait serves as a Vice President of the Registrant (since 2012). With over 20 years of experience, he is a Managing Director of Babson Capital Europe Limited (“Babson Capital Europe), parent of Babson Capital Global Advisors Limited (“BCGA”). He joined Babson Capital Europe in 2011 and currently manages the European high yield funds. Prior to joining Babson Capital Europe, he worked a Gatmore, managing the Gatmore Corporate High Yield Bond Fund, Head of High Yield at Standard Bank and the United Bank of Kuwait. He holds an M.A. from Cambridge University and is a member of the Institute of Chartered Accountants, England & Wales.
Zak Summerscale serves as a Vice President of the Registrant (since 2012). He is Chief Investment Officer of European High Yield of Babson Capital Europe, parent of BCGA. He joined Babson Capital Europe in 2001 and has direct portfolio management responsibility for several of Babson Capital Europe’s strategies. Prior to joining Babson Capital, Mr. Summerscale was Portfolio Manager at Flag Asset Management. Prior to Flag Asset Management, he held various positions at the United Bank of Kuwait and as an ACA for Ernst & Young. He holds a B.A. from Durham University.
OTHER ACCOUNTS MANAGED BY THE PORTFOLIO MANAGEMENT TEAM.
| | | | | | | NUMBER OF | | | | |
| | | | | | | ACCOUNTS | | APPROXIMATE | | |
| | | | | TOTAL | | WITH | | ASSET SIZE OF | | |
| | | | | NUMBER | | APPROXIMATE | | PERFORMANCE- | | PERFORMANCE- |
| PORTFOLIO | | ACCOUNT | | OF | | TOTAL ASSET | | BASED | | BASED ADVISORY |
| TEAM | | CATEGORY | | ACCOUNTS | | SIZE (A) | | ADVISORY FEE | | FEE ACCOUNTS (A) |
| | | Registered | | | | | | | | |
| Russell D. | | Investment | | 0 | | N/A | | 0 | | N/A |
| Morrison (B)(C) | | Companies | | | | | | | | |
| | | Other Pooled | | | | | | | | |
| | | Investment | | 17 | | $6,325,062,115 | | 17 | | $6,325,062,115 |
| | | Vehicles | | | | | | | | |
| | | Other | | | | | | | | |
| | | Accounts | | 1 | | $1,006,060,532 | | 0 | | N/A |
| | | Registered | | | | | | | | |
| Sean | | Investment | | 4 | | $755,012,907 | | 0 | | N/A |
| Feeley (B) | | Companies | | | | | | | | |
| | | Other Pooled | | | | | | | | |
| | | Investment | | 3 | | $1,865,266,835 | | 3 | | $1,865,266,835 |
| | | Vehicles | | | | | | | | |
| | | Other | | | | | | | | |
| | | Accounts (D) | | 2 | | $202,842,873 | | 0 | | N/A |
| | | Registered | | | | | | | | |
| Michael (B) | | Investment | | 0 | | N/A | | 0 | | N/A |
| Freno | | Companies | | | | | | | | |
| | | Other Pooled | | | | | | | | |
| | | Investment | | 4 | | $219,667,359 | | 4 | | $219,667,359 |
| | | Vehicles | | | | | | | | |
| | | Other | | | | | | | | |
| | | Accounts | | 2 | | $116,844,355 | | 0 | | N/A |
| | | Registered | | | | | | | | |
| Kam | | Investment | | 0 | | N/A | | 0 | | N/A |
| Tugnait (E) | | Companies | | | | | | | | |
| | | Other Pooled | | | | | | | | |
| | | Investment | | 0 | | N/A | | 0 | | N/A |
| | | Vehicles | | | | | | | | |
| | | Other | | | | | | | | |
| | | Accounts | | 0 | | N/A | | 0 | | N/A |
| | | | | | | | | | | |
| | | Registered | | | | | | | | |
| Zak | | Investment | | 0 | | N/A | | 0 | | N/A |
| Summerscale (E) | | Companies | | | | | | | | |
| | | Other Pooled | | | | | | | | |
| | | Investment | | 0 | | N/A | | 0 | | N/A |
| | | Vehicles | | | | | | | | |
| | | Other | | | | | | | | |
| | | Accounts | | 1 | | $102,005,404 | | 0 | | N/A |
| | (A) | Account asset size has been calculated as of December 31, 2012. |
| | (B) | Represents accounts advised by Babson Capital over which Mr. Morrison, Mr. Feeley or Mr. Freno have day-to-day management responsibilities. |
| | (C) | Mr. Morrison, as head of Babson Capital’s Global High Yield Investments Group, has overall responsibility for all senior secured loans and high yield bonds in a variety of structures, including structured vehicles, commingled funds, separate accounts and other vehicles managed by Babson Capital. Except for the accounts noted in the table above, Mr. Morrison is not primarily responsible for the day-to-day management of the other accounts managed by Babson Capital’s Global High Yield Investments Group. |
| | (D) | Mr. Feeley manages the high yield sector of the general investment account of Massachusetts Mutual Life Insurance Company and C.M. Life Insurance Company; however, these assets are not represented in the table above. |
| | (E) | Represents accounts advised by BCGA over which Mr. Tugnait and Mr. Summerscale have day-to-day management responsibilities. |
MATERIAL CONFLICTS OF INTEREST. The potential for material conflicts of interest may exist as the members of the Portfolio Management Team have responsibilities for the day-to-day management of multiple advisory accounts. These conflicts may be heightened to the extent the individual, Babson Capital and/or an affiliate has an investment in one or more of such accounts. Babson Capital has identified (and summarized below) areas where material conflicts of interest are most likely to arise, and has adopted policies and procedures that it believes are reasonable to address such conflicts.
Transactions with Affiliates: Babson Capital or its affiliates, including MassMutual and its affiliates, may from time to time, acting as principal, buy securities or other investments for itself from or sell securities or other investments it owns to its advisory clients. Likewise, Babson Capital may either directly or on behalf of MassMutual, purchase and/or hold securities or other investments that are subsequently sold or transferred to advisory clients. Babson Capital has a conflict of interest in connection with a transaction where it or an affiliate is acting as principal since it may have an incentive to favor itself or its affiliates over its advisory clients in connection with the transaction. To address these conflicts of interest, Babson Capital has adopted a Transactions with Affiliates Policy, which ensures any such transaction is consistent with Babson Capital’s fiduciary obligations to act in the best interests of its clients, including its ability to obtain best execution in connection with the transaction, and is in compliance with applicable legal and regulatory requirements.
Cross Trades: Babson Capital may effect cross-trades on behalf of its advisory clients whereby one advisory client buys securities or other investments from or sells securities or other investments to another advisory client. Babson Capital may also effect cross-transactions involving advisory accounts or funds in which it or its affiliates, including MassMutual, and their respective employees, have an ownership interest or for which Babson Capital is entitled to earn a performance or incentive fee. As a result, Babson Capital has a conflict of interest in connection with the cross-transaction since it may have an incentive to favor the advisory client or fund in which it or its affiliate has an ownership interest and/or is entitled to a performance or incentive fee. To address these conflicts of interest, Babson Capital has adopted a Transactions with Affiliates Policy, which ensures any such cross-transaction is consistent with Babson Capital’s fiduciary obligations to act in the best interests of each of its advisory clients, including its ability to obtain best execution for each advisory client in connection with the cross-trade transaction, and is in compliance with applicable legal and regulatory requirements. Babson Capital will not receive a commission or any other remuneration (other than its advisory fee) for effecting cross-transactions between advisory clients.
Loan Origination Transactions: While Babson Capital or its affiliates generally do not act as an underwriter or member of a syndicate in connection with a securities offering, Babson Capital or its affiliates (or an unaffiliated entity in which Babson Capital or its affiliates has an ownership interest) may act as an underwriter, originator, agent, or member of a syndicate in connection with the origination of senior secured loans or other lending arrangements with borrowers, where such loans may be purchased by Babson Capital advisory clients during or after the original syndication. Babson Capital advisory clients may purchase such loans directly from Babson Capital or its affiliates (or an unaffiliated entity in which Babson Capital or its affiliates has an ownership interest) or from other members of the lending syndicate. Babson Capital or its affiliates may directly or indirectly receive underwriting, origination, or agent fees in connection with such loan originations. As a result, Babson Capital has a conflict of interest in connection with such loan origination transactions since it has an incentive to base its investment recommendation to its advisory clients on the amount of compensation, underwriting, origination or agent fees it would receive rather than on its advisory clients’ best interests. To address this conflict of interest, Babson Capital has adopted a Transactions with Affiliates Policy, which ensures any such transaction is consistent with Babson Capital’s fiduciary obligations to act in the best interests of its clients, including its ability to obtain best execution in connection with the transaction, and is in compliance with applicable legal and regulatory requirements.
MML Investors Services, LLC (“MMLISI”), an indirect wholly-owned subsidiary of MassMutual, is an SEC-registered investment adviser and broker-dealer that may act as an introducing broker for the purpose of effecting securities transactions for brokerage customers. While a Babson Capital advisory client could request that MMLISI effect securities transactions for it that would result in commissions to MMLISI, currently no Babson Capital advisory client directs Babson Capital to effect securities transactions for its account through MMLISI.
Investments by Advisory Clients: Babson Capital may invest client assets in securities or other investments that are also held by (i) Babson Capital or its affiliates, including MassMutual, (ii) other Babson Capital advisory accounts, (iii) funds or accounts in which Babson Capital or its affiliates or their respective employees have an ownership or economic interest or (iv) employees of Babson Capital or its affiliates. Babson Capital may also, on behalf of its advisory clients, invest in the same or different securities or instruments of issuers in which (i) Babson Capital or its affiliates, including MassMutual, (ii) other Babson Capital advisory accounts, (iii) funds or accounts in which Babson Capital, its affiliates, or their respective employees have an ownership or economic interest or (iv) employees of Babson Capital or its affiliates, have an ownership interest as a holder of the debt, equity or other instruments of the issuer. Babson Capital has a conflict of interest in connection with any such transaction since investments by its advisory clients may directly or indirectly benefit Babson Capital and/or its affiliates and employees by potentially increasing the value of the securities or instruments it holds in the issuer. Any investment by Babson Capital on behalf of its advisory clients will be consistent with its fiduciary obligations to act in the best interests of its advisory clients, and otherwise be consistent with such clients’ investment objectives and restrictions.
Babson Capital or its affiliates may also recommend that clients invest in registered or unregistered investment companies, including private investment funds such as hedge funds, private equity funds or structured funds (i) advised by Babson Capital or an affiliate, (ii) in which Babson Capital, an affiliate or their respective employees has an ownership or economic interest or (iii) with respect to which Babson Capital or an affiliate has an interest in the entity entitled to receive the fees paid by such funds. Babson Capital has a conflict of interest in connection with any such recommendation since it may have an incentive to base its recommendation to invest in such investment companies or private funds on the fees that Babson Capital or its affiliates would earn as a result of the investment by its advisory clients in the investment companies or private funds. Any recommendation to invest in a Babson Capital advised fund or other investment company will be consistent with Babson Capital’s fiduciary obligations to act in the best interests of its advisory clients, consistent with such clients’ investment objectives and restrictions. Babson Capital may, in certain limited circumstances, offer to clients that invest in private investment funds that it advises an equity interest in entities that receive advisory fees and carried profits interest from such funds.
Employee Co-Investment: Babson Capital may permit certain of its portfolio managers and other employees to invest in private investment funds advised by Babson Capital or its affiliates and/or share in the performance or incentive fees received by Babson Capital from such funds. If the portfolio manager or other employee was responsible for both the portfolio management of the private fund and other Babson Capital advisory accounts, such person would have a conflict of interest in connection with investment decisions since the person may have an incentive to direct the best investment ideas, or to allocate trades, in favor of the fund in which he or she is invested or otherwise entitled to share in the performance or incentive fees received from such fund. To address these conflicts of interest, Babson Capital has adopted a Side by Side Management of Private Investment Funds and Other Advisory Accounts Policy which requires, among others things, that Babson Capital treat each of its advisory clients in a manner consistent with its fiduciary obligations and prohibits Babson Capital from favoring any particular advisory account as a result of the ownership or economic interests of Babson Capital, its affiliates or employees, in such advisory account. Any investment by a Babson Capital employee in one of its private funds is also governed by Babson Capital’s Employee Co-Investment Policy, which ensures that any co-investment by a Babson Capital employee is consistent with Babson Capital’s Code of Ethics, as summarized above.
Management of Multiple Accounts: As noted above, Babson Capital’s portfolio managers are often responsible for the day-to-day management of multiple accounts, including, among others, separate accounts for institutional clients, closed-end and open-end registered investment companies, and/or private investment funds (such as hedge funds, private equity funds and structured funds), as well as for proprietary accounts of Babson Capital and its affiliates, including MassMutual and its affiliates. The potential for material conflicts of interest exist whenever a portfolio manager has responsibility for the day-to-day management of multiple advisory accounts. These conflicts may be heightened to the extent a portfolio manager is responsible for managing a proprietary account for Babson Capital or its affiliates or where the portfolio manager, Babson Capital and/or an affiliate has an investment in one or more of such accounts or an interest in the performance of one or more of such accounts (e.g., through the receipt of a performance or incentive fee).
Investment Allocation: Such potential conflicts include those relating to allocation of investment opportunities. For example, it is possible that an investment opportunity may be suitable for more than one account managed by Babson Capital, but may not be available in sufficient quantities for all accounts to participate fully. Similarly, there may be limited opportunity to sell an investment held by multiple accounts. A conflict arises where the portfolio manager has an incentive to treat an account preferentially because the account pays Babson Capital or its affiliates a performance-based fee or the portfolio manager, Babson Capital or an affiliate has an ownership or other economic interest in the account. As noted above, Babson Capital also acts as an investment manager for certain of its affiliates, including MassMutual. These affiliate accounts co-invest jointly and concurrently with Babson Capital’s other advisory clients and therefore share in the allocation of such investment opportunities. To address these conflicts of interest associated with the allocation of trading and investment opportunities, Babson Capital has adopted an Investment Allocation Policy and trade allocation procedures that govern the allocation of portfolio transactions and investment opportunities across multiple advisory accounts, including affiliated accounts, which are summarized below under Item 12 – Brokerage Practices, Investment Allocation Policy. In addition, as noted above, to address these conflicts of interest, Babson Capital has adopted a Side by Side Management of Private Investment Funds and Other Advisory Accounts Policy which requires, among others things, that Babson Capital treat each of its advisory clients in a manner consistent with its fiduciary obligations and prohibits Babson Capital from favoring any particular advisory account as a result of the ownership or economic interests of Babson Capital, its affiliates or employees, in such advisory accounts. Any investment by a Babson Capital employee in one of its private funds is also governed by Babson Capital’s Employee Co-Investment Policy, which ensures that any co-investment by a Babson Capital employee is consistent with Babson Capital’s Code of Ethics, as summarized above.
Personal Securities Transactions; Short Sales: Potential material conflicts of interest may also arise related to the knowledge and timing of an account’s trades, investment opportunities and broker selection. Babson Capital and its portfolio managers have information about the size, timing and possible market impact of the trades of each account they manage. It is possible that portfolio managers could use this information for their personal advantage and/or to the advantage or disadvantage of various accounts which they manage. For example, a portfolio manager could, or cause a favored account to, “front run” an account’s trade or sell short a security for an account immediately prior to another accounts sale of that security. To address these conflicts, Babson Capital has adopted policies and procedures, including a Short Sales Policy, which ensures that the use of short sales by Babson Capital is consistent with Babson Capital’s fiduciary obligations to its clients, a Side by Side Management of Private Investment Funds and Other Advisory Accounts Policy, which requires, among other things, that Babson Capital treat each of its advisory clients in a manner consistent with its fiduciary obligations and prohibits Babson Capital from favoring any particular account as a result of the ownership or economic interest of Babson Capital, its affiliates or employees and a Code of Ethics, as summarized above.
Trade Errors: Potential material conflicts of interest may also arise if a trade error occurs in a client account. A trade error is deemed to occur if there is a deviation by Babson Capital from the applicable standard of care in connection with the placement, execution or settlement of a trade for an advisory account that results in (1) Babson Capital purchasing securities not permitted or authorized by a client’s investment advisory agreement or otherwise failing to follow a client’s specific investment directives; (2) Babson Capital purchasing or selling the wrong security or the wrong amount of securities on behalf of a client’s account; or (3) Babson Capital purchasing or selling securities for, or allocating securities to, the wrong client account. When correcting these errors, conflicts of interest between Babson Capital and its advisory accounts may arise as decisions are made on whether to cancel, reverse or reallocate the erroneous trades. In order to address these conflicts, Babson Capital has adopted an Errors Policy governing the resolution of trading errors, and will follow the Errors Policy in order to ensure that trade errors are handled promptly and appropriately and that any action taken to remedy an error places the interest of a client ahead of Babson Capital’s interest.
Best Execution; Directed Brokerage: With respect to securities transactions for most of the accounts it manages, Babson Capital determines which broker to use to execute each order, consistent with its fiduciary duty to seek best execution of the transaction. Babson Capital manages certain accounts, however, for clients who limit its discretion with respect to the selection of brokers or direct it to execute such client’s transaction through a particular broker. In these cases, trades for such an account in a particular security may be placed separately from, rather than aggregated with, those in the same security for other accounts. Placing separate transaction orders for a security may temporarily affect the market price of the security or otherwise affect the execution of the transaction to the possible detriment of one or more of the other account(s) involved. Babson Capital has adopted a Best Execution Policy and a Directed Brokerage Policy which are summarized below under Item 12 – Brokerage Practices, Broker Selection/Recommendations and Directed Brokerage.
Babson Capital and its portfolio managers or employees may have other actual or potential conflicts of interest in managing an advisory account, and the list above is not a complete description of every conflict of interest that could be deemed to exist.
COMPENSATION.
Babson Capital (Investment Adviser):
The size of BCM’s investment staff and the ages of its senior personnel are such that retirement and attrition should not have an adverse impact on BCM's performance. Accordingly, BCM continues to employ talented analysts who are progressing to provide competent replacements for more senior personnel as the need arises. BCM remains committed to improving the professional status of its investment professionals through the Chartered Financial Analysts program, a program which BCM encourages its professional staff to enroll in and complete.
BCM’s compensation and incentive program was developed to attract, motivate and retain high-performing individuals. Our culture is one that attracts and retains exceptional people who possess shared values. We pride ourselves on valuing, recognizing, and rewarding the distinct contributions of each associate. The program applies to all associates of the Adviser.
To help BCM make informed compensation decisions, BCM participates in annual compensation surveys of investment management firms using McLagan/Aon-Hewitt in addition to other industry specific resources. The firms selected for periodic peer-group comparisons typically have similar asset size or business mix. An annual review is conducted of total compensation versus market to ensure that individual pay is competitive with the defined overall market.
The following are the key principles of BCM’s compensation philosophy: (i) foster a strong performance-oriented environment while maintaining high ethical and integrity standards; (ii) establish aggressive goals for short and long-term strategic plans; (iii) measure Adviser performance against both internal goals and external benchmarks; (iv) differentiate pay for individuals based on performance; and (v) create a competitive compensation platform (for sustained profitable growth).
The compensation package for BCM portfolio managers is comprised of a market-driven base salary, a performance-driven annual bonus, and discretionary long-term incentives. The performance-driven annual bonus is based on the overall performance of BCM as well as the performance of the accounts managed by the portfolio managers relative to appropriate benchmarks, including with respect to the Fund, to the Russell 2000 Index and the Bank of America/Merrill Lynch Global Non-Financial High Yield Constrained Index. Performance of the Fund, as with other accounts, is evaluated on a pre-tax basis, and is reviewed over one and three-year periods, with greater emphasis given to the latter. There are other factors that affect bonus awards to a lesser extent, such as client satisfaction, teamwork, employee individual performance in relation to pre-determined goals and the assets under management. Such factors are considered as a part of the overall annual bonus evaluation process by the management of BCM.
Long-term incentives are designed to share with participants the longer-term value created in BCM. Long-term incentives may take the form of deferred cash awards (including deferred cash awards that provide a portfolio manager with the economic equivalent of a "shareholder" interest in BCM by linking the value of the award to a formula which is meant to represent the value of the business) and/or, in the case of a portfolio manager who manages a private investment fund with a performance fee, a deferred cash award or a direct profit sharing interest that results in the portfolio manager receiving amounts based on the amount of the performance fee paid by such fund. These long-term incentives vest over time and are granted annually, based upon the same criteria used to determine the performance-driven annual bonus detailed above. Because portfolio managers are generally responsible for multiple accounts (including the Fund), they are compensated on the overall performance of the accounts that they manage, rather than a specific account, except for the portion of compensation relating to any performance fee award.
BCGA (Sub-Adviser):
On March 29, 2012, BCGA and BCE entered into a services agreement pursuant to which BCE agreed to provide personnel services to BCGA (including the secondment of investment staff on a part-time basis) sufficient to enable BCGA to carry on its business (including to discharge its obligations under the Sub-Advisory Agreement). A summary of BCE’s employee remuneration structures appears below:
BCE’s remuneration structures are designed to support and further the firm’s business strategy, objectives, values and long-term interests. Packages aim to facilitate the retention of existing employees and attract high calibre new employees in order to achieve the best results for the firm and its clients. As a result, packages offered should be competitive with those available to professionals working in London in relevant areas (including banking, private equity, asset management, corporate finance advisory, law and accounting).
Remuneration Components:
Remuneration arrangements for employees currently comprise some or all of the following components:
(a) fixed salary;
(b) awards under the short-term incentive scheme (“STI”);
(c) awards under the long-term incentive scheme (“LTI”); and
(d) share of carried interest in certain funds (“Carried Interest”).
Fixed Salary:
All employees receive a fixed salary, payable in monthly instalments. Fixed salary comprises a pensionable and a non-pensionable element. The non-pensionable component is initially identified in the relevant employee’s employment contract. Fixed salaries (and the proportions of which are pensionable and non-pensionable) are reviewed from time to time.
Fixed salary for an earnings year is determined following the completion of the end-of-year appraisals for the previous year. Staff are notified of any change to their fixed salary in February, with any changes being backdated to the start of the earnings year.
Short-Term Incentive Scheme:
All employees are eligible to be considered for an STI award each year. While STI awards may be made in non-cash form, all awards have been made in cash to date. Awards are determined following the completion of the end-of-year appraisals for the earnings year to which they correspond and are based on performance measurement, taking into account the profits generated by the firm. Staff who have been awarded an STI award are generally notified in February of their award. The award is typically paid within 2 weeks of staff being notified, following the finalization of BCE’s accounts. Leavers generally forfeit any STI that has been awarded but not yet paid.
Long-Term Incentive Scheme:
LTI awards are used to reward and retain employees that senior management consider are key to BCE’s business. All employees are eligible to be considered for an LTI award each year. Awards are based on performance measurement, taking into account the profits generated by the firm. LTI awards are entirely made in non-cash form.
BCE’s LTI scheme broadly mirrors the equivalent scheme operated by BCM, whereby beneficiaries are notified in February (following the relevant earnings year) of the amount of the award that will be made to them in July. Prior to July of that year, recipients of LTI awards are asked to express a preference as to how they would like their award to be allocated (they may track one or more of a prescribed range of reference assets, including a notional BCM share price, a term deposit rate, individual funds managed by BCE and various external funds). Awards are then made in July, with payments in respect of those awards (as adjusted for the performance of the selected reference assets) being made in four equal annual instalments, commencing on the first anniversary of the award date. As with STI, leavers generally forfeit any outstanding LTI.
Carried Interest:
Carried Interest is only relevant to funds which pay an incentive fee to BCE in its capacity as investment manager. Proposals regarding the allocation of Carried Interest are made to the BCE Remuneration Committee, which in turn reviews and approves the recipients, amounts and structure of any such awards. Generally, awards are only made to members of senior management and employees directly involved in the management of the investments comprising the portfolio of the relevant fund. The rules regarding forfeiture of Carried Interest by leavers vary by fund.
BENEFICIAL OWNERSHIP. As of December 31, 2012, members of the Portfolio Management Team beneficially owned the following dollar range of equity securities in the Registrant:
| Portfolio Management | Dollar Range of Beneficially |
| Team: | Owned* Equity Securities of the Registrant: |
| Russell D. Morrison | $50,001-$100,000 |
| Sean Feeley | $50,001-$100,000 |
| Michael Freno | None |
| Kam Tugnait | None |
| Zak Summerscale | None |
* Beneficial ownership has been determined in accordance with Rule 16(a)-1(a)(2) under the Securities Exchange Act of 1934, as amended.
Item 9. Purchases of Equity Securities by Closed-End Management Investment Company and Affiliated Purchasers.
Not applicable for this filing.
Item 10. Submission of Matters to a Vote of Security Holders.
Not applicable for this filing.
Item 11. Controls and Procedures.
| (a) | The principal executive officer and the principal financial officer of the Registrant evaluated the effectiveness of the Registrant’s disclosure controls and procedures (as defined in Rule 30a-3(c) under the Investment Company Act of 1940 (the “Act”)) as of a date within 90 days of the filing of this report and based on that evaluation have concluded that such disclosure controls and procedures are effective to provide reasonable assurance that material information required to be disclosed by the Registrant on Form N-CSR is recorded, processed, summarized and reported within the time periods specified in the Securities and Exchange Commission’s rules and forms. |
| (b) | There were no changes to the Registrant’s internal controls over financial reporting (as defined in Rule 30a-3(d) under the Act) during the Registrant’s second half year that have materially affected, or are reasonably likely to materially affect, the Registrant’s internal control over financial reporting. |
Item 12. Exhibits.
| | (a)(1) | ANY CODE OF ETHICS, OR AMENDMENTS THERETO, THAT IS THE SUBJECT OF DISCLOSURE REQUIRED BY ITEM 2, TO THE EXTENT THAT THE REGISTRANT INTENDS TO SATISFY THE ITEM 2 REQUIREMENTS THROUGH THE FILING OF AN EXHIBIT. |
None.
| | (a)(2) | A SEPARATE CERTIFICATION FOR EACH PRINCIPAL EXECUTIVE OFFICER AND PRINCIPAL FINANCIAL OFFICER OF THE REGISTRANT AS REQUIRED BY RULE 30a-2 UNDER THE ACT. |
| | (a)(3) | ANY WRITTEN SOLICITATION TO PURCHASE SECURITIES UNDER RULE 23c-1 UNDER THE ACT (17 CFR 270.23c-1) SENT OR GIVEN DURING THE PERIOD COVERED BY THE REPORT BY OR ON BEHALF OF THE REGISTRANT TO 10 OR MORE PERSONS. |
| | Not applicable for this filing. |
| | (b) | CERTIFICATIONS PURSUANT TO RULE 30a-2(b) UNDER THE ACT. |
SIGNATURES
Pursuant to the requirements of the Securities Exchange Act of 1934 and the Investment Company Act of 1940, the registrant has duly caused this report to be signed on its behalf by the undersigned, thereunto duly authorized.
(Registrant) Babson Capital Global Short Duration High Yield Fund
By (Signature and Title) /s/ Russ Morrison
Russ Morrison, President
Date March 11, 2013
Pursuant to the requirements of the Securities Exchange Act of 1934 and the Investment Company Act of 1940, this report has been signed below by the following persons on behalf of the registrant and in the capacities and on the dates indicated.
By (Signature and Title) /s/ Russ Morrison
Russ Morrison, President
Date March 11, 2013 ��
By (Signature and Title) /s/ Patrick Hoefling
Patrick Hoefling, Chief Financial Officer