As filed with the U.S. Securities and Exchange Commission on March 11, 2021
UNITED STATES
SECURITIES AND EXCHANGE COMMISSION
Washington, D.C. 20549
FORM N-CSR
CERTIFIED SHAREHOLDER REPORT OF REGISTERED
MANAGEMENT INVESTMENT COMPANIES
811-22562
Investment Company Act file number
Barings Global Short Duration High Yield Fund
(Exact name of registrant as specified in charter)
300 South Tryon Street, Suite 2500, Charlotte, NC 28202
(Address of principal executive offices) (Zip code)
Corporation Service Company (CSC)
251 Little Falls Drive
Wilmington DE 19808
United States
(Name and address of agent for service)
704-805-7200
Registrant’s telephone number, including area code
Date of fiscal year end: December 31, 2020
Date of reporting period: December 31, 2020
Item 1. Reports to Stockholders.
(a)
(b) Not Applicable for this Registrant
Item 1. Reports to Stockholders.
Barings Global Short Duration High Yield Fund
c/o Barings LLC
300 S Tryon St.
Suite 2500
Charlotte, NC 28202
704.805.7200
http://www.Barings.com/bgh
ADVISER
Barings LLC
300 S Tryon St.
Suite 2500
Charlotte, NC 28202
SUB-ADVISOR
Baring International Investment Limited
20 Old Bailey
London EC4M 78F UK
COUNSEL TO THE FUND
Ropes & Gray LLP
Prudential Tower
800 Boylston Street
Boston, Massachusetts 02110
INDEPENDENT REGISTERED PUBLIC ACCOUNTING FIRM
Deloitte & Touche LLP
30 Rockefeller Plaza
New York, NY 10112
CUSTODIAN
US Bank
MK-WI-S302
1555 N. River Center Drive
Milwaukee, WI 53212
TRANSFER AGENT & REGISTRAR
U.S. Bancorp Fund Services, LLC, d/b/a
U.S. Bank Global Fund Services
615 E. Michigan St.
Milwaukee, WI 53202
FUND ADMINISTRATION/ACCOUNTING
U.S. Bancorp Fund Services, LLC, d/b/a
U.S. Bank Global Fund Services
615 E. Michigan St.
Milwaukee, WI 53202

PROXY VOTING POLICIES & PROCEDURES
The Trustees of Barings Global Short Duration High Yield Fund (the “Fund”) have delegated proxy voting responsibilities relating to the voting of securities held by the Fund to Barings LLC (“Barings”). A description of Barings’ proxy voting policies and procedures is available (1) without charge, upon request, by calling, toll-free 1-866-399-1516; (2) on the Fund’s website at http://www.barings.com/bgh; and (3) on the U.S. Securities and Exchange Commission’s (“SEC”) website at http://www.sec.gov.
FORM N-Q
The Fund will file its complete schedule of portfolio holdings with the SEC for the first and third quarters of each fiscal year on Form N-Q or Part F of Form N-PORT (beginning with filings after March 31, 2019). This information is available (1) on the SEC’s website at http://www.sec.gov; and (2) at the SEC’s Public Reference Room in Washington, DC (which information on their operation may be obtained by calling 1-800-SEC-0330). A complete schedule of portfolio holdings as of each quarter-end is available on the Fund’s website at http://www.barings.com/bgh or upon request by calling, toll-free, 1-866-399-1516.
CERTIFICATIONS
The Fund’s President has submitted to the NYSE the annual CEO Certification as required by Section 303A.12(a) of the NYSE Listed Company Manual.
LEGAL MATTERS
The Fund has entered into contractual arrangements with an investment adviser, transfer agent and custodian (collectively “service providers”) who each provide services to the Fund. Shareholders are not parties to, or intended beneficiaries of, these contractual arrangements, and these contractual arrangements are not intended to create any shareholder right to enforce them against the service providers or to seek any remedy under them against the service providers, either directly or on behalf of the Fund.
Under the Fund’s Bylaws, any claims asserted against or on behalf of the Fund, including claims against Trustees and officers must be brought in courts located within the Commonwealth of Massachusetts.
The Fund’s registration statement and this shareholder report are not contracts between the Fund and its shareholders and do not give rise to any contractual rights or obligations or any shareholder rights other than any rights conferred explicitly by federal or state securities laws that may not be waived.
Barings Global Short Duration High Yield Fund 2020 Annual Report
OFFICERS OF THE FUND
Sean Feeley
President
Carlene Pollock
Chief Financial Officer
Elizabeth Murray
Treasurer
Michael Freno
Vice President
Scott Roth
Vice President
Michael Cowart
Chief Compliance Officer
Jill Dinerman
Secretary/Chief Legal Officer
Alexandra Pacini
Assistant Secretary
Barings Global Short Duration High Yield Fund is a closed-end investment company, first offered to the public in 2012, whose shares are traded on the New York Stock Exchange.
INVESTMENT OBJECTIVE & POLICY
Barings Global Short Duration High Yield Fund (the “Fund”) was organized as a business trust under the laws of the Commonwealth of Massachusetts. The Fund is registered under the Investment Company Act of 1940, as amended, as a de facto diversified, closed-end management investment company with its own investment objective. The Fund’s common shares are listed on the New York Stock Exchange under the symbol “BGH”.
The Fund’s primary investment objective is to seek as high a level of current income as the Adviser (as defined herein) determines is consistent with capital preservation. The Fund seeks capital appreciation as a secondary investment objective when consistent with its primary investment objective. There can be no assurance that the Fund will achieve its investment objectives.
The Fund seeks to take advantage of inefficiencies between geographies, primarily the North American and Western European high yield bond and loan markets and within capital structures between bonds and loans. For example, the Fund seeks to take advantage of differences in pricing between bonds and loans of an issuer denominated in U.S. dollars and substantially similar bonds and loans of the same issuer denominated in Euros, potentially allowing the Fund to achieve a higher relative return for the same credit risk exposure.
1
Barings Global Short Duration High Yield Fund 2020 Annual Report
Dear Fellow Shareholders,
We present the 2020 Annual Report for the Barings Global Short Duration High Yield Fund (the “Fund”) to recap portfolio performance and positioning. We believe our Global High Yield Investments Group is one of the largest teams in the market primarily focused on North American and Western European credit. Utilizing the Group’s unparalleled expertise, deep resources and time-tested process, we believe we can provide investors with an attractive level of current income while navigating the challenging times that may still lie ahead and continuing to uncover compelling opportunities across the global high yield market.
The Fund’s strategy focuses primarily on North American and Western European high yield companies, with the flexibility to dynamically shift the geographic weighting in order to capture, in our opinion, the best risk-adjusted investment opportunities. In the coming months and quarters, as the economic road to recovery may vary across different countries and regions, Barings’ global capabilities on the ground in major markets allow for us to be nimble in these times and take advantage of unique opportunities as they arise. In addition, the strategy focuses closely on limiting the duration of the Fund, while maintaining what we consider to be a reasonable amount of leverage.
Market Review
During the full year 2020, the market saw historic volatility, from a dramatic sell-off in the first quarter to a rebound in the second quarter and then into a risk rally that led global markets to end the year in positive territory. In the final six months of the year, markets were provided stability through global stimulus measures and continued Fed support in the U.S. in the form of corporate bond and exchange-traded fund (ETF) purchases. This, along with a move by investors into the below-investment grade market in the search for yield, led to historic new issuance levels in the global high yield bond market. Generally speaking, high yield issuers had ample access to capital, taking the opportunity to extend their liquidity into 2021 which helped to provide a more secure fundamental picture going into the New Year. This was all further supported by the Covid-19 vaccine roll-out and sustained consumer spending strength during the year.
The U.S. high yield bond market ended 2020 with a positive return despite the historic volatility across global markets in the first quarter. Performance was positive across all industry sectors following a strong rebound in the latter three quarters of the year with the exception of the energy sector. Many energy credits remained in negative territory following swings in the price of crude oil, which entered negative territory before rebounding back to near $40 per barrel. Double-Bs largely outperformed during the year followed by single-Bs and triple-Cs. The yield-to-worst finished the year 118 bps tighter from year-end 2019 at 4.30% while the option adjusted spread ended 24 bps wider at 391 bps. Gross high yield new issuance hit record highs with over $441 billion pricing across 664 bonds. Issuance net of refinancing activity was also elevated at $149 billion. The strong new issuance trends were absorbed by U.S. high yield bond fund net inflows of $44.3 billion over the year, despite notable outflows in the first quarter. Defaults increased to 6.17% as measured by the 12-month par weighted default rate and were largely driven by the energy sector. Similarly, the European high yield bond market posted positive performance over the year 2020 despite the market volatility. The European high yield bond market recorded its second worst month on record in terms of performance in March 2020, with the option adjusted spread widening significantly to 907 bps. However, as central banks and governments provided unprecedented stimulus following the initial onset of Covid-19, European high yield bonds experienced a strong resurgence for the rest of the year. While higher-rated bonds were the first to recover after the drawdown in March, the triple-C rated segment outperformed the rest of the market over the course of the year followed by double-Bs, while single-Bs were relatively flat. The option adjusted spread and yield-to-worst finished the year 45 bps and 0.18% wider, respectively, than the levels at which they started the year, to end at 368 bps and 3.05%. With the exception of the services sector, annual performance across industries was positive with two notable outperformers, energy and media. Despite the new issuance market being effectively closed during March and April, for the full year of 2020, issuance remained strong and totaled €85 billion, up 15% compared to last year.
Barings Global Short Duration High Yield Fund Overview and Performance
The Fund ended December 2020 with a portfolio of 148 issuers, up from 127 issuers at the beginning of the year. A majority of the issuers are domiciled in the United States at 82.9%, followed by the United Kingdom at 5.5%. (See Country Composition chart below). From a geographic standpoint, exposure to North American issuers was mostly in-line with year-end 2019, while issuers in Europe were down modestly. The Fund’s exposure to Rest of World issuers whose country of risk is outside of the U.S. and Europe but fit within the Fund’s developed market focus was modestly higher than from the
2
Barings Global Short Duration High Yield Fund 2020 Annual Report
previous year-end. The Fund’s primary exposure continues to be in the U.S. market, where the opportunity set was substantial given fallen angel activity and heavy new issue supply in the form of higher quality double-Bs and senior secured issues.
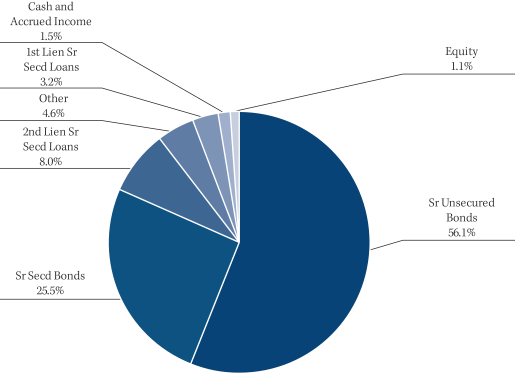
As of December 31, 2020, the Fund’s positioning across the credit quality spectrum was as follows: 20.2% BB rated and above, 41.0% single-B rated, and 35.0% triple-C rated and below, with approximately 32% of the portfolio consisting of secured obligations. The Fund decreased single-B rated credits, while triple-C and below rated credits increased during the period to take advantage of yield opportunities within the category but also through ratings downgrades. Non-publicly rated securities, and cash and accrued interest represented 3.7% and 3.2%, respectively.1
The Fund paid 3 consecutive monthly dividend payments of $0.1408 from January to March and subsequent payments of $0.1056 per share from April to December following a dividend payment reduction. The subsequent payments of $0.1056 per share represent a 25% reduction from previous dividend payments and were based on an assessment of market conditions by Barings at the time. The Fund’s share price and net asset value (“NAV”) ended the reporting period at $15.09 and $16.68, respectively, or at a 10.5% discount to NAV. Based on the Fund’s share price and NAV on December 31, 2020, the Fund’s market price and NAV distribution rates – using the most recent monthly dividend, on an annualized basis – were 8.40% and 7.60%, respectively. Assets acquired through leverage, which represented 28.7% of the Fund’s total assets at the end of December, were accretive to net investment income and benefited shareholders.
On a year-to-date (“YTD”) basis through December 31, 2020, the NAV total return was 0.79%, underperforming the global high yield bond market, as measured by the Bank of America / Merrill Lynch Non-Financial Developed Markets High Yield Constrained Index (HNDC), which returned 5.56% on a USD hedged basis. From a market value perspective, the total return year-to-date through December 31, 2020 was -4.65%.2 During the first six months of 2020, the Fund saw considerable weakness, returning -18.81% as a result of the Covid-19 pandemic with much of the negative returns stemming from the metals and mining and energy sectors, where the Fund maintained larger positions. Other Covid-centric sectors also weighed heavily on performance such as credits in the travel, leisure, and services sectors given the abrupt enactment of global lockdowns. The risk-off sentiment drove outflows from the asset class with lower-quality single-Bs and triple-Cs seeing the most weakness in trading levels and, as such, weighing most heavily on Fund performance. During the second half of the year, however, the Fund made substantial headway in gaining back performance lost during the unprecedented market volatility earlier in the year, returning 24.14%, from an NAV perspective, for the final six months of the year. While still detracting from performance for the full year, the energy sector rebounded strongly in the last six months, up over 20% on a total return basis. Similarly, the financial and manufacturing sectors returned approximately 19% and 16%, respectively. By year-end, the metals and mining sector continued to be the largest detractor, given earlier losses, though the Fund was still able to regain a portion of the negative performance in the sector, returning 29% for the semi-annual period ended December 31, 2020. The majority of all other sectors ended the year either in positive territory or negative to a modest degree. Lower-quality credit across the market and within the Fund outperformed in the second half of the year led by triple-Cs and followed by single-Bs. While still positively contributing to Fund performance, double-Bs lagged the broader market. From an asset class perspective, positive total returns in the latter half of the year were led by CLOs, followed by senior secured loans and high yield bonds.
On November 9, 2020, Thomas M. Finke submitted his resignation from the Board of Directors (the “Board”) of Barings Global Short Duration High Yield Fund (the “Fund”), effective as of the close of business on November 30, 2020. Mr. Finke, former Chief Executive Officer of Barings LLC (“Barings”), the Fund’s external investment adviser, decided to retire from Barings. Mr. Finke’s resignation was not the result of a disagreement with the Fund on any matter relating to its operations, policies or practices. The Board, upon recommendation from its Nominating and Corporate Governance Committee, appointed David Mihalick to fill the vacant seat created by Mr. Finke’s resignation, effective as of the close of business on November 30, 2020, to serve as a Class I member of the Board for the remainder of the full term of such Class I directorship.
Market Outlook
We believe high yield credit markets have a number of supportive tailwinds heading into 2021, from a more manageable default environment compared to 2020 to the continued search for yield by investors globally. These are in addition to the potential for further improvements in local economies as the cadence of vaccine distribution and implementation increases,
3
Barings Global Short Duration High Yield Fund 2020 Annual Report
although varying by region. While we believe defaults are likely to remain elevated going into 2021, we believe they will remain much lower than peak-Covid forecasts, largely due to markets being open as has been the case over recent months. Investors have been willing to capitalize businesses and central bank support has been a critical component of that. However, there remains an element of uncertainty in the markets and therefore we believe credit selection will remain critical in the high yield credit markets focused on issuers that can withstand short-term market volatility and potentially offer attractive risk-adjusted returns as the global economy continues to recover.
At Barings, we remain committed to focusing on corporate fundamentals as market sentiment can change quickly and unexpectedly. Our focused and disciplined approach emphasizes our fundamental bottom-up research, with the goal of preserving investor capital while seeking to capture attractive capital appreciation opportunities that may exist through market and economic cycles. On behalf of the Barings team, we continue to take a long-term view of investing despite the recent economic challenges, and look forward to helping you achieve your investment goals.
Sincerely,

Sean Feeley
| 1. | Ratings are based on Moody’s, S&P and Fitch. If securities are rated differently by the rating agencies, the higher rating is applied and all ratings are converted to the equivalent Moody’s major rating category for purposes of the category shown. Credit ratings are based largely on the rating agency’s investment analysis at the time of rating and the rating assigned to any particular security is not necessarily a reflection of the issuer’s current financial condition. The rating assigned to a security by a rating agency does not necessarily reflect its assessment of the volatility of the security’s market value or of the liquidity of an investment in the security. Ratings of Baa3 or higher by Moody’s and BBB- or higher by S&P and Fitch are considered to be investment grade quality. |
| 2. | Past performance is not necessarily indicative of future results. Current performance may be lower or higher. All performance is net of fees, which is inclusive of advisory fees, administrator fees and interest expense. |
4
Barings Global Short Duration High Yield Fund 2020 Annual Report
PORTFOLIO COMPOSITION (% OF ASSETS*)
COUNTRY COMPOSITION (% OF ASSETS*)
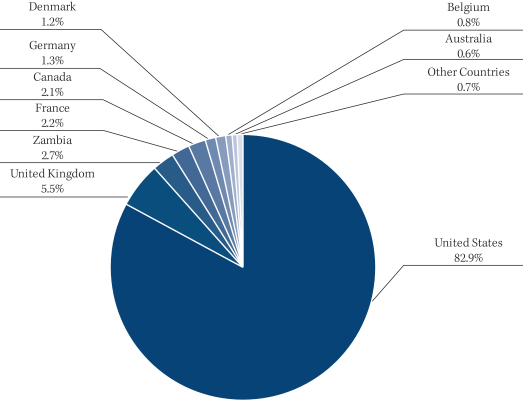
| * | The percentages shown above represent a percentage of the assets as of December 31, 2020. |
5
Barings Global Short Duration High Yield Fund 2020 Annual Report
FINANCIAL REPORT
6
Barings Global Short Duration High Yield Fund 2020 Annual Report
STATEMENT OF ASSETS AND LIABILITIES
| | | | |
| | | DECEMBER 31, 2020 | |
| |
| Assets | | | | |
| Investments, at fair value (cost $478,817,979) | | $ | 458,897,234 | |
| Cash | | | 2,053,651 | |
| Foreign currency, at fair value (cost $68,731) | | | 69,158 | |
| Receivable for investments sold | | | 1,500,798 | |
| Interest receivable | | | 10,062,979 | |
| Prepaid expenses and other assets | | | 8,151 | |
| | | | |
Total assets | | | 472,591,971 | |
| | | | |
| |
| Liabilities | | | | |
| Note payable | | | 135,950,000 | |
| Dividend payable | | | 70,332 | |
| Payable for investments purchased | | | 580,121 | |
| Payable to adviser | | | 328,102 | |
| Unrealized depreciation on forward foreign exchange contracts | | | 493,952 | |
| Accrued expenses and other liabilities | | | 593,360 | |
| | | | |
Total liabilities | | | 138,015,867 | |
| | | | |
Total net assets | | $ | 334,576,104 | |
| | | | |
| |
| Net Assets: | | | | |
| Common shares, $0.00001 par value | | $ | 201 | |
| Additional paid-in capital | | | 468,435,225 | |
| Accumulated losses | | | (133,859,322 | ) |
| | | | |
Total net assets | | $ | 334,576,104 | |
| | | | |
| |
| Common shares issued and outstanding (unlimited shares authorized) | | | 20,064,313 | |
| | | | |
| |
Net asset value per share | | $ | 16.68 | |
| | | | |
See accompanying Notes to the Financial Statements.
7
Barings Global Short Duration High Yield Fund 2020 Annual Report
STATEMENT OF OPERATIONS
| | | | |
| | | YEAR ENDED
DECEMBER 31, 2020 | |
| |
| Investment Income | | | | |
Interest income | | $ | 38,378,651 | |
Dividends from common stock (net of foreign taxes withheld of $54,730) | | | 187,467 | |
Other income | | | 191,491 | |
| | | | |
Total investment income | | | 38,757,609 | |
| | | | |
| |
| Operating Expenses | | | | |
Advisory fees | | | 4,204,530 | |
Interest expense | | | 1,646,178 | |
Administrator fees | | | 349,842 | |
Taxes paid on undistributed income | | | 390,061 | |
Professional fees | | | 236,654 | |
Trustees fees | | | 91,121 | |
Printing and mailing expense | | | 65,030 | |
Pricing expense | | | 21,500 | |
Other operating expenses | | | 32,359 | |
| | | | |
Total operating expenses | | | 7,037,275 | |
| | | | |
Less fees waived by Adviser | | | (257,838 | ) |
| | | | |
Net Expenses | | | 6,779,437 | |
| | | | |
Net investment income | | | 31,978,172 | |
| | | | |
| |
| Realized and Unrealized Gains (Losses) on Investments | | | | |
Net realized loss on investments | | | (43,366,843 | ) |
Net realized gain on forward foreign exchange contracts | | | 277,051 | |
Net realized loss on foreign currency related transactions | | | (1,945,512 | ) |
| | | | |
Net realized loss on investments, forward foreign exchange contracts and foreign currency related transactions | | | (45,035,304 | ) |
| | | | |
Net change in unrealized appreciation on investments | | | 7,648,517 | |
Net change in unrealized depreciation on forward foreign exchange contracts | | | (122,813 | ) |
Net change in unrealized appreciation on foreign currency translation | | | 3,016 | |
| | | | |
Net change in unrealized appreciation on investments, forward foreign exchange contracts and foreign currency translation | | | 7,528,720 | |
| | | | |
Net realized and unrealized losses | | | (37,506,584 | ) |
| | | | |
Net decrease in net assets resulting from operations | | $ | (5,528,412 | ) |
| | | | |
See accompanying Notes to the Financial Statements.
8
Barings Global Short Duration High Yield Fund 2020 Annual Report
STATEMENT OF CASH FLOWS
| | | | |
| | | YEAR ENDED
DECEMBER 31, 2020 | |
| |
Reconciliation of net decrease in net assets resulting from
operations to net cash provided by operating activities | | | | |
| Net decrease in net assets applicable to common shareholders resulting from operations | | $ | (5,528,412 | ) |
| Adjustments to reconcile net decrease in net assets applicable to common shareholders resulting from operations to net cash provided by operating activities: | | | | |
Purchases of long-term investments | | | (173,524,718 | ) |
Proceeds from sales of long-term investments | | | 184,586,929 | |
Proceeds from sales of foreign currency, net | | | 161,848 | |
Forward currency exchange contracts, net | | | 122,813 | |
Net change in unrealized appreciation on investments | | | (7,648,517 | ) |
Net realized loss on investments | | | 43,366,843 | |
Amortization and accretion | | | (1,389,069 | ) |
Changes in operating assets and liabilities: | | | | |
Decrease in interest receivable | | | 706,633 | |
Increase in prepaid expenses and other assets | | | (8,151 | ) |
Increase in receivable for investments sold | | | (1,500,798 | ) |
Increase in payable for investments purchased | | | 217,983 | |
Decrease in payable to Adviser | | | (104,424 | ) |
Decrease in accrued expenses and other liabilities | | | (263,779 | ) |
| | | | |
Net cash provided by operating activities | | | 39,195,181 | |
| | | | |
| Cash flows from financing activities | | | | |
Advances from credit facility | | | 69,500,000 | |
Repayments on credit facility | | | (80,750,000 | ) |
Distributions paid to common shareholders | | | (30,447,485 | ) |
| | | | |
Net cash used in financing activities | | | (41,697,485 | ) |
| | | | |
Net change in cash | | | (2,502,304 | ) |
Cash beginning of year | | | 4,555,955 | |
| | | | |
Cash end of year | | $ | 2,053,651 | |
| | | | |
| |
| Supplemental disclosure of cash flow information | | | | |
Income taxes paid | | $ | 123,794 | |
Interest paid | | | 1,824,574 | |
See accompanying Notes to the Financial Statements.
9
Barings Global Short Duration High Yield Fund 2020 Annual Report
STATEMENTS OF CHANGES IN NET ASSETS
| | | | | | | | |
| | | YEAR ENDED
DECEMBER 31, 2020 | | | YEAR ENDED
DECEMBER 31, 2019 | |
| | |
| Operations | | | | | | | | |
Net investment income | | $ | 31,978,172 | | | $ | 37,994,028 | |
Net realized loss on investments, forward foreign exchange contracts and foreign currency related transactions | | | (45,035,304 | ) | | | (15,486,954 | ) |
Net change in unrealized appreciation on investments, forward foreign exchange contracts and foreign currency translation | | | 7,528,720 | | | | 14,010,346 | |
| | | | | | | | |
Net increase (decrease) in net assets resulting from operations | | | (5,528,412 | ) | | | 36,517,420 | |
| | | | | | | | |
| | |
| Dividends to Common Shareholders | | | | | | | | |
From distributable earnings | | | (27,544,286 | ) | | | (35,672,794 | ) |
| | | | | | | | |
Total dividends to common shareholders | | | (27,544,286 | ) | | | (35,672,794 | ) |
| | | | | | | | |
| | |
| Capital Stock Transactions | | | | | | | | |
Issuance from common shares issued on reinvestment | | | — | | | | 112,799 | |
| | | | | | | | |
Net increase in net assets from capital stock transactions | | | — | | | | 112,799 | |
| | | | | | | | |
Total increase (decrease) in net assets | | | (33,072,698 | ) | | | 957,425 | |
| | | | | | | | |
| | |
| Net Assets | | | | | | | | |
Beginning of year | | | 367,648,802 | | | | 366,691,377 | |
| | | | | | | | |
End of year | | $ | 334,576,104 | | | $ | 367,648,802 | |
| | | | | | | | |
See accompanying Notes to the Financial Statements.
10
Barings Global Short Duration High Yield Fund 2020 Annual Report
FINANCIAL HIGHLIGHTS
| | | | | | | | | | | | | | | | | | | | |
| | | YEAR ENDED
DECEMBER 31,
2020 | | | YEAR ENDED
DECEMBER 31,
2019 | | | YEAR ENDED
DECEMBER 31,
2018 | | | YEAR ENDED
DECEMBER 31,
2017 | | | YEAR ENDED
DECEMBER 31,
2016 | |
| | | | | |
| Per Common Share Data | | | | | | | | | | | | | | | | | | | | |
Net asset value, beginning of year | | $ | 18.32 | | | $ | 18.28 | | | $ | 20.84 | | | $ | 20.87 | | | $ | 18.47 | |
Income from investment operations: | | | | | | | | | | | | | | | | | | | | |
Net investment income | | | 1.59 | | | | 1.87 | | | | 1.89 | | | | 1.77 | | | | 1.57 | |
Net realized and unrealized gains (losses) on investments | | | (1.86 | ) | | | (0.05 | ) | | | (2.67 | ) | | | 0.04 | | | | 2.68 | |
| | | | | | | | | | | | | | | | | | | | |
Total increase (decrease) from investment operations | | | (0.27 | ) | | | 1.82 | | | | (0.78 | ) | | | 1.81 | | | | 4.25 | |
| | | | | | | | | | | | | | | | | | | | |
Less dividends to common stockholders: | | | | | | | | | | | | | | | | | | | | |
Net investment income | | | (1.37 | ) | | | (1.78 | ) | | | (1.78 | ) | | | (1.63 | ) | | | (1.60 | ) |
Net realized gain | | | – | | | | – | | | | – | | | | – | | | | – | |
Return of capital | | | – | | | | – | | | | – | | | | (0.21 | ) | | | (0.25 | ) |
| | | | | | | | | | | | | | | | | | | | |
Total dividends to common stockholders | | | (1.37 | ) | | | (1.78 | ) | | | (1.78 | ) | | | (1.84 | ) | | | (1.85 | ) |
| | | | | | | | | | | | | | | | | | | | |
Net asset value, end of year | | $ | 16.68 | | | $ | 18.32 | | | $ | 18.28 | | | $ | 20.84 | | | $ | 20.87 | |
| | | | | | | | | | | | | | | | | | | | |
Per common share market value, end of year | | $ | 15.09 | | | $ | 17.53 | | | $ | 15.95 | | | $ | 19.38 | | | $ | 19.23 | |
| | | | | | | | | | | | | | | | | | | | |
Total investment return based on net asset value (1) | | | 0.79 | % | | | 10.77 | | | | (3.42 | )% | | | 9.40 | % | | | 25.42 | % |
| | | | | | | | | | | | | | | | | | | | |
Total investment return based on market value (1) | | | (4.65 | )% | | | 21.45 | | | | (9.38 | )% | | | 10.41 | % | | | 29.44 | % |
| | | | | | | | | | | | | | | | | | | | |
| | | | | |
| Supplemental Data and Ratios | | | | | | | | | | | | | | | | | | | | |
Net assets, end of period (000’s) | | $ | 334,576 | | | $ | 367,649 | | | $ | 366,691 | | | $ | 417,924 | | | $ | 418,613 | |
Ratio of expenses (before reductions and reimbursements) to average net assets | | | 2.32 | %(2) | | | 3.00 | % | | | 2.93 | % | | | 2.33 | % | | | 2.05 | %(2) |
Ratio of expenses (after reductions and reimbursements) to average net assets | | | 2.23 | % | | | 3.00 | % | | | 2.93 | % | | | 2.33 | % | | | 1.78 | % |
Ratio of net investment income (before reductions and reimbursements) to average net assets | | | 10.61 | %(2) | | | 10.22 | % | | | 9.34 | % | | | 9.20 | % | | | 10.68 | %(2) |
Ratio of net investment income (after reductions and reimbursements) to average net assets | | | 10.53 | % | | | 10.22 | % | | | 9.34 | % | | | 9.20 | % | | | 10.41 | % |
Portfolio turnover rate | | | 42.21 | % | | | 52.25 | % | | | 48.92 | % | | | 36.59 | % | | | 44.81 | % |
| (1) | | Total investment return calculation assumes reinvestment of dividends at actual prices pursuant to the Fund’s dividend reinvestment plan. Total investment return does not reflect brokerage commissions. |
| (2) | | The Adviser contractually waived a portion of its management and other fees equal to an annual rate of 0.275% of the Fund’s managed assets for a period of one year ended December 31, 2016. Effective August 6, 2020 the Adviser began waiving a portion of it’s management and other fees equal to an annual rate of 0.150% of the Fund’s managed assets. |
See accompanying Notes to the Financial Statements.
11
Barings Global Short Duration High Yield Fund 2020 Annual Report
SCHEDULE OF INVESTMENTS
December 31, 2020
| | | | | | | | | | | | | | | | | | | | |
| | | | | | | | | SHARES | | | COST | | | FAIR
VALUE | |
Equities — 1.50%*: | |
|
Common Stocks — 1.42%*: | |
Boomerang Tube Holdings, Inc.¤ | | | | | | | | | | | 36,149 | | | | $3,510,832 | | | | $0 | |
Fieldwood Energy LLC¤ | | | | | | | | | | | 167,574 | | | | 4,057,567 | | | | 0 | |
Jupiter Resources Inc.¤+& | | | | | | | | | | | 1,171,624 | | | | 5,662,542 | | | | 3,749,197 | |
Sabine Oil & Gas LLC¤ | | | | | | | | | | | 4,342 | | | | 248,858 | | | | 56,446 | |
KCA Deutag Ordinary A Shares¤+ | | | | | | | | | | | 23,585 | | | | 990,570 | | | | 955,193 | |
Travelex Private Equity¤+ | | | | | | | | | | | 16,120 | | | | 0 | | | | 0 | |
| | | | | | | | | | | | | | | | | | | | |
Total Common Stocks | | | | | | | | | | | 1,419,394 | | | | 14,470,369 | | | | 4,760,836 | |
| | | | | | | | | | | | | | | | | | | | |
|
Warrants — 0.08%*: | |
Travelex Topco Limited Warrant¤+ | | | | | | | | | | | 2,218 | | | | 0 | | | | 250,232 | |
| | | | | | | | | | | | | | | | | | | | |
Total Warrants | | | | | | | | | | | 2,218 | | | | 0 | | | | 250,232 | |
| | | | | | | | | | | | | | | | | | | | |
| | | | | | | | | | | | | | | | | | | | |
Total Equities | | | | | | | | | | | 1,421,612 | | | | 14,470,369 | | | | 5,011,068 | |
| | | | | | | | | | | | | | | | | | | | |
| | | EFFECTIVE
INTEREST RATE ‡ | | | DUE DATE | | | PRINCIPAL | | | COST | | | FAIR
VALUE | |
Fixed Income — 135.66%*: | |
|
Asset-Backed Securities — 11.34%*: | |
|
CDO/CLO — 11.34%*: | |
Anchorage Capital CLO LTD 2015-6A, 3M LIBOR + 6.350%^~ | | | 6.59 | % | | | 7/15/2030 | | | | 600,000 | | | | $608,442 | | | | $573,109 | |
Anchorage Capital CLO LTD 2016-9A ER, 3M LIBOR + 6.410%^~ | | | 6.65 | | | | 7/15/2032 | | | | 1,500,000 | | | | 1,455,000 | | | | 1,494,992 | |
Anchorage Capital CLO LTD 2013-1R, 3M LIBOR + 6.800%^~ | | | 7.02 | | | | 10/15/2030 | | | | 1,000,000 | | | | 977,213 | | | | 1,000,078 | |
Bain Capital Credit CLO 2020-2 E, 3M LIBOR + 6.830%^~ | | | 7.05 | | | | 7/29/2031 | | | | 1,000,000 | | | | 926,357 | | | | 1,001,627 | |
Ballyrock CLO LTD 2019-2A, 3M LIBOR + 7.740%^~ | | | 7.96 | | | | 11/20/2030 | | | | 2,000,000 | | | | 1,960,000 | | | | 2,001,464 | |
BlueMountain CLO LTD 2018-23A, 3M LIBOR + 5.650%^~ | | | 5.87 | | | | 10/20/2031 | | | | 1,000,000 | | | | 1,000,000 | | | | 936,141 | |
Canyon CLO LTD 2019-2A, 3M LIBOR + 7.150%^~ | | | 7.39 | | | | 10/15/2032 | | | | 1,000,000 | | | | 1,000,000 | | | | 1,001,340 | |
Carbone CLO, LTD 2017-1A, 3M LIBOR + 5.900%^~ | | | 6.12 | | | | 1/21/2031 | | | | 750,000 | | | | 750,000 | | | | 702,061 | |
Carlyle Global Market Strategies 2013-3A, 3M LIBOR + 7.750%^~ | | | 7.99 | | | | 10/15/2030 | | | | 1,000,000 | | | | 1,000,000 | | | | 715,936 | |
Carlyle Global Market Strategies 2017-5A, 3M LIBOR + 5.300%^~ | | | 5.52 | | | | 1/22/2030 | | | | 700,000 | | | | 700,000 | | | | 616,791 | |
Carlyle Global Market Strategies 2019-3 LTD, 3M LIBOR + 7.030%^~ | | | 7.25 | | | | 10/20/2032 | | | | 1,000,000 | | | | 975,000 | | | | 1,000,412 | |
Cedar Funding LTD 2016-6A, 3M LIBOR + 5.900%^~ | | | 6.12 | | | | 10/20/2028 | | | | 2,500,000 | | | | 2,500,000 | | | | 2,399,155 | |
CIFC Funding 2020-1 LTD^~ | | | 7.32 | | | | 7/15/2032 | | | | 1,900,000 | | | | 1,881,000 | | | | 1,907,484 | |
See accompanying Notes to the Financial Statements.
12
Barings Global Short Duration High Yield Fund 2020 Annual Report
SCHEDULE OF INVESTMENTS (CONTINUED)
December 31, 2020
| | | | | | | | | | | | | | | | | | | | |
| | | EFFECTIVE
INTEREST RATE ‡ | | | DUE DATE | | | PRINCIPAL | | | COST | | | FAIR
VALUE | |
Fixed Income (Continued) | |
|
Asset-Backed Securities (Continued) | |
|
CDO/CLO (Continued) | |
Galaxy CLO LTD 2017-24A, 3M LIBOR + 5.500%^~ | | | 5.74 | % | | | 1/15/2031 | | | | 1,000,000 | | | | $1,000,000 | | | | $938,032 | |
GoldenTree Loan Management 2018-3A, 3M LIBOR + 6.500%^~ | | | 6.72 | | | | 4/22/2030 | | | | 1,500,000 | | | | 1,439,376 | | | | 1,226,774 | |
GoldenTree Loan Opportunities XI LTD 2015-11A, 3M LIBOR + 5.400%^~ | | | 5.62 | | | | 1/18/2031 | | | | 500,000 | | | | 500,000 | | | | 471,166 | |
KKR Financial CLO LTD 2017-20, 3M LIBOR + 5.500%^~ | | | 5.73 | | | | 10/16/2030 | | | | 1,500,000 | | | | 1,500,000 | | | | 1,368,239 | |
LCM LTD 2019-30, 3M LIBOR + 6.950%^~ | | | 7.17 | | | | 4/21/2031 | | | | 1,100,000 | | | | 1,100,000 | | | | 1,099,232 | |
Madison Park Funding LTD 2015-19A, 3M LIBOR + 4.350%^~ | | | 4.57 | | | | 1/24/2028 | | | | 1,000,000 | | | | 1,000,000 | | | | 912,674 | |
Madison Park Funding LTD 2018-29A, 3M LIBOR + 7.570%^~# | | | 7.79 | | | | 10/18/2030 | | | | 2,000,000 | | | | 1,960,000 | | | | 1,702,548 | |
Madison Park Funding LTD 2019-32E, 3M LIBOR + 7.100%^~ | | | 7.32 | | | | 1/22/2031 | | | | 1,000,000 | | | | 997,800 | | | | 1,000,325 | |
Magnetite CLO LTD 2016-18A, 3M LIBOR + 7.600%^~ | | | 7.82 | | | | 11/15/2028 | | | | 1,400,000 | | | | 1,386,000 | | | | 1,238,364 | |
Neuberger Berman Loan Advisers CLO LTD, 3M LIBOR + 7.050% ^~ | | | 7.27 | | | | 7/21/2031 | | | | 800,000 | | | | 792,000 | | | | 804,538 | |
OCP CLO LTD 2020-19, 3M LIBOR + 6.110% ^~ | | | 6.43 | | | | 7/21/2031 | | | | 800,000 | | | | 713,203 | | | | 796,039 | |
OHA Credit Partners LTD 2015-11A, 3M LIBOR + 7.900%^~ | | | 8.12 | | | | 1/20/2032 | | | | 2,000,000 | | | | 1,970,323 | | | | 1,731,160 | |
OHA Loan Funding LTD 2013-1A, 3M LIBOR + 7.900%^~ | | | 8.11 | | | | 7/23/2031 | | | | 1,500,000 | | | | 1,477,500 | | | | 1,307,006 | |
Sound Point CLO XVIII 2018-18D, 3M LIBOR + 5.500%^~ | | | 5.72 | | | | 1/21/2031 | | | | 2,000,000 | | | | 2,000,000 | | | | 1,762,796 | |
Sound Point CLO Ltd Series 2020-1A Class E, 3M LIBOR + 7.080%^~ | | | 7.39 | | | | 7/22/2030 | | | | 1,600,000 | | | | 1,471,120 | | | | 1,602,810 | |
TICP CLO LTD 2018-10A, 3M LIBOR + 5.500%^~ | | | 5.72 | | | | 4/20/2031 | | | | 1,000,000 | | | | 933,145 | | | | 948,026 | |
Voya CLO LTD 2019-4A, 3M LIBOR + 7.480%^~ | | | 7.72 | | | | 1/18/2033 | | | | 1,400,000 | | | | 1,358,585 | | | | 1,401,628 | |
Wellfleet CLO LTD 2017-3A, 3M LIBOR + 5.550%^~ | | | 5.77 | | | | 1/17/2031 | | | | 1,500,000 | | | | 1,500,000 | | | | 1,354,500 | |
Wind River CLO LTD 2017-4A, 3M LIBOR + 5.800%^~ | | | 6.02 | | | | 11/20/2030 | | | | 1,000,000 | | | | 1,000,000 | | | | 926,511 | |
| | | | | | | | | | | | | | | | | | | | |
Total CDO/CLO | | | | | | | | | | | 40,550,000 | | | | 39,832,064 | | | | 37,942,958 | |
| | | | | | | | | | | | | | | | | | | | |
| | | | | | | | | | | | | | | | | | | | |
Total Asset-Backed Securities | | | | | | | | | | | 40,550,000 | | | | 39,832,064 | | | | 37,942,958 | |
| | | | | | | | | | | | | | | | | | | | |
See accompanying Notes to the Financial Statements.
13
Barings Global Short Duration High Yield Fund 2020 Annual Report
SCHEDULE OF INVESTMENTS (CONTINUED)
December 31, 2020
| | | | | | | | | | | | | | | | | | | | |
| | | EFFECTIVE
INTEREST RATE ‡ | | | DUE DATE | | | PRINCIPAL | | | COST | | | FAIR
VALUE | |
Fixed Income (Continued) | |
| | | | | |
Bank Loans§ — 8.62%*: | | | | | | | | | | | | | | | | | | | | |
|
Automotive — 0.59%*: | |
Dexko Global Inc, 3M LIBOR + 8.250%~ | | | 9.25 | % | | | 7/24/2025 | | | | 2,000,000 | | | | $2,000,000 | | | | $1,982,500 | |
| | | | | | | | | | | | | | | | | | | | |
Total Automotive | | | | | | | | | | | 2,000,000 | | | | 2,000,000 | | | | 1,982,500 | |
| | | | | | | | | | | | | | | | | | | | |
|
Chemicals, Plastics and Rubber — 0.46%*: | |
Colouroz Investment 2 LLC, 3M LIBOR + 7.250%+~ | | | 5.50 | | | | 9/21/2024 | | | | 2,050,737 | | | | 2,042,988 | | | | 1,544,472 | |
| | | | | | | | | | | | | | | | | | | | |
Total Chemicals, Plastics and Rubber | | | | | | | | | | | 2,050,737 | | | | 2,042,988 | | | | 1,544,472 | |
| | | | | | | | | | | | | | | | | | | | |
|
Diversified/Conglomerate Manufacturing — 0.89%*: | |
Averys, 3M LIBOR + 8.250%+~ | | | 8.25 | | | | 9/25/2026 | | | | 500,000 | | | | 571,943 | | | | 531,036 | |
Commercial Vehicle Group Inc., 1M LIBOR + 6.000%~ | | | 5.75 | | | | 4/12/2023 | | | | 544,580 | | | | 538,913 | | | | 522,797 | |
SunSource, Inc., 1M LIBOR + 8.000%~ | | | 9.00 | | | | 4/30/2026 | | | | 2,500,000 | | | | 2,515,048 | | | | 1,926,575 | |
| | | | | | | | | | | | | | | | | | | | |
Total Diversified/Conglomerate Manufacturing | | | | | | | | | | | 3,544,580 | | | | 3,625,904 | | | | 2,980,408 | |
| | | | | | | | | | | | | | | | | | | | |
|
Diversified/Conglomerate Service — 4.67%*: | |
Misys (Finastra), 3M LIBOR + 7.250%~ | | | 8.25 | | | | 6/16/2025 | | | | 15,630,136 | | | | 15,505,118 | | | | 15,635,763 | |
| | | | | | | | | | | | | | | | | | | | |
Total Diversified/Conglomerate Service | | | | | | | | | | | 15,630,136 | | | | 15,505,118 | | | | 15,635,763 | |
| | | | | | | | | | | | | | | | | | | | |
|
Healthcare, Education and Childcare — 1.92%*: | |
Advanz Pharma Corp., 1M LIBOR + 5.500%+~ | | | 6.50 | | | | 9/6/2024 | | | | 3,820,000 | | | | 3,766,565 | | | | 3,726,410 | |
Envision Healtcare, 1M LIBOR + 3.750%~ | | | 3.90 | | | | 10/10/2025 | | | | 3,228,439 | | | | 2,321,862 | | | | 2,683,253 | |
| | | | | | | | | | | | | | | | | | | | |
Total Healthcare, Education and Childcare | | | | | | | | | | | 7,048,439 | | | | 6,088,427 | | | | 6,409,663 | |
| | | | | | | | | | | | | | | | | | | | |
|
Mining, Steel, Iron and Non-Precious Metals — 0.03%*: | |
Boomerang Tube, LLC, 3M LIBOR + 6.500%¤~ | | | 5.15 | | | | 6/30/2022 | | | | 2,608,648 | | | | 2,608,648 | | | | 104,346 | |
| | | | | | | | | | | | | | | | | | | | |
Total Mining, Steel, Iron and Non-Precious Metals | | | | | | | | | | | 2,608,648 | | | | 2,608,648 | | | | 104,346 | |
| | | | | | | | | | | | | | | | | | | | |
|
Oil and Gas — 0.00%*: | |
Fieldwood Energy LLC, 1M LIBOR + 7.250%~ | | | 0.00 | | | | 4/11/2023 | | | | 7,481,592 | | | | 2,720,500 | | | | 1,721 | |
| | | | | | | | | | | | | | | | | | | | |
Total Oil and Gas | | | | | | | | | | | 7,481,592 | | | | 2,720,500 | | | | 1,721 | |
| | | | | | | | | | | | | | | | | | | | |
|
Personal Transportation — 0.06%*: | |
Naviera Armas Bridge, 1M LIBOR + 2.500%¤+~ | | | 5.00 | | | | 4/30/2021 | | | | 106,472 | | | | 128,305 | | | | 127,521 | |
Naviera Armas Bridge, 1M LIBOR + 2.500%¤+~ | | | 0.00 | | | | 4/30/2021 | | | | 60,543 | | | | 69,174 | | | | 68,751 | |
| | | | | | | | | | | | | | | | | | | | |
Total Personal Transportation | | | | | | | | | | | 167,015 | | | | 197,479 | | | | 196,272 | |
| | | | | | | | | | | | | | | | | | | | |
| | | | | | | | | | | | | | | | | | | | |
Total Bank Loans | | | | | | | | | | | 40,531,148 | | | | 34,789,064 | | | | 28,855,145 | |
| | | | | | | | | | | | | | | | | | | | |
Corporate Bonds — 115.70%*: | | | | | | | | | | | | | | | | | | | | |
|
Aerospace and Defense — 4.29%*: | |
Rolls Royce^+ | | | 5.75 | | | | 10/15/2027 | | | | 250,000 | | | | 325,750 | | | | 377,773 | |
TransDigm Group, Inc.# | | | 7.50 | | | | 3/15/2027 | | | | 6,000,000 | | | | 6,023,714 | | | | 6,405,000 | |
See accompanying Notes to the Financial Statements.
14
Barings Global Short Duration High Yield Fund 2020 Annual Report
SCHEDULE OF INVESTMENTS (CONTINUED)
December 31, 2020
| | | | | | | | | | | | | | | | | | | | |
| | | EFFECTIVE
INTEREST RATE ‡ | | | DUE DATE | | | PRINCIPAL | | | COST | | | FAIR
VALUE | |
Fixed Income (Continued) | |
| | | | | |
Corporate Bonds (Continued) | | | | | | | | | | | | | | | | | | | | |
|
Aerospace and Defense (Continued) | |
Triumph Group, Inc.# | | | 7.75 | % | | | 8/15/2025 | | | | 8,289,000 | | | | $8,293,067 | | | | $7,574,074 | |
| | | | | | | | | | | | | | | | | | | | |
Total Aerospace and Defense | | | | | | | | | | | 14,539,000 | | | | 14,642,531 | | | | 14,356,847 | |
| | | | | | | | | | | | | | | | | | | | |
|
Automotive — 6.46%*: | |
Ford Motor Company# | | | 9.63 | | | | 4/22/2030 | | | | 2,000,000 | | | | 2,603,393 | | | | 2,822,500 | |
Ford Motor Company# | | | 7.45 | | | | 7/16/2031 | | | | 2,000,000 | | | | 2,327,377 | | | | 2,565,000 | |
Power Solutions^# | | | 8.50 | | | | 5/15/2027 | | | | 8,965,000 | | | | 9,059,575 | | | | 9,739,660 | |
Truck Hero Inc.^# | | | 8.50 | | | | 4/21/2024 | | | | 6,118,000 | | | | 6,140,149 | | | | 6,492,728 | |
| | | | | | | | | | | | | | | | | | | | |
Total Automotive | | | | | | | | | | | 19,083,000 | | | | 20,130,494 | | | | 21,619,888 | |
| | | | | | | | | | | | | | | | | | | | |
|
Beverage, Food and Tobacco — 1.99%*: | |
Kehe Distributors, LLC^# | | | 8.63 | | | | 10/15/2026 | | | | 1,287,000 | | | | 1,287,000 | | | | 1,444,658 | |
Manitowoc Foodservice# | | | 9.50 | | | | 2/15/2024 | | | | 3,074,000 | | | | 3,195,099 | | | | 3,177,102 | |
Refresco Group N.V.+^# | | | 6.50 | | | | 5/15/2026 | | | | 1,600,000 | | | | 1,931,881 | | | | 2,026,949 | |
| | | | | | | | | | | | | | | | | | | | |
Total Beverage, Food and Tobacco | | | | | | | | | | | 5,961,000 | | | | 6,413,980 | | | | 6,648,709 | |
| | | | | | | | | | | | | | | | | | | | |
|
Broadcasting and Entertainment — 5.29%*: | |
Arqiva Broadcast+^# | | | 6.75 | | | | 9/30/2023 | | | | 2,400,000 | | | | 3,038,647 | | | | 3,383,585 | |
Banijay+^# | | | 6.50 | | | | 3/1/2026 | | | | 2,500,000 | | | | 2,761,119 | | | | 3,060,215 | |
Clear Channel Worldwide Holdings Inc.# | | | 9.25 | | | | 2/15/2024 | | | | 5,469,000 | | | | 5,769,360 | | | | 5,537,363 | |
Cox Media Group^# | | | 8.88 | | | | 12/15/2027 | | | | 1,837,000 | | | | 1,853,762 | | | | 2,025,293 | |
Dish DBS Corp.# | | | 7.75 | | | | 7/1/2026 | | | | 673,000 | | | | 611,892 | | | | 753,767 | |
Townsquare Media Inc.^ | | | 6.50 | | | | 4/1/2023 | | | | 430,000 | | | | 402,498 | | | | 437,568 | |
Univision Communications Inc.^# | | | 9.50 | | | | 5/1/2025 | | | | 2,234,000 | | | | 2,481,405 | | | | 2,485,325 | |
| | | | | | | | | | | | | | | | | | | | |
Total Broadcasting and Entertainment | | | | | | | | | | | 15,543,000 | | | | 16,918,683 | | | | 17,683,116 | |
| | | | | | | | | | | | | | | | | | | | |
|
Buildings and Real Estate — 3.16%*: | |
Cemex S.A.B. de C.V.^# | | | 7.38 | | | | 6/5/2027 | | | | 698,000 | | | | 698,000 | | | | 794,324 | |
New Enterprise Stone & Lime Co.^# | | | 9.75 | | | | 7/15/2028 | | | | 665,000 | | | | 665,000 | | | | 728,175 | |
Realogy Group^# | | | 9.38 | | | | 4/1/2027 | | | | 3,763,000 | | | | 3,586,302 | | | | 4,167,523 | |
Realogy Group^ | | | 7.63 | | | | 6/15/2025 | | | | 329,000 | | | | 329,000 | | | | 357,202 | |
Service Properties Trust | | | 4.38 | | | | 2/15/2030 | | | | 400,000 | | | | 347,926 | | | | 390,000 | |
Stl Hldg Co LLC^# | | | 7.50 | | | | 2/15/2026 | | | | 4,000,000 | | | | 4,000,000 | | | | 4,150,000 | |
| | | | | | | | | | | | | | | | | | | | |
Total Buildings and Real Estate | | | | | | | | | | | 9,855,000 | | | | 9,626,228 | | | | 10,587,224 | |
| | | | | | | | | | | | | | | | | | | | |
|
Cargo Transport — 2.99%*: | |
Kenan Advantage^# | | | 7.88 | | | | 7/31/2023 | | | | 10,000,000 | | | | 10,033,211 | | | | 10,000,000 | |
| | | | | | | | | | | | | | | | | | | | |
Total Cargo Transport | | | | | | | | | | | 10,000,000 | | | | 10,033,211 | | | | 10,000,000 | |
| | | | | | | | | | | | | | | | | | | | |
|
Chemicals, Plastics and Rubber — 4.62%*: | |
Carlyle Group^# | | | 8.75 | | | | 6/1/2023 | | | | 2,600,118 | | | | 2,574,377 | | | | 2,619,619 | |
Consolidated Energy Finance S.A.^# | | | 6.88 | | | | 6/15/2025 | | | | 3,560,000 | | | | 3,426,913 | | | | 3,608,950 | |
Consolidated Energy Finance S.A.^ | | | 6.50 | | | | 5/15/2026 | | | | 2,799,000 | | | | 2,034,626 | | | | 2,799,000 | |
CVR Partners LP^# | | | 9.25 | | | | 6/15/2023 | | | | 4,576,000 | | | | 4,543,382 | | | | 4,580,759 | |
Diversey^# | | | 5.63 | | | | 8/15/2025 | | | | 1,500,000 | | | | 1,627,880 | | | | 1,853,171 | |
| | | | | | | | | | | | | | | | | | | | |
Total Chemicals, Plastics and Rubber | | | | | | | | | | | 15,035,118 | | | | 14,207,178 | | | | 15,461,499 | |
| | | | | | | | | | | | | | | | | | | | |
See accompanying Notes to the Financial Statements.
15
Barings Global Short Duration High Yield Fund 2020 Annual Report
SCHEDULE OF INVESTMENTS (CONTINUED)
December 31, 2020
| | | | | | | | | | | | | | | | | | | | |
| | | EFFECTIVE
INTEREST RATE ‡ | | | DUE DATE | | | PRINCIPAL | | | COST | | | FAIR
VALUE | |
Fixed Income (Continued) | |
| | | | | |
Corporate Bonds (Continued) | | | | | | | | | | | | | | | | | | | | |
|
Containers, Packaging, and Glass — 3.32%*: | |
Mauser Packaging Solutions^# | | | 7.25 | % | | | 4/15/2025 | | | | 2,575,000 | | | | $2,456,803 | | | | $2,600,750 | |
Tekni-Plex^# | | | 9.25 | | | | 8/1/2024 | | | | 8,000,000 | | | | 7,905,687 | | | | 8,520,000 | |
| | | | | | | | | | | | | | | | | | | | |
Total Containers, Packaging, and Glass | | | | | | | | | | | 10,575,000 | | | | 10,362,490 | | | | 11,120,750 | |
| | | | | | | | | | | | | | | | | | | | |
|
Diversified/Conglomerate Manufacturing — 1.66%*: | |
Heat Exchangers+^ | | | 7.78 | | | | 10/9/2025 | | | | 625,000 | | | | 657,723 | | | | 653,579 | |
Manitowoc Cranes^# | | | 9.00 | | | | 4/1/2026 | | | | 4,538,000 | | | | 4,545,995 | | | | 4,901,040 | |
| | | | | | | | | | | | | | | | | | | | |
Total Diversified/Conglomerate Manufacturing | | | | | | | | | | | 5,163,000 | | | | 5,203,718 | | | | 5,554,619 | |
| | | | | | | | | | | | | | | | | | | | |
|
Diversified/Conglomerate Service — 3.39%*: | |
Algeco Scotsman+^# | | | 6.50 | | | | 2/15/2023 | | | | 1,750,000 | | | | 2,142,120 | | | | 2,164,513 | |
Carlson Travel Holdings Inc.^# | | | 11.50 | | | | 12/15/2026 | | | | 6,078,253 | | | | 6,086,402 | | | | 3,297,452 | |
Endurance International Group LLC# | | | 10.88 | | | | 2/1/2024 | | | | 1,324,000 | | | | 1,372,902 | | | | 1,369,678 | |
Powerteam Services LLC^# | | | 9.03 | | | | 12/4/2025 | | | | 2,750,000 | | | | 2,988,790 | | | | 3,059,678 | |
Summer BC Holdco+^ | | | 9.25 | | | | 10/31/2027 | | | | 1,126,301 | | | | 1,353,596 | | | | 1,451,338 | |
| | | | | | | | | | | | | | | | | | | | |
Total Diversified/Conglomerate Service | | | | | | | | | | | 13,028,554 | | | | 13,943,810 | | | | 11,342,659 | |
| | | | | | | | | | | | | | | | | | | | |
|
Diversified Natural Resources, Precious Metals and Minerals — 0.03%*: | |
Northwest Acquisitions ULC+^ | | | 7.13 | | | | 11/1/2022 | | | | 16,122,000 | | | | 12,416,503 | | | | 108,824 | |
| | | | | | | | | | | | | | | | | | | | |
Total Diversified/Conglomerate Service | | | | | | | | | | | 16,122,000 | | | | 12,416,503 | | | | 108,824 | |
| | | | | | | | | | | | | | | | | | | | |
|
Electronics — 6.53%*: | |
Solera LLC# | | | 10.50 | | | | 3/1/2024 | | | | 1,000,000 | | | | 1,050,224 | | | | 1,036,250 | |
Wesco Distribution Inc.^ | | | 7.13 | | | | 6/15/2025 | | | | 460,000 | | | | 460,000 | | | | 505,922 | |
Wesco Distribution Inc.^ | | | 7.25 | | | | 6/15/2028 | | | | 475,000 | | | | 471,409 | | | | 540,213 | |
Veritas Bermuda Ltd.^# | | | 10.50 | | | | 2/1/2024 | | | | 16,957,000 | | | | 15,176,123 | | | | 17,211,355 | |
Veritas Bermuda Ltd.^# | | | 7.50 | | | | 9/1/2025 | | | | 2,024,000 | | | | 2,024,000 | | | | 2,077,130 | |
Presidio Inc.^# | | | 8.25 | | | | 2/1/2028 | | | | 430,000 | | | | 430,000 | | | | 474,075 | |
| | | | | | | | | | | | | | | | | | | | |
Total Electronics | | | | | | | | | | | 21,346,000 | | | | 19,611,756 | | | | 21,844,945 | |
| | | | | | | | | | | | | | | | | | | | |
|
Finance — 5.26%*: | |
Alliance Data Systems Corp.^# | | | 7.00 | | | | 1/15/2026 | | | | 2,000,000 | | | | 1,992,500 | | | | 2,115,600 | |
Avolon Holdings^# | | | 6.50 | | | | 9/15/2024 | | | | 8,214,611 | | | | 6,396,566 | | | | 7,331,541 | |
Galaxy Bidco Ltd.+^# | | | 6.50 | | | | 7/31/2026 | | | | 1,850,000 | | | | 2,352,475 | | | | 2,638,968 | |
Garfunkelux Holdco+^ | | | 6.75 | | | | 11/1/2025 | | | | 450,000 | | | | 533,833 | | | | 563,483 | |
Travelex¤+^ | | | 12.50 | | | | 8/5/2025 | | | | 2,015,000 | | | | 2,275,272 | | | | 4,959,932 | |
Travelex¤+^# | | | 8.00 | | | | 5/15/2022 | | | | 4,600,000 | | | | 5,097,344 | | | | 0 | |
| | | | | | | | | | | | | | | | | | | | |
Total Finance | | | | | | | | | | | 19,129,611 | | | | 18,647,990 | | | | 17,609,524 | |
| | | | | | | | | | | | | | | | | | | | |
|
Healthcare, Education and Childcare — 7.20%*: | |
Advanz Pharma Corp.+ | | | 8.00 | | | | 9/6/2024 | | | | 3,743,000 | | | | 3,681,160 | | | | 3,780,430 | |
Bausch Health Companies Inc.^# | | | 9.00 | | | | 12/15/2025 | | | | 11,045,000 | | | | 11,260,894 | | | | 12,193,128 | |
Endo International^# | | | 7.50 | | | | 4/1/2027 | | | | 1,890,000 | | | | 1,890,000 | | | | 2,050,650 | |
Radiology Partners Inc.^# | | | 9.25 | | | | 2/1/2028 | | | | 2,586,000 | | | | 2,779,811 | | | | 2,902,785 | |
See accompanying Notes to the Financial Statements.
16
Barings Global Short Duration High Yield Fund 2020 Annual Report
SCHEDULE OF INVESTMENTS (CONTINUED)
December 31, 2020
| | | | | | | | | | | | | | | | | | | | |
| | | EFFECTIVE
INTEREST RATE ‡ | | | DUE DATE | | | PRINCIPAL | | | COST | | | FAIR
VALUE | |
Fixed Income (Continued) | |
| | | | | |
Corporate Bonds (Continued) | | | | | | | | | | | | | | | | | | | | |
|
Healthcare, Education and Childcare (Continued) | |
Verscend Technologies, Inc.^# | | | 9.75 | % | | | 8/15/2026 | | | | 2,915,000 | | | | $3,071,507 | | | | $3,159,131 | |
| | | | | | | | | | | | | | | | | | | | |
Total Healthcare, Education and Childcare | | | | | | | | | | | 22,179,000 | | | | 22,683,372 | | | | 24,086,124 | |
| | | | | | | | | | | | | | | | | | | | |
|
Home and Office Furnishings, Housewares, and Durable Consumer Products — 0.50%*: | |
Balta+^# | | | 7.75 | | | | 9/15/2022 | | | | 1,449,900 | | | | 1,607,043 | | | | 1,675,675 | |
| | | | | | | | | | | | | | | | | | | | |
Total Home and Office Furnishings, Housewares, and Durable Consumer Products | | | | | | | | | | | 1,449,900 | | | | 1,607,043 | | | | 1,675,675 | |
| | | | | | | | | | | | | | | | | | | | |
|
Hotels, Motels, Inns and Gaming — 1.71%*: | |
Boyne USA, Inc.^# | | | 7.25 | | | | 5/1/2025 | | | | 950,000 | | | | 950,000 | | | | 996,313 | |
Scientific Games International Inc.^# | | | 8.63 | | | | 7/1/2025 | | | | 4,325,000 | | | | 4,416,076 | | | | 4,735,875 | |
| | | | | | | | | | | | | | | | | | | | |
Total Hotels, Motels, Inns and Gaming | | | | | | | | | | | 5,275,000 | | | | 5,366,076 | | | | 5,732,188 | |
| | | | | | | | | | | | | | | | | | | | |
|
Insurance — 4.73%*: | |
Acrisure LLC^# | | | 10.13 | | | | 8/1/2026 | | | | 9,575,000 | | | | 9,751,551 | | | | 10,987,313 | |
Acrisure LLC^# | | | 8.13 | | | | 2/15/2024 | | | | 4,564,000 | | | | 4,666,248 | | | | 4,831,975 | |
| | | | | | | | | | | | | | | | | | | | |
Total Insurance | | | | | | | | | | | 14,139,000 | | | | 14,417,799 | | | | 15,819,288 | |
| | | | | | | | | | | | | | | | | | | | |
| | | | | |
Leisure, Amusement, Entertainment — 2.77%*: | | | | | | | | | | | | | | | | | | | | |
Carnival Corp.^ | | | 7.63 | | | | 3/1/2026 | | | | 1,000,000 | | | | 1,185,944 | | | | 1,292,376 | |
Center Parcs+^ | | | 6.50 | | | | 8/28/2026 | | | | 900,000 | | | | 1,253,715 | | | | 1,278,407 | |
Eldorado Resorts^# | | | 8.13 | | | | 7/1/2027 | | | | 4,000,000 | | | | 3,894,336 | | | | 4,428,090 | |
Motion Finco+^ | | | 7.00 | | | | 5/15/2025 | | | | 1,750,000 | | | | 1,932,647 | | | | 2,250,113 | |
| | | | | | | | | | | | | | | | | | | | |
Total Leisure, Amusement, Entertainment | | | | | | | | | | | 7,650,000 | | | | 8,266,642 | | | | 9,248,986 | |
| | | | | | | | | | | | | | | | | | | | |
|
Machinery (Non-Agriculture, Non-Construct, Non-Electronic) — 4.38%*: | |
Apex Tool Group LLC^# | | | 9.00 | | | | 2/15/2023 | | | | 5,627,000 | | | | 5,480,980 | | | | 5,514,460 | |
Diebold Nixdorf Inc.^# | | | 9.38 | | | | 7/15/2025 | | | | 5,577,000 | | | | 5,945,474 | | | | 6,246,240 | |
Diebold Nixdorf Inc.^ | | | 9.00 | | | | 7/15/2025 | | | | 815,000 | | | | 959,187 | | | | 1,080,268 | |
Sarens+^# | | | 5.75 | | | | 2/21/2027 | | | | 1,625,000 | | | | 1,783,930 | | | | 1,826,395 | |
| | | | | | | | | | | | | | | | | | | | |
Total Machinery (Non-Agriculture, Non-Construct, Non-Electronic) | | | | | | | | | | | 13,644,000 | | | | 14,169,571 | | | | 14,667,363 | |
| | | | | | | | | | | | | | | | | | | | |
|
Mining, Steel, Iron and Non-Precious Metals — 14.58%*: | |
Cleveland-Cliffs Inc.^# | | | 9.88 | | | | 10/17/2025 | | | | 6,000,000 | | | | 6,571,847 | | | | 7,057,500 | |
Consol Energy Inc.^# | | | 11.00 | | | | 11/15/2025 | | | | 10,316,000 | | | | 10,684,566 | | | | 7,633,840 | |
First Quantum Minerals+^# | | | 7.25 | | | | 4/1/2023 | | | | 2,000,000 | | | | 1,945,342 | | | | 2,061,350 | |
First Quantum Minerals+^# | | | 7.50 | | | | 4/1/2025 | | | | 9,775,000 | | | | 9,426,389 | | | | 10,178,219 | |
First Quantum Minerals+^ | | | 6.88 | | | | 10/15/2027 | | | | 200,000 | | | | 200,000 | | | | 217,000 | |
Hecla Mining Company# | | | 7.25 | | | | 2/15/2028 | | | | 2,099,000 | | | | 2,277,548 | | | | 2,293,158 | |
International Wire Group Inc.^# | | | 10.75 | | | | 8/1/2021 | | | | 7,389,000 | | | | 7,299,397 | | | | 7,389,000 | |
Perenti Finance Pty Ltd+^# | | | 6.50 | | | | 10/7/2025 | | | | 2,500,000 | | | | 2,500,000 | | | | 2,659,454 | |
SunCoke Energy Inc.^# | | | 7.50 | | | | 6/15/2025 | | | | 5,743,000 | | | | 5,721,235 | | | | 5,701,076 | |
See accompanying Notes to the Financial Statements.
17
Barings Global Short Duration High Yield Fund 2020 Annual Report
SCHEDULE OF INVESTMENTS (CONTINUED)
December 31, 2020
| | | | | | | | | | | | | | | | | | | | |
| | | EFFECTIVE
INTEREST RATE ‡ | | | DUE DATE | | | PRINCIPAL | | | COST | | | FAIR
VALUE | |
Fixed Income (Continued) | |
| | | | | |
Corporate Bonds (Continued) | | | | | | | | | | | | | | | | | | | | |
|
Mining, Steel, Iron and Non-Precious Metals (Continued) | |
Warrior Met Coal Inc.^# | | | 8.00 | % | | | 11/1/2024 | | | | 3,513,000 | | | | $3,587,677 | | | | $3,592,043 | |
| | | | | | | | | | | | | | | | | | | | |
Total Mining, Steel, Iron and Non-Precious Metals | | | | | | | | | | | 49,535,000 | | | | 50,214,001 | | | | 48,782,640 | |
| | | | | | | | | | | | | | | | | | | | |
|
Oil and Gas — 16.05%*: | |
Antero Resources Corp.^ | | | 8.38 | | | | 7/15/2026 | | | | 451,000 | | | | 452,600 | | | | 460,331 | |
Blue Racer Midstream LLC^ | | | 7.63 | | | | 12/15/2025 | | | | 361,000 | | | | 361,000 | | | | 384,465 | |
Calumet Specialty Products^# | | | 11.00 | | | | 4/15/2025 | | | | 1,030,000 | | | | 1,062,129 | | | | 1,040,300 | |
Calumet Specialty Products^# | | | 9.25 | | | | 7/15/2024 | | | | 2,850,000 | | | | 2,747,985 | | | | 3,163,500 | |
CVR Energy Inc.^ | | | 5.75 | | | | 2/15/2028 | | | | 3,850,000 | | | | 3,304,616 | | | | 3,647,875 | |
Enlink Midstream Partners LP | | | 4.85 | | | | 7/15/2026 | | | | 200,000 | | | | 174,647 | | | | 195,268 | |
Enlink Midstream Partners LP | | | 4.40 | | | | 4/1/2024 | | | | 239,000 | | | | 218,459 | | | | 235,838 | |
Enlink Midstream Partners LP | | | 5.60 | | | | 4/1/2044 | | | | 5,413,000 | | | | 3,551,651 | | | | 4,343,923 | |
Genesis Energy LP# | | | 7.75 | | | | 2/1/2028 | | | | 3,408,000 | | | | 3,111,766 | | | | 3,263,160 | |
Harvest Midstream I L P^ | | | 7.50 | | | | 9/1/2028 | | | | 458,000 | | | | 458,000 | | | | 487,198 | |
Hilcorp Energy I L P^# | | | 6.25 | | | | 11/1/2028 | | | | 3,202,000 | | | | 2,779,140 | | | | 3,270,043 | |
KCA Deutag¤+^ | | | 9.88 | | | | 12/1/2025 | | | | 1,179,286 | | | | 1,179,286 | | | | 1,223,509 | |
Laredo Petroleum Inc. | | | 10.13 | | | | 1/15/2028 | | | | 3,765,000 | | | | 3,668,171 | | | | 3,200,250 | |
MEG Energy Corp.+^# | | | 7.13 | | | | 2/1/2027 | | | | 2,698,000 | | | | 2,522,071 | | | | 2,785,685 | |
Neptune Energy Bondco PLC^# | | | 6.63 | | | | 5/15/2025 | | | | 4,306,000 | | | | 3,908,745 | | | | 4,259,797 | |
Occidental Pete Corp.# | | | 8.50 | | | | 7/15/2027 | | | | 4,523,000 | | | | 4,573,184 | | | | 5,219,768 | |
Occidental Pete Corp.# | | | 7.88 | | | | 9/15/2031 | | | | 2,500,000 | | | | 2,659,015 | | | | 2,787,500 | |
Occidental Pete Corp. | | | 4.50 | | | | 7/15/2044 | | | | 586,000 | | | | 435,873 | | | | 496,635 | |
Ovintiv Inc. | | | 6.50 | | | | 8/15/2034 | | | | 500,000 | | | | 477,756 | | | | 579,020 | |
Ovintiv Inc.# | | | 6.50 | | | | 2/1/2038 | | | | 2,000,000 | | | | 1,836,522 | | | | 2,233,311 | |
PBF Holding Co LLC^ | | | 9.25 | | | | 5/15/2025 | | | | 1,196,000 | | | | 1,187,673 | | | | 1,179,136 | |
PBF Holding Co LLC | | | 6.00 | | | | 2/15/2028 | | | | 6,000,000 | | | | 4,937,032 | | | | 3,427,500 | |
Southwestern Energy Co. | | | 8.38 | | | | 9/15/2028 | | | | 449,000 | | | | 449,000 | | | | 487,165 | |
Welltec A/S+^# | | | 9.50 | | | | 12/1/2022 | | | | 5,713,000 | | | | 5,681,766 | | | | 5,313,090 | |
| | | | | | | | | | | | | | | | | | | | |
Total Oil and Gas | | | | | | | | | | | 56,877,286 | | | | 51,738,087 | | | | 53,684,267 | |
| | | | | | | | | | | | | | | | | | | | |
|
Personal Transportation — 1.15%*: | |
American Airlines^# | | | 11.75 | | | | 7/15/2025 | | | | 3,000,000 | | | | 2,970,000 | | | | 3,459,750 | |
Naviera Armas, 3M EURIBOR + 4.250%+^~ | | | 4.25 | | | | 11/15/2024 | | | | 150,000 | | | | 127,479 | | | | 81,893 | |
Naviera Armas, 3M EURIBOR + 6.500%+^~ | | | 6.50 | | | | 7/31/2023 | | | | 525,000 | | | | 608,346 | | | | 298,431 | |
| | | | | | | | | | | | | | | | | | | | |
Total Personal Transportation | | | | | | | | | | | 3,675,000 | | | | 3,705,825 | | | | 3,840,074 | |
| | | | | | | | | | | | | | | | | | | | |
| | | | | |
Printing and Publishing — 1.79%*: | | | | | | | | | | | | | | | | | | | | |
Cimpress N.V.^# | | | 7.00 | | | | 6/15/2026 | | | | 2,069,000 | | | | 2,069,000 | | | | 2,175,036 | |
Houghton Mifflin Harcourt Publishers Inc.^# | | | 9.00 | | | | 2/15/2025 | | | | 3,000,000 | | | | 2,949,793 | | | | 3,052,500 | |
IPD 3 BV+^ | | | 5.50 | | | | 12/1/2025 | | | | 600,000 | | | | 712,682 | | | | 754,975 | |
| | | | | | | | | | | | | | | | | | | | |
Total Printing and Publishing | | | | | | | | | | | 5,669,000 | | | | 5,731,475 | | | | 5,982,511 | |
| | | | | | | | | | | | | | | | | | | | |
See accompanying Notes to the Financial Statements.
18
Barings Global Short Duration High Yield Fund 2020 Annual Report
SCHEDULE OF INVESTMENTS (CONTINUED)
December 31, 2020
| | | | | | | | | | | | | | | | | | | | |
| | | EFFECTIVE
INTEREST RATE ‡ | | | DUE DATE | | | PRINCIPAL | | | COST | | | FAIR
VALUE | |
Fixed Income (Continued) | |
| | | | | |
Corporate Bonds (Continued) | | | | | | | | | | | | | | | | | | | | |
|
Retail Store — 1.68%*: | |
At Home Holding III INC^# | | | 8.75 | % | | | 9/1/2025 | | | | 2,000,000 | | | | $2,102,700 | | | | $2,165,000 | |
Casino Guichard Perracho+^ | | | 6.63 | | | | 1/15/2026 | | | | 1,050,000 | | | | 1,279,474 | | | | 1,292,345 | |
Michaels Stores Inc.^# | | | 8.00 | | | | 7/15/2027 | | | | 2,000,000 | | | | 2,104,204 | | | | 2,150,000 | |
| | | | | | | | | | | | | | | | | | | | |
Total Retail Store | | | | | | | | | | | 5,050,000 | | | | 5,486,378 | | | | 5,607,345 | |
| | | | | | | | | | | | | | | | | | | | |
|
Telecommunications — 8.83%*: | |
Altice France Holding S.A.^# | | | 10.50 | | | | 5/15/2027 | | | | 2,000,000 | | | | 2,250,655 | | | | 2,245,000 | |
BMC Software^# | | | 9.75 | | | | 9/1/2026 | | | | 9,682,000 | | | | 9,553,038 | | | | 10,458,012 | |
Commscope Inc.^# | | | 8.25 | | | | 3/1/2027 | | | | 11,673,000 | | | | 11,690,192 | | | | 12,460,928 | |
Consolidated Communications^# | | | 6.50 | | | | 10/1/2028 | | | | 832,000 | | | | 832,000 | | | | 890,240 | |
Digicel Limited ¤+^# | | | 8.25 | | | | 9/30/2020 | | | | 2,500,000 | | | | 2,491,364 | | | | 0 | |
Northwest Fiber LLC^# | | | 10.75 | | | | 6/1/2028 | | | | 1,206,000 | | | | 1,332,158 | | | | 1,374,840 | |
Viasat^# | | | 6.50 | | | | 7/15/2028 | | | | 790,000 | | | | 790,000 | | | | 854,946 | |
Windstream Escrow LLC^# | | | 7.75 | | | | 8/15/2028 | | | | 1,251,000 | | | | 1,246,000 | | | | 1,259,757 | |
| | | | | | | | | | | | | | | | | | | | |
Total Telecommunications | | | | | | | | | | | 29,934,000 | | | | 30,185,407 | | | | 29,543,723 | |
| | | | | | | | | | | | | | | | | | | | |
|
Utilities — 1.34%*: | |
Techem+^# | | | 6.00 | | | | 7/30/2026 | | | | 3,500,000 | | | | 3,996,234 | | | | 4,479,275 | |
| | | | | | | | | | | | | | | | | | | | |
Total Utilities | | | | | | | | | | | 3,500,000 | | | | 3,996,234 | | | | 4,479,275 | |
| | | | | | | | | | | | | | | | | | | | |
Total Corporate Bonds | | | | | | | | | | | 393,957,469 | | | | 389,726,482 | | | | 387,088,063 | |
| | | | | | | | | | | | | | | | | | | | |
Total Fixed Income | | | | | | | | | | | 475,038,617 | | | | 464,347,610 | | | | 453,886,166 | |
| | | | | | | | | | | | | | | | | | | | |
Total Investments | | | | | | | | | | | 476,460,229 | | | | 478,817,979 | | | | 458,897,234 | |
| | | | | | | | | | | | | | | | | | | | |
| |
Other assets and liabilities — (37.16)% | | | | (124,321,130 | ) |
| | | | | | | | | | | | | | | | | | | | |
| |
Net Assets — 100% | | | | $334,576,104 | |
| | | | | | | | | | | | | | | | | | | | |
| ‡ | The effective interest rates are based on settled commitment amount. |
| * | Calculated as a percentage of net assets applicable to common shareholders. |
| ¤ | Value determined using significant unobservable inputs, security is categorized as Level 3. |
| ^ | Security exempt from registration under Rule 144a of the Securities Act of 1933. These securities may only be resold in transactions exempt from registration, normally to qualified institutional buyers. |
| ~ | Variable rate security. The interest rate shown is the rate in effect at December 31, 2020. |
| # | All or a portion of the security is segregated as collateral for the credit facility. |
| § | Bank loans are exempt from registration under the Securities Act of 1933, as amended, but contain certain restrictions on resale and cannot be sold publicly. These loans pay interest at rates which adjust periodically. The interest rates shown for bank loans are the current interest rates at December 31, 2020. Bank loans are also subject to mandatory and/or optional prepayment which cannot be predicted. As a result, the remaining maturity may be substantially less than the stated maturity shown. |
| & | Jupiter Resources Inc. common stock restructured into 276,778 shares of Tourmaline Oil Corp. common stock. The restructure was completed in February 2021. |
See accompanying Notes to the Financial Statements.
19
Barings Global Short Duration High Yield Fund 2020 Annual Report
SCHEDULE OF INVESTMENTS (CONTINUED)
December 31, 2020
Distributions of investments by country of risk. Percentage of assets are expressed by market value excluding cash and accrued income as of December 31, 2020.
| | | | | | |
| | United States | | | 82.9% | |
| | United Kingdom | | | 5.5% | |
| | Canada | | | 2.1% | |
| | Zambia | | | 2.7% | |
| | Germany | | | 1.3% | |
| | Denmark | | | 1.2% | |
| | France | | | 2.2% | |
| | Belgium | | | 0.8% | |
| | Australia | | | 0.6% | |
| | (Individually less than 1%) | | | 0.7% | |
| | | | | | |
| | | | | 100.0% | |
| | | | | | |
A summary of outstanding derivatives at December 31, 2020 is as follows:
Schedule of Open Forward Currency Contracts
December 31, 2020
| | | | | | | | | | | | | | | | | | | | | | | | |
CURRENCY TO BE
RECEIVED | | | | | CURRENCY TO BE
DELIVERED(1) | | | | | | COUNTERPARTY OF
CONTRACT | | | FORWARD
SETTLEMENT
DATE | | | UNREALIZED
APPRECIATION /
(DEPRECIATION) | |
| | 27,951,072 | | | USD | | | (23,011,893 | ) | | | EUR | | | | Morgan Stanley | | | | 1/14/2021 | | | $ | (171,678 | ) |
| | 11,755,825 | | | USD | | | (8,820,221 | ) | | | GBP | | | | Morgan Stanley | | | | 1/14/2021 | | | | (307,360 | ) |
| | 794,747 | | | USD | | | (591,998 | ) | | | GBP | | | | JP Morgan Chase | | | | 1/14/2021 | | | | (14,914 | ) |
| | | | | | | | | | | | | | | | | | | | | | | | |
| | | | | | | | | | | | | | | | | | | | | | $ | (493,952 | ) |
| | | | | | | | | | | | | | | | | | | | | | | | |
| (1) | Values are listed in U.S. dollars. |
See accompanying Notes to the Financial Statements.
20
Barings Global Short Duration High Yield Fund 2020 Annual Report
NOTES TO THE FINANCIAL STATEMENTS
December 31, 2020
Barings Global Short Duration High Yield Fund (the “Fund”) was organized as a business trust under the laws of the Commonwealth of Massachusetts on May 20, 2011, and commenced operations on October 26, 2012. The Fund is registered under the Investment Company Act of 1940, as amended (the “1940 Act”), as a de facto diversified, closed-end management investment company.
Barings LLC (the “Adviser”), a wholly-owned indirect subsidiary of Massachusetts Mutual Life Insurance Company, is a registered investment adviser under the Investment Advisers Act of 1940, as amended, and serves as investment adviser to the Fund.
Baring International Investment Limited (the “Sub-Adviser”), an indirect wholly-owned subsidiary of the Adviser, serves as sub-adviser with respect to the Fund’s European investments.
The Fund’s primary investment objective is to seek as high a level of current income as the Adviser determines is consistent with capital preservation. The Fund seeks capital appreciation as a secondary investment objective when consistent with its primary investment objective. There can be no assurance that the Fund will achieve its investment objectives. The Fund seeks to take advantage of inefficiencies between geographies, primarily the North American and Western European high yield bond and loan markets and within capital structures between bonds and loans. Under normal market conditions, the Fund will invest at least 80% of its Managed Assets in bonds, loans and other income-producing instruments that are, at the time of purchase, rated below investment grade (below Baa3 by Moody’s Investors Service, Inc. (“Moody’s”) or below BBB- by either Standard & Poor’s Global Ratings, a division of the McGraw-Hill Company, Inc. (“S&P”) or Fitch Ratings, Inc. (Fitch), or unrated but judged by the Adviser or Sub-Adviser to be of comparable quality).
| 2. | Significant Accounting Policies |
The Fund is an investment company and follows accounting and reporting guidance in Financial Accounting Standards Board (“FASB”) Accounting Standards Codification Topic 946. The following is a summary of significant accounting policies followed consistently by the Fund in the preparation of its financial statements in conformity with accounting principles generally accepted in the United States of America (“U.S. GAAP”).
| | A. | Valuation of Investments |
The Fund’s investments in fixed income securities are generally valued using the prices provided directly by independent third party services or provided directly from one or more broker dealers or market makers, each in accordance with the valuation policies and procedures approved by the Fund’s Board of Trustees (the “Board”).
The pricing services may use valuation models or matrix pricing, which consider yield or prices with respect to comparable bond quotations from bond dealers or by reference to other securities that are considered comparable in such characteristics as credit rating, interest rates and maturity date, to determine the current value. The closing prices of domestic or foreign securities may not reflect their market values at the time the Fund calculates its NAV if an event that materially affects the value of those securities has occurred since the closing prices were established on the domestic or foreign exchange market, but before the Fund’s NAV calculation. Under certain conditions, the Board has approved an independent pricing service to fair value foreign securities. This is generally accomplished by adjusting the closing price for movements in correlated indices, securities or derivatives. Fair value pricing may cause the value of the security on the books of the Fund to be different from the closing value on the non-U.S. exchange and may affect the calculation of the Fund’s NAV. The Fund may fair value securities in other situations, for example, when a particular foreign market is closed but the Fund is pricing their shares.
The Fund’s investments in bank loans are normally valued at the bid quotation obtained from dealers in loans by an independent pricing service in accordance with the Fund’s valuation policies and procedures approved by the Board.
Forward foreign exchange contracts are normally valued on the basis of independent pricing service providers.
A Valuation Committee, made up of officers of the Fund and employees of the Adviser, is responsible for determining, in accordance with the Fund’s valuation policies and procedures approved by the Board: (1) whether market quotations are readily available for investments held by the Fund; and (2) the fair value of investments held by the Fund for which market quotations are not readily available or are deemed not reliable by the Adviser. In certain cases, authorized pricing service vendors may not provide prices for a security held by the Fund, or the price provided by such
21
Barings Global Short Duration High Yield Fund 2020 Annual Report
NOTES TO THE FINANCIAL STATEMENTS (CONTINUED)
December 31, 2020
pricing service vendor is deemed unreliable by the Adviser. In such cases, the Fund may use market maker quotations provided by an established market maker for that security (i.e. broker quotes) to value the security if the Adviser has experience obtaining quotations from the market maker and the Adviser determines that quotations obtained from the market maker in the past have generally been reliable (or, if the Adviser has no such experience with respect to a market maker, it determines based on other information available to it that quotations obtained by it from the market maker are reasonably likely to be reliable). In any such case, the Adviser will review any market quotations so obtained in light of other information in its possession for their general reliability.
Bank loans in which the Fund may invest have similar risks to lower-rated fixed income securities. Changes in the financial condition of the borrower or economic conditions or other circumstances may reduce the capacity of the borrower to make principal and interest payments on such instruments and may lead to defaults. Senior secured bank loans are supported by collateral; however, the value of the collateral may be insufficient to cover the amount owed to the Fund. By relying on a third party to administer a loan, the Fund is subject to the risk that the third party will fail to perform it obligations. The loans in which the Fund will invest are largely floating rate instruments; therefore, the interest rate risk generally is lower than for fixed-rate debt obligations. However, from the perspective of the borrower, an increase in interest rates may adversely affect the borrower’s financial condition. Due to the unique and customized nature of loan agreements evidencing loans and the private syndication thereof, loans are not as easily purchased or sold as publicly traded securities. Although the range of investors in loans has broadened in recent years, there can be no assurance that future levels of supply and demand in loan trading will provide the degree of liquidity which currently exists in the market. In addition, the terms of the loans may restrict their transferability without borrower consent. These factors may have an adverse effect on the market price and the Fund’s ability to dispose of particular portfolio investments. A less liquid secondary market also may make it more difficult for the Fund to obtain precise valuations of the high yield loans in its portfolio.
The Fund may invest in collateralized debt obligations (“CDOs”), which include collateralized bond obligations (“CBOs”) and collateralized loan obligations (“CLOs”).
CBOs and CLOs are types of asset-backed securities. A CDO is an entity that is backed by a diversified pool of debt securities (CBOs) or syndicated bank loans (CLOs). The cash flows of the CDO can be split into multiple segments, called “tranches,” which will vary in risk profile and yield. The riskiest segment is the subordinated or “equity” tranche. This tranche bears the greatest risk of defaults from the underlying assets in the CDO and serves to protect the other, more senior, tranches from default in all but the most severe circumstances. Since it is shielded from defaults by the more junior tranches, a “senior” tranche will typically have higher credit ratings and lower yields than their underlying securities, and often receive investment grade ratings from one or more of the nationally recognized rating agencies. Despite the protection from the more junior tranches, senior tranches can experience substantial losses due to actual defaults, increased sensitivity to future defaults and the disappearance of one or more protecting tranches as a result of changes in the credit profile of the underlying pool of assets.
Fair value is defined as the price that would be received to sell an asset or paid to transfer a liability in an orderly transaction between market participants at the measurement date. A three-tier hierarchy is utilized to maximize the use of observable market data and minimize the use of unobservable inputs and to establish classification of fair value measurements for disclosure purposes. Inputs refer broadly to the assumptions that market participants would use in pricing the asset or liability, including assumptions about risk. For example, market participants would consider the risk inherent in a particular valuation technique used to measure fair value, such as a pricing model, and/or the risk inherent in the inputs to the valuation technique. Inputs may be observable or unobservable. Observable inputs are inputs that reflect the assumptions market participants would use in pricing the asset or liability and are developed based on market data obtained from sources independent of the reporting entity. Unobservable inputs are inputs that reflect the reporting entity’s own assumptions about the assumptions market participants would use in pricing the asset or liability and are developed based on the best information available in the circumstances. The three-tier hierarchy of inputs is summarized in the three broad levels listed below.
Level 1 – quoted prices in active markets for identical securities
22
Barings Global Short Duration High Yield Fund 2020 Annual Report
NOTES TO THE FINANCIAL STATEMENTS (CONTINUED)
December 31, 2020
Level 2 – other significant observable inputs (including quoted prices for similar securities, interest rates, prepayment speeds, credit risk, etc.)
Level 3 – significant unobservable inputs (including the Fund’s own assumptions in determining the fair value of investments)
The availability of observable inputs can vary from security to security and is affected by a wide variety of factors, including, for example, the type of security, whether the security is new and not yet established in the marketplace, the liquidity of markets, and other characteristics particular to the security. To the extent that valuation is based on models or inputs that are less
observable or unobservable in the market, the determination of fair value requires more judgment. Accordingly, the degree of judgment exercised in determining fair value is greatest for instruments categorized in Level 3.
The inputs used to measure fair value may fall into different levels of the fair value hierarchy. In such cases, for disclosure purposes, the level in the fair value hierarchy within which the fair value measurement falls in its entirety is determined based on the lowest level input that is significant to the fair value measurement in its entirety.
The following is a summary of the inputs used as of December 31, 2020 in valuing the Fund’s investments:
| | | | | | | | | | | | | | | | |
| DESCRIPTION | | LEVEL 1 | | | LEVEL 2 | | | LEVEL 3 | | | TOTAL INVESTMENTS | |
| | | | |
Assets: | | | | | | | | | | | | | | | | |
| Equities: | | | | | | | | | | | | | | | | |
Common Stocks | | $ | – | | | $ | – | | | $ | 4,760,836 | | | $ | 4,760,836 | |
Preferred Stocks | | | – | | | | – | | | | – | | | | – | |
Warrants | | | – | | | | – | | | | 250,232 | | | | 250,232 | |
| | | | | | | | | | | | | | | | |
| Total Equities: | | | – | | | | – | | | | 5,011,068 | | | | 5,011,068 | |
| | | | | | | | | | | | | | | | |
| | | | |
Fixed Income: | | | | | | | | | | | | | | | | |
Asset-Backed Securities | | | – | | | | 37,942,958 | | | | – | | | | 37,942,958 | |
Bank Loans | | | – | | | | 28,554,527 | | | | 300,618 | | | | 28,855,145 | |
Corporate Bonds | | | – | | | | 380,904,622 | | | | 6,183,441 | | | | 387,088,063 | |
| | | | | | | | | | | | | | | | |
| Total Fixed Income | | $ | – | | | $ | 447,402,107 | | | $ | 6,484,059 | | | $ | 453,886,166 | |
| | | | | | | | | | | | | | | | |
| | | | |
Total Assets | | $ | – | | | $ | 447,402,107 | | | $ | 11,495,127 | | | $ | 458,897,234 | |
| | | | | | | | | | | | | | | | |
| Liabilities: | | | | | | | | | | | | | | | | |
Foreign Exchange Contracts | | $ | – | | | $ | (493,952 | ) | | $ | – | | | $ | (493,952 | ) |
| | | | | | | | | | | | | | | | |
Total Liabilities: | | $ | – | | | $ | (493,952 | ) | | $ | – | | | $ | (493,952 | ) |
| | | | | | | | | | | | | | | | |
The following table is a summary of quantitative information about significant unobservable valuation inputs for Level 3 fair value measurement for investments held as of December 31, 2020. A significant change in third party information could result in a significantly lower or higher value of such Level 3 financial instruments:
| | | | | | | | |
| TYPE OF ASSETS | | FAIR VALUE AS OF
DECEMBER 31, 2020 | | | VALUATION
TECHNIQUE(S) | | UNOBSERVABLE INPUT |
| | | |
Equities | | | | | | | | |
| | | |
KCA Deutag Ordinary A Share | | $ | 955,193 | | | Vendor Price | | $40.50; Advisor Priced by LoanX. |
| | | |
Travelex Private Equity | | $ | 0 | | | Zero Value | | Valued at Zero |
| | | |
Fieldwood Energy LLC | | $ | 0 | | | Vendor Price | | $.00; Advisor Priced by LoanX. |
| | | |
Jupiter Resources, Inc.& | | $ | 3,749,197 | | | Model Price | | $3.20; price taken by converting to post acquisition value. |
| | | |
Sabine Oil and Gas | | $ | 56,446 | | | Model Price | | $13.00; Value derived from pending receipt. |
23
Barings Global Short Duration High Yield Fund 2020 Annual Report
NOTES TO THE FINANCIAL STATEMENTS (CONTINUED)
December 31, 2020
| | | | | | | | |
| TYPE OF ASSETS | | FAIR VALUE AS OF
DECEMBER 31, 2020 | | | VALUATION
TECHNIQUE(S) | | UNOBSERVABLE INPUT |
| | | |
Boomerang Tube Holdings, Inc. | | $
| 0
|
| | Model Price | | Average Enterprise Valuation Multiple: 5 year projection, 5.0x; EBITDA: $32.2 million, 20% discount rate. |
| | | |
Travelex Topco Limited Warrant | | $ | 250,232 | | | Vendor Price | | $112.82; Advisor Priced by LoanX. |
| | | |
Corporate Bonds | | | | | | | | |
| | | |
Travelex | | $ | 4,959,932 | | | Broker Quote | | $246.15; Advisor Priced by LoanX. |
| | | |
Travelex | | $ | 0 | | | Zero Value | | Valued at Zero |
| | | |
KCA Deutag | | $ | 1,223,509 | | | Broker Quote | | $103.75; pricing source depth of 1. |
| | | |
Digicel Limited | | $ | 0 | | | Zero Value | | Valued at Zero |
| | | |
Bank Loans | | | | | | | | |
| | | |
Boomerang Tube, LLC | | $ | 104,346 | | | Model Price | | Average Enterprise Valuation Multiple: 5 year projection, 5.0x; EBITDA: $32.2 million, 20% discount rate. |
| | | |
Naviera Armas Bridge
| | $ | 127,521 | | | Trade Price | | $119.77; Priced at trade |
| | | |
Naviera Armas Bridge | | $ | 68,751 | | | Trade Price | | $113.56; Priced at trade |
Although the Fund believes the valuation methods described above are appropriate, the use of different methodologies or assumptions to determine fair value could result in different estimates of fair value at the reporting date.
The Fund discloses transfers between levels based on valuations at the end of the reporting period. The following is a reconciliation of Level 3 investments based upon the inputs used to determine fair value:
& Jupiter Resources Inc. common stock restructured into 276,778 shares of Tourmaline Oil Corp. common stock. The restructure was completed in February 2021.
| | | | | | | | | | | | | | | | | | | | | | | | | | | | | | | | | | | | | | | | |
| | | BALANCE AT
DECEMBER 31,
2019 | | | TRANSFERS
INTO
LEVEL 3 | | | TRANSFERS
OUT OF
LEVEL 3 | | | PURCHASES | | | SALES | | | ACCRETION
OF DISCOUNT | | | REALIZED
GAIN /
(LOSS) | | | CHANGE
IN
UNREALIZED | | | BALANCE
AT
DECEMBER 31,
2020 | | | CHANGE IN
UNREALIZED
APPRECIATION /
(DEPRECIATION)
ON
INVESTMENTS
HELD AS OF
DECEMBER 31,
2020 | |
| | | | | | | | | | |
Equities | | | | | | | | | | | | | | | | | | | | | | | | | | | | | | | | | | | | | | | | |
Boomerang Tube Holdings, Inc. | | $ | 2,441,503 | | | $ | 0 | | | $ | 0 | | | $ | 0 | | | $ | 0 | | | $ | 0 | | | $ | 0 | | | ($ | 2,441,503 | ) | | $ | 0 | | | ($ | 2,441,503 | ) |
Fieldwood Energy LLC | | $ | 3,044,317 | | | $ | 0 | | | $ | 0 | | | $ | 0 | | | $ | 0 | | | $ | 0 | | | $ | 0 | | | ($ | 3,044,317 | ) | | $ | 0 | | | ($ | 3,044,317 | ) |
Jupiter Resources Inc.& | | $ | 1,171,624 | | | $ | 0 | | | $ | 0 | | | $ | 0 | | | $ | 0 | | | $ | 0 | | | $ | 0 | | | $ | 2,577,573 | | | $ | 3,749,197 | | | $ | 2,577,573 | |
KCA Deutag Ordinary A Shares¤+ | | $ | 0 | | | $ | 0 | | | $ | 0 | | | $ | 990,570 | | | $ | 0 | | | $ | 0 | | | $ | 0 | | | ($ | 35,377 | ) | | $ | 955,193 | | | ($ | 35,377 | ) |
Sabine Oil & Gas LLC | | $ | 247,494 | | | $ | 0 | | | $ | 0 | | | $ | 0 | | | $ | 0 | | | $ | 0 | | | $ | 0 | | | ($ | 191,048 | ) | | $ | 56,446 | | | ($ | 191,048 | ) |
Templar Energy LLC | | $ | 0 | | | $ | 0 | | | $ | 0 | | | $ | 0 | | | $ | 0 | | | $ | 0 | | | ($ | 734,072 | ) | | $ | 734,072 | | | ($ | 0 | ) | | $ | 734,072 | |
Templar Energy LLC | | $ | 0 | | | $ | 0 | | | $ | 0 | | | $ | 0 | | | $ | 0 | | | $ | 0 | | | ($ | 1,100,495 | ) | | $ | 1,100,495 | | | ($ | 0 | ) | | $ | 1,100,495 | |
Travelex Private Equity | | $ | 0 | | | $ | 0 | | | $ | 0 | | | $ | 0 | | | $ | 0 | | | $ | 0 | | | $ | 0 | | | $ | 0 | | | $ | 0 | | | $ | 0 | |
| | | | | | | | | | | | | | | | | | | | | | | | | | | | | | | | | | | | | | | | |
Common Stocks | | $ | 6,904,938 | | | $ | 0 | | | $ | 0 | | | $ | 990,570 | | | $ | 0 | | | $ | 0 | | | ($ | 1,834,567 | ) | | ($ | 1,300,105 | ) | | $ | 4,760,836 | | | ($ | 1,300,105 | ) |
| | | | | | | | | | | | | | | | | | | | | | | | | | | | | | | | | | | | | | | | |
Pinnacle Operating Corp. | | $ | 0 | | | $ | 0 | | | $ | 0 | | | $ | 0 | | | $ | 0 | | | $ | 0 | | | $ | 0 | | | $ | 0 | | | $ | 0 | | | $ | 0 | |
24
Barings Global Short Duration High Yield Fund 2020 Annual Report
NOTES TO THE FINANCIAL STATEMENTS (CONTINUED)
December 31, 2020
| | | | | | | | | | | | | | | | | | | | | | | | | | | | | | | | | | | | | | | | |
| | | BALANCE AT
DECEMBER 31,
2019 | | | TRANSFERS
INTO
LEVEL 3 | | | TRANSFERS
OUT OF
LEVEL 3 | | | PURCHASES | | | SALES | | | ACCRETION
OF DISCOUNT | | | REALIZED
GAIN /
(LOSS) | | | CHANGE
IN
UNREALIZED | | | BALANCE
AT
DECEMBER 31,
2020 | | | CHANGE IN
UNREALIZED
APPRECIATION /
(DEPRECIATION)
ON
INVESTMENTS
HELD AS OF
DECEMBER 31,
2020 | |
Preferred Stocks | | $ | 0 | | | $ | 0 | | | $ | 0 | | | $ | 0 | | | $ | 0 | | | $ | 0 | | | $ | 0 | | | $ | 0 | | | $ | 0 | | | $ | 0 | |
| | | | | | | | | | | | | | | | | | | | | | | | | | | | | | | | | | | | | | | | |
Appvion Holdings Corp | | $ | 3,223 | | | $ | 0 | | | $ | 0 | | | $ | 0 | | | ($ | 9 | ) | | $ | 0 | | | ($ | 137,271 | ) | | $ | 134,057 | | | ($ | 0 | ) | | $ | 134,057 | |
Appvion Inc. | | $ | 1,612 | | | $ | 0 | | | $ | 0 | | | $ | 0 | | | ($ | 9 | ) | | $ | 0 | | | $ | 9 | | | ($ | 1,612 | ) | | ($ | 0 | ) | | ($ | 1,612 | ) |
Sabine Oil & Gas LLC | | $ | 176,855 | | | $ | 0 | | | $ | 0 | | | $ | 0 | | | ($ | 168,105 | ) | | $ | 0 | | | $ | 107,436 | | | ($ | 116,186 | ) | | $ | 0 | | | ($ | 116,186 | ) |
Travelex Topco Limited Warrant | | $ | 0 | | | $ | 0 | | | $ | 0 | | | $ | 0 | | | $ | 0 | | | $ | 0 | | | $ | 0 | | | $ | 250,232 | | | $ | 250,232 | | | $ | 250,232 | |
| | | | | | | | | | | | | | | | | | | | | | | | | | | | | | | | | | | | | | | | |
Warrants | | $ | 181,690 | | | $ | 0 | | | $ | 0 | | | $ | 0 | | | ($ | 168,123 | ) | | $ | 0 | | | ($ | 29,826 | ) | | $ | 266,491 | | | $ | 250,232 | | | $ | 266,491 | |
| | | | | | | | | | | | | | | | | | | | | | | | | | | | | | | | | | | | | | | | |
| | | | | | | | | | |
Total Equities | | $ | 7,086,628 | | | $ | 0 | | | $ | 0 | | | $ | 990,570 | | | ($ | 168,123 | ) | | $ | 0 | | | ($ | 1,864,393 | ) | | ($ | 1,033,614 | ) | | $ | 5,011,068 | | | ($ | 1,033,614 | ) |
| | | | | | | | | | | | | | | | | | | | | | | | | | | | | | | | | | | | | | | | |
| | | | | | | | | | |
Fixed Income | | | | | | | | | | | | | | | | | | | | | | | | | | | | | | | | | | | | | | | | |
Boomerang Tube, LLC | | $ | 2,540,684 | | | $ | 0 | | | $ | 0 | | | $ | 67,964 | | | $ | 0 | | | $ | 0 | | | $ | 0 | | | ($ | 2,504,302 | ) | | $ | 104,346 | | | ($ | 2,504,302 | ) |
Naviera Armas Bridge | | $ | 0 | | | $ | 0 | | | $ | 0 | | | $ | 128,305 | | | $ | 0 | | | $ | 0 | | | $ | 0 | | | ($ | 784 | ) | | $ | 127,521 | | | ($ | 784 | ) |
Naviera Armas Bridge | | $ | 0 | | | $ | 0 | | | $ | 0 | | | $ | 69,174 | | | $ | 0 | | | $ | 0 | | | $ | 0 | | | ($ | 423 | ) | | $ | 68,751 | | | ($ | 423 | ) |
| | | | | | | | | | | | | | | | | | | | | | | | | | | | | | | | | | | | | | | | |
Bank Loans | | $ | 2,540,684 | | | $ | 0 | | | $ | 0 | | | $ | 265,443 | | | $ | 0 | | | $ | 0 | | | $ | 0 | | | ($ | 2,505,509 | ) | | $ | 300,618 | | | ($ | 2,505,509 | ) |
Jupiter Resources Inc. | | $ | 0 | | | $ | 0 | | | $ | 0 | | | $ | 1,445,577 | | | ($ | 1,445,601 | ) | | $ | 29 | | | $ | 15,535 | | | ($ | 15,540 | ) | | ($ | 0 | ) | | ($ | 15,540 | ) |
Travelex | | $ | 0 | | | $ | 0 | | | $ | 0 | | | $ | 2,266,830 | | | $ | 0 | | | $ | 8,442 | | | $ | 0 | | | $ | 2,684,660 | | | $ | 4,959,932 | | | $ | 2,684,660 | |
Travelex | | $ | 0 | | | $ | 5,275,939 | | | $ | 0 | | | $ | 0 | | | $ | 0 | | | $ | 37 | | | $ | 0 | | | ($ | 5,275,976 | ) | | $ | 0 | | | ($ | 5,275,976 | ) |
KCA Deutag | | $ | 0 | | | $ | 0 | | | $ | 0 | | | $ | 1,179,286 | | | $ | 0 | | | $ | 0 | | | $ | 0 | | | $ | 44,223 | | | $ | 1,223,509 | | | $ | 44,223 | |
Digicel Limited | | $ | 0 | | | $ | 1,125,000 | | | $ | 0 | | | $ | 0 | | | $ | 0 | | | $ | 4,042 | | | $ | 0 | | | ($ | 1,129,042 | ) | | $ | 0 | | | ($ | 1,129,042 | ) |
| | | | | | | | | | | | | | | | | | | | | | | | | | | | | | | | | | | | | | | | |
Corporate Bonds | | $ | 0 | | | $ | 6,400,939 | | | $ | 0 | | | $ | 4,891,693 | | | ($ | 1,445,601 | ) | | $ | 12,550 | | | $ | 15,535 | | | ($ | 3,691,675 | ) | | $ | 6,183,441 | | | ($ | 3,691,675 | ) |
| | | | | | | | | | |
Total Fixed Income | | $ | 2,540,684 | | | $ | 6,400,939 | | | $ | 0 | | | $ | 5,157,136 | | | ($ | 1,445,601 | ) | | $ | 12,550 | | | $ | 15,535 | | | ($ | 6,197,184 | ) | | $ | 6,484,059 | | | ($ | 6,197,184 | ) |
| | | | | | | | | | | | | | | | | | | | | | | | | | | | | | | | | | | | | | | | |
| | | | | | | | | | |
Total | | $ | 9,627,312 | | | $ | 6,400,939 | | | $ | 0 | | | $ | 6,147,706 | | | ($ | 1,613,724 | ) | | $ | 12,550 | | | ($ | 1,848,858 | ) | | ($ | 7,230,798 | ) | | $ | 11,495,127 | | | ($ | 7,230,798 | ) |
| | | | | | | | | | | | | | | | | | | | | | | | | | | | | | | | | | | | | | | | |
During the year, transfers into Level 3 resulted from a lack of observable market data for the security.
& Jupiter Resources Inc. common stock restructured into 276,778 shares of Tourmaline Oil Corp. common stock. The restructure was completed in February 2021.
25
Barings Global Short Duration High Yield Fund 2020 Annual Report
NOTES TO THE FINANCIAL STATEMENTS (CONTINUED)
December 31, 2020
| | B. | Cash and Cash Equivalents |
Cash and cash equivalents consist principally of cash and short term investments that are readily convertible into cash and have original maturities of three months or less. At December 31, 2020, all cash is held by U.S. Bank, N.A., and there are no cash equivalents.
| | C. | Investment Transactions, Related Investment Income and Expenses |
Investment transactions are accounted for on a trade-date basis. Interest income is recorded on the accrual basis, including the amortization of premiums and accretion of discounts on bonds held using the yield-to-maturity method.
Interest income from securitized investments in which the Fund has a beneficial interest, such as the “equity” security class of a CLO vehicle (typically in the form of income or subordinated notes), is recorded upon receipt. The accrual of interest income related to these types of securities is periodically reviewed and adjustments are made as necessary.
Realized gains and losses on investment transactions and unrealized appreciation and depreciation on investments are reported for financial statement and Federal income tax purposes on the identified cost method.
Expenses are recorded on the accrual basis as incurred.
The preparation of financial statements in conformity with U.S. GAAP requires management to make estimates and assumptions that affect the reported amounts of assets and liabilities and disclosure of contingent assets and liabilities at the date of the financial statements and the reported amounts of revenues and expenses during the reporting period. Actual results could differ from those estimates.
| | E. | Federal Income Taxation |
The Fund has elected to be taxed as a Regulated Investment Company (“RIC”) under sub-chapter M of the U.S. Internal Revenue Code of 1986, as amended, and intends to maintain this qualification and to distribute substantially all of its net taxable income to its shareholders.
| | F. | Dividends and Distributions |
The Fund declares and pays dividends monthly from net investment income. To the extent that these distributions
exceed net investment income, they may be classified as return of capital. The Fund also pays a distribution at least annually from its net realized capital gains, if any. Dividends and distributions are recorded on the ex-dividend date. All common shares have equal dividend and other distribution rights. A notice disclosing the source(s) of a distribution will be provided if payment is made from any source other than net investment income. Any such notice would be provided only for informational purposes in order to comply with the requirements of Section 19(a) of the 1940 Act and not for tax reporting purposes. The tax composition of the Fund’s distributions for each calendar year is reported on Internal Revenue Service Form 1099-DIV.
Dividends from net investment income and distributions from realized gains from investment transactions have been determined in accordance with Federal income tax regulations and may differ from net investment income and realized gains recorded by the Fund for financial reporting purposes. These differences, which could be temporary or permanent in nature may result in reclassification of distributions; however, net investment income, net realized gains and losses, and net assets are not affected.
The following is a description of the derivative instruments that the Fund utilizes as part of its investment strategy, including the primary underlying risk exposures related to the instrument.
Forward Foreign Exchange Contracts – The Fund is subject to foreign currency exchange rate risk in the normal course of pursuing its investment objectives. The Fund transacted in and currently holds forward foreign exchange contracts to hedge against changes in the value of foreign currencies. The Fund entered into forward foreign exchange contracts obligating the Fund to deliver or receive a currency at a specified future date. Forward foreign exchange contracts are valued daily and unrealized appreciation or depreciation is recorded daily as the difference between the contract exchange rate and the closing forward rate applied to the face amount of the contract. A realized gain or loss is recorded at the time the forward foreign exchange contract expires. Credit risk may arise as a result of the failure of the counterparty to comply with the terms of the contract. The Fund considers the creditworthiness of each counterparty to a contract in evaluating potential credit risk quarterly. The Fund is also subject to credit risk with
26
Barings Global Short Duration High Yield Fund 2020 Annual Report
NOTES TO THE FINANCIAL STATEMENTS (CONTINUED)
December 31, 2020
respect to the counterparties to the derivative contracts which are not cleared through a central counterparty but instead are traded over-the-counter between two counterparties. If a counterparty to an over-the-counter derivative becomes bankrupt or otherwise fails to perform its obligations under a derivative contract due to financial difficulties, the Fund may experience significant delays in obtaining any recovery under the derivative contract in a bankruptcy or other reorganization proceeding. The Fund may obtain only a limited recovery or may obtain no recovery in such circumstances. The counterparty risk for cleared derivatives is generally lower than for uncleared over-the-counter derivative transactions since generally a clearing organization becomes substituted for each counterparty to a cleared derivative contract and, in effect, guarantees the parties’ performance under the contract as each party to a trade looks only to the clearing house for performance of financial obligations. However, there can be no assurance that the clearing house, or its members, will satisfy its obligations to the Fund. In addition, in the event of a bankruptcy of a clearing house, the Fund could experience a loss of the funds deposited with such clearing house as margin and any profits on its open positions. The counterparty risk to the Fund is limited to the net unrealized gain, if any, on the contract.
The use of forward foreign exchange contracts does not eliminate fluctuations in the underlying prices of the Fund’s investment securities; however, it does establish a rate of exchange that can be achieved in the future. The use of forward foreign exchange contracts involves the risk that anticipated currency movements will not be accurately predicted. A forward foreign exchange contract would limit the risk of loss due to a decline in the value of a particular currency; however, it would also limit any potential gain that might result should the value of the currency increase instead of decrease. These contracts may involve market risk in excess of the amount of receivable or payable reflected on the Statement of Assets and Liabilities.
The Fund recognized a liability on the Statement of Assets and Liabilities as a result of forward foreign exchange contracts with J.P. Morgan and Morgan Stanley. The Fund’s policy is to recognize an asset equal to the net value of all forward foreign exchange contracts with an unrealized gain and a liability equal to the net value of all forward foreign exchange contracts with an unrealized loss. The Fund has recognized an liability of $493,952 in net unrealized depreciation on
forward foreign exchange contracts. Outstanding forward foreign exchange contracts as of December 31, 2020 are indicative of the volume of activity during the year.
The following is a summary of the fair value of derivative instruments held by the Fund as of December 31, 2020. These derivatives are presented in the Schedule of Investments.
Fair values of derivative instruments on the Statement of Assets and Liabilities as of December 31, 2020:
| | | | | | | | |
| | | STATEMENT OF ASSETS
AND LIABILITIES
LOCATION | | | FAIR
VALUE | |
Derivatives | | | | | | | | |
Liability Derivatives | | | | | | | | |
Forward Foreign Exchange Contracts | |
| Unrealized
Depreciation on
forward foreign
exchange contracts. |
| | $ | (493,952 | ) |
| | | | | | | | |
Total Liability Derivatives | | | | | | $ | (493,952 | ) |
| | | | | | | | |
The effect of derivative instruments on the Statement of Operations for the year ended December 31, 2020:
Amount of Realized Gain/(Loss) on Derivatives
| | | | |
| DERIVATIVES | | FORWARD FOREIGN
EXCHANGE CONTRACTS | |
Forward Foreign Exchange Contracts | | $ | 277,051 | |
| | | | |
Total | | $ | 277,051 | |
| | | | |
Change in Unrealized Appreciation/(Depreciation) on Derivatives
| | | | |
| DERIVATIVES | | FORWARD FOREIGN
EXCHANGE CONTRACTS | |
Forward Foreign Exchange Contracts | | $ | (122,813 | ) |
| | | | |
Total | | $ | (122,813 | ) |
| | | | |
| | H. | Disclosures about Offsetting Assets and Liabilities |
The following is a summary by counterparty of the fair value of derivative investments subject to Master Netting Agreements and collateral pledged (received), if any, as of December 31, 2020.
27
Barings Global Short Duration High Yield Fund 2020 Annual Report
NOTES TO THE FINANCIAL STATEMENTS (CONTINUED)
December 31, 2020
| | | | | | | | |
| | | MORGAN
STANLEY | | | JP MORGAN
CHASE | |
Liabilities: | | | | | | | | |
Forward foreign exchange contracts | | $ | (479,038 | ) | | $ | (14,914 | ) |
| | | | | | | | |
Total Liability | | | (479,038 | ) | | | (14,914 | ) |
| | | | | | | | |
Net Exposure | | $ | (479,038 | ) | | $ | (14,914 | ) |
| | | | | | | | |
The Financial Accounting Standards Board (“FASB”) issued Accounting Standards Update (“ASU”) No. 2011-11 “Disclosures about Offsetting Assets and Liabilities” (“ASU 2011-11”). These disclosure requirements are intended to help better assess the effect or potential effect of offsetting arrangements on a Fund’s financial position. In addition, FASB issued Accounting Standards Update No. 2013-01 “Clarifying the Scope of Offsetting Assets and Liabilities” (“ASU 2013-01”), specifying which transactions are subject to disclosures about offsetting. In order to better define its contractual rights and to secure rights that will help the Fund mitigate its counterparty risk, the Fund may enter into an International Swaps and Derivatives Association, Inc. Master Agreement (“ISDA Master Agreement”) or similar agreement with its counterparties. An ISDA Master Agreement is a bilateral agreement between the Fund and a counterparty that governs certain OTC derivatives and typically contains, among other things, collateral posting terms and netting provisions in the event of a default and/or termination event. Under an ISDA Master Agreement, the Fund may, under certain circumstances, offset with the counterparty certain derivative financial instruments’ payables and/or receivables with collateral held and/or posted and create one single net payment. The provisions of the ISDA Master Agreement typically permit a single net payment in the event of default including the bankruptcy or insolvency of the counterparty. Bankruptcy or insolvency laws of a particular jurisdiction may restrict or prohibit the right of offset in bankruptcy, insolvency or other events. In addition, certain ISDA Master Agreements allow counterparties to terminate derivative contracts prior to maturity in the event the Fund’s net assets decline by a stated percentage or the Fund fails to meet the terms of its ISDA Master Agreements. The result would cause the Fund to accelerate payment of any net liability owed to the counterparty.
For derivatives traded under an ISDA Master Agreement, the collateral requirements are typically calculated by netting the mark to market amount for each transaction
under such agreement and comparing that amount to the value of any collateral currently pledged by the Fund and the counterparty.
Cash collateral that has been pledged to cover obligations of the Fund and cash collateral received from the counterparty, if any, is reported separately on the Statement of Assets and Liabilities as cash collateral held at broker or cash collateral due to broker, respectively. Non-cash collateral pledged by or received by the Fund, if any, is noted in the Schedule of Investments. Generally, the amount of collateral due from or to a party has to exceed a minimum transfer amount threshold before a transfer is required, which is determined each day at the close of business of the Fund, typically based on changes in market values for each transaction under an ISDA Master Agreement and netted into one amount for such agreement and any additional required collateral is delivered to/pledged by the Fund on the next business day. Typically, the Fund and counterparties are not permitted to sell, re-pledge or use the collateral they receive. To the extent amounts due to the Fund from its counterparties are not fully collateralized, contractually or otherwise, the Fund bears the risk of loss from counterparty non-performance. The Fund attempts to mitigate counterparty risk by entering into agreements only with counterparties that they believe have the financial resources to honor their obligations and by monitoring the financial stability of those counterparties.
Investing in securities of foreign companies and foreign governments involves special risks and considerations not typically associated with investing in U.S. companies and the U.S. government. These risks include valuation of currencies and adverse political and economic developments. Moreover, securities of many foreign companies, foreign governments, and their markets may be less liquid and their prices more volatile than those of securities of comparable U.S. companies and the U.S. government.
| | J. | Foreign Currency Translation |
The books and records of the Fund are maintained in U.S. dollars. Foreign currency transactions are translated into U.S. dollars on the following basis: (i) market value of investment securities, assets and liabilities at the daily rates of exchange, and (ii) purchases and sales of investment securities, dividend and interest income and certain expenses at the rates of exchange prevailing on
28
Barings Global Short Duration High Yield Fund 2020 Annual Report
NOTES TO THE FINANCIAL STATEMENTS (CONTINUED)
December 31, 2020
the respective dates of such transactions. For financial reporting purposes, the Fund does not isolate changes in the exchange rate of investment securities from the fluctuations arising from changes in the market prices of securities. However, for Federal income tax purposes, the Fund does isolate and treat as ordinary income the effect of changes in foreign exchange rates on realized gain or loss from the sale of investment securities and payables and receivables arising from trade-date and settlement-date differences.
The Fund seeks to manage counterparty credit risk by entering into agreements only with counterparties the Adviser believes have the financial resources to honor their obligations. The Adviser monitors the financial stability of the Fund’s counterparties.
| | L. | Recent Accounting Pronouncements |
In August 2018, the FASB issued ASU No. 2018-13, “Fair Value Measurement (Topic 820: Disclosure Framework – Changes to the Disclosure Requirements for Fair Value Measurement”. ASU 2018-13 eliminates the requirement to disclose the amount of and reasons for transfers between Level 1 and Level 2 of the fair value hierarchy, the timing of transfers between levels of the fair value hierarchy and the valuation processes for Level 3 fair value measurements. ASU 2018-13 will require the need to disclose the range and weighted average used to develop significant unobservable inputs for Level 3 fair value measurements and the changes in unrealized gains and losses for recurring Level 3 fair value measurements. ASU 2018-13 will also require that information is provided about the measurement uncertainty of Level 3 fair value measurements as of the reporting date. The guidance is effective for fiscal years, and interim periods within those fiscal years, beginning after December 15, 2019 and allows for early adoption of either the entire standard or only the provisions that eliminate or modify the requirements. The Fund previously early adopted the provisions that eliminated disclosure requirements and adopted the remaining amendments in the current year.
In March 2017, the FASB issued ASU 2017-08, Receivables – Nonrefundable Fees and Other Costs (Subtopic 310-20): Premium Amortization on Purchased Callable Debt Securities, which amends the amortization period for certain purchased callable debt securities. Under ASU 2017-08, the premium amortization of purchased callable debt securities that have explicit, non-contingent
call features and are callable at fixed prices will be amortized to the earliest call date. The Fund previously adopted ASU 2017-08 and it did not have material impact on the Fund’s financial statements. In October 2020, ASU 2017-08 was amended by the FASB’s issuance of ASU No. 2020-08, Codification Improvements to Subtopic 310-20, Receivables-Nonrefundable Fees and Other Costs (“ASU 2020-08”). This amendment requires that entities re-evaluate whether callable debt securities fall within the scope of ASU 2017-08 for each reporting period. ASU 2020-08 also amends ASU 2017-08 to require premiums be amortized to the “next call date” rather than the “earliest call date” and further clarifies the definition of “next call date.” ASU 2020-08 is effective for fiscal years, and interim periods within those fiscal years, beginning after December 15, 2020. Management is currently evaluating the impact to this amendment on the Fund’s financial statements.
In March 2020, the FASB issued ASU No. 2020-04 Reference Rate Reform (Topic 848); Facilitation of the Effects of Reference Rate Reform on Financial Reporting, which provides optional guidance for a limited period of time to ease the potential burden in accounting for (or recognizing the effects of) reference rate reform. The guidance is applicable to contracts referencing London Interbank Offered Rate (“LIBOR”) or another reference rate that is expected to be discontinued due to reference rate reform. The ASU is effective as of March 12, 2020 and generally can be applied through December 31, 2022. Management is currently evaluating the underlying securities referencing LIBOR or another reference rate that is expected to be discontinued as a reference rate over the period of time the ASU is effective.
The Fund has entered into an Investment Management Agreement (the “Agreement”) with the Adviser, a related party. Pursuant to the Agreement, the Fund has agreed to pay the Adviser a fee payable at the end of each calendar month, at an annual rate of 1.00% of the Fund’s average daily managed assets during such month. Managed assets are the total assets of the Fund, which include any assets attributable to leverage such as assets attributable to reverse repurchase agreements, or bank loans, minus the sum of the Fund’s accrued liabilities (other than liabilities incurred for the purpose of leverage). Effective August 6, 2020, the Adviser has waived 0.15% of its fee payable from the Fund. This shall remain in effect through June 30, 2021.
29
Barings Global Short Duration High Yield Fund 2020 Annual Report
NOTES TO THE FINANCIAL STATEMENTS (CONTINUED)
December 31, 2020
The Fund has engaged U.S. Bancorp Fund Services, LLC, d/b/a U.S. Bank Global Fund Services (“Fund Services”) to serve as the Fund’s administrator, fund accountant, and transfer agent. The Fund has engaged U.S. Bank, N.A. to serve as the Fund’s custodian. The Fund has agreed to pay Fund Services a fee payable at the end of each calendar month, at an annual rate of 0.075% of the Fund’s average daily managed assets.
It is the Fund’s intention to qualify as a RIC under sub-chapter M of the Internal Revenue Code and distribute all of its taxable income. Accordingly, no provision for federal income taxes is required in the financial statements.
The tax character of dividends paid to shareholders during the tax years ended in 2020 and 2019, as noted below, was as follows:
| | | | | | | | |
| | | 2020 | | | 2019 | |
Ordinary Income | | $ | 27,544,286 | | | $ | 35,672,794 | |
| | | | | | | | |
Total Distributions Paid | | $ | 27,544,286 | | | $ | 35,672,794 | |
| | | | | | | | |
The amount and character of income and capital gain distributions to be paid, if any, are determined in accordance with federal income tax regulations, which may differ from U.S. GAAP.
Permanent items identified during the year ended December 31, 2020 have been reclassified among the components of net assets based on their tax basis treatment as follows:
| | |
| ADDITIONAL PAID IN CAPITAL | | ACCUMULATED LOSSES |
$(390,061) | | $390,061 |
The permanent differences are primarily attributable to non-deductible excise taxes.
The following information is provided on a tax basis as of December 31, 2020:
| | | | |
Cost of investments | | $ | 478,817,979 | |
| | | | |
Unrealized appreciation | | | 28,635,987 | |
Unrealized depreciation | | | (48,556,732 | ) |
| | | | |
Net unrealized appreciation/(depreciation) | | | (19,920,745 | ) |
| |
Undistributed ordinary income | | | 6,026,209 | |
Undistributed long term gains | | | – | |
| | | | |
Distributable earnings | | | 6,026,209 | |
| |
Other accumulated gain/(loss) | | | (119,964,786 | ) |
| | | | |
Total accumulated gain/(loss) | | | (133,859,322 | ) |
| | | | |
The capital loss carryforward is available to offset future taxable income. The Fund has the following capital loss amounts:
| | | | | | | | | | | | | | | | |
| EXPIRING DECEMBER 31, 2020 | |
| 2019 | | 2020 | | | 2021 | | | UNLIMITED –
SHORT TERM | | | UNLIMITED –
LONG TERM | |
$ – | | $ | – | | | $ | – | | | $ | 22,260,671 | | | $ | 97,722,990 | |
The Fund recognizes the tax benefits of uncertain tax positions only where the position is “more likely than not” to be sustained assuming examination by tax authorities. Management has analyzed the Fund’s tax positions, and has concluded that no liability for unrecognized tax benefits should be recorded related to uncertain tax positions taken on U.S. tax returns and state tax returns filed since inception of the Fund. No income tax returns are currently under examination. Tax years ended December 31, 2017 through December 31, 2020 remain subject to examination by the tax authorities in the United States. Due to the nature of the Fund’s investments, the Fund may be required to file income tax returns in several states. The Fund is not aware of any tax positions for which it is reasonably possible that the total amounts of unrecognized tax benefits will change materially in the next 12 months.
| 6. | Investment Transactions |
For the year ended December 31, 2020, the Fund purchased (at cost) and sold securities in the amount of $173,524,718 and $184,586,929 (excluding short-term debt securities), respectively.
30
Barings Global Short Duration High Yield Fund 2020 Annual Report
NOTES TO THE FINANCIAL STATEMENTS (CONTINUED)
December 31, 2020
On November 8, 2012, the Fund entered into a $200,000,000 credit facility with BNP Paribas Prime Brokerage International, Ltd (“BNP”). On January 6, 2014, the Fund entered into an amended agreement with a variable annual interest rate of one-month LIBOR plus 0.75 percent. Unused portions of the credit facility will accrue a commitment fee equal to an annual rate of 0.65 percent.
The average principal balance and interest rate for the period during which the credit facility was utilized for the year ended December 31, 2020 was approximately $116,900,000 and 1.29 percent, respectively. At December 31, 2020, the principal balance outstanding was $135,950,000 at an interest rate of 0.89 percent.
Based on the short-term nature of the borrowings under the credit facility and the variable interest rate, the carrying amount of the borrowings at December 31, 2020 approximated its fair value. If measured at fair value, borrowings under the credit facility would have been considered as Level 2 in the fair value hierarchy (see Note 2A) at December 31, 2020 .
Through an agreement with the Fund, BNP may lend out securities the Fund has pledged as collateral on the note payable. In return, the Fund receives additional income that is netted against the interest charged on the outstanding credit facility balance. For the year ended December 31, 2020, the total amount of income netted against the interest expense is $54,795.
The Fund has unlimited shares authorized and 20,064,313 shares outstanding at December 31, 2020 and 2019, respectively.
| | | | |
Shares at January 1, 2019 | | | 20,057,849 | |
Shares issued through dividend reinvestments | | | 6,464 | |
| | | | |
Shares at December 31, 2019 | | | 20,064,313 | |
| | | | |
Shares at January 1, 2020 | | | 20,064,313 | |
Shares issued through dividend reinvestments | | | – | |
| | | | |
Shares at December 31, 2020 | | | 20,064,313 | |
| | | | |
| 10. | Aggregate Remuneration Paid to Officers, Trustees and Their Affiliated Persons |
For the year ended December 31, 2020, the Fund paid its Trustees aggregate remuneration of $100,489. During the year ended December 31, 2020, the Fund did not pay any compensation to any of its Trustees who are “interested persons” (as defined by the 1940 Act) of the Fund. The Fund classifies Mr. Finke as an interested person of the Fund.
All of the Fund’s officers are employees of the Adviser. Pursuant to the Agreement, the Fund does not compensate its officers who are employees of the Adviser (except for the Chief Compliance Officer of the Fund unless assumed by the Adviser). For the year ended December 31, 2020, the Adviser paid the compensation of the Chief Compliance Officer of the Fund.
The Fund did not make any payments to the Adviser for the year ended December 31, 2020, other than the amounts payable to the Adviser pursuant to the Agreement.
Impacts of Covid-19
The pandemic related to the global spread of novel coronavirus disease (Covid-19), which was first detected in December 2019, has resulted in significant disruptions to global business activity and the global economy, as well as the economies of individual countries, the financial performance of individual companies and sectors, and the securities and commodities markets in general. This pandemic, the full effects of which are still unknown, has resulted in substantial market volatility and may continue to adversely impact the prices and liquidity of the Fund’s investments and the Fund’s performance.
The Fund has evaluated the possibility of subsequent events existing in this report through the date that the financial statements were issued. The Fund has determined that there were no material events that would require recognition or disclosure in this report through this date.
31
Barings Global Short Duration High Yield Fund 2020 Annual Report
REPORT OF INDEPENDENT REGISTERED PUBLIC ACCOUNTING FIRM
To the shareholders and the Board of Trustees of Barings Global Short Duration High Yield Fund:
Opinion on the Financial Statements and Financial Highlights
We have audited the accompanying statement of assets and liabilities of Barings Global Short Duration High Yield Fund (the “Fund”), including the schedule of investments, as of December 31, 2020, the related statements of operations and cash flows for the year then ended, the statements of changes in net assets for each of the two years in the period then ended, the financial highlights for each of the five years in the period then ended, and the related notes. In our opinion, the financial statements and financial highlights present fairly, in all material respects, the financial position of the Fund as of December 31, 2020, and the results of its operations and its cash flows for the year then ended, the changes in its net assets for each of the two years in the period then ended, and the financial highlights for each of the five years in the period then ended, in conformity with accounting principles generally accepted in the United States of America.
Basis for Opinion
These financial statements and financial highlights are the responsibility of the Fund’s management. Our responsibility is to express an opinion on the Fund’s financial statements and financial highlights based on our audits. We are a public accounting firm registered with the Public Company Accounting Oversight Board (United States) (PCAOB) and are required to be independent with respect to the Fund in accordance with the U.S. federal securities laws and the applicable rules and regulations of the Securities and Exchange Commission and the PCAOB.
We conducted our audits in accordance with the standards of the PCAOB. Those standards require that we plan and perform the audit to obtain reasonable assurance about whether the financial statements and financial highlights are free of material misstatement, whether due to error or fraud. The Fund is not required to have, nor were we engaged to perform, an audit of its internal control over financial reporting. As part of our audits, we are required to obtain an understanding of internal control over financial reporting, but not for the purpose of expressing an opinion on the effectiveness of the Fund’s internal control over financial reporting. Accordingly, we express no such opinion.
Our audits included performing procedures to assess the risks of material misstatement of the financial statements and financial highlights, whether due to error or fraud, and performing procedures that respond to those risks. Such procedures included examining, on a test basis, evidence regarding the amounts and disclosures in the financial statements and financial highlights. Our audits also included evaluating the accounting principles used and significant estimates made by management, as well as evaluating the overall presentation of the financial statements and financial highlights. Our procedures included confirmation of securities owned as of December 31, 2020, by correspondence with the custodian, brokers and selling or agent banks; when replies were not received from brokers and selling or agent banks, we performed other auditing procedures. We believe that our audits provide a reasonable basis for our opinion.
DELOITTE & TOUCHE LLP
New York, New York
March 1, 2021
We have served as the auditor of one or more Barings LLC investment companies since 2013.
32
Barings Global Short Duration High Yield Fund 2020 Annual Report
RESULTS OF SHAREHOLDER MEETING
The Annual Meeting of Shareholders (“Annual Meeting”) was held on Thursday, August 6, 2020. The shareholders were asked to elect Thomas M. Okel and Cynthia R. Plouché as Trustees for a three-year term. The shareholders approved the proposal. The results of shareholder voting are set forth below:
| | | | | | | | | | | | |
| SHARES FOR | | WITHHELD | | | TOTAL | | | % OF
SHARES
VOTED FOR | |
Thomas M. Okel | | | 1,122,811 | | | | 17,138,652 | | | | 93.852 | % |
Cynthia R. Plouché | | | 1,124,513 | | | | 17,136,950 | | | | 93.843 | % |
The Fund’s other Trustees Rodney J. Dillman, Thomas M. Finke, Bernard A. Harris, Jr. and Martin A. Sumichrast continued to serve their respective terms following the Annual Meeting.
33
Barings Global Short Duration High Yield Fund 2020 Annual Report
INTERESTED TRUSTEE
| | | | | | | | | | |
| NAME (AGE), ADDRESS | | POSITION(S)
WITH
THE TRUST | | OFFICE
TERM
AND
LENGTH
OF TIME
SERVED | | PRINCIPAL OCCUPATIONS
DURING PAST 5 YEARS | | PORTFOLIOS
OVERSEEN
IN FUND
COMPLEX | | OTHER DIRECTORSHIPS HELD BY
DIRECTOR |
| | | | | |
David M. Mihalick* (47) 300 South Tryon Street Suite 2500 Charlotte, NC 28202 | | Trustee | | Trustee since 2020 | | Managing Director (since 2008), Head of U.S. High Yield (since 2017), Head of U.S. Public Fixed Income (since 2019), Barings. | | 9 | | Trustee (since 2020), Barings Funds Trust (open-end investment company advised by Barings); Director (since 2020), Barings BDC, Inc. (business development company advised by Barings). |
34
Barings Global Short Duration High Yield Fund 2020 Annual Report
INDEPENDENT TRUSTEES
| | | | | | | | | | |
| NAME (AGE), ADDRESS | | POSITION(S)
WITH
THE TRUST | | OFFICE
TERM
AND
LENGTH
OF TIME
SERVED | | PRINCIPAL OCCUPATIONS
DURING PAST 5 YEARS | | PORTFOLIOS
OVERSEEN
IN FUND
COMPLEX | | OTHER DIRECTORSHIPS HELD BY
DIRECTOR |
| | | | | |
Rodney J. Dillman (67) 300 South Tryon Street Suite 2500 Charlotte, NC 28202 | | Trustee, Chairman | | Trustee since 2012 | | Retired (since 2012); Deputy General Counsel (2011-2012), Senior Vice President (2008-2012), Vice President (2000-2008), Massachusetts Mutual Life Insurance Company; Member of the Board of Directors and President (2008-2011), MassMutual International LLC; General Counsel (2006-2008), Babson Capital Management LLC (currently known as Barings LLC). | | 8 | | Trustee (since 2013), Barings Funds Trust (open-end investment company advised by Barings); Director (2016-2017), Social Reality, Inc. (digital platform technology and management software company for internet advertising). |
| | | | | |
Bernard A. Harris, Jr. (63) 300 South Tryon Street Suite 2500 Charlotte, NC 28202 | | Trustee | | Trustee since 2012 | | Chief Executive Officer, National Math and Science Initiative (since 2017); Chief Executive Officer and Managing Partner (since 2002), Vesalius Ventures, Inc.; Director and President (since 1998), The Space Agency; President (since 1999), The Harris Foundation; Clinical Scientist, Flight Surgeon and Astronaut (1986-1996), NASA. | | 8 | | Trustee (since 2013), Barings Funds Trust (open-end investment company advised by Barings); Trustee (since 2011), Salient Midstream & MLP Fund and Salient MLP & Energy Infrastructure Fund; Trustee (since 2010), Salient Absolute Return Fund; Director (since 2009), Monebo Technologies Inc. (medical technology design company); Director (since 2009), The Endowment Funds (TEF); Director (since 2008), US Physical Therapy (USPH); Director (since 2012), E-Cardio, Inc. (provides services for cardiac monitoring). |
| | | | | |
Thomas W. Okel (57) 300 South Tryon Street Suite 2500 Charlotte, NC 28202 | | Trustee | | Trustee since 2012 | | Executive Director (since 2011), Catawba Lands Conservancy; Global Head of Syndicated Capital Markets (1998-2010), Bank of America Merrill Lynch. | | 9 | | Director, Barings BDC, Inc. (a business development company managed by Barings LLC) (since 2018); Trustee (since 2013), Barings Funds Trust (open-end investment company advised by Barings); Trustee (since 2015), Horizon Funds (mutual fund complex). |
| | | | | |
Cynthia R. Plouché (63) 300 South Tryon Street Suite 2500 Charlotte, NC 28202 | | Trustee | | Trustee since August 2017 | | Assessor (since 2014), Moraine Township (property assessment); Senior Portfolio Manager (2006-2012), Williams Capital Management, LLC (asset management). | | 8 | | Trustee (since August 2017), Barings Funds Trust (open-end investment company advised by Barings); Trustee (since 2014), Northern Trust Funds (mutual fund complex); Trustee (2001-2017), AXA VIP Trust (mutual fund complex). |
35
Barings Global Short Duration High Yield Fund 2020 Annual Report
INDEPENDENT TRUSTEES (CONTINUED)
| | | | | | | | | | |
| NAME (AGE), ADDRESS | | POSITION(S)
WITH
THE TRUST | | OFFICE
TERM
AND
LENGTH
OF TIME
SERVED | | PRINCIPAL OCCUPATIONS
DURING PAST 5 YEARS | | PORTFOLIOS
OVERSEEN
IN FUND
COMPLEX | | OTHER DIRECTORSHIPS HELD BY
DIRECTOR |
| | | | | |
Martin A. Sumichrast (53) 300 South Tryon Street Suite 2500 Charlotte, NC 28202 | | Trustee | | Trustee since 2012 | | Chairman and Chief Executive Officer (since 2016), Level Brands, Inc.; Managing Partner and Principal (since 2013), Stone Street Partners, LLC (merchant banking); Managing Director (since 2012), Washington Capital, LLC (family office); Managing Director (2002-2012), Lomond International (business advisory firm). | | 8 | | Trustee (since 2013), Barings Funds Trust (open-end investment company advised by Barings); Chairman and Director (since 2014), Kure Corp. (retail); Director (since 2014), Jadeveon Clowney Help-In-Time Foundation; Director (since 2015), Social Reality, Inc. (digital platform technology and management software company for internet advertising); Chairman and Chief Executive Officer (since 2016), Director (since 2015), Level Brands, Inc. (a retail/e-commerce beauty investment/management company). |
36
Barings Global Short Duration High Yield Fund 2020 Annual Report
OFFICERS OF THE TRUST
| | | | | | |
| NAME (AGE), ADDRESS | | POSITION(S) WITH
THE TRUST | | OFFICE TERM* AND
LENGTH OF TIME
SERVED | | PRINCIPAL OCCUPATION(S)
DURING PAST 5 YEARS |
| | | |
Sean Feeley (52) 300 South Tryon Street Suite 2500 Charlotte, NC 28202 | | President | | Since 2017 | | Vice President (2012-2017), Barings Global Short Duration High Yield Fund; Managing Director (since 2003), Barings; Vice President (since 2011), Barings Corporate Investors and Barings Participation Investors (closed-end investment companies advised by Barings); Vice President (since 2011), CI Subsidiary Trust and PI Subsidiary Trust. |
| | | |
Carlene Pollock (52) 300 South Tryon Street Suite 2500 Charlotte, NC 28202 | | Chief Financial Officer | | Since 2016 | | Assistant Treasurer (2015-2016), Barings Global Short Duration High Yield Fund; Director (since 2015), Barings; Director (2013-2015), Corrum Capital Management (investment adviser); Vice President (2008-2013), Bank of New York Mellon (third party administrator); Chief Financial Officer (since 2016), Assistant Treasurer (2015-2016), Barings Funds Trust (open-end investment company advised by Barings). |
| | | |
Elizabeth Murray (43) 300 South Tryon Street Suite 2500 Charlotte, NC 28202 | | Treasurer | | Since 2020 | | Managing Director (since 2020), Director (2018-2020), Barings; Treasurer (since 2020), Barings Funds Trust (open-end investment company advised by Barings); Treasurer (since 2020), Barings Corporate Investors and Barings Participation Investors (closed-end investment companies advised by Barings); Principal Accounting Officer (since 2020), Director of External Reporting (2018-2020), Barings BDC, Inc. (business development company advised by Barings); Principal Accounting Officer (since 2020), Barings Capital Investment Corporation (business development company advised by Barings); Controller (since 2020), CI Subsidiary Trust and PI Subsidiary Trust; Vice President of Financial Reporting (2012-2018), Barings BDC, Inc. (f/k/a Triangle Capital Corporation). |
| | | |
Michael Freno (44) 550 South Tryon Street Charlotte, NC 28202 | | Vice President | | Since 2012 | | Chairman of Board, Barings BDC, Inc. (since 2018); Head of Global Fixed Income and Multi Assets Groups (since 2017); Head of U.S. High Yield Investments Group (2015-2017), Managing Director (since 2010), Member of the High Yield Investment Committee (since 2010), Director (2007-2009), Associate Director (2005-2006), Barings. |
| | | |
Scott Roth (50) 550 South Tryon Street Charlotte, NC 28202 | | Vice President | | Since 2012 | | Managing Director (since 2010), High Yield Team Leader (since 2010), Director (2002-2010), Barings. |
| | | |
Michael Cowart (38) 300 South Tryon Street Suite 2500 Charlotte, NC 28202 | | Chief Compliance Officer | | Since 2020 | | Director (since 2018), Barings; Chief Compliance Officer (since 2020) Barings Funds Trust (open-end investment company advised by Barings); Chief Compliance Officer (since 2020), Barings Corporate Investors and Barings Participation Investors (closed-end investment companies advised by Barings); Chief Compliance Officer (since 2020), Barings BDC, Inc. (business development company advised by Barings); Chief Compliance Officer (since 2020), Barings Capital Investment Corporation (business development company advised by Barings); Chief Compliance Officer (since 2019), Barings Securities LLC. |
37
Barings Global Short Duration High Yield Fund 2020 Annual Report
OFFICERS OF THE TRUST (CONTINUED)
| | | | | | |
| NAME (AGE), ADDRESS | | POSITION(S) WITH
THE TRUST | | OFFICE TERM* AND
LENGTH OF TIME
SERVED | | PRINCIPAL OCCUPATION(S)
DURING PAST 5 YEARS |
| | | |
Jill Dinerman (43) 300 South Tryon Street Charlotte, NC 28202 | | Secretary/Chief Legal Officer | | Since 2019 | | General Counsel (since January 2020), Corporate Secretary (since 2018), Managing Director (since 2016), Associate General Counsel (2018-2020), Senior Counsel (2016-2018), Counsel and Director (2011-2016), Barings; Assistant Secretary (since 2019), Barings Funds Trust (open-end investment company advised by Barings); Assistant Secretary (since 2019), Barings Corporate Investors and Barings Participation Investors (closed-end investment companies advised by Barings); and Assistant Secretary (since 2019), Barings BDC, Inc. (a business development company managed by Barings). |
| | | |
Alexandra Pacini (28) 300 South Tryon Street Suite 2500 Charlotte, NC 28202 | | Assistant Secretary | | Since 2020 | | Analyst (since 2017), Barings; Assistant Secretary (since 2020), Barings Funds Trust (open-end investment company advised by Barings); Assistant Secretary (since 2020), Barings Corporate Investors and Barings Participation Investors (closed-end investment companies advised by Barings); Assistant Secretary (since 2020), Barings BDC, Inc. (business development company advised by Barings); Assistant Secretary (since 2020), CI Subsidiary Trust and PI Subsidiary Trust. |
38
Barings Global Short Duration High Yield Fund 2020 Annual Report
APPROVAL OF INVESTMENT MANAGEMENT AGREEMENT
AND SUB-ADVISORY AGREEMENT
The Investment Company Act of 1940 (the “1940 Act”) requires that both the full Board of Trustees and a majority of the Trustees who are not interested persons of Barings Global Short Duration High Yield Fund (the “Fund”), as defined under the 1940 Act (the “Independent Trustees”), voting separately, annually approve the continuation of the Investment Management Agreement (the “Management Agreement”) between the Fund and Barings LLC (“Barings”) and the Sub-Advisory Agreement between Barings and Baring International Investment Limited (“BIIL Sub-Advisory Agreement” and, together with the Management Agreement, the “Agreements”). The Trustees considered matters bearing on the Fund and the Agreements at their meetings throughout the year, including a review of the Fund’s performance at each regular meeting. In addition, the Trustees met at an in-person meeting held on August 6, 2020 (the “Meeting”) for the specific purpose of considering whether to approve the Agreements for the Fund. The Trustees’ review process and considerations in approving the Agreements are summarized below. Prior to the Meeting, the Trustees requested and received from Morgan, Lewis & Bockius LLP, independent legal counsel to the Independent Trustees, a memorandum describing the Trustees’ legal responsibilities in connection with their review and approval of the Agreements. The Independent Trustees met prior to the August Board meeting with independent legal counsel to discuss their duties, the memorandum and the Agreements. The Trustees also requested and received from Barings extensive written and oral information regarding various matters including, but not limited to: the principal terms of the Agreements; Barings and its personnel; the Fund’s investment performance, including comparative performance information; the nature and quality of the services provided by Barings to the Fund; the financial strength of Barings; the Fund’s fee and expense information, including comparative fee and expense information; the profitability of the advisory arrangement to Barings; and the “fallout” benefits to Barings resulting from the Agreements. The Trustees’ conclusion as to the continuation of the Agreements was based on a comprehensive consideration of all information provided to the Board and not the result of any single issue. Some of the more significant factors that influenced the Trustees’ deliberations are described below, although individual Trustees may have evaluated the information presented differently from one another, giving different weights to various factors. It is also important to recognize that the Board’s review of the Agreements is the result of ongoing review and discussion, rather than a single discussion. The Trustees’ conclusions may be based, in part, on their consideration of these arrangements throughout the year and in prior years. The Trustees considered the terms of the Agreements, including the scope of the advisory and non-advisory services provided under the Agreements or otherwise. In evaluating the nature, scope and quality of the services provided by Barings and BIIL, the Trustees considered the specific responsibilities of Barings and BIIL in the day-to-day management of the Fund, the qualifications, experience and responsibilities of the portfolio managers and other key personnel that are involved in the day-to-day management of the Fund, the ability of Barings and BIIL to attract and retain high-quality personnel, and the organizational depth and stability of Barings and BIIL. The Trustees also considered the trading capabilities of Barings and BIIL. Based on information provided by Broadridge Financial Solutions, Inc. (“Broadridge”) and Barings, the Trustees reviewed the Fund’s net total return investment performance, as well as the performance of peer groups of funds, over various time periods. The net total return performance of the Fund ranked in the 5th quintile of its Broadridge performance universe for the one-year period, in the 5th quintile for the three-year period, and the 2nd quintile for the five-year period, ended February 29, 2020 (the 1st quintile being the best performers and the 5th quintile being the worst performers). The Trustees also reviewed the Fund’s performance in comparison to a custom peer group developed by Barings comprised of ten (including the Fund) high-yield closed-end funds that employ generally similar investment strategies and invest in the same asset classes as the Fund. Relative to the custom peer group, the net total return performance of the Fund ranked, respectively, 10th, 9th, and 6th out of ten funds for the one-year, three-year and five-year periods ended February 29, 2020. In the course of their deliberations, the Trustees also took into account information provided by Barings during investment review meetings conducted with portfolio management personnel during the course of the year. After reviewing these and related factors, the Trustees concluded, within the context of their overall conclusions regarding the Agreements, that they were satisfied with Barings’ and BIIL’s responses and efforts relating to investment performance.
The Trustees considered the investment management fee paid by the Fund to Barings pursuant to the Management Agreement. The Trustees noted that Barings (and not the Fund) pays BIIL, its sub-advisory fee under the BIIL Sub-Advisory Agreement. In assessing the reasonableness of the fee paid by the Fund under the Management Agreement, the Trustees considered, among other information, the Fund’s management fee and the total expense ratio for the Fund’s shares as a percentage of net asset value and the advisory fee and total expense ratios of peer groups of funds based on information
39
Barings Global Short Duration High Yield Fund 2020 Annual Report
APPROVAL OF INVESTMENT MANAGEMENT AGREEMENT
AND SUB-ADVISORY AGREEMENT (CONTINUED)
provided by Broadridge. The Trustees considered that, according to the Broadridge data, the Fund’s effective management fee (which includes Barings’ advisory fee and Fund administration fees) and total expense ratio were each higher than the Broadridge expense group median for common and leverage assets. The Trustees also reviewed the Fund’s advisory fee and total expense ratio in comparison to a custom peer group developed by Barings comprised of ten (including the Fund) high-yield closed-end funds that employ generally similar investment strategies and invest in the same asset classes as the Fund. The Trustees considered that, according to the custom peer group data, the contractual advisory fee of the Fund ranked 2nd out of ten funds. The Trustees also reviewed materials provided by Barings describing fees paid by other similar accounts managed by Barings, noting that Barings typically charges higher fees on its global accounts than on accounts that are invested primarily in domestic securities. The Board noted that, because the Fund is closed-end and does not continue to offer its securities, its size was relatively stable and it was unlikely that Barings would realize economies of scale from the Fund’s growth other than through capital gains and income. The Trustees reviewed information prepared by Barings regarding Barings’ costs of managing the Fund, and the profitability of the Management Agreement to Barings. In considering the profitability to Barings, the Board noted that BIIL is an affiliate of Barings and is paid by Barings, and, therefore, did not consider its profitability separately. The Trustees also considered the character and amount of other incidental benefits received by Barings and BIIL. Additionally, the Trustees considered so-called “fall-out benefits” to Barings and BIIL, such as reputational value derived from serving as investment manager to the Fund. The Trustees also considered costs incurred by Barings in connection with the organization and initial offering of the Fund. On the basis of the information provided, the Trustees concluded, within the context of their overall review of the Agreements, that the management fees charged to the Fund and the sub-advisory fee paid by Barings to BIIL represent reasonable compensation in light of the services being provided by Barings and BIIL to the Fund. Based on their evaluation of factors that they deemed material, including those factors described above, the Board of Trustees, including the Independent Trustees, concluded that the Fund’s Management Agreement with Barings and the BIIL Sub-Advisory Agreement should be continued for an additional one-year period through August 2021.
40
Barings Global Short Duration High Yield Fund 2020 Annual Report
FUND DIVIDEND REINVESTMENT PLAN
INDEPENDENT TRUSTEES
Rodney J. Dillman
Chairman, Trustee
Dr. Bernard A. Harris, Jr.
Trustee
Thomas W. Okel
Trustee
Cynthia R. Plouché
Trustee
Martin A. Sumichrast
Trustee
OFFICERS
Sean Feeley
President
Carlene Pollock
Chief Financial Officer
Elizabeth Murray
Treasurer
Michael Freno
Vice President
Scott Roth
Vice President
Michael Cowart
Chief Compliance Officer
Jill Dinerman
Secretary/Chief Legal Officer
Alexandra Pacini
Assistant Secretary
The Fund offers a Dividend Reinvestment Plan (the “Plan”). The Plan provides a simple way for shareholders to add to their holdings in the Fund through the reinvestment of dividends in additional common shares of the Fund. Shareholders will have all dividends, including any capital gain dividends, reinvested automatically in additional shares of the Fund by U.S. Bancorp Fund Services, LLC, as Plan Agent, unless a shareholder elects to receive cash instead. An election to receive cash may be revoked or reinstated at the option of the shareholder. All distributions to investors who elect not to participate in the Plan (or whose broker or nominee elects not to participate on the investor’s behalf) will receive dividends and distributions in cash.
Whenever the Fund declares a dividend payable in cash or shares, the Plan Agent, acting on behalf of each participating shareholder, will take the dividend in shares only if the net asset value per Fund share is equal to or less than the market price per Fund share plus estimated brokerage commissions as of the payment date for the dividend.
When the dividend is to be taken in shares, the number of shares to be received is determined by dividing the dollar amount of the cash dividend by the net asset value per Fund share as of the dividend payment date or, if greater than the net asset value per Fund share, 95% of the closing share price on the payment date. Generally, if the net asset value per Fund share is greater than the market price per Fund share plus estimated brokerage commissions as of the dividend payment date, the Plan Agent will endeavor to buy shares on the open market at current prices promptly after the dividend payment date.
The reinvestment of dividends does not, in any way, relieve participating shareholders of any Federal, state or local tax. For Federal income tax purposes, the amount reportable in respect of a dividend received in shares of the Fund will be the fair market value of the shares received, which will be reportable as ordinary income and/or capital gains. Investors should consult with their own tax advisors for further information about the tax consequences of dividend reinvestment.
There is no brokerage charge for the reinvestment of dividends in additional Fund shares; however, all participants pay a pro rata share of brokerage commissions incurred by the Plan Agent when it makes open market purchases. There is no direct service charge to participants in the Plan, though the Fund reserves the right to amend the Plan to include a service charge payable by participants.
Additional information about the Plan may be obtained from, and any questions regarding the Plan should be addressed to, U.S. Bancorp Fund Services, Plan Agent for Barings Global Short Duration High Yield Fund’s Dividend Reinvestment Plan, P.O. Box 701, Milwaukee, WI 52301.
41
Barings Global Short Duration High Yield Fund 2020 Annual Report

JOINT PRIVACY NOTICE OF BARINGS MANAGEMENT LLC AND
BARINGS GLOBAL SHORT DURATION HIGH YIELD FUND
This privacy notice is being provided on behalf of Barings LLC and its affiliates: Barings Securities LLC; Barings Australia Pty Ltd; Barings Advisers (Japan) KK; Barings Investment Advisers (Hong Kong) Limited; Barings Funds Trust; Barings Global Short Duration High Yield Fund; Barings Corporate Investors and Barings Participation Investors (together, for purposes of this privacy notice, “Barings”).
When you use Barings you entrust us not only with your hard-earned assets but also with your personal and financial data. We consider your data to be private and confidential, and protecting its confidentiality is important to us. Our policies and procedures regarding your personal information are summarized below.
We may collect non-public personal information about you from:
| | ∎ | | Applications or other forms, interviews, or by other means; |
| | ∎ | | Consumer or other reporting agencies, government agencies, employers or others; |
| | ∎ | | Your transactions with us, our affiliates, or others; and |
We may share the financial information we collect with our financial service affiliates, such as insurance companies, investment companies and securities broker-dealers. Additionally, so that we may continue to offer you products and services that best meet your investment needs and to effect transactions that you request or authorize, we may disclose the information we collect, as described above, to companies that perform administrative or marketing services on our behalf, such as transfer agents, custodian banks, service providers or printers and mailers that assist us in the distribution of investor materials or that provide operational support to Barings. These companies are required to protect this information and will use this information only for the services for which we hire them, and are not permitted to use or share this information for any other purpose. Some of these companies may perform such services in jurisdictions other than the United States. We may share some or all of the information we collect with other financial institutions with whom we jointly market products. This may be done only if it is permitted by the state in which you live. Some disclosures may be limited to your name, contact and transaction information with us or our affiliates.
Any disclosures will be only to the extent permitted by federal and state law. Certain disclosures may require us to get an “opt-in” or “opt-out” from you. If this is required, we will do so before information is shared. Otherwise, we do not share any personal information about our customers or former customers unless authorized by the customer or as permitted by law.
We restrict access to personal information about you to those employees who need to know that information to provide products and services to you. We maintain physical, electronic and procedural safeguards that comply with legal standards to guard your personal information. As an added measure, we do not include personal or account information in non-secure e-mails that we send you via the Internet without your prior consent. We advise you not to send such information to us in non-secure e-mails.
This joint notice describes the privacy policies of Barings, the Funds and Barings Securities LLC. It applies to all Barings and the Funds accounts you presently have, or may open in the future, using your social security number or federal taxpayer identification number – whether or not you remain a shareholder of our Funds or as an advisory client of Barings. As mandated by rules issued by the Securities and Exchange Commission, we will be sending you this notice annually, as long as you own shares in the Funds or have an account with Barings.
Barings Securities LLC is a member of the Financial Industry Regulatory Authority (FINRA) and the Securities Investor Protection Corporation (SIPC). Investors may obtain information about SIPC including the SIPC brochure by contacting SIPC online at www.sipc.org or calling (202)-371-8300. Investors may obtain information about FINRA including the FINRA Investor Brochure by contacting FINRA online at www.finra.org or by calling (800) 289-9999.
December 2020
42

Item 2. Code of Ethics.
The Registrant adopted a Code of Ethics for Senior Financials Officers (the “Code”) on October 17, 2012, which is available on the Registrant’s website at www.barings.com/bgh. During the period covered by this Form N-CSR, there were no material amendments to, or waivers from, the code.
Item 3. Audit Committee Financial Expert.
The Registrant’s Board of Trustees has determined that Dr. Bernard A. Harris, Jr., Mr. Thomas W. Okel and Mr. Martin A. Sumichrast, constituting all the members of the Registrant’s Audit Committee, are audit committee financial experts. Dr. Harris, Mr. Okel and Mr. Sumichrast are “independent” for purposes of this Item 3 as required by applicable regulation.
Item 4. Principal Accountant Fees and Services.
The Registrant has engaged Deloitte & Touche LLP (“Deloitte”) as its principal accountant to perform audit services, audit-related services, tax services and other services during the past two fiscal years. The following table details the aggregate fees billed or expected to be billed for each of the last two fiscal years by Deloitte.
Fees Billed to the Registrant
| | | | | | | | |
| | | Deloitte
Year Ended
December 31, 2020 | | | Deloitte
Year Ended
December 31, 2019 | |
Audit Fees | | $ | 74,550 | | | $ | 72,250 | |
Audit-Related Fees | | | 0 | | | | 0 | |
Tax Fees | | | 12,572 | | | | 12,445 | |
All Other Fees | | | 0 | | | | 0 | |
| | | | | | | | |
Total Fees | | $ | 87,122 | | | $ | 84,695 | |
| | | | | | | | |
Non-Audit Fees Billed to Barings and MassMutual
| | | | | | | | |
| | | Deloitte
Year Ended
December 31, 2020 | | | Deloitte
Year Ended
December 31, 2019 | |
Audit-Related Fees | | $ | 5,966,673 | | | $ | 5,392,637 | |
Tax Fees | | | 3,526,367 | | | | 5,163,666 | |
All Other Fees | | | 3,905,524 | | | | 4,159,086 | |
| | | | | | | | |
Total Fees | | $ | 13,398,564 | | | $ | 14,715,389 | |
| | | | | | | | |
The category “Audit Fees” refers to performing an audit of the Registrant’s annual financial statements or services that are normally provided by the principal accountant in connection with statutory and regulatory filings or engagements for those fiscal years. The category “Audit-Related Fees” reflects fees billed by Deloitte for various non-audit and non-tax services rendered to the Registrant and Barings and MassMutual, such as a SOC–1 review, consulting and agreed upon procedures reports. Preparation of Federal, state and local income tax and tax compliance work are representative of the fees reported in the “Tax Fees” category. The category “All Other Fees” represents fees billed by Deloitte for consulting rendered to the Registrant, Barings and MassMutual.
The Sarbanes-Oxley Act of 2002 and its implementing regulations allow the Registrant’s Audit Committee to establish a pre-approval policy for certain services rendered by the Registrant’s principal accountant. During 2020, the Registrant’s Audit Committee approved all of the services rendered to the Registrant by Deloitte and did not rely on such a pre-approval policy for any such services.
The Audit Committee has also reviewed the aggregate fees billed for professional services rendered by Deloitte for 2020 and 2019 for the Registrant and for the non-audit services provided to Barings, and Barings’ parent, MassMutual. As part of this review, the Audit Committee considered whether the provision of such non-audit services was compatible with maintaining the principal accountant’s independence.
The 2019 fees billed represent final 2019 amounts, which may differ from the preliminary figures available as of the filing date of the Registrant’s 2020 Annual Form N-CSR and includes, among other things, fees for services that may not have been billed as of the filing date of the Registrant’s 2020 Annual Form N-CSR, but are now properly included in the 2020 fees billed to the Registrant, Barings and MassMutual.
Item 5. Audit Committee of Listed Registrants.
The Registrant maintains an Audit Committee composed exclusively of Trustees of the Registrant who qualify as “independent” Trustees under the current listing standards of the New York Stock Exchange and the rules of the U.S. Securities and Exchange Commission. The Audit Committee operates pursuant to a written Audit Committee Charter, which is available (1) on the Registrant’s website, www.barings.com/bgh, and (2) without charge, upon request, by calling, toll-free 1-866-399-1516. The current members of the Audit Committee are Dr. Bernard A. Harris, Rodney J. Dillman, Thomas W. Okel, Cynthia R. Plouche and Martin A. Sumichrast.
Item 6. Investments.
A schedule of investments for the Registrant is included as part of this report to shareholders under Item 1 of this Form N-CSR.
Item 7. Disclosure of Proxy Voting Policies and Procedures for Closed-End Management Investment Companies.
The Registrant’s Board of Trustees has delegated proxy voting responsibilities relating to the voting securities held by the Registrant to its investment adviser, Barings LLC (“Barings”). A summary of Barings’ proxy voting policies and procedures are set forth below.
Summary of Barings’ Proxy Voting Policy:
Barings understands that the voting of proxies is an integral part of its investment management responsibilities and believes, as a general principle, that proxies should be acted upon (voted or abstained) solely in the best interest of its clients (i.e. in a manner believed by Barings to best pursue a client’s investment objectives). To implement this general principle, Barings engages a proxy service provider (“Service Provider”) that is responsible for processing and maintaining records of proxy votes. In addition, the Service Provider, a recognized authority on proxy voting and corporate governance, provides research and recommendations (including environmental, social and governance topics on proxies to Barings as its research provider (the “Research Provider”) . It is Barings’ Global Proxy Voting Policy to generally vote all Client proxies for which it has proxy voting discretion in accordance with the recommendations of the Research Provider or with the Research Provider’s proxy voting guidelines (“Guidelines”), in absence of a recommendation. In circumstances where the Research Provider has not provided a recommendation or has not contemplated an issue within its Guidelines, the proxy will be analyzed on a case-by-case basis.
Barings recognizes that there are times when it is in the best interest of clients to vote proxies (i) against the Research Provider’s recommendations or (ii) in instances where the Research Provider has not provided a recommendation vote against the Guidelines. Barings can vote, in whole or in part, against the Research Provider’s recommendations or Guidelines, as it deems appropriate. The procedures set forth in the Global Proxy Voting Policy are designed to ensure that votes against the Research Provider’s recommendations or Guidelines are made in the best interests of clients and are not the result of any material conflict of interest (“Material Conflict”). For purposes of the Global Proxy Voting Policy, a Material Conflict is defined as any position, relationship or interest, financial or otherwise, of Barings or a Barings associate that could reasonably be expected to affect the independence or judgment concerning proxy voting.
Summary of Barings’ Proxy Voting Procedures:
Typically, Barings will vote all client proxies for which it has proxy voting discretion, where no Material Conflict exists, in accordance with the Research Provider’s recommendations or Guidelines, unless (i) Barings is unable or determines not to vote a proxy in accordance with the Global Proxy Voting Policy or (ii) an authorized investment person or designee (a “Proxy Analyst”) determines that it is in the client’s best interests to vote against the Research Provider’s recommendations or Guidelines. In such cases where a Proxy Analyst believes a proxy should be voted against the Research Provider’s recommendations or Guidelines, the Proxy Team will vote the proxy in accordance with the Proxy Analyst’s recommendation as long as (i) no other Proxy Analyst disagrees with such recommendation; and (ii) no known Material Conflict is identified by the Proxy Analyst(s) or the Proxy Team. If a Material Conflict is identified by a Proxy Analyst or the proxy administrator, the proxy will be submitted to the Trading Practices Committee to determine how the proxy is to be voted in order to achieve that client’s best interests.
No associate, officer, director or board of managers/directors of Barings or its affiliates (other than those assigned such responsibilities under the Global Proxy Voting Policy) can influence how Barings votes client proxies, unless such person has been requested to provide assistance by a Proxy Analyst or Trading Practices Committee member and has disclosed any known Material Conflict. Pre-vote communications with proxy solicitors are prohibited. In the event that pre-vote communications occur, it should be reported to the Trading Practices Committee or Barings’ Chief Compliance Officer prior to voting. Any questions or concerns regarding proxy-solicitor arrangements should be addressed to Barings’ Chief Compliance Officer.
Investment management agreements generally delegate the authority to vote proxies to Barings in accordance with Barings’ Global Proxy Voting Policy. In the event an investment management agreement is silent on proxy voting, Barings should obtain written instructions from the client as to their voting preference. However, when the client does not provide written instructions as to their voting preferences, Barings will assume proxy voting responsibilities. In the event that a client makes a written request regarding voting, Barings will vote as instructed.
Obtaining a Copy of the Proxy Voting Policy
Clients can obtain a copy of Barings’ Proxy Voting Policy and information about how Barings voted proxies related to their securities, free of charge, by contacting the Chief Compliance Officer, Barings LLC, 300 South Tryon, Charlotte, NC 28202, or calling toll-free, 1-877-766-0014.
Item 8. Portfolio Managers of Closed-End Management Investment Companies.
The following disclosure item is made as of the date of this Form N-CSR unless otherwise indicated.
PORTFOLIO MANAGER. Sean Feeley serves as President of the Registrant (since 2017) and was formerly a Vice President (from 2012-2017). Mr. Feeley is a portfolio manager for Barings’ U.S. High Yield Investments Group. He is also a member of the firm’s U.S. High Yield Investment Committee and the Global High Yield Allocation Committee. Mr. Feeley is responsible for the portfolio management of various high yield bond total return strategies. He also currently services as a Vice President of Barings Corporate Investors and Barings Participation Investors, both closed-end investment companies managed by Barings. Mr. Feeley has worked in the industry since 1996 and his experience has encompassed the credit market across a variety of industries. Prior to joining Barings in 2003, he worked at Cigna Investment Management in project finance and at Credit Suisse, where he worked in the leveraged finance group. Mr. Feeley holds a B.S. in Accounting from Canisius College (magna cum laude) and an M.B.A. from Cornell University. He is a Certified Public Accountant (inactive) and member of the CFA Institute.
PORTFOLIO MANAGEMENT TEAM. Mr. Feeley has primary responsibility for overseeing the investments of the Registrant’s portfolio, with the date-to-day investment management responsibility of the Registrant’s portfolio being shared with the following Barings and Baring Investment Services Limited professionals (together with the Portfolio Manager, the “Portfolio Team”).
Scott Roth serves as a Vice President of the Registrant (since 2012). Mr. Roth is a member of Barings’ U.S. High Yield Investments Group and the U.S. High Yield Investment Committee. His responsibilities include portfolio management for various high yield bond total return strategies. Mr. Roth has worked in the industry since 1993 and his experience has encompassed fund management, underwriting, leveraged loans and high yield. Prior to joining Barings in 2002, he was a vice president at Webster Bank and was a high yield analyst at Times Square Capital Management. He also served as an underwriter at Chubb Insurance Company. Mr. Roth holds a B.B.A. from Western Michigan University, an M.B.A. from the Ross School of Business at University of Michigan and is a member of the CFA Institute.
Craig Abouchar is a member of Barings’ European High Yield Investments Group and the European High Yield Investment Committee. He is a lead portfolio manager for the firm’s European High Yield Bond business and he is responsible for the portfolio management of numerous strategies. Mr. Abouchar has worked in the industry since 1994 and his experience has encompassed a focus on below-investment-grade assets across all investment types and geographic markets. Prior to joining Baring Investment Services Limited (“BISL”), affiliate of Baring International Investments Limited (“BIIL”), in 2016, he was Co-CEO, Europe of Castle Hill Asset Management. Prior to Castle Hill, Mr. Abouchar was a portfolio manager at Ignis Investment Management. He was also previously the chairman of the board of directors for the European High Yield Association. He earned a B.B.A. in Finance from Emory University and an M.B.A in Finance and International Business from Columbia University.
Chris Sawyer is a member of Barings’ European High Yield Investments Group and the firm’s European High Yield Investment Committee. Mr. Sawyer is responsible for the portfolio management of several high yield strategies and also manages the firm’s European high yield trading operations. He joined BISL in 2005. Prior to joining the trading team in 2008, Mr. Sawyer was a member of the portfolio monitoring team where he was responsible for the performance analysis of individual portfolio assets. He holds a B.Sc. in Economics and Business Finance from Brunel University.
OTHER ACCOUNTS MANAGED BY THE PORTFOLIO MANAGEMENT TEAM.
| | | | | | | | | | | | | | |
Portfolio Team | | Account Category | | Total
Number of
Accounts | | Approximate
Total Asset
Size (A) (B) | | | Number of
Accounts with
Performance-
Based Advisory
Fee | | Approximate
Asset Size of
Performance-
Based Advisory
Fee Accounts | |
Sean Feeley | | Registered Investment Companies | | 8 | | $ | 2,901 | | | 0 | | $ | 0 | |
| | Other Pooled Investment Vehicles | | 9 | | $ | 2,978 | | | 0 | | $ | 0 | |
| | Other Accounts | | 28 | | $ | 4,188 | | | 0 | | $ | 0 | |
Craig Abouchar | | Registered Investment Companies | | 0 | | $ | 0 | | | 0 | | $ | 0 | |
| | Other Pooled Investment Vehicles | | 7 | | $ | 4,385 | | | 0 | | $ | 0 | |
| | Other Accounts | | 8 | | $ | 2,285 | | | 0 | | $ | 0 | |
Scott Roth | | Registered Investment Companies | | 5 | | $ | 957 | | | 0 | | $ | 0 | |
| | Other Pooled Investment Vehicles | | 12 | | $ | 4,866 | | | 0 | | $ | 0 | |
| | Other Accounts | | 23 | | $ | 4,892 | | | 0 | | $ | 0 | |
Chris Sawyer | | Registered Investment Companies | | 2 | | $ | 212 | | | 0 | | $ | 0 | |
| | Other Pooled Investment Vehicles | | 12 | | $ | 16,394 | | | 0 | | $ | 0 | |
| | Other Accounts | | 8 | | $ | 1,699 | | | 0 | | $ | 0 | |
| (A) | Account asset size has been calculated as of December 31, 2020. |
| (B) | Asset size in millions. |
MATERIAL CONFLICTS OF INTEREST. The potential for material conflicts of interest may exist as the members of the Portfolio Management Team have responsibilities for the day-to-day management of multiple advisory accounts. These conflicts may be heightened to the extent the individual, Barings and/or an affiliate has an investment in one or more of such accounts. Barings has identified (and summarized below) areas where material conflicts of interest are most likely to arise, and has adopted policies and procedures that it believes are reasonable to address such conflicts.
Transactions with Affiliates: From time to time, Barings or its affiliates, including MassMutual and its affiliates acts as principal, buys securities or other investments for itself from or sells securities or other investments it owns to its advisory clients. Likewise, Barings can either directly or on behalf of MassMutual, purchase and/or hold securities or other investments that are subsequently sold or transferred to advisory clients. Barings has a conflict of interest in connection with a transaction where it or an affiliate is acting as principal since it has an incentive to favor itself or its affiliates over its advisory clients in connection with the transaction. To address the conflicts of interest, Barings has adopted a Principal Transactions, Cross Trades and Other Affiliated Transactions Policy, which ensures any such transaction is consistent with Barings’ fiduciary obligations to act in the best interests of its clients, including its ability to obtain best execution in connection with the transaction, and is in compliance with applicable legal and regulatory requirements.
Cross Trades: For some its advisory clients, Barings can effect cross-trades whereby one advisory client buys securities or other investments from or sells securities or other investments to another advisory client. Barings can also effect cross-trades involving advisory accounts or funds in which it or its affiliates, including MassMutual, and their respective employees, have an ownership interest or for which Barings is entitled to earn a performance fee. When Barings effects cross-trades there is an inherent conflict of interest since Barings has an incentive to favor the advisory client or fund in which it or its affiliate has an ownership or economic interest and/or is entitled to a performance fee. In order to address this conflicts of interest, cross trades involving advisory client accounts are required to comply with Barings Principal Transactions, Cross Trades and Other Affiliated Transactions Policy, which ensures any affiliated transaction is consistent with all applicable regulatory requirements governing such transactions and with Barings’ fiduciary obligations to the clients involved in any such transactions.
Loan Origination Transactions: While Barings or its affiliates generally do not act as an underwriter or member of a syndicate in connection with a securities offering, Barings or its affiliates (or an unaffiliated entity in which Barings or its affiliates have an ownership interest) can act as an underwriter, originator, agent, or member of a syndicate in connection with the origination of senior secured loans or other lending arrangements with borrowers, where such loans are purchased by Barings advisory clients during or after the original syndication. Barings advisory clients purchase such loans directly from Barings or its affiliates (or an unaffiliated entity in which Barings or its affiliates have an ownership interest) or from other members of the lending syndicate. In connection with such loan originations, Barings or its affiliates, either directly or indirectly, receive underwriting, origination, or agent fees. As a result, Barings has a conflict of interest in connection with such loan origination transactions since it has an incentive to base its investment recommendation to its advisory clients on the amount of compensation, underwriting, origination or agent fees it would receive rather than on its advisory clients’ best interests. To address the conflict of interest,
Barings has adopted a Principal Transactions, Cross Trades and Other Affiliated Transactions Policy, which ensures any such transaction is consistent with Barings’ fiduciary obligations to act in the best interests of its clients, including its ability to obtain best execution in connection with the transaction, and is in compliance with applicable legal and regulatory requirements.
Investments by Advisory Clients: Barings has the ability to invest client assets in securities or other investments that are also held by (i) Barings or its affiliates, including MassMutual, (ii) other Barings advisory accounts, (iii) funds or accounts in which Barings or its affiliates or their respective employees have an ownership or economic interest or (iv) employees of Barings or its affiliates. Barings also has the ability, on behalf of its advisory clients, to invest in the same or different securities or instruments of issuers in which (a) Barings or its affiliates, including MassMutual, (b) other Barings advisory accounts, (c) funds or accounts in which Barings, its affiliates, or their respective employees have an ownership or economic interest or (d) employees of Barings or its affiliates, have an ownership interest as a holder of the debt, equity or other instruments of the issuer. Barings has a conflict of interest in connection with any such transaction since investments by its advisory clients can directly or indirectly benefit Barings and/or its affiliates and employees by potentially increasing the value of the securities or instruments it holds in the issuer. Any investment by Barings on behalf of its advisory clients will be consistent with its fiduciary obligations to act in the best interests of its advisory clients, and otherwise be consistent with such clients’ investment objectives and restrictions.
Barings or its affiliates can recommend that clients invest in registered or unregistered investment companies, including private investment funds such as hedge funds, private equity funds or structured funds (i) advised by Barings or an affiliate, (ii) in which Barings, an affiliate or their respective employees has an ownership or economic interest or (iii) with respect to which Barings or an affiliate has an interest in the entity entitled to receive the fees paid by such funds. Barings has a conflict of interest in connection with any such recommendation since it has an incentive to base its recommendation to invest in such investment companies or private funds on the fees that Barings or its affiliates would earn as a result of the investment by its advisory clients in the investment companies or private funds. Any recommendation to invest in a Barings advised fund or other investment company will be consistent with Barings’ fiduciary obligations to act in the best interests of its advisory clients, consistent with such clients’ investment objectives and restrictions. In certain limited circumstances, Barings offers to clients that invest in private investment funds that it advises an equity interest in entities that receive advisory fees and carried profits interest from such funds.
Employee Co-Investment: Barings permits certain of its portfolio managers and other eligible employees to invest in certain private investment funds advised by Barings or its affiliates and/or share in the performance fees received by Barings from such funds. If the portfolio manager or other eligible employee was responsible for both the portfolio management of the private fund and other Barings advisory accounts, such person would have a conflict of interest in connection with investment decisions since the person has an incentive to direct the best investment ideas, or to allocate trades, in favor of the fund in which he or she is invested or otherwise entitled to share in the performance fees received from such fund. To address the conflicts of interest, Barings has adopted a Side by Side Management of Private Investment Funds and Other Advisory Accounts Policy which requires, among others things, that Barings treat each of its advisory clients in a manner consistent with its fiduciary obligations and prohibits Barings from favoring any particular advisory account as a result of the ownership or economic interests of Barings, its affiliates or employees, in such advisory account. Any investment by a Barings employee in one of its private funds is also governed by Barings’ Global Employee Co-Investment Policy, which ensures that any co-investment by a Barings employee is consistent with Barings’ Global Code of Ethics Policy, as summarized above.
Management of Multiple Accounts: As noted above, Barings’ portfolio managers are often responsible for the day-to-day management of multiple accounts, including, among others, separate accounts for
institutional clients, closed-end and open-end registered investment companies, and/or private investment funds (such as hedge funds, private equity funds and structured funds), as well as for proprietary accounts of Barings and its affiliates, including MassMutual and its affiliates. The potential for material conflicts of interest exist whenever a portfolio manager has responsibility for the day-to-day management of multiple advisory accounts. These conflicts are heightened to the extent a portfolio manager is responsible for managing a proprietary account for Barings or its affiliates or where the portfolio manager, Barings and/or an affiliate has an investment in one or more of such accounts or an interest in the performance of one or more of such accounts (e.g., through the receipt of a performance fee).
Investment Allocation: Such potential conflicts include those relating to allocation of investment opportunities. For example, it is possible that an investment opportunity is suitable for more than one account managed by Barings, but is not available in sufficient quantities for all accounts to participate fully. Similarly, there can be limited opportunity to sell an investment held by multiple accounts. A conflict arises where the portfolio manager has an incentive to treat an account preferentially because the account pays Barings or its affiliates a performance-based fee or the portfolio manager, Barings or an affiliate has an ownership or other economic interest in the account. As noted above, Barings also acts as an investment manager for certain of its affiliates, including MassMutual. These affiliate accounts sometimes co-invest jointly and concurrently with Barings’ other advisory clients and therefore share in the allocation of such investment opportunities. To address the conflicts of interest associated with the allocation of trading and investment opportunities, Barings has adopted a Global Investment Allocation Policy and trade allocation procedures that govern the allocation of portfolio transactions and investment opportunities across multiple advisory accounts, including affiliated accounts, which are summarized below under Item 12 – Brokerage Practices, Global Investment Allocation Policy. In addition, as noted above, to address the conflicts, Barings has adopted a Side by Side Management of Private Investment Funds and Other Advisory Accounts Policy which requires, among others things, that Barings treat each of its advisory clients in a manner consistent with its fiduciary obligations and prohibits Barings from favoring any particular advisory account as a result/ of the ownership or economic interests of Barings, its affiliates or employees, in such advisory accounts. Any investment by a Barings employee in one of its private funds is also governed by Barings’ Global Employee Co-Investment Policy, which ensures that any co-investment by a Barings employee is consistent with Barings’ Global Code of Ethics Policy, as summarized above.
Personal Securities Transactions; Short Sales: Potential material conflicts of interest also arise related to the knowledge and timing of an account’s trades, investment opportunities and broker or dealer selection. Barings and its portfolio managers have information about the size, timing and possible market impact of the trades of each account they manage. It is possible that portfolio managers could use this information for their personal advantage and/or to the advantage or disadvantage of various accounts which they manage. For example, a portfolio manager could cause a favored account to “front run” an account’s trade or sell short a security for an account immediately prior to another account’s sale of that security. To address these conflicts, Barings has adopted policies and procedures, including a Global Short Sale Policy, which ensures that the use of short sales by Barings is consistent with Barings’ fiduciary obligations to its clients, a Side by Side Management of Private Investment Funds and Other Advisory Accounts Policy, which requires, among other things, that Barings treat each of its advisory clients in a manner consistent with its fiduciary obligations and prohibits Barings from favoring any particular account as a result of the ownership or economic interest of Barings, its affiliates or employees and a Global Code of Ethics Policy, as summarized above.
Trade Errors: Potential material conflicts of interest also arise if a trade error occurs in a client account. A trade error is deemed to occur if there is a deviation by Barings from the applicable standard of care in connection with the placement, execution or settlement of a trade for an advisory account that results in (1) Barings purchasing assets not permitted or authorized by a client’s investment advisory agreement or otherwise failing to follow a client’s specific investment directives; (2) Barings purchasing or selling the
wrong security or the wrong amount of securities on behalf of a client’s account; or (3) Barings purchasing or selling assets for, or allocating assets to, the wrong client account. When correcting these errors, conflicts of interest between Barings and its advisory accounts arise as decisions are made on whether to cancel, reverse or reallocate the erroneous trades. In order to address the conflicts, Barings has adopted a Global Client Account Errors Policy governing the resolution of trading errors, and will follow the Global Client Account Errors Policy in order to ensure that trade errors are handled promptly and appropriately and that any action taken to remedy an error places the interest of a client ahead of Barings’ interest.
Best Execution; Directed or Restricted Brokerage: With respect to securities and other transactions (including, but not limited to, derivatives transactions) for most of the accounts it manages, Barings determines which broker, dealer or other counterparty to use to execute each order, consistent with its fiduciary duty to seek best execution of the transaction. Barings manages certain accounts, however, for clients who limit its discretion with respect to the selection of counterparties or direct it to execute such client’s transactions through a particular counterparty. In these cases, trades for such an account in a particular security or other transaction can be placed separately from, rather than aggregated with, those in the same security or transaction for other accounts. Placing separate transaction orders for a security or transaction can temporarily affect the market price of the security or transaction or otherwise affect the execution of the transaction to the possible detriment of one or more of the other account(s) involved. Barings has adopted a Global Best Execution Policy and a Global Directed or Restricted Brokerage Policy which are summarized below under Item 12 – Brokerage Practices, Counterparty Selection/Recommendations and Directed/Restricted Brokerage.
As discussed above, Barings employees have the ability to trade in securities that are purchased, held and sold by or on behalf of Barings’ advisory clients, subject to a number of limitations. See above for a discussion of restrictions on employee personal securities transactions contained in Barings’ Global Code of Ethics.
Barings and its portfolio managers or employees have other actual or potential conflicts of interest in managing an advisory account, and the list above is not a complete description of every conflict of interest that could be deemed to exist.
COMPENSATION.
Barings (Investment Adviser):
Compensation packages at Barings are structured such that key professionals have a vested interest in the continuing success of the firm. Portfolio managers’ compensation is comprised of base salary and a discretionarily allocated incentive bonus, which includes a performance-driven annual bonus, and may include a deferred long-term incentive bonus and also may contain a performance fee award. As part of the firm’s continuing effort to monitor retention, Barings participates in annual compensation surveys of investment management firms to ensure that Barings’ compensation is competitive with industry norms.
Base Salary
The base salary component is generally positioned at mid-market. Increases are tied to market, individual performance evaluations and budget constraints.
Annual Bonus - Short Term Incentive (STI)
The annual bonus pool applies to all associates in the firm. Factors impacting the potential bonuses include but are not limited to: (i) investment performance of funds/accounts managed by a portfolio manager, (ii) financial performance of Barings, (iii) client satisfaction and (iv) teamwork. STI is typically paid in February/March following the performance year for which the award is based.
Long-Term Incentives (LTI)
Barings’ long-term incentives are designed to share the long-term success of the firm and take the form of deferred cash awards, which may include an award that resembles phantom restricted stock; linking the value of the award to a formula including Barings’ overall earnings. A voluntary separation of service will generally result in a forfeiture of unvested LTI awards.
BIIL (Sub-Adviser):
The Sub-Adviser’s remuneration structure is designed to support and further BIIL’s business strategy, objectives, values and long-term interests. Packages aim to facilitate the retention of existing employees and attract high calibre new employees in order to achieve the best results for BIIL and its clients. As a result, packages offered should be competitive with those available to professionals working in London in relevant areas (including banking, private equity, asset management, corporate finance advisory, law, and accounting).
Remuneration Components:
Remuneration arrangements for employees currently comprise some or all of the following components:
(a) fixed salary;
(b) awards under the short-term incentive scheme (“STI”);
(c) awards under the long-term incentive scheme (“LTI”); and
(d) share of carried interest in certain funds (“Carried Interest”).
Fixed Salary:
All employees receive a fixed salary, payable in monthly instalments. Fixed salaries are reviewed from time to time. Fixed salary for an earnings year is determined following the completion of the end-of-year appraisals for the previous year. Staff members are notified of any change to their fixed salary in February.
Short-Term Incentive Scheme:
All employees are eligible to be considered for an STI award each year. While STI awards may be made in non-cash form, all awards have been made in cash to date. Similar to the US employees, awards to UK employees are determined following the completion of the end-of-year appraisals for the earnings year to which they correspond and are based on divisional and individual performance metrics, taking into account the profits generated by the firm.
Long-Term Incentive Scheme:
LTI awards are used to reward and retain employees that senior management consider to be key to the firm’s overall business. All employees are eligible to be considered for an LTI award each year. Awards are based on performance, taking into account the profits generated by the firm. LTI awards are entirely made in non-cash form.
BENEFICIAL OWNERSHIP. As of December 31, 2020, members of the Portfolio Management Team beneficially owned the following dollar range of equity securities in the Registrant:
| | |
Portfolio Management Team: | | Dollar Range of Beneficially Owned* Equity Securities of the Registrant: |
Sean Feeley | | $100,001-$500,000 |
Craig Abouchar | | None |
Scott Roth | | $10,001-$50,000 |
Chris Sawyer | | None |
| * | Beneficial ownership has been determined in accordance with Rule 16(a)-1(a)(2) under the Securities Exchange Act of 1934, as amended. |
Item 9. Purchases of Equity Securities by Closed-End Management Investment Company and Affiliated Purchasers.
Not applicable for this filing.
Item 10. Submission of Matters to a Vote of Security Holders.
Not applicable for this filing.
Item 11. Controls and Procedures.
| (a) | The principal executive officer and the principal financial officer of the Registrant evaluated the effectiveness of the Registrant’s disclosure controls and procedures (as defined in Rule 30a-3(c) under the Investment Company Act of 1940 (the “Act”)) as of a date within 90 days of the filing of this report and based on that evaluation have concluded that such disclosure controls and procedures are effective to provide reasonable assurance that material information required to be disclosed by the Registrant on Form N-CSR is recorded, processed, summarized and reported within the time periods specified in the Securities and Exchange Commission’s rules and forms. |
| (b) | There were no changes to the Registrant’s internal controls over financial reporting (as defined in Rule 30a-3(d) under the Act) during the Registrant’s second half year that have materially affected, or are reasonably likely to materially affect, the Registrant’s internal control over financial reporting period covered by this report that has materially affected, or is reasonably likely to materially affect, the Registrant’s internal control over financial reporting. |
Item 12. Disclosure of Securities Lending Activities for Closed-End Management Investment Companies
The registrant did not engage in securities lending activities during the fiscal year reported on this Form N-CSR.
Item 13. Exhibits.
| | (a) | (1) ANY CODE OF ETHICS, OR AMENDMENTS THERETO, THAT IS THE SUBJECT OF DISCLOSURE REQUIRED BY ITEM 2, TO THE EXTENT THAT THE REGISTRANT INTENDS TO SATISFY THE ITEM 2 REQUIREMENTS THROUGH THE FILING OF AN EXHIBIT. |
The Registrant has posted its Code of Ethics on its website at www.barings.com/bgh.
Filed herewith [for principal executive officer].
Filed herewith [for principal financial officer].
| | (a) | (3) ANY WRITTEN SOLICITATION TO PURCHASE SECURITIES UNDER RULE 23c-1 UNDER THE ACT (17 CFR 270.23c-1) SENT OR GIVEN DURING THE PERIOD COVERED BY THE REPORT BY OR ON BEHALF OF THE REGISTRANT TO 10 OR MORE PERSONS. |
Not applicable for this filing.
Filed herewith.
SIGNATURES
Pursuant to the requirements of the Securities Exchange Act of 1934 and the Investment Company Act of 1940, the registrant has duly caused this report to be signed on its behalf by the undersigned, thereunto duly authorized.
| | | | |
(Registrant): | | | | Barings Global Short Duration High Yield Fund |
| | |
By (Signature and Title): | | | | /s/ Sean Feeley |
| | | | Sean Feeley, President |
| | |
Date: | | | | March 11, 2021 |
Pursuant to the requirements of the Securities Exchange Act of 1934 and the Investment Company Act of 1940, this report has been signed below by the following persons on behalf of the registrant and in the capacities and on the dates indicated.
| | | | |
By (Signature and Title): | | | | /s/ Sean Feeley |
| | | | Sean Feeley, President |
| | |
Date: | | | | March 11, 2021 |
| | |
By (Signature and Title): | | | | /s/ Carlene Pollock |
| | | | Carlene Pollock, Chief Financial Officer |
| | |
Date: | | | | March 11, 2021 |