First Business Financial Services (FBIZ) 8-KRegulation FD Disclosure
Filed: 17 May 12, 12:00am

| Annual Shareholder Meeting May 14, 2012 |
| When used in this presentation, and in any other oral statements made with the approval of an authorized executive officer, the words or phrases "may," "could," "should," "hope," "might," "believe," "expect," "plan," "assume," "intend," "estimate," "anticipate," "project," "likely," or similar expressions are intended to identify "forward-looking statements." Such statements are subject to risks and uncertainties, including, without limitation, changes in economic conditions in the market area of FBB or FBB - Milwaukee, changes in policies by regulatory agencies, fluctuation in interest rates, demand for loans in the market area of FBB or FBB - Milwaukee, borrowers defaulting in the repayment of loans and competition. These risks could cause actual results to differ materially from what FBFS has anticipated or projected. These risk factors and uncertainties should be carefully considered by potential investors. See Item 1A - Risk Factors in our Annual Report on Form 10-K for the year ended December 31, 2011 for discussion relating to risk factors impacting the Corporation. Investors should not place undue reliance on any such forward-looking statements, which speak only as of the date made. The factors described within the Form 10-K could affect the financial performance of FBFS and could cause actual results for future periods to differ materially from any opinions or statements expressed with respect to future periods. Where any such forward-looking statement includes a statement of the assumptions or bases underlying such forward-looking statement, FBFS cautions that, while its management believes such assumptions or bases are reasonable and are made in good faith, assumed facts or bases can vary from actual results, and the differences between assumed facts or bases and actual results can be material, depending on the circumstances. Where, in any forward-looking statement, an expectation or belief is expressed as to future results, such expectation or belief is expressed in good faith and believed to have a reasonable basis, but there can be no assurance that the statement of expectation or belief will result in, or be achieved or accomplished. FBFS does not intend to, and specifically disclaims any obligation to, update any forward-looking statements. Forward Looking Statement |


| Balance Sheet End of Year |

| Income Statement End of Year |

| Top Line Revenue |

| Core Earnings |
| CEO Company Update |

| Agenda Brief Company Overview How Are We Doing? 2011 Objectives Peer Comparisons Stock Performance 2012 Objectives |
| Brief Company Overview |

| The mission of First Business Financial Services, Inc. is to build long-term shareholder value as an entrepreneurial financial services provider to businesses, executives, and high net worth individuals. Mission |
| The mission of First Business Financial Services, Inc. is to build long-term shareholder value as an entrepreneurial financial services provider to businesses, executives, and high net worth individuals. Mission |

| Corporate Profile Headquarters: Madison, WI Employees (Q1 2012) 113 FT, 31 PT Full service branches: none Total assets at March 31, 2012: $1.21 Billion 1 of 2 WI based commercial bank holding companies listed on NASDAQ or NYSE Business model: Business focus Experienced leadership Entrepreneurial management style 100% organic growth Protects culture Protects credit standards Unit/De novo growth |
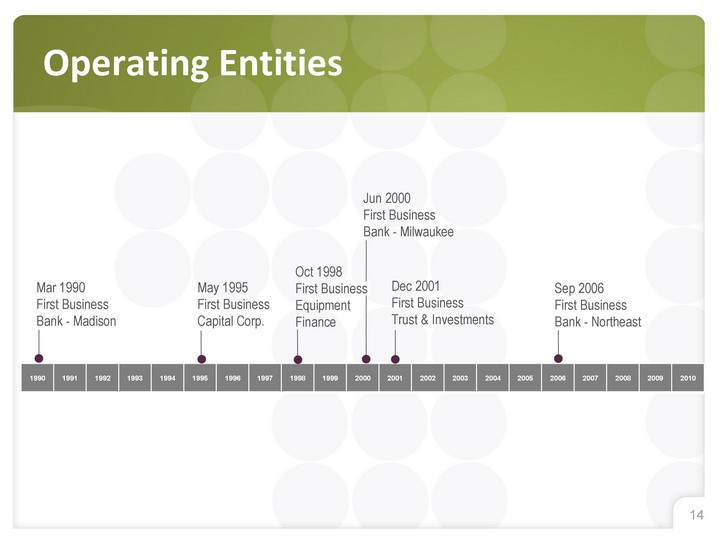
| 1990 1991 1992 1993 1994 1995 1996 1997 1998 1999 2000 2001 2002 2003 2004 2005 2006 2007 2008 2009 2010 Jun 2000 First Business Bank - Milwaukee Operating Entities Mar 1990 First Business Bank - Madison May 1995 First Business Capital Corp. Oct 1998 First Business Equipment Finance Dec 2001 First Business Trust & Investments Sep 2006 First Business Bank - Northeast |
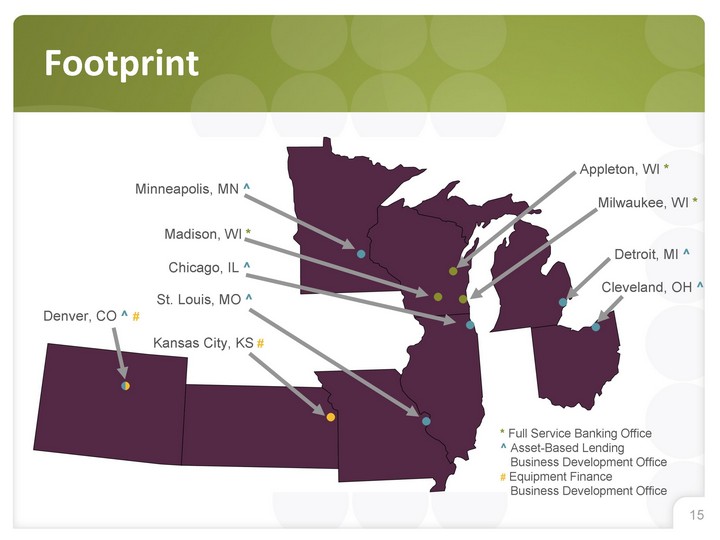
| Footprint St. Louis, MO ^ Chicago, IL ^ Cleveland, OH ^ Minneapolis, MN ^ Detroit, MI ^ * Full Service Banking Office ^ Asset-Based Lending Business Development Office # Equipment Finance Business Development Office Madison, WI * Milwaukee, WI * Appleton, WI * Denver, CO ^ # Kansas City, KS # |

| How Are We Doing? 2011 Objectives |

| Continue organic revenue growth Achieve additional improvement in core earnings Increase percentage of In-market Deposits Improve ROA 2011 Goals |
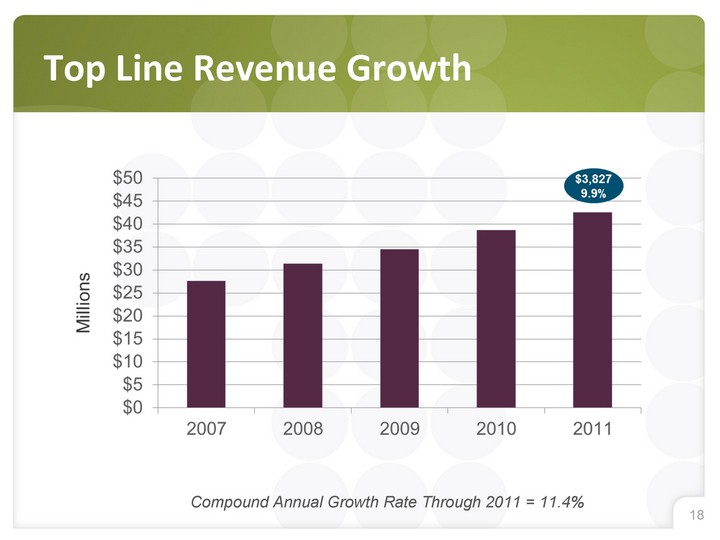
| Top Line Revenue Growth Compound Annual Growth Rate Through 2011 = 11.4% |
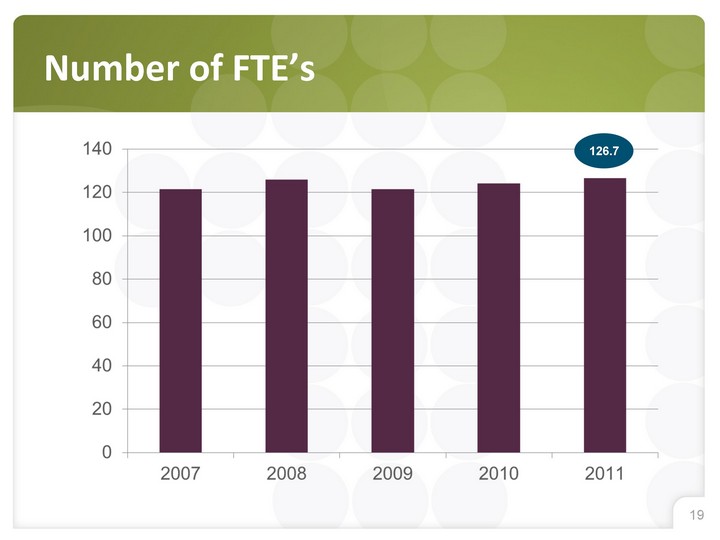
| Number of FTE's 126.7 |
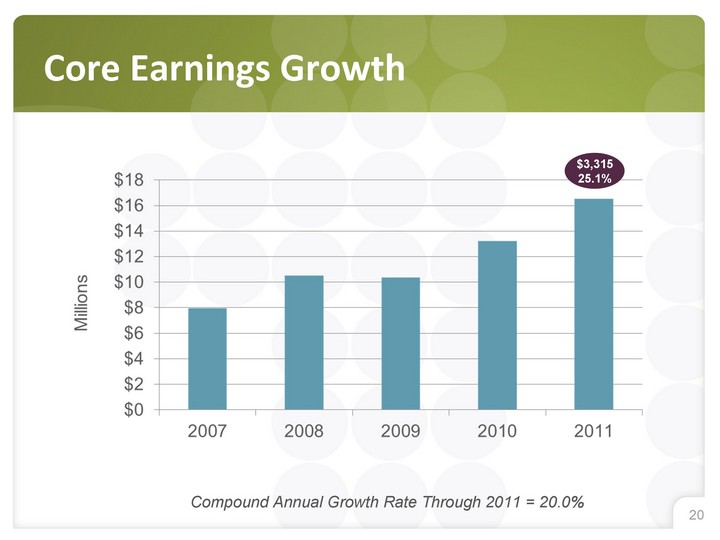
| Core Earnings Growth Compound Annual Growth Rate Through 2011 = 20.0% $3,315 25.1% |

| Return on Average Assets Compound Annual Growth Rate Through 2011 = 17.8% * Excludes goodwill impairment 42 bps 127.3% |
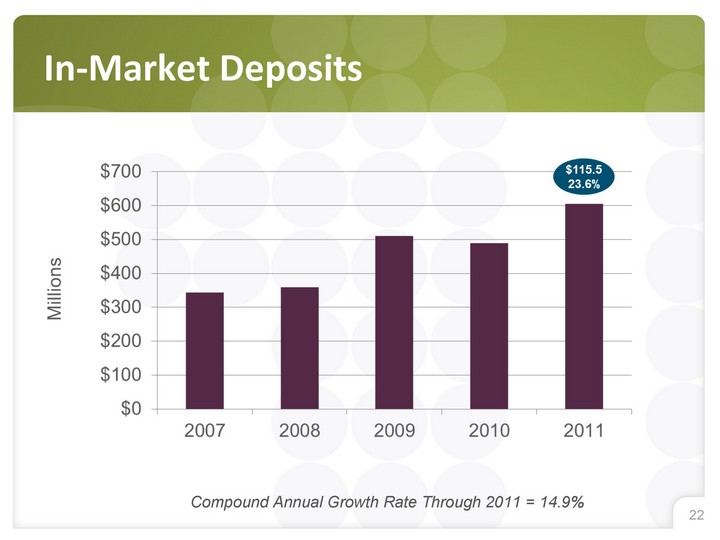
| In-Market Deposits Compound Annual Growth Rate Through 2011 = 14.9% |

| How Are We Doing? Asset Quality |

| 2011 Non-Performing Assets as a Percentage of Total Assets |

| Non-Performing Assets as a Percentage of Total Assets |

| Cumulative Net Charge-offs as a Percentage of Average Loans (2008-2011) |

| How Are We Doing? Peer Comparisons |
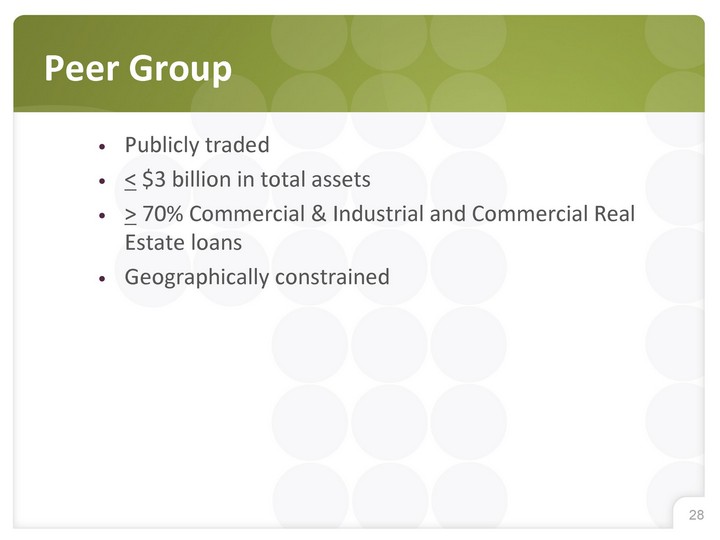
| Publicly traded < $3 billion in total assets > 70% Commercial & Industrial and Commercial Real Estate loans Geographically constrained Peer Group |

| Peer Group |
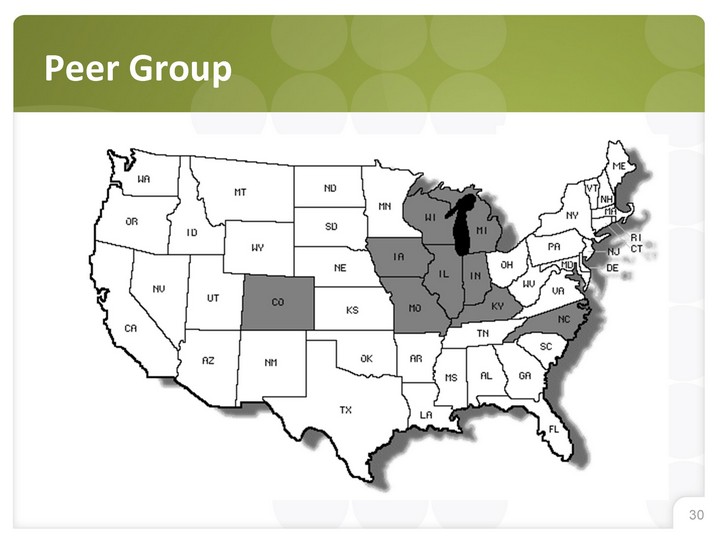
| Peer Group |
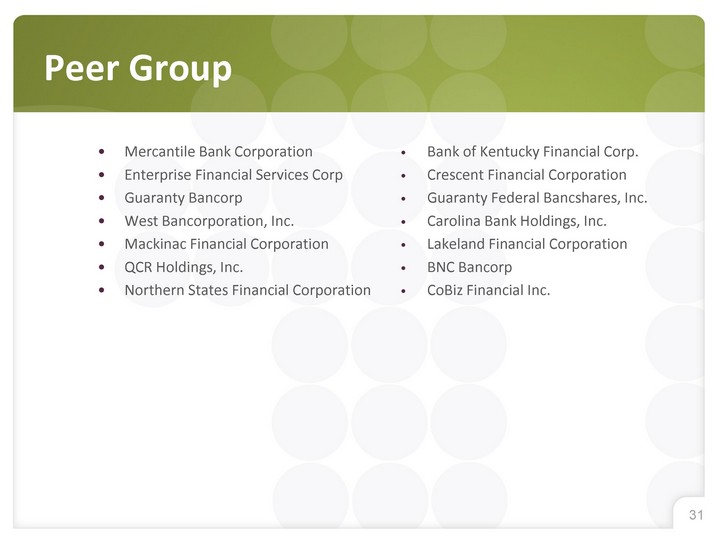
| Peer Group Mercantile Bank Corporation Enterprise Financial Services Corp Guaranty Bancorp West Bancorporation, Inc. Mackinac Financial Corporation QCR Holdings, Inc. Northern States Financial Corporation Bank of Kentucky Financial Corp. Crescent Financial Corporation Guaranty Federal Bancshares, Inc. Carolina Bank Holdings, Inc. Lakeland Financial Corporation BNC Bancorp CoBiz Financial Inc. |
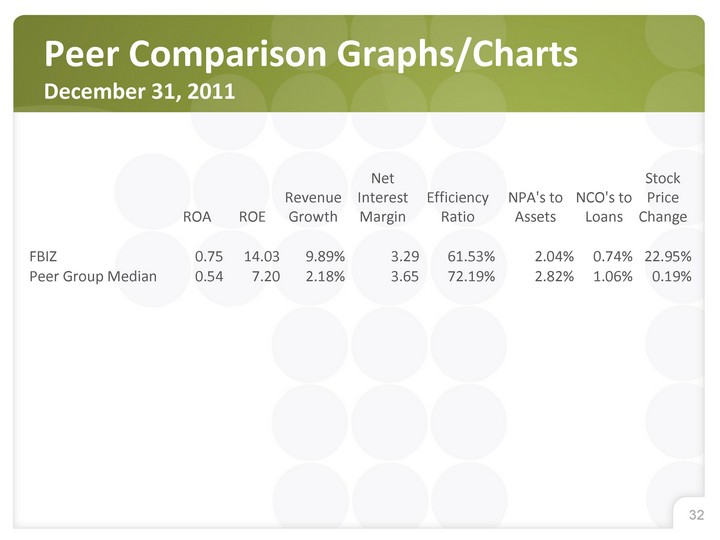
| Peer Comparison Graphs/Charts December 31, 2011 ROA ROE Revenue Growth Net Interest Margin Efficiency Ratio NPA's to Assets NCO's to Loans Stock Price Change FBIZ 0.75 14.03 9.89% 3.29 61.53% 2.04% 0.74% 22.95% Peer Group Median 0.54 7.20 2.18% 3.65 72.19% 2.82% 1.06% 0.19% |

| Stock Performance |

| Stock Performance FBIZ Stock Performance vs. Selected Indices Source: SNL Securities |

| Tangible Book Value per Share Compound Annual Growth Rates Through 2011 = 7.6% $3.17 14.9% |

| Dividend per Share Dividend Yield as of May 10, 2012 = 1.2% |

| 2012 Objectives |

| Continue organic revenue growth Achieve additional improvement in core earnings Increase percentage of In-market Deposits Continued asset quality improvement Maintain strong profitability/ROA Invest in talent for future growth and profitability 2012 Objectives |

| 2012 Q1 Performance Update |

| Top Line Revenue Growth Year over Year Growth = 6.1% $620 6.1% |

| Core Earnings Growth Year over Year Growth = 19.5% $672 19.5% |

| Core Deposit Growth $113,563 22.5% Year over Year Growth = 22.5% |

| Return on Average Assets Growth 26 bps 54.2% Year over Year Growth = 54.2% |
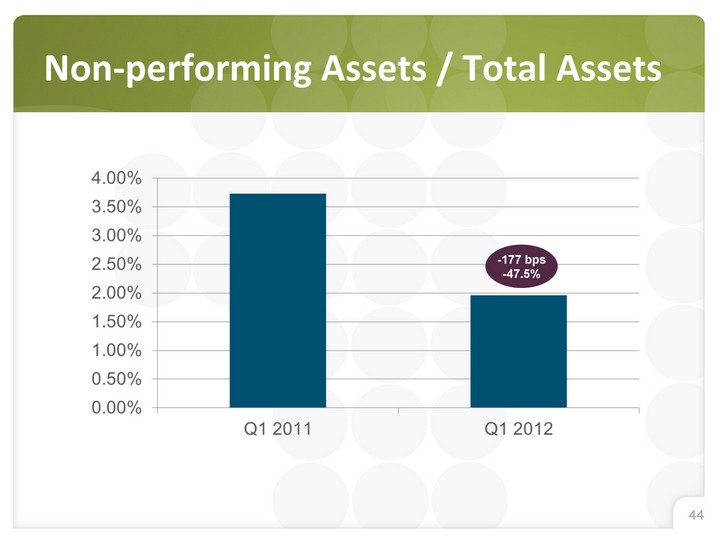
| Non-performing Assets / Total Assets -177 bps -47.5% |
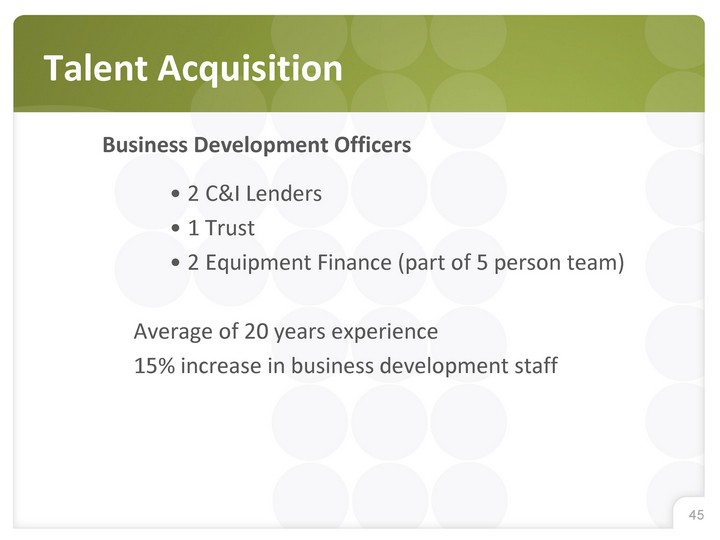
| Business Development Officers 2 C&I Lenders 1 Trust 2 Equipment Finance (part of 5 person team) Average of 20 years experience 15% increase in business development staff Talent Acquisition |

| Q & A |

| Annual Shareholder Meeting May 14, 2012 |