Exhibit 99.1


Dear Shareholders and Friends of First Business:
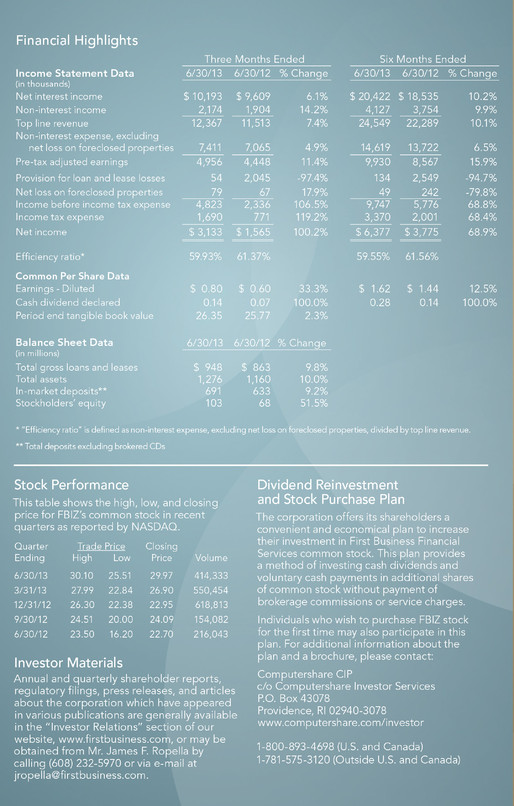
I am pleased to report that First Business again delivered strong financial performance in the second quarter of 2013. Efficient production across our franchise drove our net income up to $3.1 million, double the level earned in last year's second quarter. Each of the drivers of this quarter's performance demonstrates focused execution of our strategic plan and improvement against our strategic objectives. For example, our consistent efforts to attract and retain profitable client relationships drove top line revenue and loan balances to record levels. Likewise, continuous efforts to improve asset quality resulted in low credit costs and a reduction in non-performing assets to our lowest level since the economic crisis began in earnest, in early 2008.
The momentum of our performance, quarter after quarter, has resulted in several important measures reaching key benchmark levels in 2013. Return on average assets grew to 1.04% in the first half of 2013, up from 0.64% just one year ago and surpassing a key industry benchmark of 1.0%. Likewise, our efficiency ratio has reached and remained below 60% for four consecutive quarters, an important achievement particularly in light of our investments in talent and technology over the past year. In addition, non-performing assets to total assets - a critical measure of asset quality - dropped to 0.93% at June 30, 2013, below the key industry benchmark of 1.0%. Our strong and consistent performance stems from the ongoing commitment to our strategic plan, and today I am pleased to outline some differentiating aspects of our business that we believe position us well for continued success into the future.
UNIQUE BUSINESS MODEL DRIVES SUCCESS
First Business' model is unique. First, with no retail branch presence, we are able to operate with fewer employees and much lower overhead costs than many other banks. At the same time, our business development officers' exclusive focus on commercial businesses and trust and investment clients allows us to generate more revenue per employee than our peers who operate more traditional retail community bank franchises. For example, in the second quarter of 2013 our measure of annualized revenue per full-time equivalent employee totaled $346,000 - 57% higher than the average for our peers. One other measure of productivity and profitability is the ratio of a bank's expenses to its assets. For the second quarter of 2013, First Business' ratio of total annualized non-interest expense to average assets was 2.4%, a full 50 basis points lower than the average for our peers. As we've continued to invest in talent, our expenses rose 5% from last year's second quarter, but our average loan balances grew at an even faster pace - up 10%.
The success of our model relies on this efficiency and productivity, and we have been pleased to steadily generate revenue and balances more efficiently and profitably than our peers. Our efficiency ratio - a measure of the cost to generate one dollar of revenue - was 59.9% for the second quarter of 2013, compared to 65.6% for peers. Like a golf score, the lower your efficiency ratio, the better, so we are especially pleased to have retained this

sub-60% efficiency ratio for four consecutive quarters now. We believe it is a key operating advantage for First Business, and it will remain an important focus in our strategic planning.
Another unique advantage of our business model is having a flexible funding profile that benefits increasingly from client deposits, but also efficiently and profitably from wholesale sources. In recent years we have turned our focus to lowering our wholesale reliance by attracting and growing our client relationships. Through our success in working toward this objective we have been entrusted with growing levels of client deposits. We call these funds “in-market deposits,” and they include all transaction accounts, money market accounts, and non-brokered certificates of deposit. At the end of this year's second quarter, in-market deposits measured over 60% of our total deposits, compared to 43% just five years ago in 2008. We are pleased with the approximately 60% level we have achieved today. In-market deposits are a desirable, low-cost resource and they strengthen our mix of core funding.
Particularly in the current rate environment, though, we also remain pleased to have additional sources of funding that help mitigate interest rate risk in a highly effective manner. Wholesale funding sources remain an important part of our model and funding strategy today, in part because of our ability to match-fund our fixed rate term loans. As we continue to grow these loans, we are able to quickly and inexpensively lock-in fixed rate, brokered certificates of deposit that match the contractual time horizons of the new loans. In many cases, long-term fixed rate loans are specifically funded with callable brokered certificates of deposit. If a client pre-pays its loan at any point, the brokered CD may be called. Therefore, we are able to lock-in fixed interest rate spreads on our fixed rate loans, and this has important benefits for our net interest margin. Commercial real estate loans, which are typically fixed rate, are a large component of our loan portfolio, so this access to flexible and predictable funding is an advantage for us as it offers us the ability to prudently extend longer term financing options than many of our competitors. Likewise, we value our capacity to borrow short-term funds from the Federal Home Loan Bank (“FHLB”) at extremely attractive rates. Utilizing FHLB short-term advances, temporarily, allows us to quickly fund new loan growth and raise permanent funding efficiently, increasing our client responsiveness and satisfaction.
COMMITTED TO BUILDING VALUE AND INVESTOR INTEREST
Our unique model continues to exhibit growing profitability, and we are pleased to see some of this strength reflected in our stock's increasing market valuation. We remain focused on elevating the exposure of our company in the capital markets in order to continue to build shareholder value over the long term.
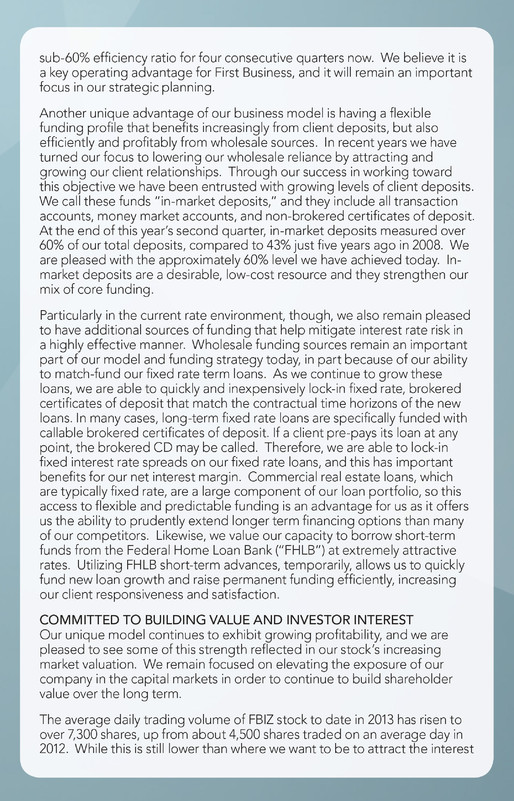
The average daily trading volume of FBIZ stock to date in 2013 has risen to over 7,300 shares, up from about 4,500 shares traded on an average day in 2012. While this is still lower than where we want to be to attract the interest

of a broader base of institutional investors, we believe it represents important progress, particularly as it has been accompanied by a narrowing gap of First Business' valuation versus peers. For example, back in the second quarter of 2011 our peer group's stock traded, on average, at 1.02x tangible book value (“TBV”). At that time FBIZ traded at just 0.58x TBV. In this year's second quarter, FBIZ traded, on average, at 1.09x TBV, compared to 1.15x for peers. The gap has narrowed, but our consistent outperformance of peers on nearly every important financial metric suggests there is opportunity for us to achieve an even stronger valuation. Consider that our return on average assets measured 1.04% in the first half of 2013, compared to just 0.80% for the average of our peers. Likewise, our return on average equity measured 12.42% in the first half of this year, compared to 7.44% for peers. Over the same period, our year-to-date net interest margin grew 18 basis points compared to an average 24 basis point decline for peers. This has translated into First Business delivering a 110% total return to shareholders over the last two years, while peers have returned, on average, 41%. These measures are a continuation of our growth trend, and we aim to ensure every potential investor knows of this consistent execution and performance. We are striving to increase shareholder value every quarter, and we intend to continue to do so.
As always, we thank you for your continued support of First Business, and we hope you'll continue to spread the word.
Sincerely,
Corey Chambas, President and CEO
Note: First Business' peer group, as defined by management, includes: Bank of Kentucky Financial Corporation (BKYF), Guaranty Bancorp (GBNK), Heritage Financial Corporation (HFWA), Mackinac Financial Corporation (MFNC), Mercantile Bank Corporation (MBWM), MetroCorp Bancshares, Inc. (MCBI), Mid Penn Bancorp, Inc. (MPB), MidSouth Bancorp, Inc. (MSL), Old Line Bancshares, Inc. (OLBK), Pacific Continental Corporation (PCBK), Peoples Financial Corporation (PFBX), QCR Holdings, Inc. (QCRH), Republic First Bancorp, Inc. (FRBK), S.Y. Bancorp, Inc. (SYBT), Southern National Bancorp of Virginia, Inc. (SONA), Southwest Bancorp, Inc. (OKSB), Univest Corporation of Pennsylvania (UVSP), Washington Banking Company (WBCO), WashingtonFirst Bankshares, Inc. (WFBI), West Bancorporation, Inc. (WTBA). Peer group averages reflect peer banks that have reported second quarter 2013 earnings through July 29, 2013. QCR Holdings, Inc. (QCRH) and Old Line Bancshares, Inc. (OLBK) did not report second quarter 2013 earnings as of July 29, 2013 and are excluded from all peer averages. All peer data sourced from SNL Financial.
This letter includes "forward-looking" statements related to First Business Financial Services, Inc. (the "Company") that can generally be identified as describing the Company's future plans, objectives or goals. Such forward-looking statements are subject to risks and uncertainties that could cause actual results or outcomes to differ materially from those currently anticipated. These forward-looking statements are made pursuant to the safe harbor provisions of the Private Securities Litigation Reform Act of 1995. For further information about the factors that could affect the Company's future results, please see the Company's annual report on Form 10-K, quarterly reports on Form 10-Q and other filings with the Securities and Exchange Commission.

Financial Highlights

Footprint