Exhibit 99.1
Dear Shareholders and Friends of First Business,
Record second quarter results highlight the strength of the company’s core earnings power, which we believe to be on a stable, upward trajectory. We’ve cultivated a meaningful competitive advantage driven by our niche business banking focus. Our earnings stream, built on a firm foundation of diversified margin and fee revenue, is scalable and positions our franchise for consistent, sustainable growth in the future. The trends behind First Business's outstanding performance halfway through 2019 validate our approach and demonstrate important progress toward our goal of delivering above-average total shareholder returns among our peers.
RECORD RESULTS
Second quarter results grew to record levels, with solid core earnings driven by all-time-high quarterly revenues and enhanced by a net benefit from our loan loss provision.
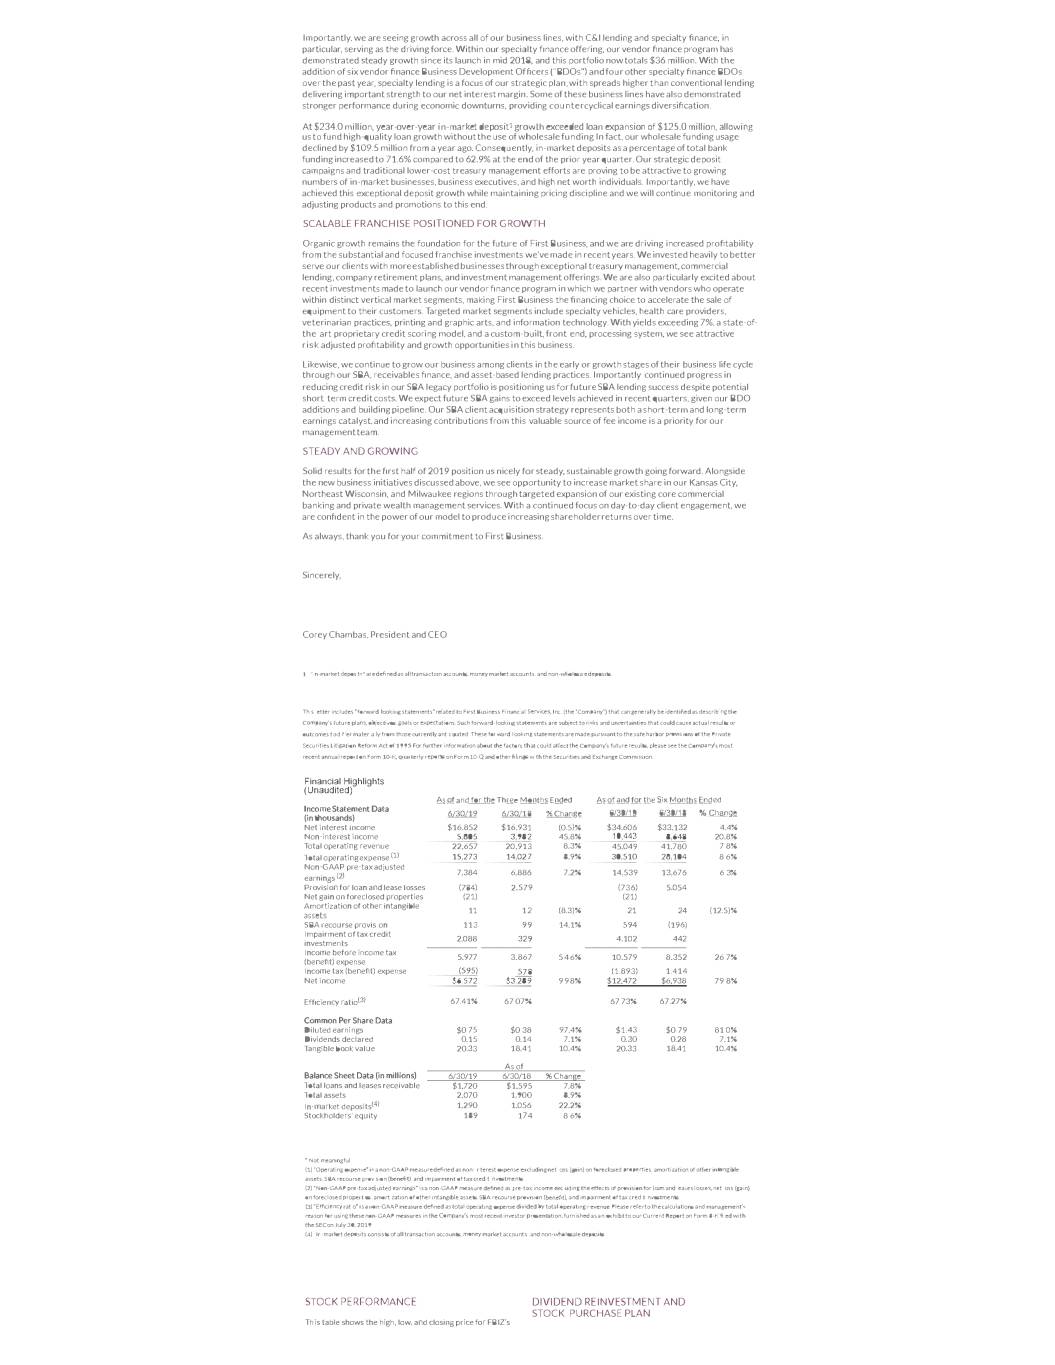
Net income grew to a record $6.6 million, doubling our profit from the year-ago quarter and increasing more than 11% from the linked quarter. Record diluted earnings per common share totaled $0.75, compared to $0.67 and $0.38 for the linked and prior year quarters, respectively.
Including an atypical loan loss provision benefit during the second quarter, First Business produced a return on average assets of 1.30%, exceeding 1.20% reported for the linked quarter and replacing it as the second highest quarterly rate in our history, and the highest in 15 years. Similarly, our return on average equity reached 14.09%, the highest quarterly level in over seven years. Both profitability metrics exceeded our respective long-term targets of 1.15% and 13.50%. While credit costs are likely to increase to more normalized levels, we are pleased with our outstanding bottom line results and encouraged by the underlying trends supporting our long-term core earnings potential.
OPERATING LEVERAGE
Our core earnings strength was evident in the second quarter’s positive operating leverage, which is a key measure of the success of our investments in talent and infrastructure in recent years and a key focus for our management team going forward. On both a dollar and a percentage basis, operating revenue growth exceeded operating expense growth for the second quarter of 2019 compared to the linked first quarter of 2019. Compared to the second quarter of 2018, operating revenue grew by $1.7 million, or 8.3%, compared to operating expense growth of just $1.2 million, or 8.9%.
For the second quarter, top line revenue — the sum of net interest income and non-interest income — totaled a record $22.7 million, compared to $22.4 million in the linked quarter and $20.9 million in the second quarter of 2018. Balance sheet growth, margin management, and fee revenue diversification supported this increase. Strong trust and investment service fees and fee income related to commercial loan interest rate swap transactions drove an increase in non-interest income to $5.8 million, or 25.6% of total revenue, up from $4.6 million, or 20.7%, in the linked quarter and $4.0 million, or 19.0%, in the prior year quarter. This is an important accomplishment, and the first quarter we achieved our stated goal of 25% of revenue coming from fee income sources. Net interest income declined compared to the linked and prior year quarters due to a decrease in loan fees collected in lieu of interest and slight net interest margin compression. Excluding fees collected in lieu of interest, net interest income increased 1.0% compared to the linked quarter and 1.2% compared to the second quarter of 2018, on the strength of solid loan production and increased average loan and lease balances. Despite recent margin pressure, we believe the combination of our diversified earning asset base and disciplined loan and deposit pricing will allow us to maintain a net interest margin at or above our long-term target of 3.50%, including fees in lieu of interest.
The stabilization of our expense base is also an important driver of this success. Over the long-term, we aim to maintain year-over-year operating expense growth at a level below the 10% target for top line revenue, allowing us to drive our efficiency ratio down to our long-term target range of 58-62%.
REDUCTION IN CREDIT COSTS AUGMENT CORE PERFORMANCE
The second quarter's solid core performance was boosted by low credit costs resulting from positive asset quality.
We have been extremely focused on actively working out our legacy SBA portfolio while also adding high-quality new production, and our success is reflected in asset quality improvement and a moderation in loan and lease losses in recent periods. During the second quarter, we recognized a loan loss provision benefit — an item which is normally a meaningful expense — totaling $784,000, compared to expense of $49,000 for the linked quarter and $2.6 million for the second quarter of 2018. The decrease was driven by a reduction in specific reserves due to improved collateral values, along with an overall reduction in the historic loss rates used to determine our reserve levels. Our efforts to both manage problem legacy credits and enhance our origination and underwriting processes are paying off, as is demonstrated by our improved loss rates. We recognized net recoveries of $154,000 in the second quarter of 2019, compared to net charge-offs of $25,000 in the linked quarter and $285,000 in the second quarter of 2018. Our success in delivering substantial loan growth in recent periods has driven a partially offsetting increase in general provision.
We do, however, expect continued volatility in the legacy SBA portfolio, even as it diminishes in size and the potential for losses become less frequent and severe. During the second quarter, we repurchased a net $2.5 million in sold legacy SBA loans previously identified as impaired, increasing our non-performing assets to $28.5 million, or 1.38% of total assets, compared to $26.1 million, or 1.30% of total assets at the end of the linked quarter. Even with the legacy SBA repurchase — which we do periodically to allow more time and flexibility to work out these loans — non-performing assets declined by more than 12% from $32.6 million, or 1.71% of total assets, at the end of the second quarter of 2018.
RELATIONSHIP-BASED TAX CREDITS CONTRIBUTE TO EARNINGS
We regularly pursue opportunities to support local federal historic tax credit investment projects, which provide positive tax benefits once projects are completed and occupancy occurs. Our in-market historic tax credit program contributed $446,000, or $0.05 per share, to second quarter 2019 earnings, on the completion of projects which previously contributed $846,000, or $0.10 per share, in partial recognition in the linked quarter. We intend to continue actively pursuing in-market tax credit opportunities throughout 2019 and beyond. While the timing of when we can earn these tax credits is variable quarter to quarter and year to year, we consider this contribution a core part of our business. These are ongoing client relationships where we are not only the tax credit investor, but also the construction and end lender on the commercial real estate projects.
EXCEPTIONAL BALANCE SHEET GROWTH
We have consistently invested in talent to build a team of experienced, local niche banking experts who attract and retain high-quality clients with whom we develop long-term relationships. Our success is evident in the meaningful growth of our balance sheet over the past year. Loan commitments, deposit balances, treasury management services, and private wealth management relationships have all risen commensurately with our headcount.
Period end loans and leases expanded by 15.3%, annualized, during the second quarter to a record $1.720 billion, and grew 7.8% from June 30, 2018. This marked our seventh consecutive quarter of record loan balances. Year-over-year loan growth has ranged from 5.6% to 9.4% over the last six quarters, presenting what we believe to be a solid indicator of our ability to produce high single-digit loan growth for full year 2019 and beyond.
Importantly, we are seeing growth across all of our business lines, with C&I lending and specialty finance, in particular, serving as the driving force. Within our specialty finance offering, our vendor finance program has demonstrated steady growth since its launch in mid 2018, and this portfolio now totals $36 million. With the addition of six vendor finance Business Development Officers ("BDOs") and four other specialty finance BDOs over the past year, specialty lending is a focus of our strategic plan, with spreads higher than conventional lending delivering important strength to our net interest margin. Some on these business lines have also demonstrated stronger performance during economic downturns, providing counter-cyclical earnings diversification.
At $234.0 million, year-over-year in-market deposit1 growth exceeded loan expansion of $125.0 million, allowing us to fund high-quality loan growth without the use of wholesale funding. In fact, our wholesale funding usage declined by $109.5 million from a year ago. Consequently, in-market deposits as a percentage of total bank funding increased to 71.6% compared to 62.9% at the end of the prior year quarter. Our strategic deposit campaigns and traditional lower-cost treasury management efforts are proving to be attractive to growing numbers of in-market businesses, business executives, and high net worth individuals. Importantly, we have achieved this exceptional deposit growth while maintaining pricing discipline and we will continue monitoring and adjusting products and promotions to this end.
SCALABLE FRANCHISE POSITIONED FOR GROWTH
Organic growth remains the foundation for the future of First Business, and we are driving increased profitability from the substantial and focused franchise investments we’ve made in recent years. We invested heavily to better serve our clients with more established businesses through exceptional treasury management, commercial lending, company retirement plans, and investment management offerings. We are also particularly excited about recent investments made to launch our vendor finance program in which we partner with vendors who operate within distinct vertical market segments, making First Business the financing choice to accelerate the sale of equipment to their customers. Targeted market segments include specialty vehicles, health care providers, veterinarian practices, printing and graphic arts, and information technology. With yields exceeding 7%, a state-of-the-art proprietary credit scoring model, and a custom-built, front-end, processing system, we see attractive risk-adjusted profitability and growth opportunities in this business.
Likewise, we continue to grow our business among clients in the early or growth stages of their business life cycle through our SBA, receivables finance, and asset-based lending practices. Importantly, continued progress in reducing credit risk in our SBA legacy portfolio is positioning us for future SBA lending success despite potential short-term credit costs. We expect future SBA gains to exceed levels achieved in recent quarters, given our BDO additions and building pipeline. Our SBA client acquisition strategy represents both a short-term and long-term earnings catalyst, and increasing contributions from this valuable source of fee income is a priority for our management team.
STEADY AND GROWING
Solid results for the first half of 2019 position us nicely for steady, sustainable growth going forward. Alongside the new business initiatives discussed above, we see opportunity to increase market share in our Kansas City, Northeast Wisconsin, and Milwaukee regions through targeted expansion of our existing core commercial banking and private wealth management services. With a continued focus on day-to-day client engagement, we are confident in the power of our model to produce increasing shareholder returns over time.
As always, thank you for your commitment to First Business.
Sincerely,
Corey Chambas, President and CEO
| |
| 1. | "In-market deposits" are defined as all transaction accounts, money market accounts, and non-wholesale deposits. |
This letter includes “forward-looking statements” related to First Business Financial Services, Inc. (the “Company”) that can generally be identified as describing the Company’s future plans, objectives, goals or expectations. Such forward-looking statements are subject to risks and uncertainties that could cause actual results or outcomes to differ materially from those currently anticipated. These forward-looking statements are made pursuant to the safe harbor provisions of the Private Securities Litigation Reform Act of 1995. For further information about the factors that could affect the Company’s future results, please see the Company’s most recent annual report on Form 10-K, quarterly reports on Form 10-Q and other filings with the Securities and Exchange Commission.