Investor Presentation Second Quarter 2022 Nasdaq: FBIZ

When used in this presentation, and in any other oral statements made with the approval of an authorized executive officer, the words or phrases “may,” “could,” “should,” “hope,” “might,” “believe,” “expect,” “plan,” “assume,” “intend,” “estimate,” “anticipate,” “project,” “likely,” or similar expressions are intended to identify “forward-looking statements” within the meaning of such term in the Private Securities Litigation Reform Act of 1995. Such statements are subject to risks and uncertainties, including among other things: (i) Adverse changes in the economy or business conditions, either nationally or in our markets, including, without limitation, inflation, supply chain issues, labor shortages, and the adverse effects of the COVID-19 pandemic on the global, national, and local economy, which may affect the Corporation’s credit quality, revenue, and business operations; (ii) Competitive pressures among depository and other financial institutions nationally and in our markets; (iii) Increases in defaults by borrowers and other delinquencies; (iv) Our ability to manage growth effectively, including the successful expansion of our client support, administrative infrastructure, and internal management systems; (v) Fluctuations in interest rates and market prices; (vi) The consequences of continued bank acquisitions and mergers in our markets, resulting in fewer but much larger and financially stronger competitors; (vii) Changes in legislative or regulatory requirements applicable to us and our subsidiaries; (viiii) Changes in tax requirements, including tax rate changes, new tax laws, and revised tax law interpretations; (ix) Fraud, including client and system failure or breaches of our network security, including our internet banking activities; and (x) Failure to comply with the applicable SBA regulations in order to maintain the eligibility of the guaranteed portions of SBA loans. These risks could cause actual results to differ materially from what FBIZ has anticipated or projected. These risks could cause actual results to differ materially from what we have anticipated or projected. These risk factors and uncertainties should be carefully considered by our shareholders and potential investors. For further information about the factors that could affect the Corporation’s future results, please see the Corporation’s annual report on Form 10-K for the year ended December 31, 2021 and other filings with the Securities and Exchange Commission. Investors should not place undue reliance on any such forward-looking statement, which speaks only as of the date on which it was made. The factors described within the filings could affect our financial performance and could cause actual results for future periods to differ materially from any opinions or statements expressed with respect to future periods. Where any such forward-looking statement includes a statement of the assumptions or bases underlying such forward-looking statement, FBIZ cautions that, while its management believes such assumptions or bases are reasonable and are made in good faith, assumed facts or bases can vary from actual results, and the differences between assumed facts or bases and actual results can be material, depending on the circumstances. Where, in any forward-looking statement, an expectation or belief is expressed as to future results, such expectation or belief is expressed in good faith and believed to have a reasonable basis, but there can be no assurance that the statement of expectation or belief will be achieved or accomplished. FBIZ does not intend to, and specifically disclaims any obligation to, update any forward-looking statements. Forward-Looking Statements

Table of Contents Company Overview ....................................................................... 4 Quarterly Update .......................................................................... 9 Why FBIZ? ...................................................................................... 14 Appendix ........................................................................................ 22 Strategic Plan .............................................................................. 23 Commercial Banking Business Lines ........................................... 26 Non-GAAP Reconciliations .......................................................... 36

COMPANY OVERVIEW
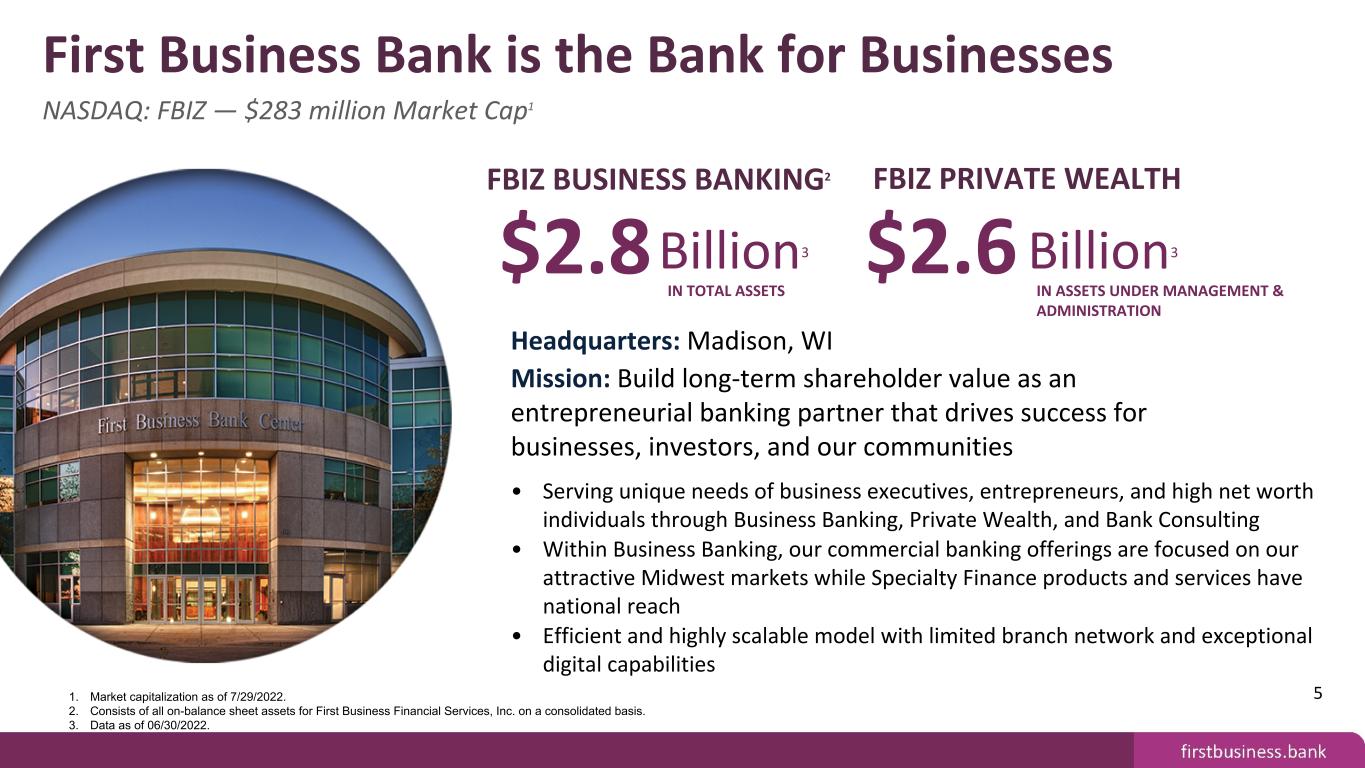
• Serving unique needs of business executives, entrepreneurs, and high net worth individuals through Business Banking, Private Wealth, and Bank Consulting • Within Business Banking, our commercial banking offerings are focused on our attractive Midwest markets while Specialty Finance products and services have national reach • Efficient and highly scalable model with limited branch network and exceptional digital capabilities Headquarters: Madison, WI Mission: Build long-term shareholder value as an entrepreneurial banking partner that drives success for businesses, investors, and our communities FBIZ BUSINESS BANKING2 $2.8 Billion3 FBIZ PRIVATE WEALTH $2.6 Billion3 IN ASSETS UNDER MANAGEMENT & ADMINISTRATION 1. Market capitalization as of 7/29/2022. 2. Consists of all on-balance sheet assets for First Business Financial Services, Inc. on a consolidated basis. 3. Data as of 06/30/2022. 5 IN TOTAL ASSETS First Business Bank is the Bank for Businesses NASDAQ: FBIZ — $283 million Market Cap1
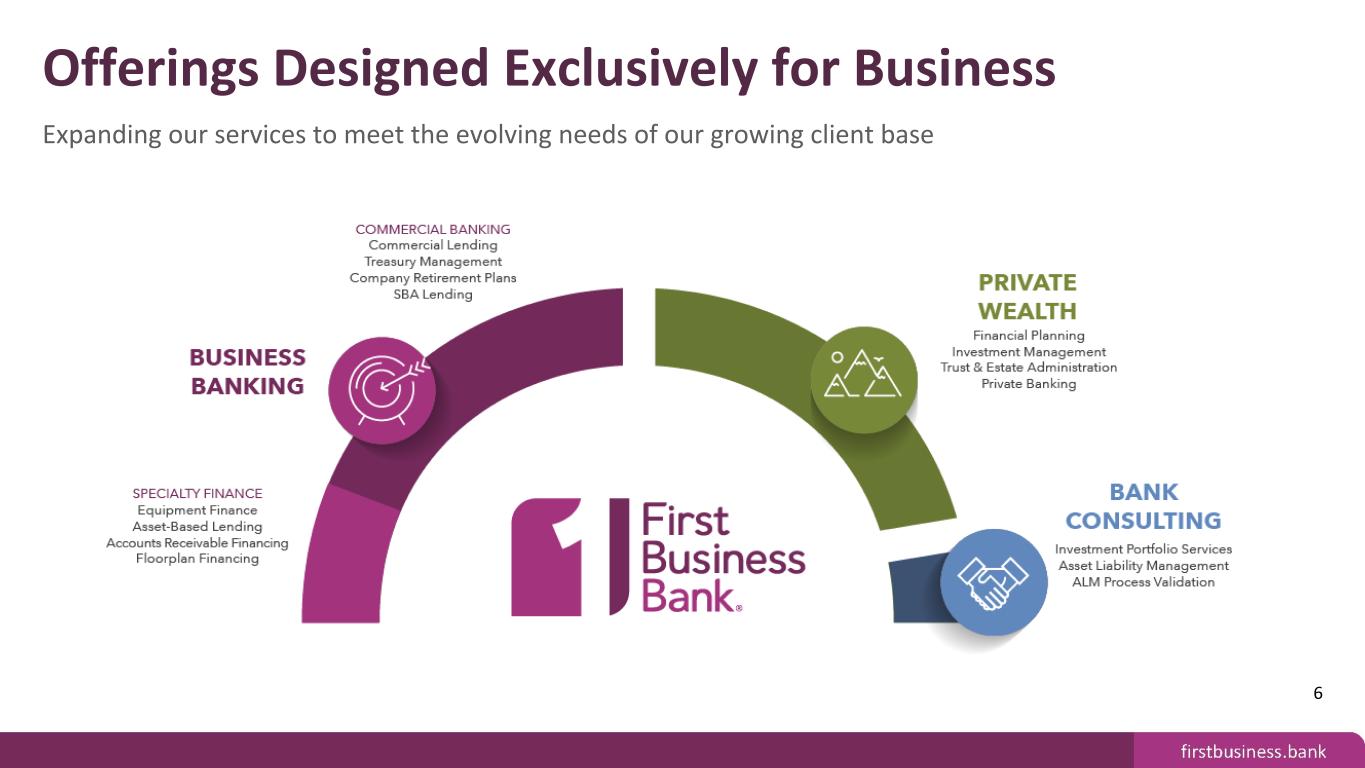
6 Offerings Designed Exclusively for Business Expanding our services to meet the evolving needs of our growing client base

7 ESG Framework Environmental, social, and governance practices are integrated into our core business strategy • • • • Branch-lite model with only one location in each of the banking markets we serve • Support hybrid and remote work options to reduce carbon emissions related to commuting (even prior to COVID) • Reduced paper usage via implementation of Docusign • Minimal technology eco-footprint by continued use of state-of-the art technology to minimize power consumption • Received the 2022 top workplaces USA award • CEO performance goals include furthering DEI and ESG initiatives • Increased advisory board diversity (to over 40%) to enhance our business development efforts with a diverse client base in all markets • Provide all employees with 8 hours of paid time to support volunteer efforts and give back to their communities in a meaningful way of their choosing • Corporate Governance and Nominating Committee monitors key risks related to the governance structure, ESG, and the effectiveness of the strategies outlined in the Board DEI Policy. • Commitment to board diversity – 30% female and 10% ethnic or racial directors and 50% of standing committees chaired by female directors. • 90% director independence, and 100% committee membership independence • Code of business conduct and ethics applying to directors and employees reviewed and approved by the board annually

Superior Client Satisfaction Rating Net promoter score results speak for themselves 8 *NPS benchmarks reported in “The State of B2B Account Experience: B2B NPS & CX Benchmarking Report,” CustomerGauge, 2021 NPS benchmarks reported in “The State of B2B Account Experience: B2B NPS & CX Benchmarking Report,” CustomerGauge, 2021. **First Business Bank Annual Client Survey conducted by Dr. Moses Altsech, May/June 2022. Note: Net promoter score assesses likelihood to recommend on an 11-point scale, where detractors (scores 0-6) are subtracted from promoters (scores 9-10), while passives (scores 7-8) are not considered. The score ranges from -100 to +100. Striving for Continuous Improvement • Net Promoter Score is the most widely used measure of likelihood to recommend a company to others • Anonymous survey conducted annually by a third party to assess client satisfaction • Allows us to compare our performance against other leading financial institutions

QUARTERLY UPDATE

Profitability & Growth • Robust Profitability Metrics - Excluding the impact of PPP loans, pre-tax, pre-provision adjusted ("PTPP") return on average assets increased to 1.57% in the second quarter, compared to 1.15% in the prior year quarter as revenue growth of 21.9% outpaced operating expense growth. • Increased Organic Loan Production - Loans, excluding PPP loans, grew $48.9 million, or 8.8% annualized, from the first quarter of 2022 and $259.1 million, or 12.8% from the prior year quarter, as investments in both conventional and specialized lending continue to generate positive results. • Record Net Interest Income - Loan growth, rising rates on variable-rate loans, and low deposit betas all contributed to margin expansion of 32 and 22 basis points (10 basis points was due to non-accrual interest recovery) compared to the linked and prior year quarters, respectively and resulted in record net interest income of $23.7 million. • Compounding Tangible Book Value Growth - Demonstrated earnings power and diligent credit management more than offset interest-rate-driven market value decline in the investment portfolio and resulted in a 9.4% annualized increase and 9.7% increase in tangible book value compared to the linked and prior year quarters, respectively. Credit • Exceptional Asset Quality Metrics - Non-performing assets ("NPA") declined to $5.7 million, or 0.21% of total assets, improving from 0.40% of total assets on June 30, 2021. • Loan Loss Provision Benefit - Net recovery of $4.1 million on a legacy SBA relationship led to a provision benefit of $3.7 million, compared to a benefit of $855,000 and $1.0 million in the first quarter and prior year quarter, respectively. 10 Second Quarter 2022 Highlights Strong top line revenue and provision benefit lead to record net income and tangible book value growth
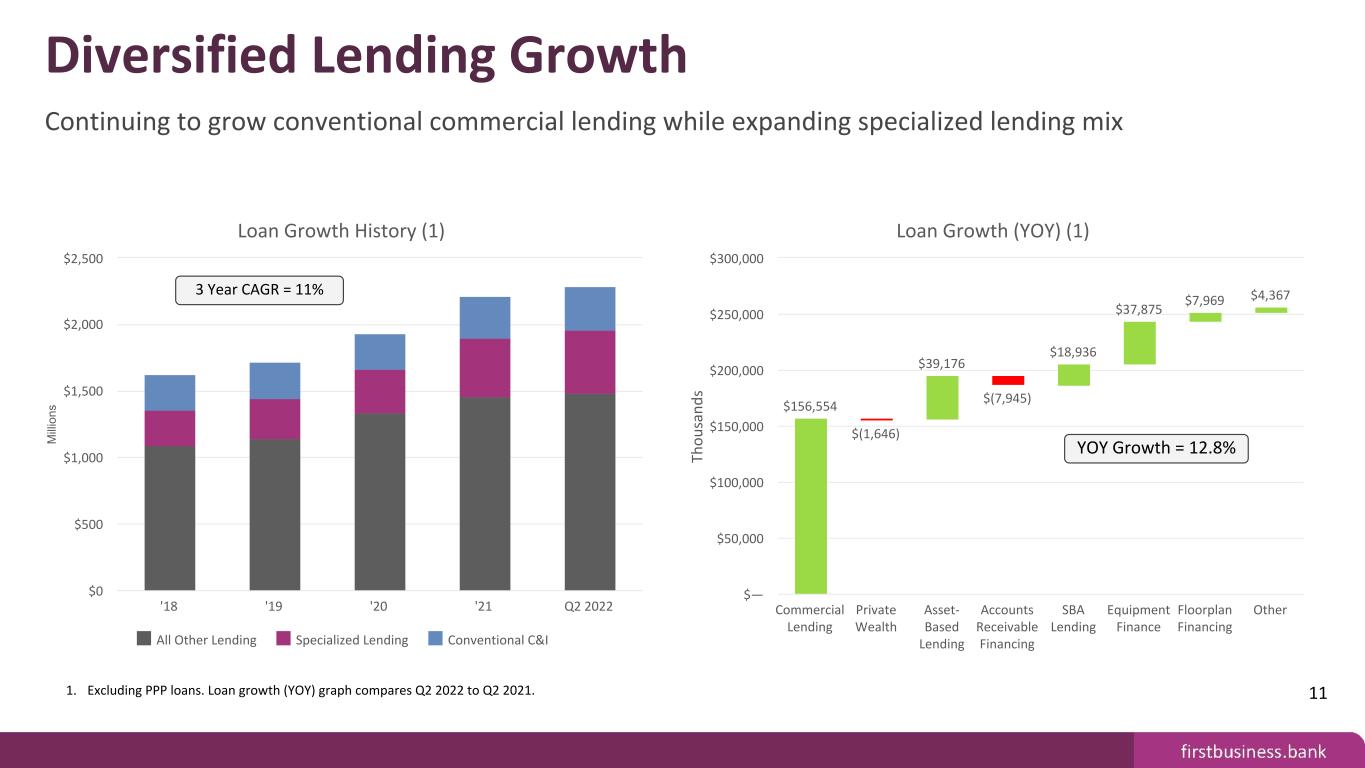
Diversified Lending Growth Continuing to grow conventional commercial lending while expanding specialized lending mix 11 Th ou sa nd s Net Loan Growth Q4 2021 $82,268 $1,739 $20,236 $18,844 $11,304 $10,884 $6,167 $1,819 Commercial Lending Private Wealth Asset- Based Lending Accounts Receivable Financing SBA Lending Equipment Finance Floorplan Financing Other $— $25,000 $50,000 $75,000 $100,000 $125,000 $150,000 $175,000 Net Deposit Growth $52,399 $(49,768) $53,062 $(1,682) DDA IB DDA MMA CD $— $10,000 $20,000 $30,000 $40,000 $50,000 $60,000 Specialized Lending Mix % of Total Loans Long-Term Goal 3Q20 4Q20 1Q21 2Q21 3Q21 10% 15% 20% 25% 30% 1. Specialized Lending includes Asset-Based Lending, Accounts Receivable Financing, SBA Lending, Vendor Finance, and Floorplan Financing. Th ou sa nd s Loan Growth (YOY) (1) $156,554 $(1,646) $39,176 $(7,945) $18,936 $37,875 $7,969 $4,367 Commercial Lending Private Wealth Asset- Based Lending Accounts Receivable Financing SBA Lending Equipment Finance Floorplan Financing Other $— $50,000 $100,000 $150,000 $200,000 $250,000 $300,000 M ill io ns Loan Growth History (1) All Other Lending Specialized Lending Conventional C&I '18 '19 '20 '21 Q2 2022 $0 $500 $1,000 $1,500 $2,000 $2,500 1. Excluding PPP loans. Loan growth (YOY) graph compares Q2 2022 to Q2 2021. YOY Growth = 12.8% 3 Year CAGR = 11%

Robust Profitability Metrics Net Interest Margin Expansion and Loan Growth Lead to Robust PTPP Adjusted ROAA Net Interest Margin 3.49% 3.39% 3.71% 3.20% 3.24% 3.45% 0.29% 0.15% 0.26% Adjusted net interest margin (1) Recurring, volatile components (2) Q2 2021 Q1 2022 Q2 2022 12 1. "Adjusted Net Interest Margin" is a non-GAAP measurement. See appendix for non-GAAP reconciliation schedules. 2. "Recurring, volatile components" is defined as fees in lieu of interest, PPP loan interest income, FRB interest income, and FHLB dividend income. 3. "Fees in lieu of interest" (FILOI) is defined as prepayment fees, asset-based loan fees, non-accrual interest, and loan fee amortization. 4. Top line revenue (TLR) excludes the impact of PPP loan fee amortization and interest income. 5. Pre-tax, pre provision return on average assets excludes the impact of PPP loan fee amortization and interest income. Drivers of NIM Change 3.39% 0.01% 0.01% 0.29% 0.09% (0.14)% 0.06% 3.71% 1Q 22 N IM ST In ve st m en ts Se cu rit ie s Lo an s FI LO I ( 3) De po sit s Bo rr ow in gs 2Q 22 N IM NIM, Yields, and Costs 5.55% 3.95% 4.51% 3.73% 3.14% 3.69% 2.40% 1.99% 1.76% 1.42% 0.54% 0.45% Average Loan Yield Net Interest Margin Securities Yield Cost of Funds (5) Q4 2019 Q3 2020 Q4 2020 $ (T ho us an ds ) $24,866 $28,511 $30,307 TLR (4) PTPP ROAA (5) Q2 2021 Q1 2022 Q2 2022 $5,000 $10,000 $15,000 $20,000 $25,000 $30,000 $35,000 1.10% 1.20% 1.30% 1.40% 1.50% 1.60%

Continued Asset Quality Improvement Non-Performing Assets/Total Assets Decline to Lowest Levels Since 2006 13 M ill io ns NPA FBIZ NPA/TA Peer NPA/TA 2Q21 3Q21 4Q21 1Q22 2Q22 $0.0 $2.0 $4.0 $6.0 $8.0 $10.0 $12.0 $14.0 0.08% 0.16% 0.24% 0.32% 0.40% 0.48% 0.56% 0.64% Note: Peer group defined as publicly-traded bank with total assets between $1 billion and $5 billion. M ill io ns SBA Legacy Performing On-Balance Sheet Loans 2017 2018 2019 2020 2021 $0.0 $5.0 $10.0 $15.0 $20.0 $25.0 $30.0 $35.0 $40.0 $45.0 • Non-performing assets declined 51% year over year to $5.7 million, or 0.21% of total assets. • Loan loss provision benefit of $3.7 million in Q2 was primarily due to a $4.1 million recovery on a legacy SBA relationship and highlights our ability to proactively work through challenging loans.

WHY FBIZ?

Note: Peer Group defined as publicly-traded banks with total assets between $1 billion and $5 billion. TSR time period is 06/30/2021 - 06/30/2022. 1. Data as of 7/26/2022. Total Shareholder Return Above Peer Group Median Despite recent outperformance, Price/LTM EPS remains below peers 15 1 Year Total Shareholder Return FBIZ Peer Group Median S&P 500 Russell 2000 (30)% (20)% (10)% —% 10% 20% 30% Price/LTM EPS (1) FBIZ Peer Group Median 0.0 2.0 4.0 6.0 8.0 10.0 FBIZ Investment Profile(1) Closing Price $35.09 52-Week High $35.27 52-Week Low $25.70 Common Shares Outstanding 8,467,955 Price/LTM EPS 8.65% Price/Tangible Book Value 125.68% 50 Day Average Daily Volume 20,693 Annualized Dividend $0.79 Dividend Yield 2.25%
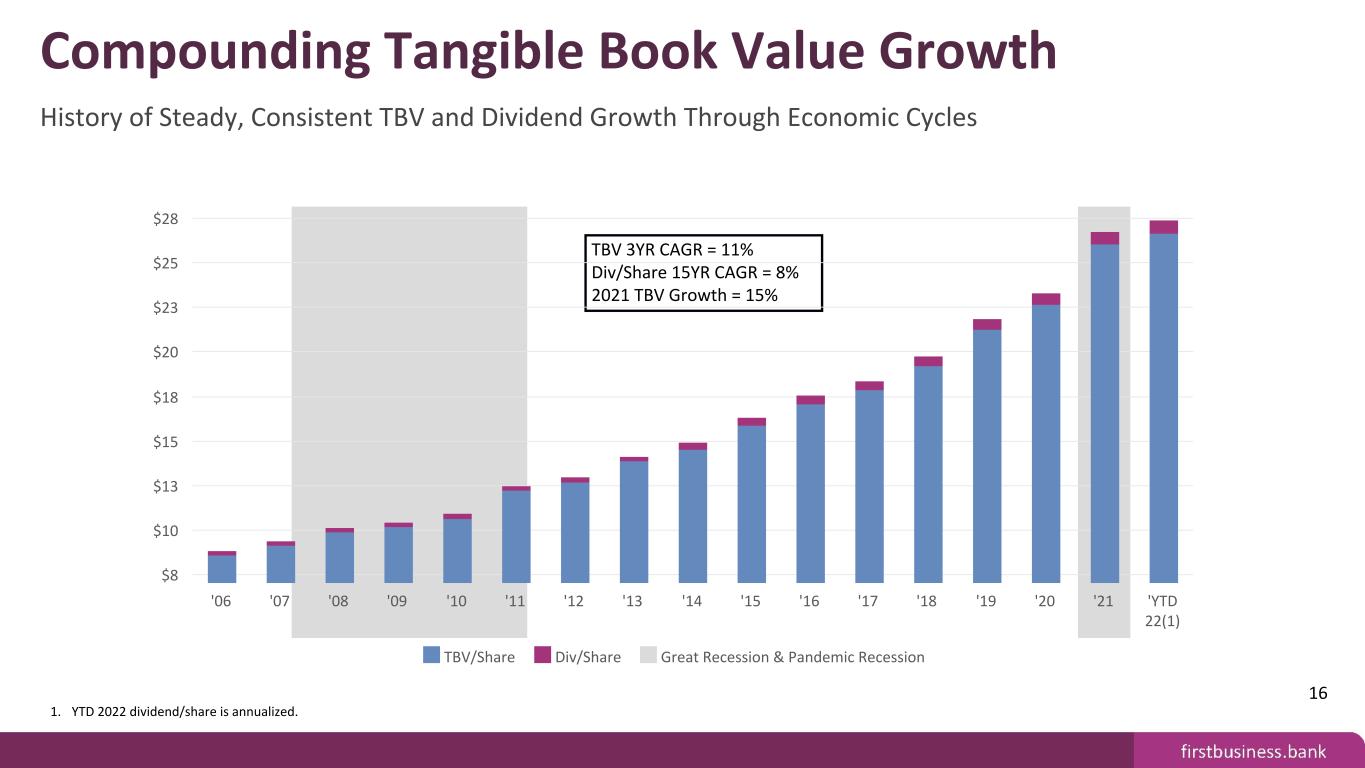
Compounding Tangible Book Value Growth History of Steady, Consistent TBV and Dividend Growth Through Economic Cycles TBV 3YR CAGR = 11% Div/Share 15YR CAGR = 8% 2021 TBV Growth = 15% 16 TBV/Share Div/Share Great Recession & Pandemic Recession '06 '07 '08 '09 '10 '11 '12 '13 '14 '15 '16 '17 '18 '19 '20 '21 'YTD 22(1) $8 $10 $13 $15 $18 $20 $23 $25 $28 1. YTD 2022 dividend/share is annualized.

M ill io ns $28.1 $32.5 $39.1 $41.1 FYE 2018 FYE 2019 FYE 2020 FYE 2021 $0.0 $15.0 $30.0 $45.0 $60.0 $75.0 $90.0 $105.0 $120.0 Key Operating Trends Operating Fundamentals Demonstrate Earnings Power 17 Note: Net interest income is the sum of "Pure Net Interest Income" and "Fees in Lieu of Interest". Non-interest income is the sum of "Trust Fee Income", "Other Fee Income", "Service Charges", "SBA Gains", and "Swap Fees". 1. "Pure Net Interest Income" and "Net Operating Income" are non-GAAP measurements. See appendix for non-GAAP reconciliation schedules. 2. "Net Tax Credits" represent managements estimate of the after-tax contribution related to the investment in tax credits as of the reporting period disclosed. 3. "Fees in Lieu of Interest" is defined as prepayment fees, asset-based loan fees, non-accrual interest, and loan fee amortization. 4. Excludes impact of PPP interest income and loan fee amortization. Net Operating Income 3YR CAGR = 14% M ill io ns $6.9 $10.6 Q2 2021 (4) Q2 2022 (4) $0.0 $5.0 $10.0 $15.0 $20.0 $25.0 $30.0 $35.0
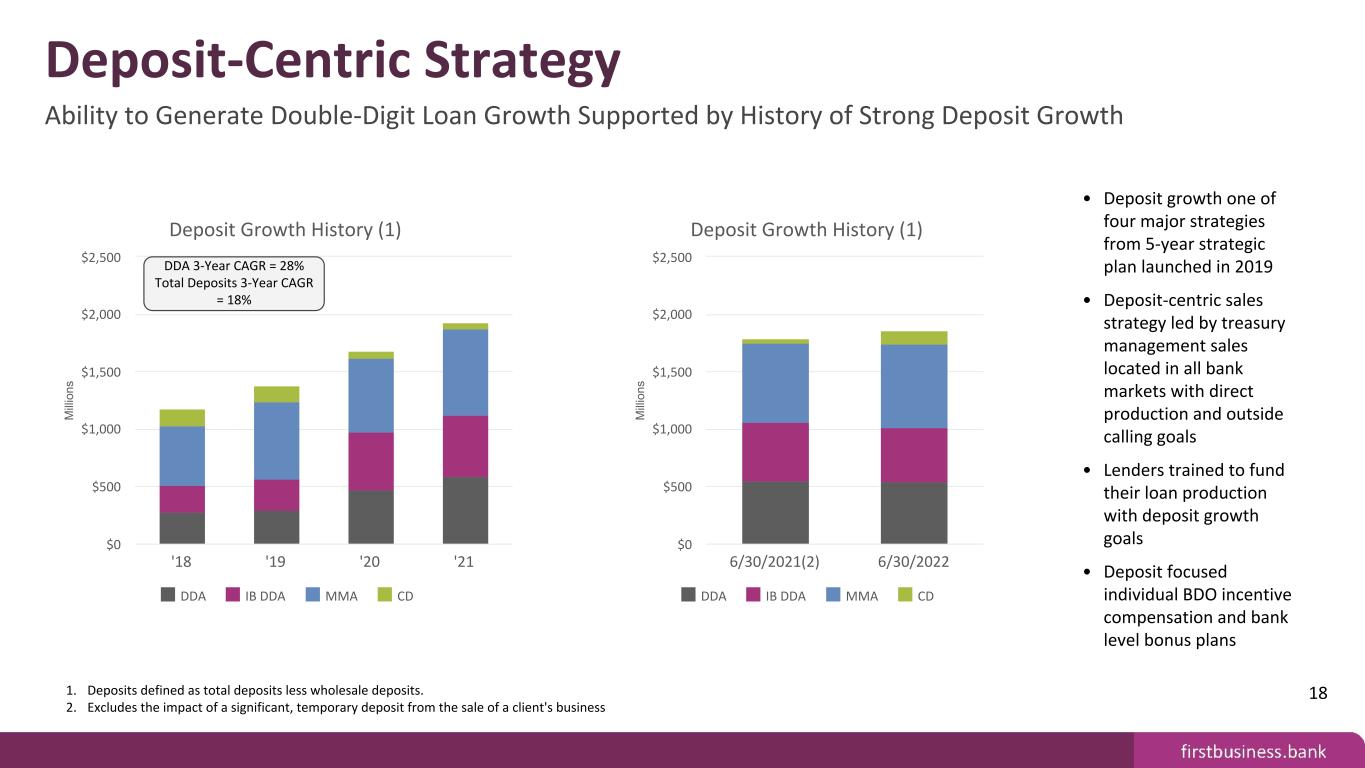
18 Deposit-Centric Strategy Ability to Generate Double-Digit Loan Growth Supported by History of Strong Deposit Growth 1. Deposits defined as total deposits less wholesale deposits. 2. Excludes the impact of a significant, temporary deposit from the sale of a client's business M ill io ns Deposit Growth History (1) DDA IB DDA MMA CD '18 '19 '20 '21 $0 $500 $1,000 $1,500 $2,000 $2,500 • Deposit growth one of four major strategies from 5-year strategic plan launched in 2019 • Deposit-centric sales strategy led by treasury management sales located in all bank markets with direct production and outside calling goals • Lenders trained to fund their loan production with deposit growth goals • Deposit focused individual BDO incentive compensation and bank level bonus plans 5YR CAGR = 11.4% DDA 3-Year CAGR = 28% Total Deposits 3-Year CAGR = 18% M ill io ns Deposit Growth History (1) DDA IB DDA MMA CD 6/30/2021(2) 6/30/2022 $0 $500 $1,000 $1,500 $2,000 $2,500

19 Positive Operating Leverage Ability to grow revenues faster than expenses outpaces peer group Loan vs. Deposit Growth FBIZ Loan Growth(1) FBIZ Deposit Growth(2) '19 '20 '21 0% 5% 10% 15% 20% 25% Note: Peer group defined as publicly-traded bank with total assets between $1 billion and $5 billion. 5YR CAGR = 11.4% $ Operating Leverage FBIZ Peer Group Median 2019 2020 2021 Last Twelve Months $— $2,000 $4,000 $6,000 $8,000 $10,000 • Operating leverage is defined as the growth in operating revenue less the growth in operating expenses. • We believe our focus on strategic initiatives directed toward revenue growth and operating efficiency through use of technology will continue to generate positive annual operating leverage. • Initiatives include: ◦ Expanding higher-yielding specialized lending business lines. ◦ Increasing our commercial banking market share outside of Madison. ◦ Scaling our private wealth management business in our less mature commercial banking markets.
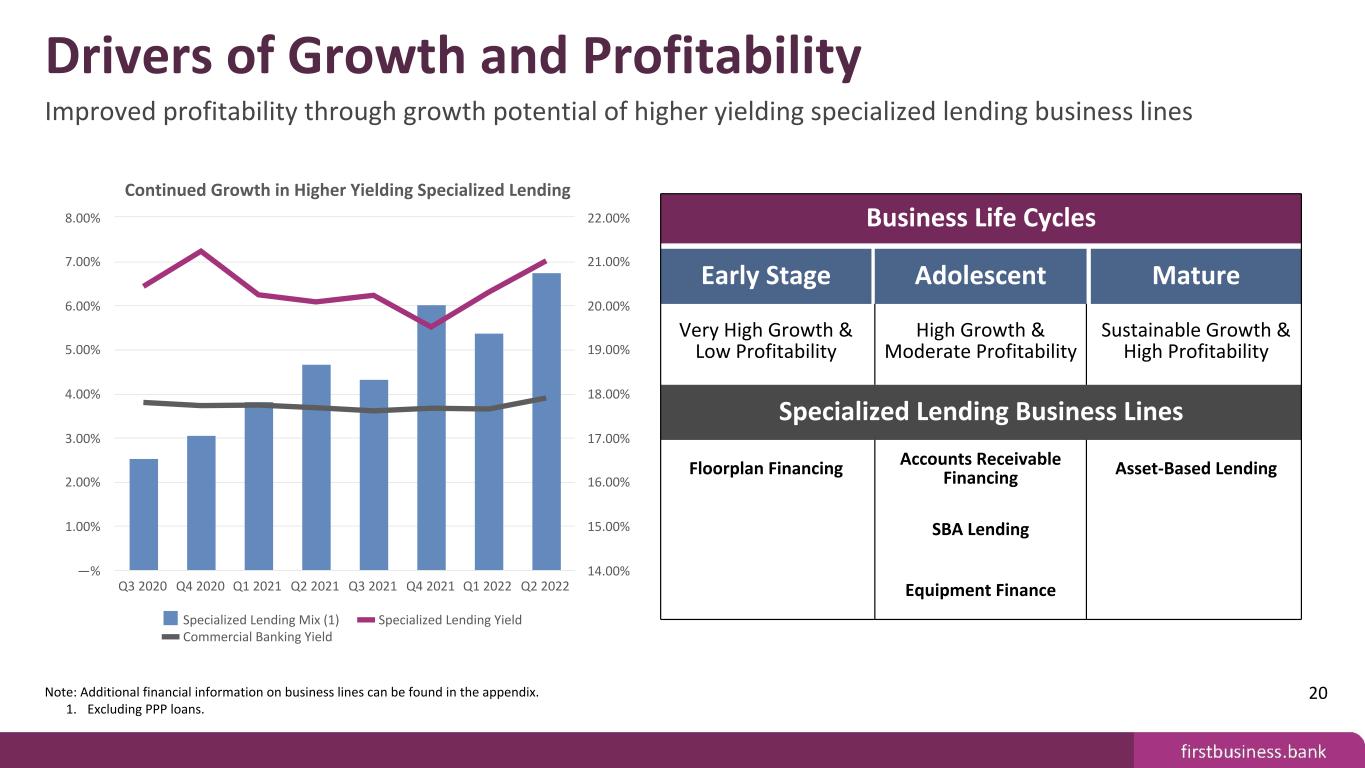
Drivers of Growth and Profitability Improved profitability through growth potential of higher yielding specialized lending business lines Note: Additional financial information on business lines can be found in the appendix. 1. Excluding PPP loans. 20 Business Life Cycles Early Stage Adolescent Mature Very High Growth & Low Profitability High Growth & Moderate Profitability Sustainable Growth & High Profitability Commercial Business Lines (1) Bank Consulting Accounts Receivable Financing Business Banking • YOY AUA2 growth = $273 million or 19% • YOY NFE3 growth = $20.8 million or 56% • YOY loan growth = $133.5 million or 8% Floorplan Financing SBA Lending Asset-Based Lending • YOY loan growth = $28.6 million or 156% • YTD gain on sale increase = $1.1 million or 39% • YOY loan increase = $44.2 million or 38% Vendor Financing Private Wealth • YOY loan growth = $28.6 million or 37% • YTD fee income growth = $2.2 million or 25% Average Loan Yield Specialized Lending Commercial Banking Q3 2020 Q4 2020 Q1 2021 Q2 2021 Q3 2021 Q4 2021 3.00% 3.50% 4.00% 4.50% 5.00% 5.50% 6.00% 6.50% 7.00% 7.50% Continued Growth in Higher Yielding Specialized Lending Specialized Lending Mix (1) Specialized Lending Yield Commercial Banking Yield Q3 2020 Q4 2020 Q1 2021 Q2 2021 Q3 2021 Q4 2021 Q1 2022 Q2 2022 —% 1.00% 2.00% 3.00% 4.00% 5.00% 6.00% 7.00% 8.00% 14.00% 15.00% 16.00% 17.00% 18.00% 19.00% 20.00% 21.00% 22.00% Q4 drop in specialized lending yield mainly due to a reduction in fees in lieu of interest for Asset-Based Lending Business Life Cycles Early Stage Adolescent Mature Very High Growth & Low Profitability High Growth & Moderate Profitability Sustainable Growth & High Profitability Specialized Lending Business Lines Floorplan Financing Accounts Receivable Financing Asset-Based Lending SBA Lending Equipment Finance

Price to Tangible Book Value Historically traded at a premium to peer group Note: Peer Group defined as publicly-traded banks with total assets between $1 billion and $5 billion. 21
APPENDIX SUPPLEMENTAL DATA & NON-GAAP RECONCILIATIONS

APPENDIX Strategic Plan

FBIZ Strategic Plan 2019-2023 4 Strategies Designed to Navigate the Company over a 5-Year Time Horizon 24
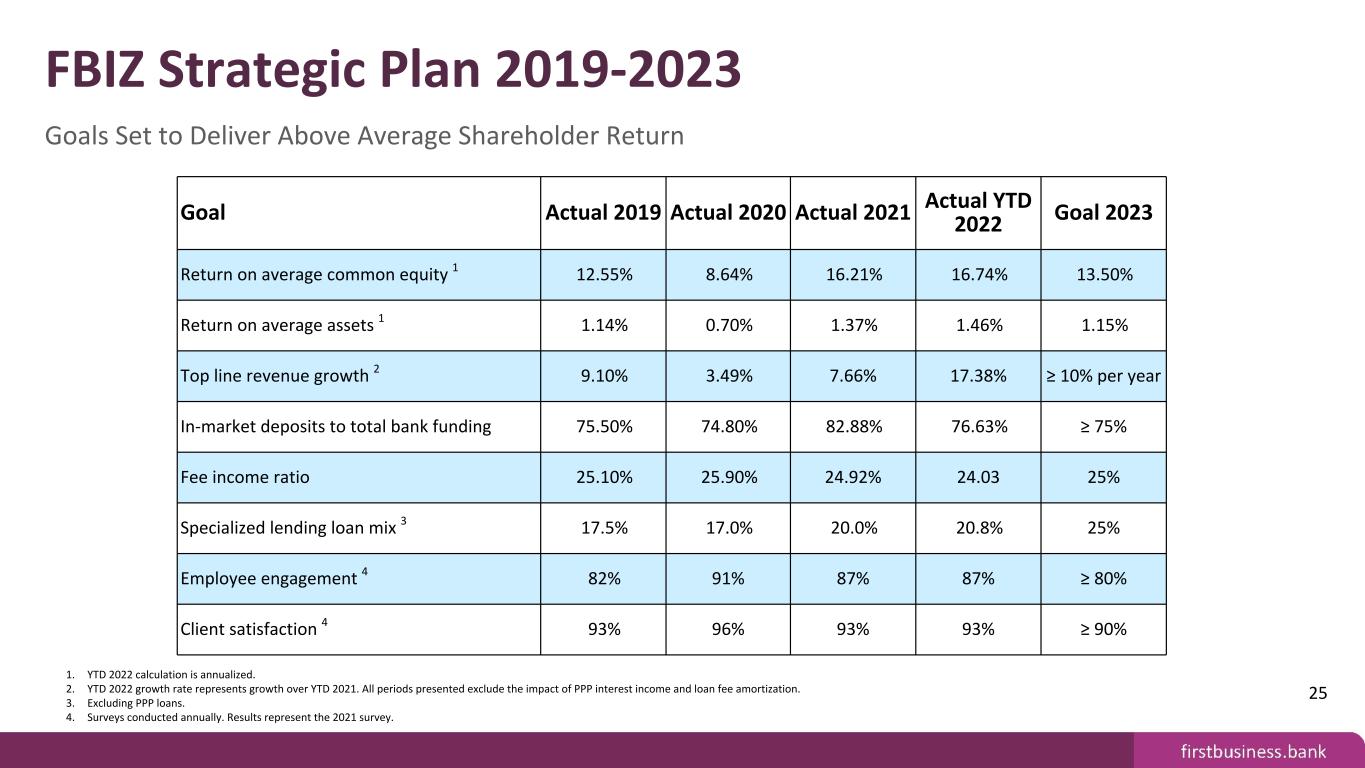
FBIZ Strategic Plan 2019-2023 Goals Set to Deliver Above Average Shareholder Return 25 Goal Actual 2019 Actual 2020 Actual 2021 Actual YTD 2022 Goal 2023 Return on average common equity 1 12.55% 8.64% 16.21% 16.74% 13.50% Return on average assets 1 1.14% 0.70% 1.37% 1.46% 1.15% Top line revenue growth 2 9.10% 3.49% 7.66% 17.38% ≥ 10% per year In-market deposits to total bank funding 75.50% 74.80% 82.88% 76.63% ≥ 75% Fee income ratio 25.10% 25.90% 24.92% 24.03 25% Specialized lending loan mix 3 17.5% 17.0% 20.0% 20.8% 25% Employee engagement 4 82% 91% 87% 87% ≥ 80% Client satisfaction 4 93% 96% 93% 93% ≥ 90% 1. YTD 2022 calculation is annualized. 2. YTD 2022 growth rate represents growth over YTD 2021. All periods presented exclude the impact of PPP interest income and loan fee amortization. 3. Excluding PPP loans. 4. Surveys conducted annually. Results represent the 2021 survey.
APPENDIX Commercial Banking Products & Services

Product Profile • Target small to medium-sized companies in our Wisconsin, Kansas, and Missouri markets • Lines of credit and term loans focused on businesses with annual sales of up to $75.0 million Technology Initiatives • Deploying client portal that enables easy and secure communications and document exchanges • Working to migrate to a more efficient commercial underwriting solution M ill io ns Portfolio Analysis CRE NOO Other C&I CRE OO Average Yield 2Q21 3Q21 4Q21 1Q22 2Q22 $0 $500 $1,000 $1,500 $2,000 3.00% 3.25% 3.50% 3.75% 4.00% M ill io ns Gross Revenue Interest Income Fee Income 2Q21 3Q21 4Q21 1Q22 2Q22 $0 $5 $10 $15 $20 $25 Note: Loan balances exclude PPP loans and represent quarterly average data. 27 Commercial Lending Superior Talent with Business Expertise Building Relationships in Midwest Geographic Footprint

Product Profile • Target small to medium-sized companies in our Wisconsin, Kansas, and Missouri markets • Comprehensive services for commercial clients to manage their cash and liquidity, including lockbox, accounts receivable collection services, electronic payment solutions, fraud protection, information reporting, reconciliation, and data integration solutions Technology Initiative • Implemented a solution that auto-archives treasury management documentation which has immediately generated labor savings M ill io ns Funding Mix Non-Transaction Accounts Transaction Accounts Bank Wholesale Funding Cost of Funds 2Q21 3Q21 4Q21 1Q22 2Q22 $0 $800 $1,600 $2,400 $3,200 0.00% 0.10% 0.20% 0.30% 0.40% 0.50% M ill io ns Fee Revenue 2Q21 3Q21 4Q21 1Q22 2Q22 $0.6 $0.8 $1 $1.2 $1.4 Note: Funding mix represents quarterly average balance data. Transaction Accounts include interest-bearing DDA, non-interest-bearing DDA and NOW accounts. Bank Wholesale Funding includes brokered deposits, deposits gathered through internet listing services and FHLB advances. Non-Transaction Accounts includes in-market CDs and money market accounts. "Cost of Funds" is a non-GAAP measure. See appendix for non-GAAP reconciliation schedules. 28 Treasury Management Superior Talent with Business Expertise Building Relationships in Midwest Geographic Footprint
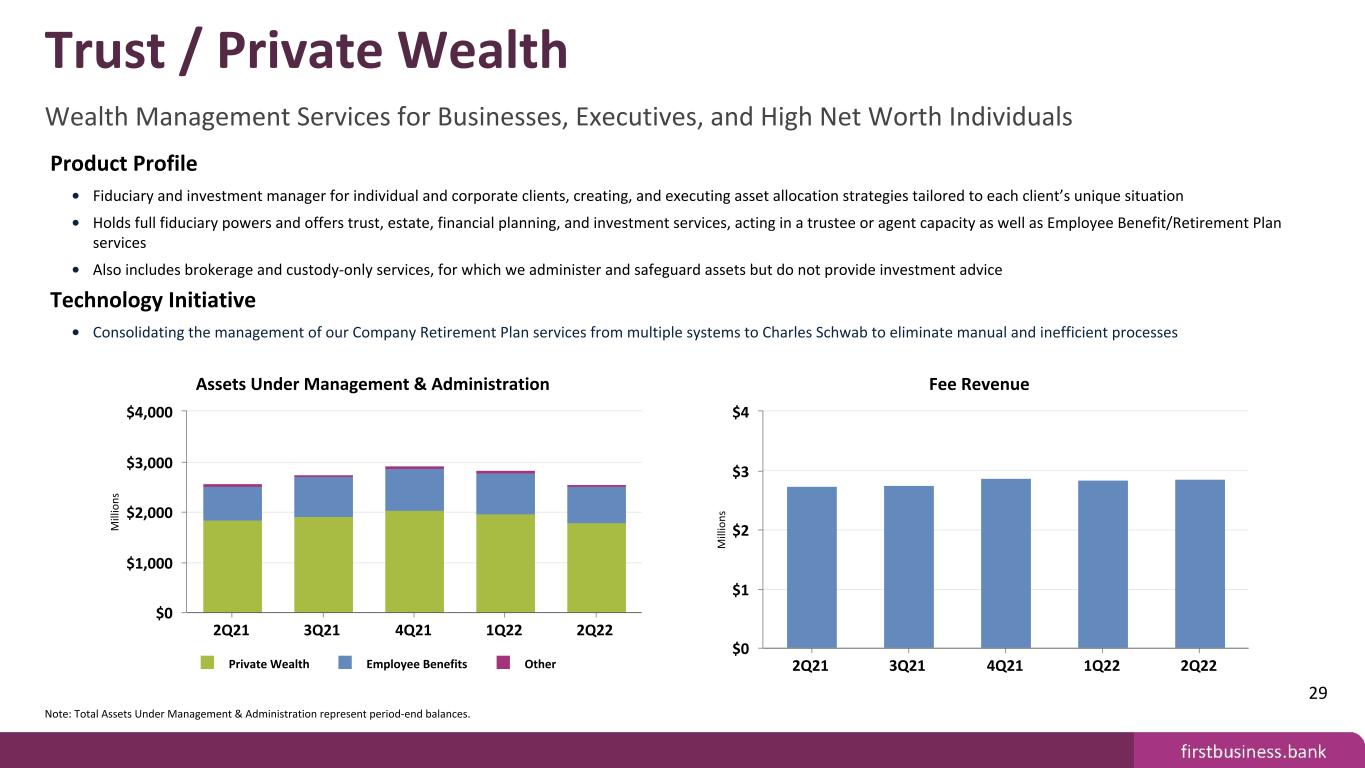
Product Profile • Fiduciary and investment manager for individual and corporate clients, creating, and executing asset allocation strategies tailored to each client’s unique situation • Holds full fiduciary powers and offers trust, estate, financial planning, and investment services, acting in a trustee or agent capacity as well as Employee Benefit/Retirement Plan services • Also includes brokerage and custody-only services, for which we administer and safeguard assets but do not provide investment advice Technology Initiative • Consolidating the management of our Company Retirement Plan services from multiple systems to Charles Schwab to eliminate manual and inefficient processes M ill io ns Assets Under Management & Administration Private Wealth Employee Benefits Other 2Q21 3Q21 4Q21 1Q22 2Q22 $0 $1,000 $2,000 $3,000 $4,000 M ill io ns Fee Revenue 2Q21 3Q21 4Q21 1Q22 2Q22 $0 $1 $2 $3 $4 Note: Total Assets Under Management & Administration represent period-end balances. 29 Trust / Private Wealth Wealth Management Services for Businesses, Executives, and High Net Worth Individuals
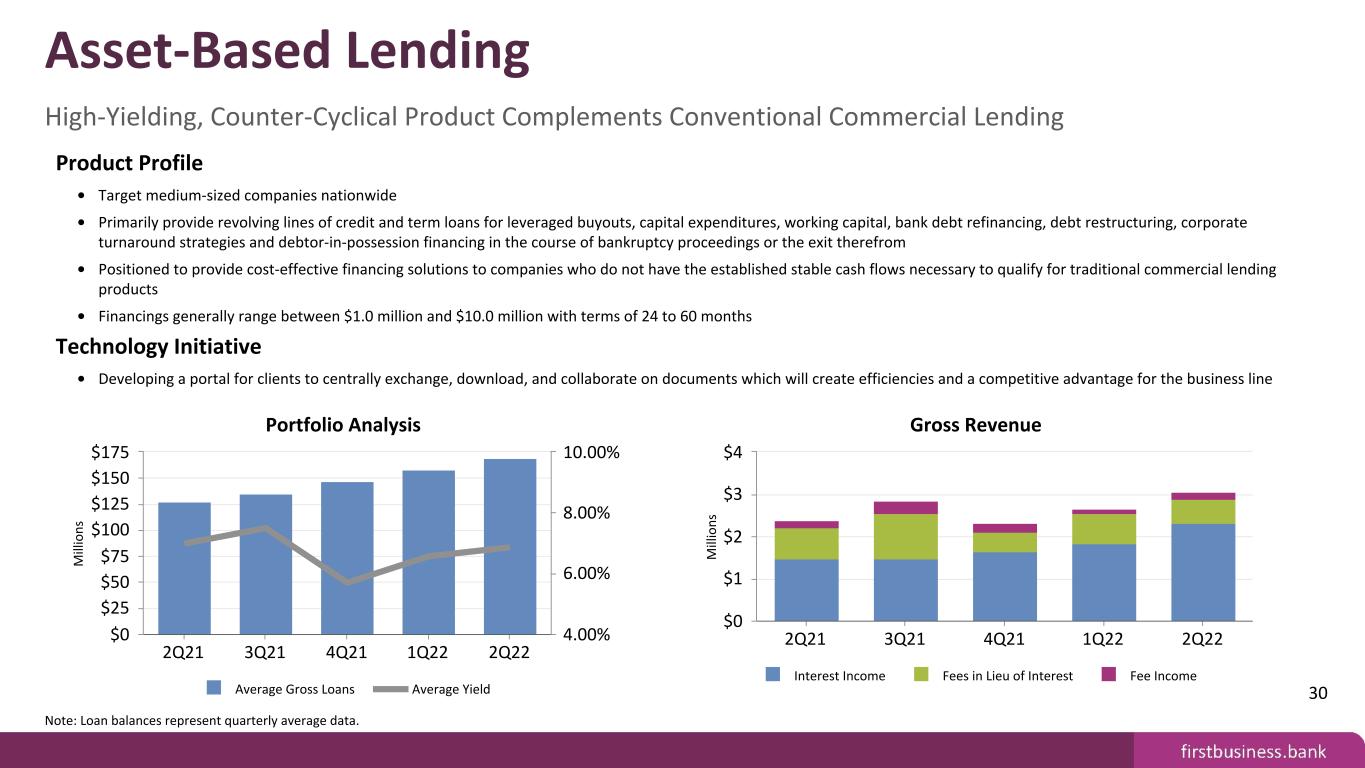
Product Profile • Target medium-sized companies nationwide • Primarily provide revolving lines of credit and term loans for leveraged buyouts, capital expenditures, working capital, bank debt refinancing, debt restructuring, corporate turnaround strategies and debtor-in-possession financing in the course of bankruptcy proceedings or the exit therefrom • Positioned to provide cost-effective financing solutions to companies who do not have the established stable cash flows necessary to qualify for traditional commercial lending products • Financings generally range between $1.0 million and $10.0 million with terms of 24 to 60 months Technology Initiative • Developing a portal for clients to centrally exchange, download, and collaborate on documents which will create efficiencies and a competitive advantage for the business line M ill io ns Portfolio Analysis Average Gross Loans Average Yield 2Q21 3Q21 4Q21 1Q22 2Q22 $0 $25 $50 $75 $100 $125 $150 $175 4.00% 6.00% 8.00% 10.00% M ill io ns Gross Revenue Interest Income Fees in Lieu of Interest Fee Income 2Q21 3Q21 4Q21 1Q22 2Q22 $0 $1 $2 $3 $4 Note: Loan balances represent quarterly average data. 30 Asset-Based Lending High-Yielding, Counter-Cyclical Product Complements Conventional Commercial Lending
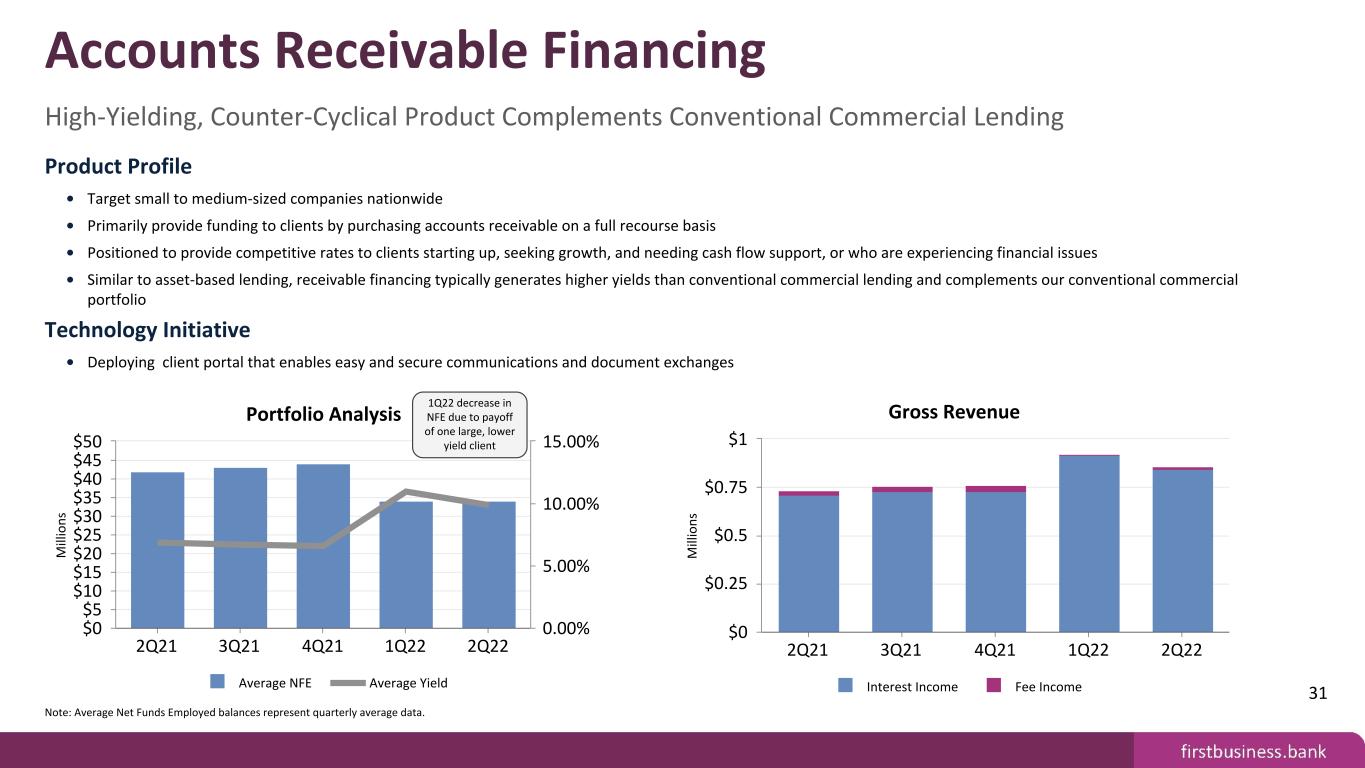
Product Profile • Target small to medium-sized companies nationwide • Primarily provide funding to clients by purchasing accounts receivable on a full recourse basis • Positioned to provide competitive rates to clients starting up, seeking growth, and needing cash flow support, or who are experiencing financial issues • Similar to asset-based lending, receivable financing typically generates higher yields than conventional commercial lending and complements our conventional commercial portfolio Technology Initiative • Deploying client portal that enables easy and secure communications and document exchanges M ill io ns Portfolio Analysis Average NFE Average Yield 2Q21 3Q21 4Q21 1Q22 2Q22 $0 $5 $10 $15 $20 $25 $30 $35 $40 $45 $50 0.00% 5.00% 10.00% 15.00% M ill io ns Gross Revenue Interest Income Fee Income 2Q21 3Q21 4Q21 1Q22 2Q22 $0 $0.25 $0.5 $0.75 $1 Note: Average Net Funds Employed balances represent quarterly average data. 31 Accounts Receivable Financing High-Yielding, Counter-Cyclical Product Complements Conventional Commercial Lending 1Q22 decrease in NFE due to payoff of one large, lower yield client

Product Profile • Primarily originate variable rate term loans through the 7(a) program which typically provides a guaranty of 75% of principal and interest • Product offering is designed to generate new business opportunities by meeting the needs of clients whose borrowing needs cannot be met with conventional bank loans • Sources of revenue include interest income on the retained portion of loan, gain on sale of the guaranteed portion of loan, loan packaging fee income, and loan servicing fee income Technology Initiatives • Deploying client portal that enables easy and secure communications and document exchanges • Leveraging Salesforce analytics to measure productivity of SBA loan life-cycle M ill io ns Portfolio Analysis Total Retained Total Sold Average Yield 2Q21 3Q21 4Q21 1Q22 2Q22 $0 $25 $50 $75 $100 $125 $150 $175 $200 2.50% 5.00% 7.50% 10.00% M ill io ns Gross Revenue Interest Income Gain on Sale Servicing Fees Packaging Fees 2Q21 3Q21 4Q21 1Q22 2Q22 $0 $1 $2 $3 Note: Total Retained and Total Sold represent period-end balances. Excludes PPP loans and related interest income and loan fee amortization. 32 SBA Lending & Servicing Full Client Acquisition Strategy for Small Businesses 2Q22 increase due to large non- accrual interest recovery

Product Profile • Includes broad range of equipment finance products to address the financing needs of commercial clients in a variety of industries • Focus includes manufacturing equipment, industrial assets, construction, and transportation equipment, and a wide variety of other commercial equipment • Financings generally < $250,000 with 48 month terms Technology Initiative • Focus is on eliminating manual work through multiple automation processes, including automated loan document creation, insurance filings, and client invoicing M ill io ns Portfolio Analysis Average Gross Loans & Leases Average Yield 2Q21 3Q21 4Q21 1Q22 2Q22 $60 $80 $100 $120 $140 4.00% 5.00% 6.00% 7.00% 8.00% M ill io ns Gross Revenue Interest Income Fee Income 2Q21 3Q21 4Q21 1Q22 2Q22 $0 $0.5 $1 $1.5 $2 $2.5 Note: Loan and lease balances represent quarterly average data. 33 Equipment Finance Aligned with the Equipment Loan and Lease Needs of our Niche Client Base
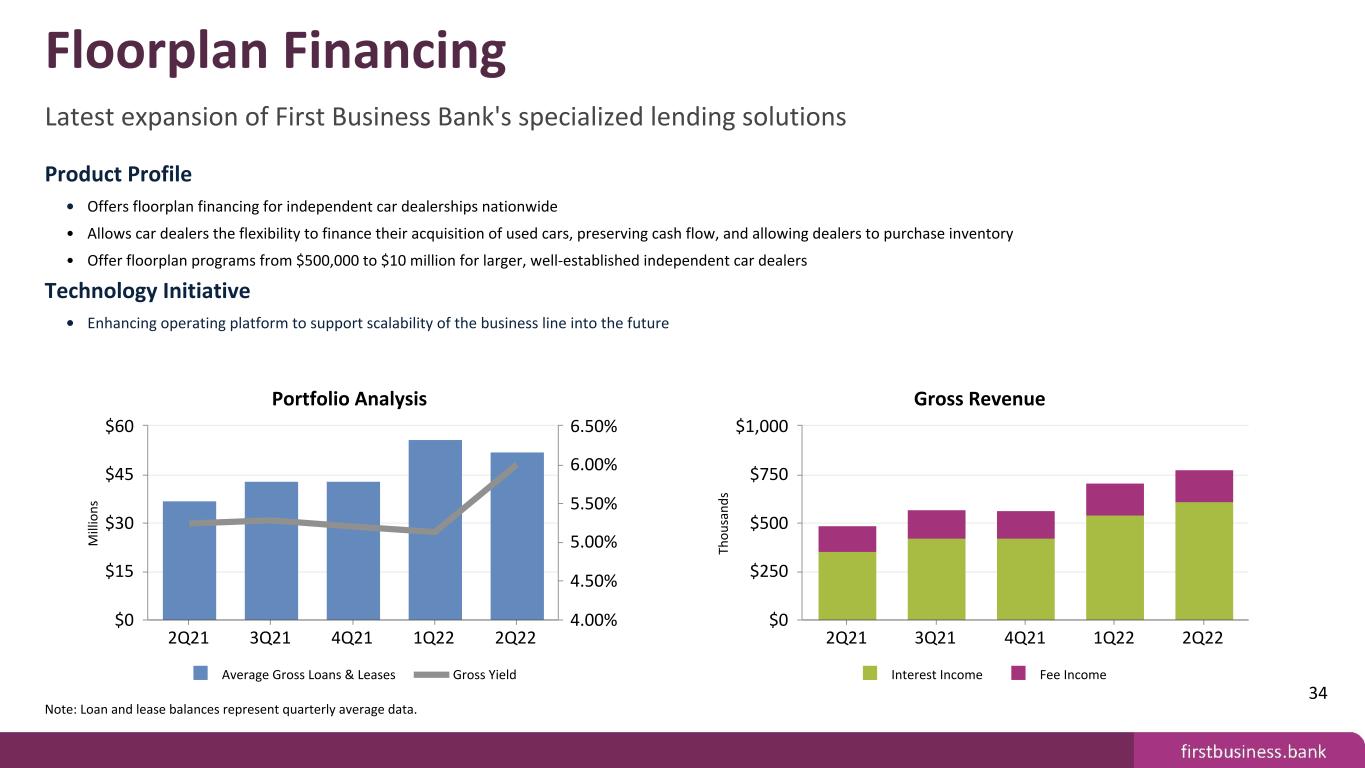
Product Profile • Offers floorplan financing for independent car dealerships nationwide • Allows car dealers the flexibility to finance their acquisition of used cars, preserving cash flow, and allowing dealers to purchase inventory • Offer floorplan programs from $500,000 to $10 million for larger, well-established independent car dealers Technology Initiative • Enhancing operating platform to support scalability of the business line into the future M ill io ns Portfolio Analysis Average Gross Loans & Leases Gross Yield 2Q21 3Q21 4Q21 1Q22 2Q22 $0 $15 $30 $45 $60 4.00% 4.50% 5.00% 5.50% 6.00% 6.50% Th ou sa nd s Gross Revenue Interest Income Fee Income 2Q21 3Q21 4Q21 1Q22 2Q22 $0 $250 $500 $750 $1,000 Note: Loan and lease balances represent quarterly average data. 34 Floorplan Financing Latest expansion of First Business Bank's specialized lending solutions

Product Profile • Expertise to assist institutions with balance sheet management • Services offered include investment portfolio management and administration, asset liability management, and asset liability process validation services Technology Initiative • Currently focusing on improved use of data through new system integrations including interfacing Salesforce directly to Bloomberg's streaming service to pull trade data in real- time. M ill io ns Assets Under Advisement 2Q21 3Q21 4Q21 1Q22 2Q22 $1,300 $1,400 $1,500 $1,600 $1,700 $1,800 Th ou sa nd s Fee Revenue 2Q21 3Q21 4Q21 1Q22 2Q22 $0 $25 $50 $75 $100 $125 $150 Note: Total Assets Under Advisement represent period-end balances. 35 Bank Consulting Outsourced treasury services provided to small and midsize financial institutions

APPENDIX Non-GAAP Reconciliations
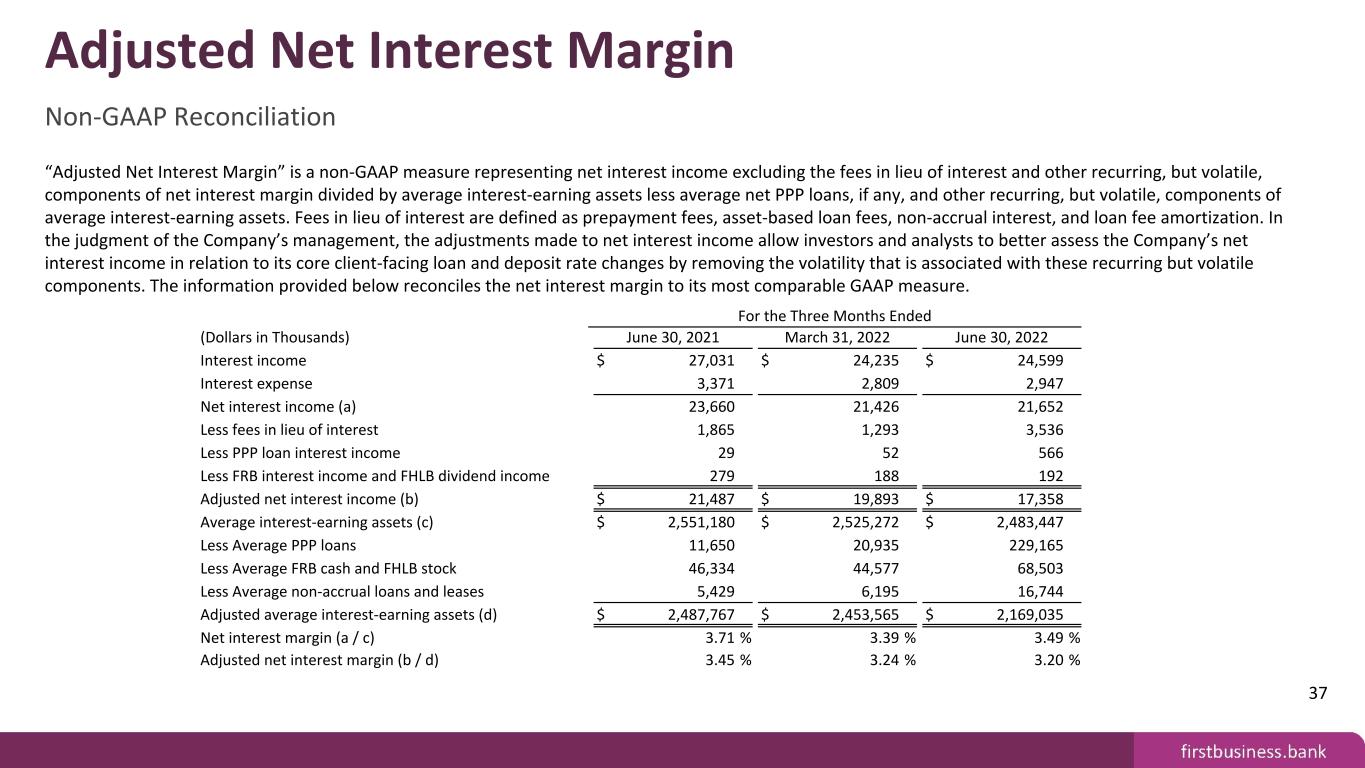
“Adjusted Net Interest Margin” is a non-GAAP measure representing net interest income excluding the fees in lieu of interest and other recurring, but volatile, components of net interest margin divided by average interest-earning assets less average net PPP loans, if any, and other recurring, but volatile, components of average interest-earning assets. Fees in lieu of interest are defined as prepayment fees, asset-based loan fees, non-accrual interest, and loan fee amortization. In the judgment of the Company’s management, the adjustments made to net interest income allow investors and analysts to better assess the Company’s net interest income in relation to its core client-facing loan and deposit rate changes by removing the volatility that is associated with these recurring but volatile components. The information provided below reconciles the net interest margin to its most comparable GAAP measure. For the Three Months Ended (Dollars in Thousands) June 30, 2021 March 31, 2022 June 30, 2022 Interest income $ 27,031 $ 24,235 $ 24,599 Interest expense 3,371 2,809 2,947 Net interest income (a) 23,660 21,426 21,652 Less fees in lieu of interest 1,865 1,293 3,536 Less PPP loan interest income 29 52 566 Less FRB interest income and FHLB dividend income 279 188 192 Adjusted net interest income (b) $ 21,487 $ 19,893 $ 17,358 Average interest-earning assets (c) $ 2,551,180 $ 2,525,272 $ 2,483,447 Less Average PPP loans 11,650 20,935 229,165 Less Average FRB cash and FHLB stock 46,334 44,577 68,503 Less Average non-accrual loans and leases 5,429 6,195 16,744 Adjusted average interest-earning assets (d) $ 2,487,767 $ 2,453,565 $ 2,169,035 Net interest margin (a / c) 3.71 % 3.39 % 3.49 % Adjusted net interest margin (b / d) 3.45 % 3.24 % 3.20 % 37 Adjusted Net Interest Margin Non-GAAP Reconciliation

"Pure Net Interest Income" is defined as net interest income less fees in lieu of interest. "Fees in Lieu of Interest" is defined as prepayment fees, asset-based loan fees, non-accrual interest, and loan fee amortization. We believe that this measure is important to many investors in the marketplace who are interested in the trends in our net interest margin. In compliance with applicable rules of the SEC, this non-GAAP measure is reconciled to net interest income, which is the most directly comparable GAAP financial measure. For the Three Months Ended For the Year Ended (Dollars in Thousands) June 30, 2021 June 30, 2022 December 31, 2018 December 31, 2019 December 31, 2020 December 31, 2021 Net interest income $ 21,652 $ 23,660 $ 67,342 $ 69,856 $ 77,071 $ 84,662 Less fees in lieu of interest 3,536 1,865 5,593 6,479 9,315 11,160 Pure net interest income (non-GAAP) $ 18,116 $ 21,795 $ 61,749 $ 63,377 $ 67,756 $ 73,502 Less PPP interest income $ 566 $ 29 $ — $ — $ 2,198 $ 1,524 Pure net interest income, less PPP (non-GAAP) $ 17,550 $ 21,766 $ 61,749 $ 63,377 $ 65,558 $ 71,978 38 Pure Net Interest Income Non-GAAP Reconciliation
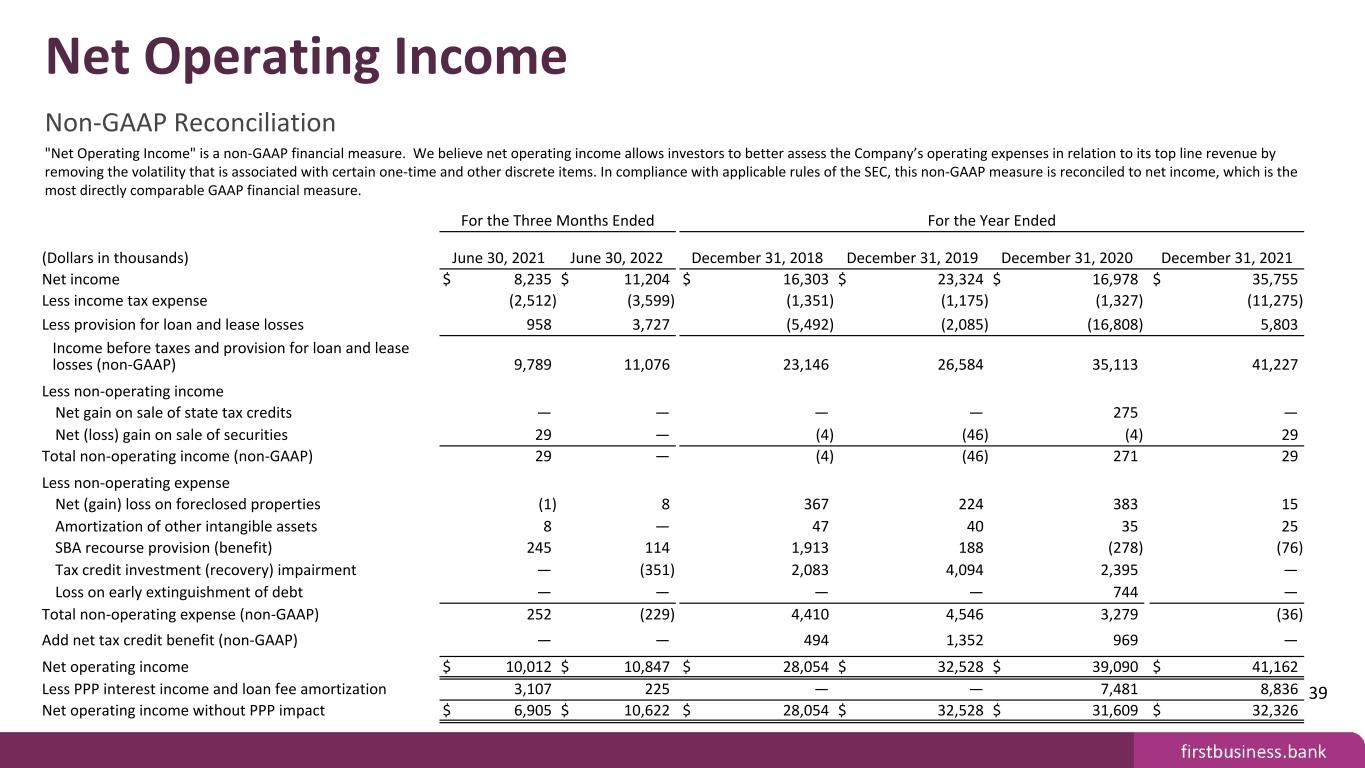
"Net Operating Income" is a non-GAAP financial measure. We believe net operating income allows investors to better assess the Company’s operating expenses in relation to its top line revenue by removing the volatility that is associated with certain one-time and other discrete items. In compliance with applicable rules of the SEC, this non-GAAP measure is reconciled to net income, which is the most directly comparable GAAP financial measure. For the Three Months Ended For the Year Ended (Dollars in thousands) June 30, 2021 June 30, 2022 December 31, 2018 December 31, 2019 December 31, 2020 December 31, 2021 Net income $ 8,235 $ 11,204 $ 16,303 $ 23,324 $ 16,978 $ 35,755 Less income tax expense (2,512) (3,599) (1,351) (1,175) (1,327) (11,275) Less provision for loan and lease losses 958 3,727 (5,492) (2,085) (16,808) 5,803 Income before taxes and provision for loan and lease losses (non-GAAP) 9,789 11,076 23,146 26,584 35,113 41,227 Less non-operating income Net gain on sale of state tax credits — — — — 275 — Net (loss) gain on sale of securities 29 — (4) (46) (4) 29 Total non-operating income (non-GAAP) 29 — (4) (46) 271 29 Less non-operating expense Net (gain) loss on foreclosed properties (1) 8 367 224 383 15 Amortization of other intangible assets 8 — 47 40 35 25 SBA recourse provision (benefit) 245 114 1,913 188 (278) (76) Tax credit investment (recovery) impairment — (351) 2,083 4,094 2,395 — Loss on early extinguishment of debt — — — — 744 — Total non-operating expense (non-GAAP) 252 (229) 4,410 4,546 3,279 (36) Add net tax credit benefit (non-GAAP) — — 494 1,352 969 — Net operating income $ 10,012 $ 10,847 $ 28,054 $ 32,528 $ 39,090 $ 41,162 Less PPP interest income and loan fee amortization 3,107 225 — — 7,481 8,836 Net operating income without PPP impact $ 6,905 $ 10,622 $ 28,054 $ 32,528 $ 31,609 $ 32,326 39 Net Operating Income Non-GAAP Reconciliation


