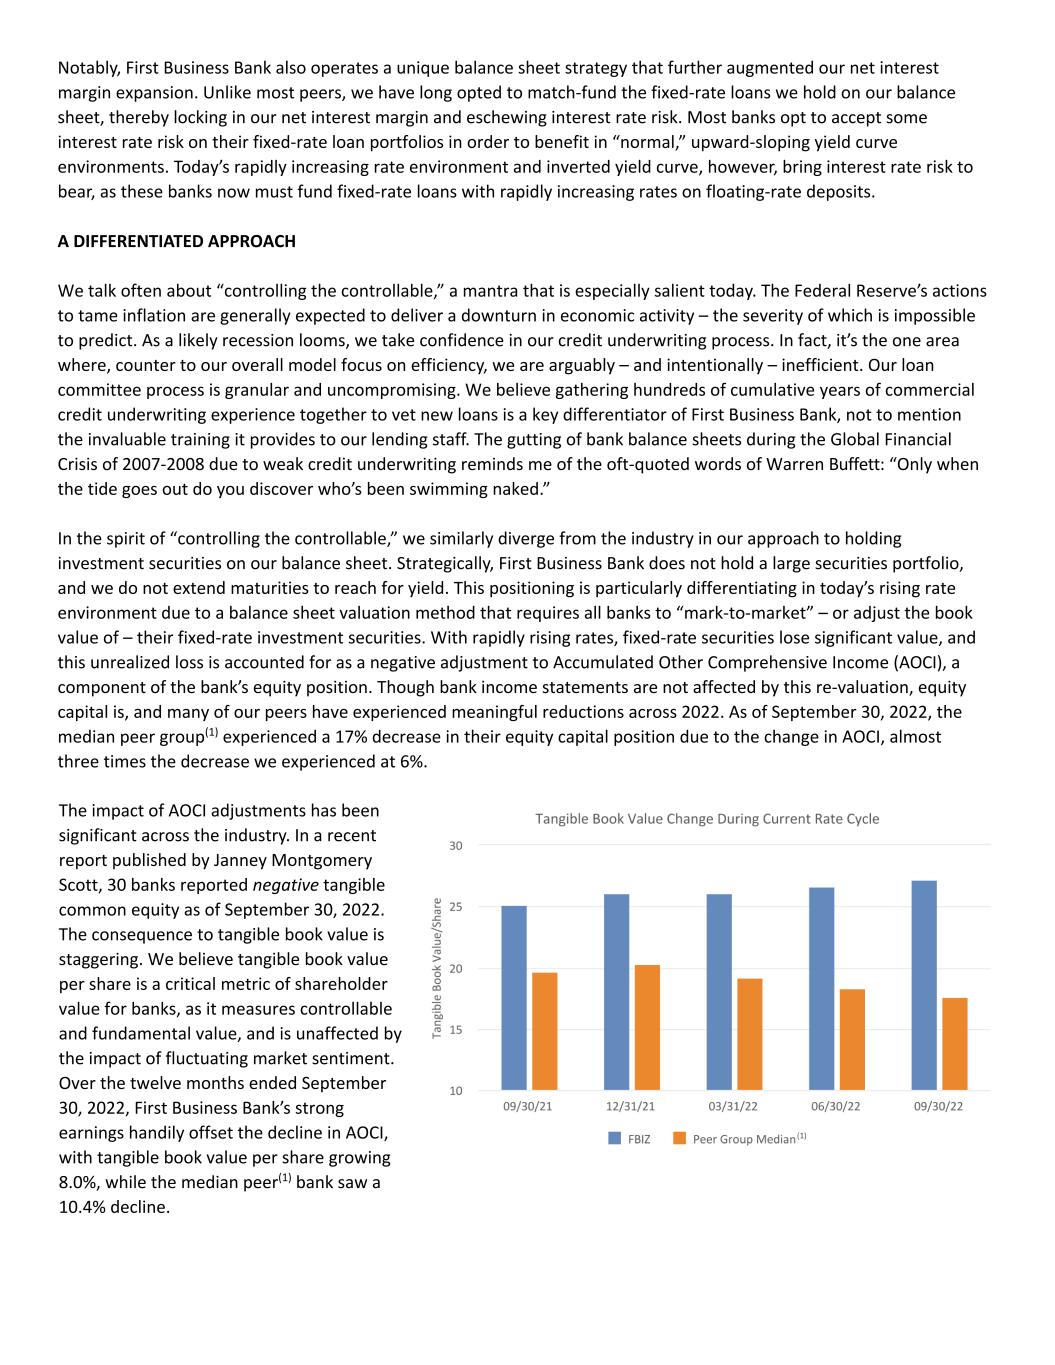
CEO REPORT – THIRD QUARTER 2022 DEAR SHAREHOLDERS AND FRIENDS OF FIRST BUSINESS BANK: Third quarter 2022 performance headlines echo with repetition: record net interest margin, record net interest income, record top line revenue, record levels of deposits and loans, and record tangible book value. Underlying the superlatives, the highlights of the quarter are attributable to various temporal and environmental factors, as well as the impact of long-held internal philosophies and strategies. The third quarter of 2022 was outstanding across all measures. Top line revenue – defined as net interest income plus non-interest income – rose to $34.1 million, marking a record for the company, as well as the fifth consecutive quarter of growth. Revenue expansion was driven by record net interest margin, which eclipsed 4.0% for the first time, as well as strength in our fee- based Commercial Banking revenue streams. Revenue growth outpaced expense growth, leading to positive operating leverage even as we continued to invest in talent to support our growth plans. We saw significant deposit growth, increasing 16% annualized, more than fully funding our 8% annualized loan growth. Asset quality also remained pristine, with the ratio of non-performing assets to total assets declining to just 0.13%, our lowest level in nearly 20 years. This growth drove outstanding profitability metrics. Pre-tax, pre-provision adjusted return on average assets rose to 2.05%, exceeding 2.0% for the first time ever. Net income totaled $10.6 million, while earnings per share measured $1.25. Tangible book value per share – a key indicator of shareholder value – rose to $27.13, marking a record for the company and a notable differentiation from peers. RECORD NET INTEREST MARGIN DRIVES PERFORMANCE Record net interest margin was the primary driver of the quarter’s outstanding performance. At 4.01%, net interest margin exceeded both our past performance and our most optimistic expectations. The confluence of a rapidly rising interest rate environment and our strategic balance sheet management decisions facilitated this exceptional result. Over the first nine months of 2022, the Federal Reserve initiated five increases in the federal funds target rate, which rose 300 basis points from early March 2022 to September 2022, in response to rapid increases in the consumer price index inflation rate for the United States. Inflation reached 8.2% for the 12 months ended September 2022, which marked the highest 12-month inflation rate since June 1982. Most lending rates are tied to indices that anticipated, and thus preemptively priced in, these federal funds target rate increases, or to the Prime rate, which immediately moves in tandem with Federal Reserve rate changes. Thus, lending rates rose rapidly over the past year, to levels not seen since 2008, in contrast to deposit rates, which tend to lag movements in the federal funds rate. The exceptionally rapid pace of rate increases amplified the typical expansion of net interest margins in a rising rate environment.

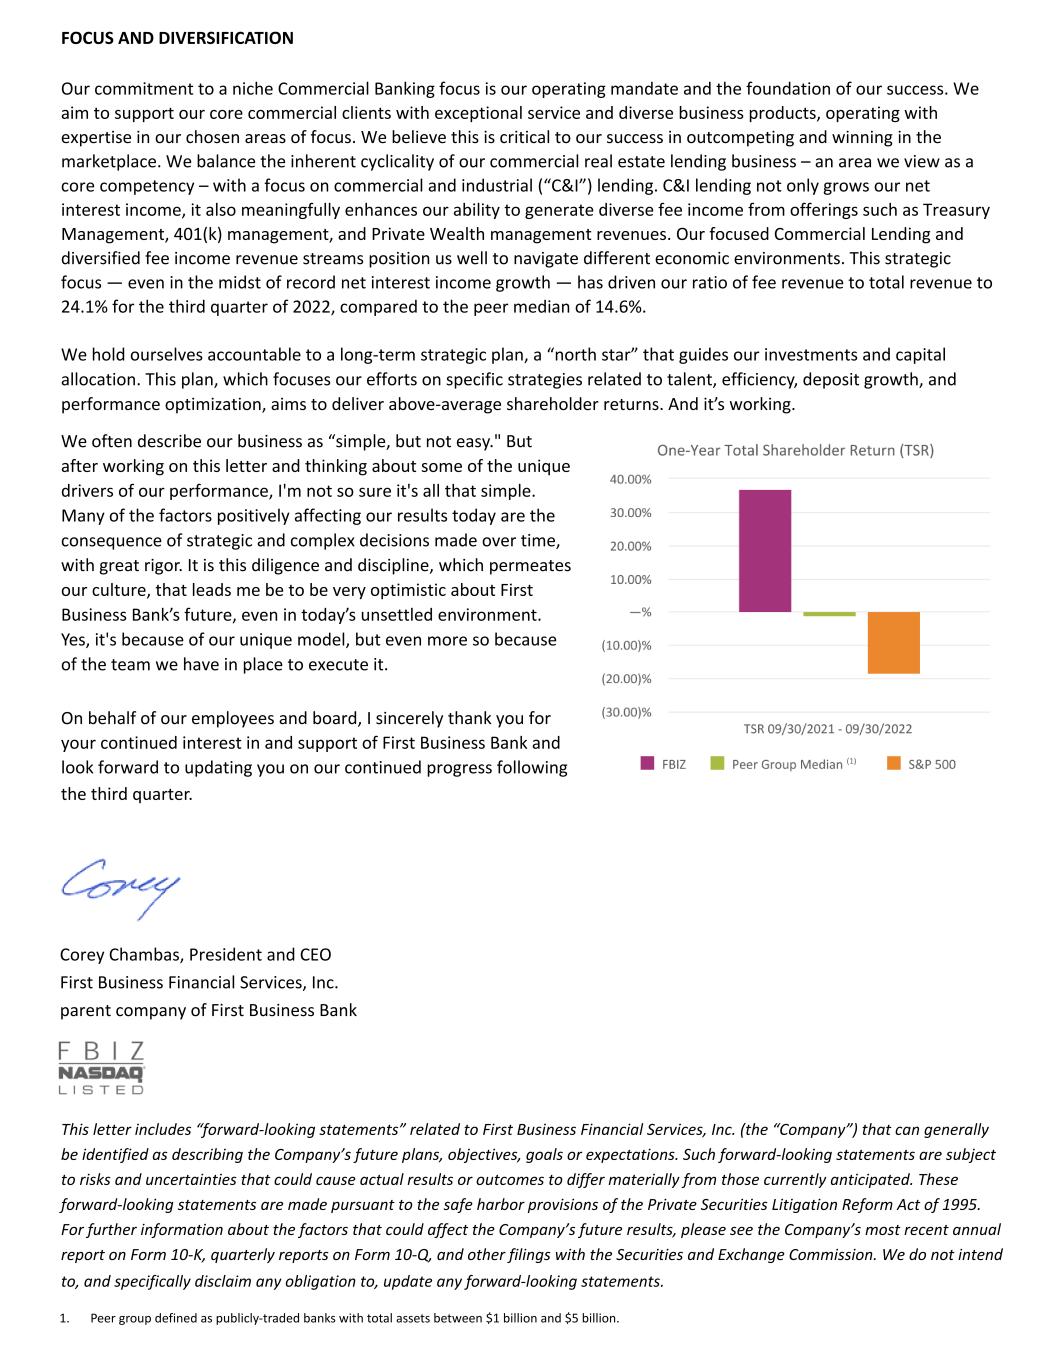
Notably, First Business Bank also operates a unique balance sheet strategy that further augmented our net interest margin expansion. Unlike most peers, we have long opted to match-fund the fixed-rate loans we hold on our balance sheet, thereby locking in our net interest margin and eschewing interest rate risk. Most banks opt to accept some interest rate risk on their fixed-rate loan portfolios in order to benefit in “normal,” upward-sloping yield curve environments. Today’s rapidly increasing rate environment and inverted yield curve, however, bring interest rate risk to bear, as these banks now must fund fixed-rate loans with rapidly increasing rates on floating-rate deposits. A DIFFERENTIATED APPROACH We talk often about “controlling the controllable,” a mantra that is especially salient today. The Federal Reserve’s actions to tame inflation are generally expected to deliver a downturn in economic activity – the severity of which is impossible to predict. As a likely recession looms, we take confidence in our credit underwriting process. In fact, it’s the one area where, counter to our overall model focus on efficiency, we are arguably – and intentionally – inefficient. Our loan committee process is granular and uncompromising. We believe gathering hundreds of cumulative years of commercial credit underwriting experience together to vet new loans is a key differentiator of First Business Bank, not to mention the invaluable training it provides to our lending staff. The gutting of bank balance sheets during the Global Financial Crisis of 2007-2008 due to weak credit underwriting reminds me of the oft-quoted words of Warren Buffett: “Only when the tide goes out do you discover who’s been swimming naked.” In the spirit of “controlling the controllable,” we similarly diverge from the industry in our approach to holding investment securities on our balance sheet. Strategically, First Business Bank does not hold a large securities portfolio, and we do not extend maturities to reach for yield. This positioning is particularly differentiating in today’s rising rate environment due to a balance sheet valuation method that requires all banks to “mark-to-market” – or adjust the book value of – their fixed-rate investment securities. With rapidly rising rates, fixed-rate securities lose significant value, and this unrealized loss is accounted for as a negative adjustment to Accumulated Other Comprehensive Income (AOCI), a component of the bank’s equity position. Though bank income statements are not affected by this re-valuation, equity capital is, and many of our peers have experienced meaningful reductions across 2022. As of September 30, 2022, the median peer group(1) experienced a 17% decrease in their equity capital position due to the change in AOCI, almost three times the decrease we experienced at 6%. The impact of AOCI adjustments has been significant across the industry. In a recent report published by Janney Montgomery Scott, 30 banks reported negative tangible common equity as of September 30, 2022. The consequence to tangible book value is staggering. We believe tangible book value per share is a critical metric of shareholder value for banks, as it measures controllable and fundamental value, and is unaffected by the impact of fluctuating market sentiment. Over the twelve months ended September 30, 2022, First Business Bank’s strong earnings handily offset the decline in AOCI, with tangible book value per share growing 8.0%, while the median peer(1) bank saw a 10.4% decline.

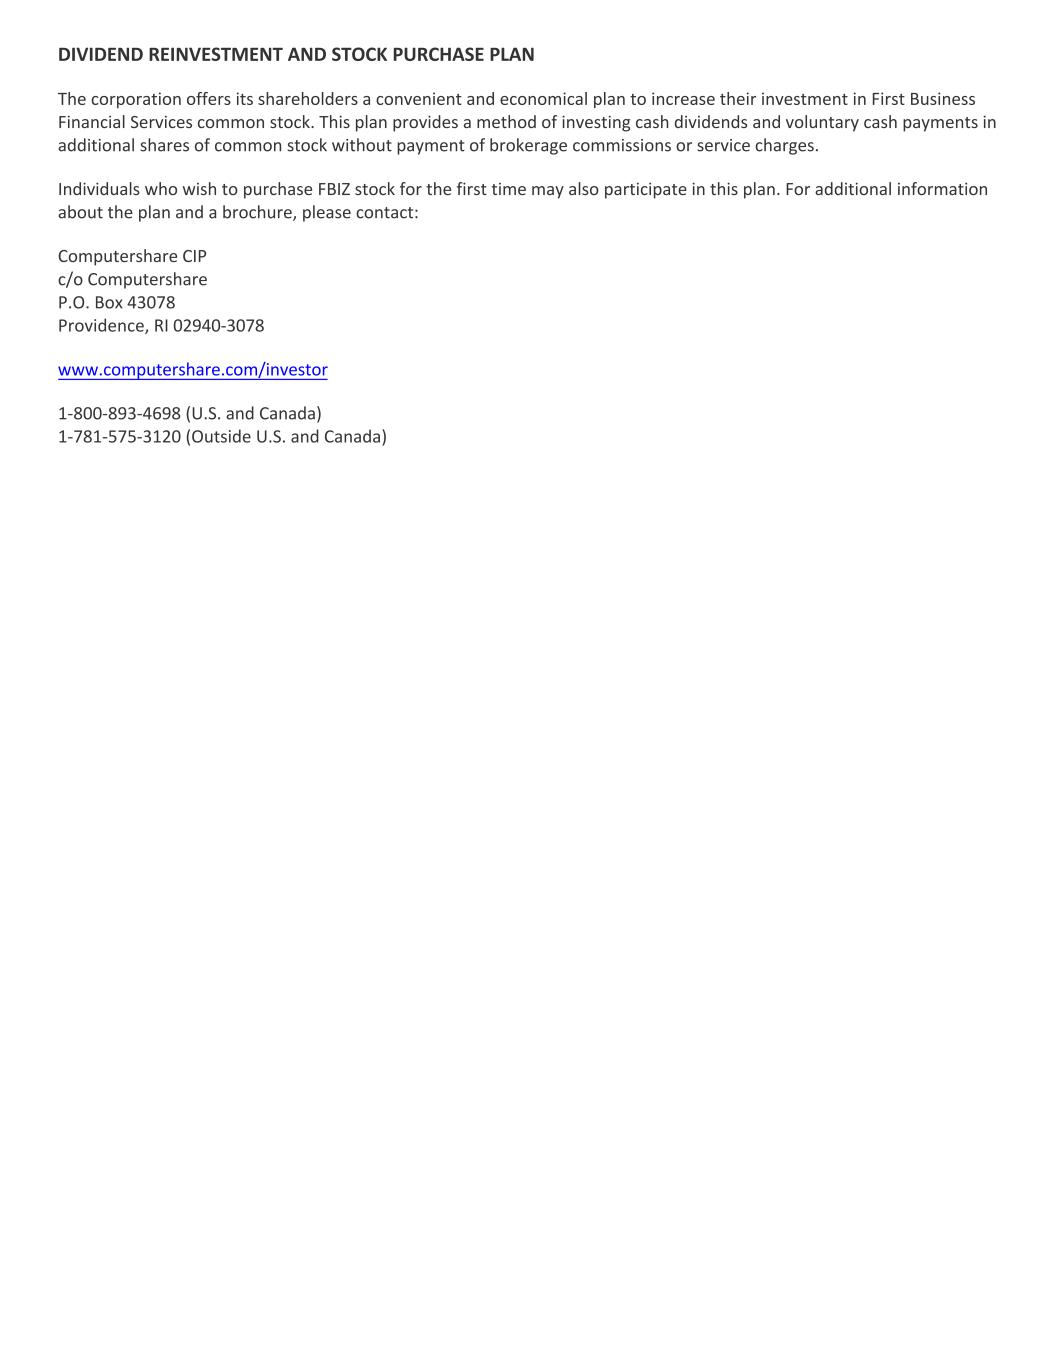
This letter includes “forward-looking statements” related to First Business Financial Services, Inc. (the “Company”) that can generally be identified as describing the Company’s future plans, objectives, goals or expectations. Such forward-looking statements are subject to risks and uncertainties that could cause actual results or outcomes to differ materially from those currently anticipated. These forward-looking statements are made pursuant to the safe harbor provisions of the Private Securities Litigation Reform Act of 1995. For further information about the factors that could affect the Company’s future results, please see the Company’s most recent annual report on Form 10-K, quarterly reports on Form 10-Q, and other filings with the Securities and Exchange Commission. We do not intend to, and specifically disclaim any obligation to, update any forward-looking statements. We often describe our business as “simple, but not easy." But after working on this letter and thinking about some of the unique drivers of our performance, I'm not so sure it's all that simple. Many of the factors positively affecting our results today are the consequence of strategic and complex decisions made over time, with great rigor. It is this diligence and discipline, which permeates our culture, that leads me be to be very optimistic about First Business Bank’s future, even in today’s unsettled environment. Yes, it's because of our unique model, but even more so because of the team we have in place to execute it. On behalf of our employees and board, I sincerely thank you for your continued interest in and support of First Business Bank and look forward to updating you on our continued progress following the third quarter. Corey Chambas, President and CEO First Business Financial Services, Inc. parent company of First Business Bank FOCUS AND DIVERSIFICATION Our commitment to a niche Commercial Banking focus is our operating mandate and the foundation of our success. We aim to support our core commercial clients with exceptional service and diverse business products, operating with expertise in our chosen areas of focus. We believe this is critical to our success in outcompeting and winning in the marketplace. We balance the inherent cyclicality of our commercial real estate lending business – an area we view as a core competency – with a focus on commercial and industrial (“C&I”) lending. C&I lending not only grows our net interest income, it also meaningfully enhances our ability to generate diverse fee income from offerings such as Treasury Management, 401(k) management, and Private Wealth management revenues. Our focused Commercial Lending and diversified fee income revenue streams position us well to navigate different economic environments. This strategic focus — even in the midst of record net interest income growth — has driven our ratio of fee revenue to total revenue to 24.1% for the third quarter of 2022, compared to the peer median of 14.6%. We hold ourselves accountable to a long-term strategic plan, a “north star” that guides our investments and capital allocation. This plan, which focuses our efforts on specific strategies related to talent, efficiency, deposit growth, and performance optimization, aims to deliver above-average shareholder returns. And it’s working. 1. Peer group defined as publicly-traded banks with total assets between $1 billion and $5 billion.

Financial Highlights (Unaudited) As of and for the Three Months Ended As of and for the Nine Months Ended Income Statement Data 9/30/22 9/30/21 % Change 9/30/22 9/30/21 % Change (Dollars in Thousands) Net interest income $ 25,884 $ 21,223 22.0 % $ 70,971 $ 63,738 11.3 % Adjusted non-interest income(1) 8,197 7,015 16.8 % 22,455 20,502 9.5 % Total operating revenue 34,081 28,238 20.7 % 93,426 84,240 10.9 % Total operating expense(2) 19,925 18,546 7.4 % 58,497 53,928 8.5 % Pre-tax, pre-provision adjusted earnings(3) 14,156 9,692 46.1 % 34,929 30,312 15.2 % Provision for loan and lease losses 12 (2,269) * (4,569) (5,295) (13.7) Net loss on foreclosed properties 7 6 16.7 % 27 7 * Amortization of other intangible assets — 7 * — 23 * SBA recourse provision (benefit) 96 (69) * 134 45 * Benefit on tax credit — — * (351) — * Net gain on sale of securities — — * — (29) * Income before income tax expense 14,041 12,017 16.8 % 39,688 35,561 11.6 % Income tax expense 3,215 2,819 14.0 % 8,986 8,396 7.0 % Net income $ 10,826 $ 9,198 17.7 % $ 30,702 $ 27,165 13.0 % Preferred stock dividends 218 — * 464 — * Net income available to common shareholders $ 10,608 $ 9,198 15.3 % $ 30,238 $ 27,165 11.3 % Efficiency ratio(4) 58.46 % 65.68 % 62.61 % 64.02 % Common Per Share Data Diluted earnings $ 1.25 $ 1.07 16.8 % $ 3.57 $ 3.15 13.3 % Dividends declared 0.1975 0.18 9.7 % 0.592 0.54 9.7 % Tangible book value(5) 27.13 25.11 8.0 % 27.13 25.11 8.0 % As of Balance Sheet Data 9/30/22 9/30/21 % Change (Dollars in Millions) Total loans and leases receivable $ 2,331 $ 2,123 9.8 % Total assets 2,851 2,584 10.3 % In-market deposits(6) 1,929 1,830 5.4 % Stockholders’ equity 253 225 12.4 % * Not meaningful (1) "Adjusted non-interest income" is a non-GAAP measure defined as non-interest income excluding net gain on sale of securities. (2) “Operating expense” is a non-GAAP measure defined as non-interest expense excluding net loss on foreclosed properties, amortization of other intangible assets, SBA recourse provision, (benefit), and other discrete items, if any. (3) “Pre-tax, pre-provision adjusted earnings” is a non-GAAP measure defined as pre-tax income excluding the effects of provision for loan and leases losses, net loss on foreclosed properties, amortization of other intangible assets, SBA recourse provision, (benefit), and net gain on sale of securities. (4) “Efficiency ratio” is a non-GAAP measure defined as total operating expense divided by total operating revenue. Please refer to the calculations and management’s reason for using these non-GAAP measures in the Company’s most recent earnings release, included as an exhibit to our Current Report on Form 8-K filed with the SEC on October 27, 2022. (5) "Tangible book value" is a non-GAAP measure representing tangible common equity divided by total common shares outstanding. "Tangible common equity" itself is a non-GAAP measure representing common stockholders' equity reduced by intangible assets, if any. See the section titled Non-GAAP Reconciliations in the Company's most recent earnings release, included as an exhibit to our Current Report on Form 8-K filed with the SEC on October 27, 2022. (6) In-market deposits consists of all transaction accounts, money market accounts, and non-wholesale deposits.

Quarterly Financial Results - Excluding PPP Loans, Interest Income, and Fees (Unaudited) As of and for the Three Months Ended As of and for the Nine Months Ended (Dollars in thousands, except per share amounts) September 30, 2022 September 30, 2021 September 30, 2022 September 30, 2021 Net interest income $ 25,812 $ 19,336 $ 70,373 $ 55,928 Adjusted non-interest income (1) 8,197 7,015 22,455 20,502 Operating revenue (1) 34,009 26,351 92,828 76,430 Operating expense (1) 19,925 18,546 58,497 53,928 Pre-tax, pre-provision adjusted earnings (1) $ 14,084 $ 7,805 34,331 22,502 Net interest margin (2) 4.00 % 3.26 % 3.69 % 3.28 % Fee income ratio (non-interest income / total revenue) 24.10 % 26.62 % 24.19 % 26.85 % Efficiency ratio (1) 58.59 % 70.38 % 63.02 % 70.56 % Pre-tax, pre-provision adjusted return on average assets (1)(2) 2.05 % 1.24 % 1.69 % 1.24 % Period-end loans and leases receivable $ 2,328,376 $ 2,058,852 $ 2,328,376 $ 2,058,852 Average loans and leases receivable $ 2,312,116 $ 2,043,582 $ 2,266,030 $ 1,993,206 Allowance for loan and lease losses as a percent of total gross loans and leases 1.04 % 1.20 % 1.04 % 1.20 % Non-performing assets as a percent of total assets 0.13 % 0.30 % 0.13 % 0.30 % (1) This is a non-GAAP financial measure. Management believes these measures are meaningful because they reflect adjustments commonly made by management, investors, regulators, and analysts to evaluate financial performance, provide greater understanding of ongoing operations, and enhance comparability of results with prior periods. See the section titled Non-GAAP Reconciliations in the Company's most recent earnings release, included as an exhibit to our Current Report on Form 8-K filed with the SEC on October 27, 2022. (2) Calculation is annualized. INVESTOR MATERIALS Annual quarterly shareholder reports, regulatory filings, press releases, and articles about the corporation which have appeared in various publications are generally available in the “Investor Relations” section of our website, or may be obtained from Mr. Ed Sloane, Jr. by calling (608) 232-5970 or via online form. Ending High Low Price Volume 9/30/2022 36.58 29.84 32.31 3,229,4296/30/2022 35.92 30.51 31.19 1,012,984 3/31/2022 34.22 28.97 32.81 693,57112/31/2021 31.89 28.00 29.17 1,352,916 9/30/2021 29.42 25.70 28.71 1,613,307 STOCK PERFORMANCE This table shows the high, low, and closing price for FBIZ’s common stock in recent quarters as reported by Nasdaq. Quarter Trade Price Closing

DIVIDEND REINVESTMENT AND STOCK PURCHASE PLAN The corporation offers its shareholders a convenient and economical plan to increase their investment in First Business Financial Services common stock. This plan provides a method of investing cash dividends and voluntary cash payments in additional shares of common stock without payment of brokerage commissions or service charges. Individuals who wish to purchase FBIZ stock for the first time may also participate in this plan. For additional information about the plan and a brochure, please contact: Computershare CIP c/o Computershare P.O. Box 43078 Providence, RI 02940-3078 www.computershare.com/investor 1-800-893-4698 (U.S. and Canada) 1-781-575-3120 (Outside U.S. and Canada)


