Exhibit 99.3
PRO FORMA VALUATION REPORT
STANDARD CONVERSION
Entegra Financial Corp. | Franklin, North Carolina
PROPOSED HOLDING COMPANY FOR:
Macon Bank | Franklin, North Carolina
Dated as of February 14, 2014

1100 North Glebe Road Suite 600
Arlington, Virginia 22201
703.528.1700
rpfinancial.com
| RP® Financial, LC. | TABLE OF CONTENTS | |
| i |
TABLE OF CONTENTS
ENTEGRA FINANCIAL CORP.
MACON BANK
Franklin, North Carolina
DESCRIPTION | PAGE NUMBER | |||||
| CHAPTER ONE | OVERVIEW AND FINANCIAL ANALYSIS | |||||
Introduction | I.1 | |||||
Plan of Conversion | I.2 | |||||
Use of Conversion Proceeds | I.3 | |||||
Strategic Overview | I.3 | |||||
Regulatory Agreements | I.7 | |||||
Balance Sheet Trends | I.10 | |||||
Income and Expense Trends | I.14 | |||||
Interest Rate Risk Management | I.19 | |||||
Lending Activities and Strategy | I.20 | |||||
Asset Quality | I.23 | |||||
Funding Composition and Strategy | I.24 | |||||
Subsidiaries | I.25 | |||||
Legal Proceedings | I.25 | |||||
| CHAPTER TWO | MARKET AREA ANALYSIS | |||||
Introduction | II.1 | |||||
National Economic Factors | II.2 | |||||
Interest Rate Environment | II.4 | |||||
Market Area Demographics | II.5 | |||||
Local Economy | II.7 | |||||
Unemployment Trends | II.9 | |||||
Real Estate Trends | II.9 | |||||
Market Area Deposit Characteristics and Competition | II.10 | |||||
| CHAPTER THREE | PEER GROUP ANALYSIS | |||||
Peer Group Selection Process | III.1 | |||||
Financial Condition | III.9 | |||||
Income and Expense Components | III.13 | |||||
Loan Composition | III.16 | |||||
Credit Risk | III.16 | |||||
Interest Rate Risk | III.19 | |||||
Summary | III.19 | |||||
| RP® Financial, LC. | TABLE OF CONTENTS | |
| ii |
TABLE OF CONTENTS
ENTEGRA FINANCIAL CORP.
MACON BANK
Franklin, North Carolina
(continued)
DESCRIPTION | PAGE NUMBER | |||||
| CHAPTER FOUR | VALUATION ANALYSIS | |||||
Introduction | IV.1 | |||||
Appraisal Guidelines | IV.1 | |||||
RP Financial Approach to the Valuation | IV.1 | |||||
Valuation Analysis | IV.2 | |||||
1. Financial Condition | IV.3 | |||||
2. Profitability, Growth and Viability of Earnings | IV.4 | |||||
3. Asset Growth | IV.6 | |||||
4. Primary Market Area | IV.7 | |||||
5. Dividends | IV.8 | |||||
6. Liquidity of the Shares | IV.9 | |||||
7. Marketing of the Issue | IV.9 | |||||
A. The Public Market | IV.9 | |||||
B. The New Issue Market | IV.13 | |||||
C. The Acquisition Market | IV.16 | |||||
8. Management | IV.18 | |||||
9. Effect of Government Regulation and Regulatory Reform | IV.18 | |||||
Summary of Adjustments | IV.19 | |||||
Valuation Approaches | IV.19 | |||||
1. Price-to-Earnings (“P/E”) | IV.20 | |||||
2. Price-to-Book (“P/B”) | IV.21 | |||||
3. Price-to-Assets (“P/A”) | IV.21 | |||||
Comparison to Recent Offerings | IV.23 | |||||
Valuation Conclusion | IV.23 | |||||
| RP® Financial, LC. | LIST OF TABLES | |
| iii |
LIST OF TABLES
ENTEGRA FINANCIAL CORP.
MACON BANK
Franklin, North Carolina
TABLE | DESCRIPTION | PAGE | ||||
| 1.1 | Historical Balance Sheets | I.11 | ||||
| 1.2 | Historical Income Statements | I.15 | ||||
| 2.1 | Summary Demographic Data | II.6 | ||||
| 2.2 | Primary Market Area Employment Sectors | II.7 | ||||
| 2.3 | Market Area Largest Employers | II.8 | ||||
| 2.4 | Unemployment Trends | II.9 | ||||
| 2.5 | Deposit Summary | II.11 | ||||
| 2.6 | Market Area Deposit Competitors | II.13 | ||||
| 3.1 | Peer Group of Publicly-Traded Thrifts | III.4 | ||||
| 3.2 | Balance Sheet Composition and Growth Rates | III.10 | ||||
| 3.3 | Income as a % of Average Assets and Yields, Costs, Spreads | III.14 | ||||
| 3.4 | Loan Portfolio Composition and Related Information | III.17 | ||||
| 3.5 | Credit Risk Measures and Related Information | III.18 | ||||
| 3.6 | Interest Rate Risk Measures and Net Interest Income Volatility | III.20 | ||||
| 4.1 | Conversions Completed in Last Three Months | IV.15 | ||||
| 4.2 | Market Pricing Comparatives | IV.17 | ||||
| 4.3 | Public Market Pricing Versus Peer Group | IV.22 | ||||

February 14, 2014
Boards of Directors
Macon Bancorp
Entegra Financial Corp.
Macon Bank
220 One Center Court
Franklin, North Carolina 28734
Members of the Boards of Directors:
At your request, we have completed and hereby provide an independent appraisal (“Appraisal”) of the estimated pro forma market value of the common stock which is to be issued in connection with the mutual-to-stock conversion transaction described below.
This Appraisal is furnished pursuant to the requirements stipulated in the Code of Federal Regulations and has been prepared in accordance with the “Guidelines for Appraisal Reports for the Valuation of Savings Institutions Converting from the Mutual to the Stock Form of Organization” (the “Valuation Guidelines”) of the Office of Thrift Supervision (“OTS”) and accepted by the Federal Reserve Board (“FRB”), the Office of the Comptroller of the Currency (“OCC”), the Federal Deposit Insurance Corporation (“FDIC”), the North Carolina Commissioner of Banks (“Commissioner”) and applicable regulatory interpretations thereof.
Description of Plan of Conversion
On January 23, 2014, the respective Board of Directors of Macon Bancorp (the “MHC”), a North Carolina-chartered mutual holding company and Macon Bank (the “Bank”) adopted the plan of conversion (the “Conversion”). Pursuant to the plan of Conversion, the MHC will merge with and into Entegra Financial Corp. (“Entegra”), a North Carolina corporation organized in 2011 as “Macon Financial Corp.” and renamed “Entegra Financial Corp.” in 2014, and in doing so, the organization will convert from the mutual holding company form of organization to the stock form of organization. As a result, Entegra will be the surviving entity and the Bank will become a wholly-owned subsidiary of Entegra. As part of the Conversion, Entegra will offer 100% of its common stock to eligible depositors of the Bank in a subscription offering and, if necessary, to members of the general public through community and/or syndicated offerings (the “Offering”). When the Conversion and Offering are completed, the MHC will no longer exist and Entegra will own all of the outstanding common stock of the Bank, and all of the outstanding common stock of Entegra will be owned by public shareholders. For purposes of this Appraisal, the existing consolidated entity and Entegra will both be referred to as “Macon” or the “Company,” unless specifically indicated otherwise.
Entegra will offer its common stock in a subscription offering to Eligible Account Holders, Supplemental Eligible Account Holders, and Other Depositors and Other Members, as such terms are defined for purposes of applicable federal regulatory guidelines governing mutual-to-stock conversions. To the extent that shares remain available for purchase after satisfaction of
| Washington Headquarters | ||
| Three Ballston Plaza | Telephone: (703) 528-1700 | |
| 1100 North Glebe Road, Suite 600 | Fax No.: (703) 528-1788 | |
| Arlington, VA 22201 | Toll-Free No.: (866) 723-0594 | |
| www.rpfinancial.com | E-Mail: mail@rpfinancial.com |
Boards of Directors
February 14, 2014
Page 2
all subscriptions received in the subscription offering, the shares may be offered for sale to members of the general public in a community offering and/or a syndicated offering. A portion of the net proceeds received from the sale of the common stock will be used to purchase all of the then to be issued and outstanding capital stock of the Bank and the balance of the net proceeds will be retained by the Company.
At this time, not other activities are contemplated for the Company other than the ownership of the Bank and reinvestment of the proceeds that are retained by the Company. In the future, Entegra may acquire or organize other operating subsidiaries, diversify into other banking-related activities, pay dividends and/or repurchase its stock, although there are no specific plans to undertake such activities at the present time.
RP® Financial, LC.
RP® Financial, LC. (“RP Financial”) is a financial consulting firm serving the financial services industry nationwide that, among other things, specializes in financial valuations and analyses of business enterprises and securities, including the pro forma valuation for savings institutions converting from mutual-to-stock form. The background and experience of RP Financial is detailed in Exhibit V-1. For its appraisal services, RP Financial is being compensated on a fixed fee basis for the original appraisal and for any subsequent updates, and such fees are payable regardless of the valuation conclusion or the completion of the conversion offering transaction. We believe that we are independent of the Company, the Bank, the MHC, and the other parties engaged by the Bank or the Company to assist in the stock conversion process.
Valuation Methodology
In preparing our Appraisal, we have reviewed the regulatory applications of Entegra, the Bank, and the MHC, including the prospectus as filed with the FRB, FDIC, Commissioner, and the Securities and Exchange Commission (“SEC”). We have conducted a financial analysis of the Company that has included a review of audited financial information for the past five years through the year ended December 31, 2013. To the extent we have conducted due diligence related discussions with Macon’s management; Dixon Hughes Goodman LLP, Macon’s independent auditor; Brooks, Pierce, McLendon, Humphrey & Leonard, L.L.P., Macon’s conversion counsel; and, Sandler O’Neill & Partners, L.P., Macon’s financial and marketing advisor in connection with the stock offering. All assumptions and conclusions set forth in the Appraisal were reached independently from such discussions. In addition, where appropriate, we have considered information based on other available published sources that we believe are reliable. While we believe the information and data gathered from all these sources are reliable, we cannot guarantee the accuracy and completeness of such information.
We have investigated the competitive environment within which Macon operates and have assessed the Company’s relative strengths and weaknesses. We have monitored all material regulatory and legislative actions affecting financial institutions generally and analyzed the potential impact of such developments on Macon and the industry as a whole to the extent we were aware of such matters. We have analyzed the potential effects of the stock conversion on the Company’s operating characteristics and financial performance as they relate to the pro forma market value of Entegra. We have reviewed the economy and demographic
Boards of Directors
February 14, 2014
Page 3
characteristics of the primary market area in which the Company currently operates. We have compared Macon’s financial performance and condition with publicly-traded thrift institutions evaluated and selected in accordance with the Valuation Guidelines, as well as all publicly-traded thrifts and thrift holding companies. We have reviewed conditions in the securities markets in general and the market for thrifts and thrift holding companies, including the market for new issues.
The Appraisal is based on Macon’s representation that the information contained in the regulatory applications and additional information furnished to us by the Company and its independent auditors, legal counsel, investment bankers, and other authorized agents are truthful, accurate and complete. We did not independently verify the financial statements and other information provided by the Company, or its independent auditors, legal counsel, investment bankers, and other authorized agents nor did we independently value the assets or liabilities of Macon. The valuation considers Macon only as a going concern and should not be considered as an indication of the Company’s liquidation value.
Our appraised value is predicated on a continuation of the current operating environment for the Company and for all thrifts and their holding companies. Changes in the local, state, and national economy, the federal and state legislative and regulatory environments for financial institutions, the stock market, interest rates, and other external forces (such as natural disasters or significant world events) may occur from time to time, often with great unpredictability, and may materially impact the value of thrift stocks as a whole or the Company’s value alone. It is our understanding that Macon intends to remain an independent institution and there are no current plans for selling control of the Company as a converted institution. To the extent that such factors can be foreseen, they have been factored into our analysis.
The estimated pro forma market value is defined as the price at which the Company’s stock, immediately upon completion of the offering, would change hands between a willing buyer and a willing seller, neither being under any compulsion to buy or sell and both having reasonable knowledge of relevant facts.
Valuation Conclusion
It is our opinion that, as of February 14, 2014, the estimated aggregate pro forma market value of the shares to be issued immediately following the conversion equaled $43,000,000 at the midpoint, equal to 4,300,000 shares offered at a per share value of $10.00. Pursuant to conversion guidelines, the 15% offering range indicates a minimum value of $36,550,000 and a maximum value of $49,450,000. Based on the $10.00 per share offering price determined by the Board, this valuation range equates to total shares outstanding of 3,655,000 at the minimum and 4,945,000 at the maximum. In the event the appraised value is subject to an increase, the aggregate pro forma market value may be increased up to a super maximum value of $56,867,500 without a resolicitation. Based on the $10.00 per share offering price, the super maximum value would result in total shares outstanding of 5,686,750.
Limiting Factors and Considerations
The valuation is not intended, and must not be construed, as a recommendation of any kind as to the advisability of purchasing shares of the common stock. Moreover, because such valuation is determined in accordance with applicable regulatory guidelines and is necessarily
Boards of Directors
February 14, 2014
Page 4
based upon estimates and projections of a number of matters, all of which are subject to change from time to time, no assurance can be given that persons who purchase shares of common stock in the conversion will thereafter be able to buy or sell such shares at prices related to the foregoing valuation of the estimated pro forma market value thereof. The appraisal reflects only a valuation range as of this date for the pro forma market value of Entegra immediately upon issuance of the stock and does not take into account any trading activity with respect to the purchase and sale of common stock in the secondary market on the date of issuance of such securities or at anytime thereafter following the completion of the public stock offering.
The valuation prepared by RP Financial in accordance with applicable regulatory guidelines, was based on the financial condition and operations of Macon as of December 31, 2013, the date of the financial data included in the prospectus.
RP Financial is not a seller of securities within the meaning of any federal and state securities laws and any report prepared by RP Financial shall not be used as an offer or solicitation with respect to the purchase or sale of any securities. RP Financial maintains a policy which prohibits RP Financial, its principals or employees from purchasing stock of its financial institution clients.
The valuation will be updated as provided for in the conversion regulations and guidelines. These updates will consider, among other things, any developments or changes in the financial performance and condition of Macon, management policies and current conditions in the equity markets for thrift stocks, both existing issues and new issues. These updates may also consider changes in other external factors which impact value including, but not limited to: various changes in the federal and state legislative and regulatory environments for financial institutions, the stock market in general, the market for thrift stocks, and interest rates. Should any such new developments or changes be material, in our opinion, to the valuation of the shares, appropriate adjustments to the estimated pro forma market value will be made. The reasons for any such adjustments will be explained in the update at the date of the release of the update. The valuation will also be updated at the completion of the stock offering.
| Respectfully submitted, |
| RP® FINANCIAL, LC. |
 |
William E. Pommerening |
| Managing Director |
 |
Marcus Faust |
| Managing Director |
| RP® Financial, LC. | OVERVIEW AND FINANCIAL ANALYSIS | |
| I.1 |
I. OVERVIEW AND FINANCIAL ANALYSIS
Introduction
Macon Bank, Inc. (“Macon Bank” or the “Bank”) is a North Carolina chartered stock savings bank headquartered in Franklin, North Carolina. The Bank was organized in 1922 as a North Carolina chartered mutual savings and loan association. In 1997, the Bank reorganized into the single-tier mutual holding company structure and Macon Bancorp, a North Carolina-chartered mutual holding company (the “MHC”) was formed. The MHC is regulated by the North Carolina Commissioner of Banks (the “Commissioner”) and the Federal Reserve Bank (“FRB”) of Richmond and its principal activity is owning 100% of the outstanding shares of common stock of Macon Bank. The MHC has one non-bank subsidiary, Macon Capital Trust I (“Macon Capital”), a Delaware statutory trust. Entegra Financial Corp. (“Entegra”), a North Carolina corporation organized in 2011 as “Macon Financial Corp.” and renamed “Entegra Financial Corp.” in 2014, has not engaged in any business to date other than matters of an organizational nature.
Pursuant to the conversion transaction (the “Conversion”), the MHC will merge with and into Entegra, which will own all of the outstanding shares of the Bank. Following the Conversion, the MHC will no longer exist. Hereinafter, unless otherwise noted, the discussion contained herein reflects the assets and liabilities of Macon Bancorp, inclusive of the Bank. For purposes of this Appraisal, the existing consolidated entity and Entegra will both be referred to as “Macon” or the “Company,” unless specifically indicated otherwise.
The Bank operates as a community-focused retail bank, originating real estate based mortgage, consumer and commercial loans and accepting deposits from consumers and small businesses through its corporate headquarters and 11 banking offices in Western North Carolina located in Macon, Henderson, Jackson, Polk, Cherokee and Transylvania Counties. The Bank has one wholly-owned subsidiary, Macon Services, Inc., which owns an investment real estate property. The majority of the Bank’s retail banking and depository activities are conducted within the six county primary market area. In addition, the Bank regularly extends credit to customers located in nearby counties including Buncombe, Clay, Haywood, and Rutherford in North Carolina; Fannin, Rabun, Towns, and Union in Georgia; and, Cherokee, Greenville, Oconee, Pickens, and Spartanburg in South Carolina.
The Bank is a member of the Federal Home Loan Bank (“FHLB”) system, and its deposits are insured up to the regulatory maximums by the Federal Deposit Insurance
| RP® Financial, LC. | OVERVIEW AND FINANCIAL ANALYSIS | |
| I.2 |
Corporation (“FDIC”). At December 31, 2013, the Company reported $784.6 million in assets, $684.2 million in deposits, and total equity of $32.5 million, equal to 4.14% of total assets. The Company’s audited financial statements are included by reference as Exhibit I-1 and key operating ratios are shown in Exhibit I-2.
Plan of Conversion
Macon has operated in a single-tier MHC form of organization since 1997, with the Bank regulated by the FDIC, while the MHC is regulated by the FRB. No shares were publicly issued at the time of the MHC reorganization. The respective Boards of Directors of the MHC and the Bank, adopted a plan of Conversion on January 23, 2014. Pursuant to the plan of Conversion, the MHC will merge with and into Entegra and in doing so, the organization will convert from the mutual holding company form of organization to the stock form of organization. As a result, Entegra will be the surviving entity and the Bank will become a wholly-owned subsidiary of Entegra. As part of the Conversion, Entegra will offer 100% of its common stock to eligible depositors of the Bank in a subscription offering and, if necessary, to members of the general public through community and syndicated offerings (the “Offering”). When the Conversion and Offering are completed, Entegra will own all of the outstanding common stock of the Bank, and all of the outstanding common stock of Entegra will be owned by public shareholders.
In addition to the Bank, Macon Capital will be a wholly-owned subsidiary of Entegra following the Conversion. Macon Capital was formed in 2003 to facilitate the issuance of $14.4 million of trust preferred securities (“subordinated debentures”) by the Company to Macon Capital, pursuant to which the Company downstreamed the funds into the Bank to qualify as Tier 1 capital. The interest payments on the subordinated debentures have been deferred for 12 consecutive quarters (since December 2010). Under the terms of the debenture, the Company may defer interest payments for a period of up to 20 consecutive quarters. In conjunction with the Offering, the Company intends to pay the deferred interest payments and resume debt service on the subordinated debentures.
At this time, no other activities are contemplated for the Company other than reinvestment of the proceeds that are retained by the Company. In the future, the Company may acquire or organize other operating subsidiaries, diversify into other banking-related activities, pay dividends or repurchase its stock, although there are no specific plans to undertake such activities at the present time.
| RP® Financial, LC. | OVERVIEW AND FINANCIAL ANALYSIS | |
| I.3 |
Use of Conversion Proceeds
Management has indicated that both the increased capital from the Conversion as well as being in the stock form of organization will facilitate the Bank’s compliance with its capital requirements as required by the Consent Order with the FDIC and the Commissioner dated March 26, 2012 (the “Order”). Over the longer term, the increased capital will facilitate the Company’s ability to expand the balance sheet and achieve other key corporate objectives. The projected uses of proceeds from the Conversion are highlighted below.
| • | Entegra. The Company is expected to retain up to 30% of the net offering proceeds. The amount of offering proceeds retained at the Company is dependent on the offering amount and is expected to range from 15% at the minimum to 30% at the supermaximum. At present, funds at the Company level are expected to be utilized to pay the deferred interest payments on subordinated debentures ($1.6 million as of December 31, 2013) and thereafter, continue to service the subordinated debentures, invest into short-term investment grade securities and liquid funds. Over time, the funds may be utilized for various corporate purposes, possibly including acquisitions, infusing additional equity into the Bank, repurchases of common stock, and the payment of cash dividends. |
| • | Macon Bank. At least 70% and up to 85% of the net stock proceeds will be infused into the Bank in exchange for all of the Bank’s stock. Cash proceeds (i.e., net proceeds less deposits withdrawn to fund stock purchases) infused into the Bank are anticipated to become part of general operating funds. |
Overall, it is the Company’s objective to satisfy the requirements of the Order (including the Bank’s minimum capital requirements under the Order) and the Written Agreement by and between the Company and the FRB of Richmond dated July 18, 2012 (the “Written Agreement”). Therefore, the Company expects to continue to preserve its capital position over the near term by limiting growth and continuing to focus on resolving problem assets with the objective of minimizing the Company’s credit risk exposure. Over the near to intermediate term, Macon will seek to undertake moderate loan and deposit growth and other strategies to enhance the Company’s long term earnings potential and shareholder returns.
Strategic Overview
Macon Bank is a service community bank, with a primary strategic objective of meeting the borrowing and savings needs of its local customer base. Historically, Macon’s operating strategy has been fairly reflective of a traditional thrift, in which 1-4 family residential mortgage loans and retail deposits have constituted the principal components of the Company’s assets and liabilities, respectively. In full the mid-1990s, the Company pursued implementation of a more diversified lending strategy into higher yielding and more rate sensitive types of loans.
| RP® Financial, LC. | OVERVIEW AND FINANCIAL ANALYSIS | |
| I.4 |
Lending diversification by the Company emphasized growth of construction and land loans and commercial real estate (“CRE”) loans. Importantly, the Company’s market area encompasses the Smoky Mountains and, thus, the regional market area’s attractiveness as a destination for outdoor recreational and leisure activities has had a significant influence on the local economy. Accordingly, a significant portion of the Company’s construction and land lending activities were sustained by demand for second homes in the regional market area.
The economic recession experienced nationally impacted the Company’s markets, in terms of job losses, increasing rates of unemployment, and a decrease in demand for second homes, which in turn, has resulted in increased loan delinquency rates and loan foreclosures. Additionally, real estate prices, including the prices of residential and income producing/commercial properties, diminished, continuing to erode the collateral value of the properties securing the Company’s mortgage loans and other real estate owned (“OREO”) properties. Over the past several years, the Company has substantially curtailed construction and land lending. CRE lending has also been de-emphasized as an area of lending diversification and, in response to the recessionary economic environment which resulted in operating losses and reduction in the Company’s regulatory capital ratios, an asset shrinkage strategy has been employed over the past four years. The objective of the balance sheet shrinkage was to reduce assets and preserve its regulatory capital ratios in face of operating losses and deteriorating credit quality.
As a result of the asset shrinkage strategy, loans in all categories decreased and construction and land loans decreased as a percent of total loans. However, construction and land loans and CRE loans continue to constitute the more significant areas of lending diversification in the Company’s loan portfolio. The Company’s lending activities going forward will continue to emphasize originations of 1-4 family permanent mortgage loans and emphasize commercial business loans as the primary area of lending diversification. Pursuant to targeting growth of commercial business loans, the Company will also place an emphasis on growing commercial deposit accounts through establishing full service banking relationships with its commercial borrowers. In support of growing the commercial loan portfolio, the Company recently added a commercial lender and is seeking to add additional commercial lending experience that can provide leadership in the new commercial business line. The Bank may also participate in commercial shared national credits (“SNCs”) to increase commercial production, as necessary. However, the Board has established conservative exposure limits regarding these commercial loan participations. Additionally, the Bank provides Small Business Administration (“SBA”) loans primarily to franchise owners and other small business customers throughout certain areas of the country.
| RP® Financial, LC. | OVERVIEW AND FINANCIAL ANALYSIS | |
| I.5 |
Reduction of non-performing assets (“NPAs”) continues to be a strategic priority for the Company and management has been focused on improving credit quality by establishing appropriate levels of valuation allowances and resolving NPAs. NPAs plus 90 day delinquent loans, including troubled debt restructurings (“TDRs”), have decreased to 6.26% of assets as of December 31, 2013, from the fiscal year end peak level of 9.50% as of December 31, 2010. Consequently, loan loss provisions impacted profitability significantly for fiscal 2009 through fiscal 2013. Although still elevated, the past two years have reflected significant declines in the provision for loan losses, $7.9 million for fiscal 2012 and $4.4 million for fiscal 2013, compared to the previous three years of extremely high loan loss provisions ($21.9 million for fiscal 2009, $18.9 million for fiscal 2010, and $24.1 million for fiscal 2011).
Going forward, the Company projects modest asset growth as the Company expects to continue to preserve its capital position over the near term. Total assets are projected to increase by approximately 10% from December 31, 2013 to December 31, 2016 funded by proceeds from the Conversion, modest deposit growth, and earnings. Loans are expected to increase 7.8% from December 31, 2013 to December 31, 2016 with the remaining asset growth in short-term investments. Loan growth is expected primarily in residential 1-4 family loans (including second mortgages and home equity loans) and commercial business loans, while commercial construction loans will continue to decrease and the other loan portfolios will remain relatively flat.
The Company reported pretax operating losses (excluding gains on the sale of investments) for each of the past four fiscal years. Significantly impacting earnings in each of these years was the extraordinarily large provisions for loan losses and high valuation losses on OREO. Additionally, the high level of NPAs adversely impacted the Company’s net interest margin (i.e., the high level of NPAs has increased non-interest earning assets) and the expenses related to problem assets increased the Company’s operating costs. The Company’s smaller earning asset base also contributed to the reduction in net interest income. The significantly reduced provisions for loan losses for the most recent two fiscal years and the gain on sale of investments over the same time period resulted in a pretax loss of $78,000 for fiscal 2012 and pretax income of $60,000 for fiscal 2013. Reported earnings for fiscal 2012 was net income of $933,000, or 0.11% of average assets and for fiscal 2013 was a net loss of $415,000, or 0.05% of average assets, respectively. For fiscal 2013, the Company’s pretax income
| RP® Financial, LC. | OVERVIEW AND FINANCIAL ANALYSIS | |
| I.6 |
resulted in a reported after tax loss due to an increase of $429,000 in its deferred tax asset (“DTA”) valuation allowance, which was recorded as tax expense. Conversely, for fiscal 2012, the Company’s pretax loss resulted in reported net income primarily due to tax benefits recognized related to tax exempt income from municipal securities and bank owned life insurance (“BOLI”).
The capital raised in the Conversion will enhance the Company’s earnings with the reinvestment of the net proceeds and will provide additional capital to address the NPAs over the near term and capital for growth through earnings over the longer term. The post-Offering business plan of the Company will continue to focus on near term problem asset resolution and modest growth of loans and core deposits.
The Company has developed an operating strategy to reposition the Company to return to profitability in the near term and explore growth opportunities over the longer term. Included in the Company’s strategy is to diversify its business both geographically and from a product perspective to reduce its concentration in real estate in Western North Carolina. Key objectives of the post-Conversion business strategy include the following:
Pursue Opportunities in Existing Markets
| • | Organic Growth. The Company is well established in its primary market area and intends to continue to increase market share in existing markets and expand into adjacent areas. The Company already makes loans in a number of adjacent counties and will consider opportunities to open loan production offices and/or branch offices as they arise. |
| • | Capitalize on Market Disruption. Management believes that the Company has a unique opportunity to attract new customers and hire additional experienced personnel based on the market disruption that was brought on by the recession, including local community banks undergoing name changes, management and ownership changes, reorganizations, branch closures and other business disruptions. |
Diversify Geography and Product Mix and Explore Growth Opportunities
| • | Increase the Small and Middle Market Commercial Banking Business. The Company will increase its focus on small and middle market commercial businesses; thereby increasing its originations of commercial business and SBA loans as a means to deploying investable funds profitably. Expanding the commercial banking business will further diversify the Company’s loan portfolio and increase fee income and low cost deposits by attracting commercial deposit accounts. |
| • | Explore Lending Opportunities in Larger, Contiguous Markets. The Company and its offices are located in close proximity to a number of larger |
| RP® Financial, LC. | OVERVIEW AND FINANCIAL ANALYSIS | |
| I.7 |
metropolitan markets with more attractive growth opportunities, such as Asheville and Charlotte in North Carolina, and Greenville, South Carolina. The Company intends to explore expansion opportunities into these markets in order to achieve geographic diversification for the Company’s loan portfolio and expand its customer base. |
| • | Continue to Improve Asset Quality. The resolution of NPAs and improvement of asset quality continues to be a priority of management over the near term. While asset quality trends have been improving over the past several years, non-performing assets (including performing TDRs) levels remain elevated. Although management believes that the majority of losses from defaults and problem assets are behind them, resolution of the remaining classifieds and non-performing assets is likely to result in some level of additional losses. |
Improve Profitability
| • | Continue to Reduce Problem Asset Expenses and Losses. As the level of problem assets decreased, so have the Company’s levels of provision for loan losses, valuation losses on OREO, and OREO expenses. These expenses have declined by $23.2 million or 70% to $10.0 million for fiscal 2013 compared to fiscal 2011, and the Company expects the declining trend to continue. |
| • | Grow Net Interest Income. For each of the past three years the decreases in net interest income as a result of the Company’s asset shrinkage and level of NPAs offset the increases in net interest income from margin improvement. As a result, the Company’s net interest income has remained flat for the past three years. With the benefit of the additional capital, the Company intends to pursue controlled growth in loans, which will have a positive impact on net interest income. In addition, the growth in higher interest earning commercial business loans will serve to increase the Company’s asset yield, while increases in commercial deposits and continued runoff of longer term brokered deposits and jumbo time deposits will reduce the Company’s cost of funds. |
| • | Deferred Tax Asset. Currently the Company has a DTA of $26.8 million, and a $22.6 million valuation allowance reducing the carrying value to $4.2 million. Under certain circumstances, including the Company achieving a consistent level of earnings, Macon will be able to reduce some or all of the deferred tax valuation allowance. |
| • | Continue History of Strong Core Earnings (pretax earnings excluding credit costs and non recurring items). The Company’s headquarter’s location in Western North Carolina provides a lower cost environment for the Company’s core operations. Management also carefully monitors and controls spending and heavily utilizes technology to drive efficiencies. Following the Conversion, growth in net interest income and non-interest income are expected to offset the increase in operating expenses related to the benefit plans and operating as a publicly traded company. |
Regulatory Agreements
The Order requires the Bank to address certain areas of operations and meet certain capital levels. Pursuant to the Order, the Bank has agreed to the following, among other things:
| (1) | Increase Board of Directors participation in the affairs of the Bank, assuming full responsibility for the approval of sound policies and objectives and for the supervision of all the Bank’s activities, consistent with the role and expertise commonly expected for directors of banks of comparable size. |
| RP® Financial, LC. | OVERVIEW AND FINANCIAL ANALYSIS | |
| I.8 |
| (2) | Establish a Board committee to oversee the Bank’s compliance with the Order. |
| (3) | Designate a Board of Directors’ committee to review and approve loans of $1.0 million or greater. |
| (4) | Develop and approve a written analysis and assessment of the Bank’s management and staffing needs (“Management Plan”) and have and retain qualified management. |
| (5) | Maintain an amount of Tier 1 capital equal to or exceeding 8% of its total assets and Total Risk Based capital equal to or exceeding 11% of the Bank’s total risk-weighted assets. |
| (6) | Submit a written capital plan that (i) details the steps the Bank will take to achieve and maintain the capital requirements of the Order as noted above and (ii) includes a contingency plan. |
| (7) | Submit a written plan to reduce the classified assets in the Report of Examination dated November 14, 2011 (“the Report”) or any future regulatory examination report. The plan shall address each classified asset greater than $350,000. The plan shall contain a schedule detailing the projected reduction of classified assets on a quarterly basis using quarterly targets as a percentage of the Bank’s Tier 1 capital plus the Bank’s allowance for loan and lease losses (“ALLL”). |
| (8) | Submit a Concentration Reduction Plan for systematically reducing and monitoring the Bank’s CRE loan concentration identified in the Report to an amount commensurate with the Bank’s business strategy, management expertise, size and location. |
| (9) | Submit written lending and collection policy with specific guidelines for credit concentrations, placing loans on nonaccrual status, limitations on interest reserves and deferred payment plans, procedures to ensure the appropriate underwriting is performed prior to purchasing loan participations and provisions which establish a written policy governing the Bank’s Other Assets. |
| (10) | Provide notice to supervisory authorities prior to undertaking asset growth that exceeds 10% per annum or initiating material changes in asset or liability composition. |
| (11) | Review and revise, as necessary, the Bank’s policy and procedures for managing interest rate risk. |
| (12) | Review the adequacy of the Bank’s ALLL and establish a policy to determine and maintain an adequate ALLL. |
| (13) | Submit a written business/strategic plan that establishes objectives and strategies for the Bank’s earnings performance, growth, balance sheet mix, liability structure, capital adequacy and reduction of nonperforming and underperforming assets. |
| (14) | Not declare or pay dividends, bonuses, or make any other form of payment outside the ordinary course of business resulting in a reduction of capital, without prior written supervisory approval. |
| RP® Financial, LC. | OVERVIEW AND FINANCIAL ANALYSIS | |
| I.9 |
| (15) | Eliminate and/or correct all reported violations of laws, regulations, and/or contraventions of statements of policy, and adopt and implement appropriate procedures to ensure future compliance. |
| (16) | Not accept, renew or rollover any brokered deposits, without prior regulatory approval. |
| (17) | Implement a written plan and comprehensive budget for all income and expense categories. |
The Bank has submitted the required plans and the remediation actions and management believes the Bank is generally in compliance with the Order, except the Bank has a Tier 1 capital ratio of 7.02%, which does not meet the required 8% as of December 31, 2013.
Pursuant to the Written Agreement, the Company has agreed, among other things, to the following:
| (1) | Take appropriate steps to fully utilize the MHC’s financial and managerial resources to serve as a source of strength to the Bank including taking steps to ensure the Bank complies with the Order. |
| (2) | Not declare or pay dividends without the prior written approval of supervisory authorities. |
| (3) | Not directly or indirectly take dividends or any other form of payment representing a reduction in capital from the Bank without approval of the FRB. |
| (4) | Not make any distributions of interest, principal or other sums on the Company’s subordinated debentures without written approval from supervisory authorities. |
| (5) | Submit an acceptable written plan to maintain sufficient capital at the Company on a consolidated basis. |
| (6) | Not, directly or indirectly, incur, increase or guarantee any debt without prior written approval of the FRB. |
| (7) | Not, directly or indirectly, purchase or redeem any shares of its stock without prior written approval of the FRB. |
| (8) | Submit to the FRB a statement of its planned sources and uses of cash for debt service, operating expenses and other purposes (“Cash Flow Projection”) annually. |
| (9) | Comply with the applicable notice provisions in appointing any new director or senior executive officer, or changing the responsibilities of any senior executive officer. |
| (10) | Comply with the applicable laws and regulations on indemnification and severance payments. |
| RP® Financial, LC. | OVERVIEW AND FINANCIAL ANALYSIS | |
| I.10 |
Management believes the Company is currently in compliance with the Written Agreement.
Balance Sheet Trends
Growth Trends
Table 1.1 shows the Company’s historical balance sheet data for the past five years through December 31, 2013. Balance sheet growth trends for the Company are presented in Table 1.1, highlighting the trends noted previously. From fiscal 2009 to fiscal 2013, the Company’s total assets declined at a 7.7% compounded annual rate or by 27.3% ($294.0 million) in aggregate over the past four years, to equal $784.6 million as of December 31, 2013. Importantly, total assets increased $14.6 million or by 1.9% over the past year. Asset composition in terms of loans and investments remained relatively unchanged through the years 2010 to 2012 with loans approximating 70.0% of assets; however, as of December 31, 2013, loans to assets decreased to 64.7%, as the growth in deposits and borrowings during 2013 was funneled into cash and investments, while loans receivable continued to decrease. As a result, cash and investments (including FHLB stock) as a percent of assets was 27.2% as of December 31, 2013, as compared to 22.4% at December 31, 2009.
The Company’s assets are funded through a combination of deposits, borrowings and retained earnings. Deposits have always comprised the majority of funding liabilities, but decreased at a modest 3.5% compounded annual rate since December 31, 2009 primarily due to the $92.9 million decline in brokered deposits, consistent with the Company’s objectives to shrink the balance sheet and reduce brokered deposits. However, the majority of balance sheet shrinkage was the result of the repayment of outstanding FHLB advances, which decreased at a compounded annual rate of 31.2%, or 77.6% in aggregate. Specifically, FHLB advances which had a balance of $178.4 million as of December 31, 2009, were paid down to $25.0 million as of December 31, 2012; however, the Company increased its FHLB borrowings in the fourth quarter of fiscal 2013 by $15 million to take advantage of the current low interest rates and extend the average life of its liabilities, therefore FHLB advances totaled $40.0 million as of December 31, 2013. There has been no change in the amount of outstanding subordinated debentures over the past four fiscal years. However, the Company has deferred the interest payments since December 2010.
Equity has diminished at a 20.6% compounded annual rate since December 31, 2009, or by 60.2% in aggregate, primarily as a result of net losses incurred in fiscal years 2010
| RP® Financial, LC. | OVERVIEW AND FINANCIAL ANALYSIS | |
| I.11 |
Table 1.1
Macon Bancorp
Historical Balance Sheet Data
At Year Ended December 31, | 12/31/09- 12/31/13 Annual. Growth Rate | |||||||||||||||||||||||||||||||||||||||||||
| 2009 | 2010 | 2011 | 2012 | 2013 | ||||||||||||||||||||||||||||||||||||||||
| Amount | Pct(1) | Amount | Pct(1) | Amount | Pct(1) | Amount | Pct(1) | Amount | Pct(1) | Pct | ||||||||||||||||||||||||||||||||||
| ($000) | (%) | ($000) | (%) | ($000) | (%) | ($000) | (%) | ($000) | (%) | (%) | ||||||||||||||||||||||||||||||||||
Total Amount of: | ||||||||||||||||||||||||||||||||||||||||||||
Assets | $ | 1,078,537 | 100.00 | % | $ | 1,021,777 | 100.00 | % | $ | 874,706 | 100.00 | % | $ | 769,939 | 100.00 | % | $ | 784,554 | 100.00 | % | -7.65 | % | ||||||||||||||||||||||
Cash and cash equivalents | 34,344 | 3.18 | % | 18,048 | 1.77 | % | 14,601 | 1.67 | % | 25,362 | 3.29 | % | 34,316 | 4.37 | % | -0.02 | % | |||||||||||||||||||||||||||
Investment securities | 194,977 | 18.08 | % | 218,197 | 21.35 | % | 192,150 | 21.97 | % | 131,091 | 17.03 | % | 176,472 | 22.49 | % | -2.46 | % | |||||||||||||||||||||||||||
Loans held for sale | 302 | 0.03 | % | 210 | 0.02 | % | 0 | 0.00 | % | 745 | 0.10 | % | 5,688 | 0.72 | % | 108.32 | % | |||||||||||||||||||||||||||
Loans receivable, net | 753,966 | 69.91 | % | 698,309 | 68.34 | % | 598,839 | 68.46 | % | 545,850 | 70.90 | % | 507,623 | 64.70 | % | -9.42 | % | |||||||||||||||||||||||||||
FHLB stock | 12,288 | 1.14 | % | 10,979 | 1.07 | % | 6,490 | 0.74 | % | 2,437 | 0.32 | % | 2,724 | 0.35 | % | -31.38 | % | |||||||||||||||||||||||||||
Bank-owned life insurance | 17,701 | 1.64 | % | 18,315 | 1.79 | % | 18,943 | 2.17 | % | 19,479 | 2.53 | % | 19,961 | 2.54 | % | 3.05 | % | |||||||||||||||||||||||||||
Other real estate owned | 22,829 | 2.12 | % | 21,511 | 2.11 | % | 16,830 | 1.92 | % | 19,755 | 2.57 | % | 10,506 | 1.34 | % | -17.64 | % | |||||||||||||||||||||||||||
Mortgage servicing rights | 3,024 | 0.28 | % | 2,534 | 0.25 | % | 2,314 | 0.26 | % | 1,908 | 0.25 | % | 1,883 | 0.24 | % | -11.17 | % | |||||||||||||||||||||||||||
Deposits | $ | 790,408 | 73.29 | % | $ | 798,419 | 78.14 | % | 750,832 | 85.84 | % | $ | 675,098 | 87.68 | % | $ | 684,226 | 87.21 | % | -3.54 | % | |||||||||||||||||||||||
FHLB advances | 178,400 | 16.54 | % | 128,400 | 12.57 | % | 52,400 | 5.99 | % | 25,000 | 3.25 | % | 40,000 | 5.10 | % | -31.19 | % | |||||||||||||||||||||||||||
Trust preferred debentures | 14,433 | 1.34 | % | 14,433 | 1.41 | % | 14,433 | 1.65 | % | 14,433 | 1.87 | % | 14,433 | 1.84 | % | 0.00 | % | |||||||||||||||||||||||||||
Equity | $ | 81,631 | 7.57 | % | $ | 65,968 | 6.46 | % | $ | 43,484 | 4.97 | % | $ | 42,294 | 5.49 | % | $ | 32,518 | 4.14 | % | -20.55 | % | ||||||||||||||||||||||
Full Service Banking Offices Open | 11 | 11 | 11 | 11 | 11 | |||||||||||||||||||||||||||||||||||||||
| (1) | Ratios are as a percent of ending assets. |
Sources: Macon Bancorp’s prospectus, audited and unaudited financial statements, and RP Financial calculations.
| RP® Financial, LC. | OVERVIEW AND FINANCIAL ANALYSIS | |
| I.12 |
and 2011. In addition, the change in the unrealized gain/loss on securities available for sale (“AFS”), from December 31, 2012 to December 31, 2013 contributed to a decrease of $9.8 million in equity ($2.3 million in unrealized gains at December 31, 2009 versus $7.5 million unrealized losses at December 31, 2013). Although the Company has been shrinking its balance sheet at the same time, the equity to assets ratio declined to 4.1% at December 31, 2013, as compared to 7.6% at December 31, 2009. All the Company’s equity is tangible and will increase with the completion of the Conversion. The post-Offering equity growth rate will largely be a function of the Company’s ability to improve asset quality and stem the level of loan loss provisions and valuation losses on OREO. In addition, under certain circumstances (including the Company’s ability to generate future taxable earnings, not triggering a change in control under the Internal Revenue Code, among other items), the Company’s valuation allowance on its DTA could be reversed, positively impacting capital.
Loans Receivable
The Company’s loan portfolio balance has been decreasing since the end of fiscal 2009, as the Company executed its asset shrinkage strategy and retrenched from portfolio lending as the level of classified assets and NPAs were high. While all of the loan categories decreased over the five year period, the majority of the loan portfolio shrinkage has been realized in the construction and land portfolio, declining $145.7 million or 66.4% since December 31, 2009. Macon’s loan portfolio composition as of December 31, 2013 consist of 43.1% of 1-4 family residential loans, 28.4% of CRE loans, 14.1% of construction/land loans, 10.9% of home equity loans and lines of credit, 1.6% of commercial business loans, 1.3% of multifamily loans, and 0.7% of consumer loans.
Shrinkage in the residential loan portfolio has resulted from low loan demand in the local market area and, in part, from low interest rates, which has increased demand for loans with maturities in excess of 15 years, which the Company typically sells into the secondary market. For the past several years, the Bank has curtailed its construction and land lending due to the increase in problem assets stemming from this portfolio and as a result, charge offs and foreclosures contributed to the decrease in outstanding construction and land loans.
Cash and Cash Equivalents, Investments and Mortgage-Backed Securities
As of December 31, 2013, the Company’s portfolio of cash and cash equivalents totaled $34.3 million, equal to 4.4% of assets. In 2013, the Company transferred $21.0 million of structured agency securities from AFS to held to maturity (“HTM”). At December 31, 2013, the
| RP® Financial, LC. | OVERVIEW AND FINANCIAL ANALYSIS | |
| I.13 |
total investment portfolio (AFS and HTM) totaled $176.5 million, equal to 22.5% of total assets (see Exhibit I-3 for the investment portfolio composition). MBS comprised the largest segment of the investment portfolio, totaling $107.4 million, or 13.7% of assets and 60.9% of investment securities as of December 31, 2013. The MBS were primarily US Government agencies; however, the Company also held $18.2 million in SBA securities and $3.0 million in collateralized mortgage obligations. The balance of the investment portfolio was comprised of US Government and agency securities ($42.9 million), municipal securities ($25.6 million), and mutual funds ($0.6 million).
Proceeds from the Conversion will be invested in short term securities until redeployed into loans and the level of cash and investments is anticipated to increase following the Conversion.
Bank Owned Life Insurance
As of December 31, 2013, the balance of BOLI totaled $20.0 million, or 2.5% of assets, which reflects modest increases over the last four fiscal years owing to increases in the cash surrender value of the policies. The balance of the BOLI reflects the value of life insurance contracts on selected members of the Company’s management and has been purchased with the intent to offset various benefit program expenses on a tax-advantaged basis. The increase in the cash surrender value of the BOLI is recognized as an addition to non-interest income on an annual basis.
Funding Structure
Retail deposits have consistently served as the primary funding source for the Company, while borrowings, brokered deposits and Internet deposits have been utilized to fund growth and manage interest rate risk. Time deposits or Certificates of Deposit (“CDs”) constitute the largest portion of the Company’s deposit base. In accordance with the Order, the current practice is to repay brokered deposits at maturity and not renew or roll over for additional terms. The Company utilizes borrowings as a supplemental funding source to facilitate management of funding costs and interest rate risk. FHLB advances constitute the primary source of borrowings utilized by the Company, while other borrowings utilized by the Company are generally limited to federal funds. The Company also maintains $14.4 million of subordinated debentures, which was down-streamed into the Bank as equity for the purpose of increasing Tier 1 capital.
| RP® Financial, LC. | OVERVIEW AND FINANCIAL ANALYSIS | |
| I.14 |
The deposit composition has changed modestly over the years, as overall deposits have decreased at an annual rate of 3.54% since fiscal 2009 primarily due to the decrease in brokered deposits. Over the past two years, demand deposits and savings accounts increased while brokered deposits, CDs and money market accounts (“MMAs”) have declined. Since the end of fiscal 2011, the proportion of demand accounts (interest bearing and non-interest bearing) has increased from 15.5% to 21.4%, and the proportion of retail CDs (including $45.0 million in Internet or listing deposits as of December 31, 2013) to total deposits increased slightly from 43.7% to 45.8%, while brokered deposits to total deposits has diminished from 13.6% to 2.4%. Savings and MMAs remained relatively consistent as a percent of total deposits and represent 3.8% and 26.6% of total deposits as of December 31, 2013.
Equity
Equity totaled $32.5 million, equal to 4.14% of assets as of December 31, 2013. As noted previously, the Company’s capital base has diminished at a 20.6% compounded annual rate since the end of fiscal 2009, reflecting the impact of operating losses which have primarily resulted from deteriorating asset quality resulting in high loan loss provisions, loan charge offs, and valuation losses on OREO. Two other significant items also impacting equity as of December 31, 2013, were the $22.6 million valuation allowance on the Company’s DTA and the $7.5 million in accumulated other comprehensive loss ($5.5 million unrealized losses on AFS securities and $2.0 million unrealized loss on AFS securities transferred to HTM). Under certain circumstances (including the Company’s ability to generate future taxable earnings, not triggering a change in control under the Internal Revenue Code, among other items), the Company’s valuation allowance on its DTA could be reversed, positively impacting capital. The Offering proceeds will serve to further strengthen the Company’s regulatory capital position and ability to continue to resolve problem assets.
All of the Company’s capital is tangible capital. The Bank currently does not meet the elevated regulatory capital requirements set forth in the Order. It is anticipated that the infusion of net proceeds realized from the Conversion will address the capital requirements of the Order.
Income and Expense Trends
Table 1.2 shows the Company’s historical income statements for the past five fiscal years ended December 31, 2013. The Company’s earnings ranged from a net loss of $26.0
| RP® Financial, LC. | OVERVIEW AND FINANCIAL ANALYSIS | |
| I.15 |
Table 1.2
Macon Bancorp
Historical Income Statements
| For the Year Ended December 31, | ||||||||||||||||||||||||||||||||||||||||
| 2009 | 2010 | 2011 | 2012 | 2013 | ||||||||||||||||||||||||||||||||||||
| Amount | Pct(1) | Amount | Pct(1) | Amount | Pct(1) | Amount | Pct(1) | Amount | Pct(1) | |||||||||||||||||||||||||||||||
| ($000) | (%) | ($000) | (%) | ($000) | (%) | ($000) | (%) | ($000) | (%) | |||||||||||||||||||||||||||||||
Interest income | $ | 56,020 | 5.04 | % | $ | 47,326 | 4.41 | % | $ | 39,483 | 4.21 | % | $ | 34,274 | 4.04 | % | $ | 31,257 | 3.77 | % | ||||||||||||||||||||
Interest expense | (26,115 | ) | -2.35 | % | (20,451 | ) | -1.91 | % | (14,572 | ) | -1.55 | % | (9,635 | ) | -1.14 | % | (6,988 | ) | -0.84 | % | ||||||||||||||||||||
|
|
|
|
|
|
|
|
|
|
|
|
|
|
|
|
|
|
|
| |||||||||||||||||||||
Net interest income | $ | 29,905 | 2.69 | % | $ | 26,875 | 2.51 | % | $ | 24,911 | 2.66 | % | $ | 24,639 | 2.90 | % | $ | 24,269 | 2.92 | % | ||||||||||||||||||||
Provision for loan losses | (21,851 | ) | -1.96 | % | (18,926 | ) | -1.77 | % | (24,116 | ) | -2.57 | % | (7,878 | ) | -0.93 | % | (4,358 | ) | -0.53 | % | ||||||||||||||||||||
|
|
|
|
|
|
|
|
|
|
|
|
|
|
|
|
|
|
|
| |||||||||||||||||||||
Net interest income after provisions | $ | 8,054 | 0.72 | % | $ | 7,949 | 0.74 | % | $ | 795 | 0.08 | % | $ | 16,761 | 1.98 | % | $ | 19,911 | 2.40 | % | ||||||||||||||||||||
Other operating income | $ | 4,540 | 0.41 | % | $ | 3,981 | 0.37 | % | $ | 3,754 | 0.40 | % | $ | 3,941 | 0.46 | % | $ | 3,750 | 0.45 | % | ||||||||||||||||||||
Mortgage banking income | 2,336 | 0.21 | % | 1,043 | 0.10 | % | 960 | 0.10 | % | 979 | 0.12 | % | 2,281 | 0.27 | % | |||||||||||||||||||||||||
Other operating expenses | ($ | 21,534 | ) | -1.94 | % | ($ | 20,064 | ) | -1.87 | % | ($ | 25,069 | ) | -2.67 | % | ($ | 21,761 | ) | -2.57 | % | ($ | 21,984 | ) | -2.65 | % | |||||||||||||||
Valuation losses on other real estate owned | (8,690 | ) | -0.78 | % | (5,127 | ) | -0.48 | % | (6,681 | ) | -0.71 | % | (3,292 | ) | -0.39 | % | (4,256 | ) | -0.51 | % | ||||||||||||||||||||
|
|
|
|
|
|
|
|
|
|
|
|
|
|
|
|
|
|
|
| |||||||||||||||||||||
Total operating expenses | ($ | 30,224 | ) | -2.72 | % | ($ | 25,191 | ) | -2.35 | % | ($ | 31,750 | ) | -3.39 | % | ($ | 25,053 | ) | -2.95 | % | ($ | 26,240 | ) | -3.16 | % | |||||||||||||||
Net operating income | ($ | 15,294 | ) | -1.37 | % | ($ | 12,218 | ) | -1.14 | % | ($ | 26,241 | ) | -2.80 | % | ($ | 3,372 | ) | -0.40 | % | ($ | 298 | ) | -0.04 | % | |||||||||||||||
Non-operating income (expense) | ||||||||||||||||||||||||||||||||||||||||
Gain (loss) on sale of investments | $ | 1,416 | 0.13 | % | $ | 1,665 | 0.16 | % | $ | 1,635 | 0.17 | % | $ | 3,294 | 0.39 | % | $ | 358 | 0.04 | % | ||||||||||||||||||||
Net income before tax | ($ | 13,878 | ) | -1.25 | % | ($ | 10,553 | ) | -0.98 | % | ($ | 24,606 | ) | -2.62 | % | ($ | 78 | ) | -0.01 | % | $ | 60 | 0.01 | % | ||||||||||||||||
Income tax expense (benefit) | (6,091 | ) | -0.55 | % | 3,705 | 0.35 | % | 1,374 | 0.15 | % | (1,011 | ) | -0.12 | % | 475 | 0.06 | % | |||||||||||||||||||||||
|
|
|
|
|
|
|
|
|
|
|
|
|
|
|
|
|
|
|
| |||||||||||||||||||||
Net income (loss) | ($ | 7,787 | ) | -0.70 | % | ($ | 14,258 | ) | -1.33 | % | ($ | 25,980 | ) | -2.77 | % | $ | 933 | 0.11 | % | ($ | 415 | ) | -0.05 | % | ||||||||||||||||
Expense Coverage Ratio (2) | 98.9 | % | 106.7 | % | 78.5 | % | 98.3 | % | 92.5 | % | ||||||||||||||||||||||||||||||
Efficiency Ratio (3) | 82.2 | % | 79.0 | % | 107.2 | % | 84.8 | % | 86.6 | % | ||||||||||||||||||||||||||||||
Effective Tax Rate (Benefit) | -43.9 | % | 35.1 | % | 5.6 | % | -1296.2 | % | -791.7 | % | ||||||||||||||||||||||||||||||
| (1) | Ratios are as a percent of average assets. |
| (2) | Expense coverage ratio calculated as net interest income before provisions for loan losses divided by total operating expenses. |
| (3) | Efficiency ratio calculated as operating expenses divided by the sum of net interest income before provisions for loan losses plus other income (excluding net gains). |
Sources: Macon Bancorp’s prospectus, audited & unaudited financial statements and RP Financial calculations.
| RP® Financial, LC. | OVERVIEW AND FINANCIAL ANALYSIS | |
| I.16 |
million, or 2.77% of average assets for fiscal 2011 to net income of $933,000, or 0.11% of average assets for fiscal 2012. For fiscal 2013, the Company reported a net loss of $415,000, or 0.05% of average assets. The Company’s reported net losses over the past five year period were largely related to credit quality deterioration that resulted in significant increases in the amount of loan loss provisions established and valuation losses on OREO. In addition, for fiscal 2010 and 2011, losses increased as the Company established a valuation allowance on its DTA.
Net Interest Income
Net interest income declined steadily from fiscal 2009 to fiscal 2011, while net interest income has remained at the 2011 level or approximately $24 million since then. The Company’s overall asset shrinkage and increases in nonaccrual loans and OREO is the primary driver negatively impacting the Company’s net interest income in each of the past four years. Net interest income for fiscal 2010 declined $3.0 million over the year, primarily due to a shrinking interest earning asset base while for fiscal 2011, net interest income further decreased by $2.0 million, despite an improvement in net interest margin (as reflected in the 15 basis points increase in net interest income to average assets compared to the year prior). For fiscal 2012 and 2013, the Company continued to make improvements in the net interest margin; however, the benefits from an increasing net interest margin were offset by the continued decline in earning assets resulting in net interest income remaining flat for the past three years. As shown in Table 1.2, net interest income to average assets increased steadily for fiscal 2011 through 2013 reflecting an increase of 26 basis points, yet, net interest income for fiscal 2013 of $24.3 million was $642,000 less than net interest income for fiscal 2010.
The improving net interest margin over the past three years was due to a decrease in the cost of funds as reflected in interest expense to average assets down 71 basis points for fiscal 2013 compared to fiscal 2010. Over the same period, the Company’s interest income to average assets declined 44 basis points, respectively, primarily due to increases in non-accruing loans and OREO.
The impact of decreasing earning assets as a result of the Company’s asset shrinkage and increases in nonaccrual loans and OREO are more fully evidenced in the detailed financial data shown in Table 1.2, as interest income diminished from $56.0 million (5.04% of average assets) in fiscal 2009, to $31.3 million (3.77% of average assets) for fiscal 2013. Over the corresponding timeframe, the annual interest expense diminished by a smaller amount, from
| RP® Financial, LC. | OVERVIEW AND FINANCIAL ANALYSIS | |
| I.17 |
$26.1 million (2.35% of average assets) to $7.0 million (0.84% of average assets) for fiscal 2013. As a result of the foregoing trends in interest income and expense, net interest income has decreased from $29.9 million (2.69% of average assets) in fiscal 2009, to $24.3 million (2.92% of average assets) reported for fiscal 2013. However, the Company’s steadily improving net interest spread and net interest margin over the past three years offset the loss of net interest income from asset shrinkage and resulted in net interest income effectively leveling out for fiscal years 2011 through 2013. The Company’s asset yields, rates on interest bearing liabilities, net interest rate spreads and yields for the past three years are set forth in Exhibit I-4.
Several factors may impact the Company’s future spreads and net interest income. First, the benefit of declining funding costs is expected to continue modestly as longer term brokered deposits mature and roll off and longer term jumbo deposits mature and reprice. At the same time, the reduction of NPAs is a key strategy of management and the ratio of NPAs has recently reflected an improving trend. To the extent remaining NPAs can be returned to earning assets, interest income would improve. Last, the completion of the Conversion will provide the Company with additional interest-free funds to reinvest with limited balance sheet growth in the near term, while over the longer-term, the Company expects to support balance sheet growth including expansion of interest-earning assets at a positive spread.
Loan Loss Provisions
Provisions for loan losses have been significant over the past five years, reflecting the Company’s asset quality. However, trends in the past two years represent declines in the provisions for loan losses. The majority of the loan portfolio is secured by real estate collateral in the Company’s market area. However, since fiscal 2009, the Company has recorded elevated loan loss provisions in response to deteriorating asset quality and significant loan charge offs. Specifically, loan loss provisions reported by the Company peaked in fiscal year 2011 at $24.1 million, or 2.57% of average assets, declining to $7.9 million, or 0.93% of average assets and $4.4 million, or 0.53% of average assets for fiscal years 2012 and 2013.
At December 31, 2013, the Company maintained an ALLL of $14.3 million, equal to 2.73% of loans held for investment, 36.88% of non-performing loans (includes nonaccrual loans and performing TDRs) or 91.19% of non-performing loans excluding performing TDRs. Exhibit I-5 sets forth the Company’s ALLL activity during the review period. Going forward, the Company will continue to evaluate the adequacy of the level of the ALLL on a regular basis and establish additional loan loss provisions in accordance with the Company’s asset classification and loss reserve policies.
| RP® Financial, LC. | OVERVIEW AND FINANCIAL ANALYSIS | |
| I.18 |
Non-Interest Income
Non-interest operating income has declined since fiscal 2009, but has remained relatively constant for the four years through fiscal 2013 ranging from $4.0 million or 0.37% of average assets for fiscal 2010 to $3.8 million or 0.45% of assets for fiscal 2013. In addition to customer service fees, BOLI income is the other major contributor to the Company’s non-interest operating income.
Mortgage banking income consist of gains on the sale of loans, loan servicing income offset by the amortization of mortgage servicing rights (“MSRs”) and has fluctuated over the past five years primarily driven by the volume of loan sales. For fiscal 2013, mortgage banking income totaled $2.3 million, or 0.27% of average assets.
Operating Expenses
Other operating expenses (excluding valuation losses on OREO) represent a major component of the Company’s earnings, ranging from a low of 1.87% of average assets during 2010 to a high of 2.67% of average assets during 2011. For fiscal 2013, other operating expenses represented 2.65% of average assets. Asset shrinkage combined with higher operating expenses both contributed to the fluctuation in the Company’s operating expense ratio during the past three years. The significant increase in operating expenses for fiscal 2011 is primarily related to $1.4 million of FHLB advance prepayment penalties that were recorded in the first quarter of 2011. Upward pressure will be placed on the Company’s operating expense ratio following the Offering, due to expenses associated with the stock-related benefit plans and operating as a publicly-traded company. At the same time, the increase in capital realized from the Offering will increase the Company’s capacity to leverage operating expenses through resumption of balance sheet growth. Further, if the Company is successful in the continued resolution of problem assets, this should result in lower operating expenses going forward.
Valuation losses on OREO represent the write-downs, gains, and losses on OREO. Valuation losses on OREO have fluctuated during the period, peaking in the year 2009 at $8.7 million or 0.78% of average assets compared to the low of $3.3 million or 0.39% of average assets for fiscal 2012. As of December 31, 2013, OREO totaled $10.5 million, down from $19.8 million as of December 31, 2012. Valuation losses on OREO increased over fiscal 2013 to $4.3 million, compared to $3.3 million for fiscal 2012, reflecting continued decreasing real estate market values and the increasing rate in which the Company was disposing of the OREO properties.
| RP® Financial, LC. | OVERVIEW AND FINANCIAL ANALYSIS | |
| I.19 |
Taxes
The Company has been in a fully taxable position for most of its operating history. In fiscal 2009, the Company reported a tax benefit of $6.1 million on operating losses equal to $13.9 million. However, in 2010, the Company determined a valuation allowance on a portion of its DTA was necessary and was recorded in 2010 and 2011. As of December 31, 2013, the Company’s DTA totaled $26.8 million and there was a valuation allowance equal to $22.6 million against this asset resulting in a net DTA equal to $4.2 million. As of December 31, 2013, the Company has NOL carry-forwards to offset $34.1 million for federal income tax purposes and $42.5 million for state income tax purposes. To the extent the Company can reasonably expect taxable earnings in the future, the valuation allowance on the DTA, or portions thereof could be reversed, positively impacting capital. At the same time, as described in the prospectus, the full benefit of the NOLs and realization of the DTA benefit may be dependent upon participation of depositors in the Conversion and the post-Conversion ownership structure of the Company, both immediately following the Conversion and subsequently in the future.
As set forth in the prospectus, the Company’s effective tax rate going forward (after the reversal of the DTA valuation allowance) approximates 30% and is influenced by the level of tax exempt income received from BOLI and municipal securities.
Interest Rate Risk Management
The Company pursues a number of strategies to manage interest rate risk, particularly with respect to seeking to limit the repricing mismatch between interest rate sensitive assets and liabilities. The Company manages interest rate risk primarily from the asset side of the balance sheet through selling originations of fixed rate 1-4 family mortgage loans to the secondary market, maintaining an investment portfolio with varied maturities and diversifying into other types of lending beyond 1-4 family mortgage loans, which consists primarily of shorter term fixed rate loans, adjustable rate loans, or balloon loans. As of December 31, 2013, adjustable rate loans comprised approximately 66.0% of total loans. On the liability side of the balance sheet, management of interest rate risk has been pursued through utilizing FHLB borrowings with terms of up to five years, emphasizing growth of lower costing and less interest rate sensitive core deposits and offering attractive rates on certain longer term CDs during periods when interest rates are low. In the fourth quarter of 2013, the Company extended its liabilities through $15 million in fixed rate FHLB borrowings with an approximate average life of two years.
| RP® Financial, LC. | OVERVIEW AND FINANCIAL ANALYSIS | |
| I.20 |
The interest rate risk analysis as of December 31, 2013 (see Exhibit I-6) reflects that in the event of a further decline in interest rates from the current low levels, the Bank’s net portfolio value (“NPV”) would increase. Conversely, rising interest rates are estimated to have an unfavorable impact on the Bank’s NPV. A 100, 200, or 300 basis point increase in interest rates decreases NPV by 9.05%, 15.70%, and 21.06%, respectively, while a decline in rates of 100 basis points increases the Bank’s NPV by 5.10%.
The infusion of stock proceeds will serve to further limit the Company’s interest rate risk exposure, as most of the net proceeds will be redeployed into interest-earning assets and the increase in the Company’s capital will lessen the proportion of interest rate sensitive liabilities funding assets.
Lending Activities and Strategy
The Company’s loan portfolio balance has been diminishing since the end of fiscal 2009, as the Company executed its asset shrinkage strategy, limited portfolio lending, substantially curtailed construction and land lending and de-emphasized CRE loans as the level of problem assets were high. Going forward, the Bank’s lending activity will be focused on loans to consumers and businesses located in its local markets and expanded market area including Buncombe, Clay, Haywood and Rutherford counties in North Carolina; Fannin, Rabun, Towns and Union counties in Georgia; and, Greenville, Spartanburg, Cherokee, Pickens and Oconee counties in South Carolina.
Fixed rate and adjustable rate 1-4 family residential loan outstandings are expected to increase 14.8% and 10.6%, respectively, over the next three years ending December 31, 2016 while commercial business loans are projected to increase by $17.1 million to $26.3 million over the same period. Construction and land loan balances will continue to decrease while CRE, multi family, and home equity loans are projected to remain relatively flat through the next three year period.
The Company will continue to emphasize real estate lending, including 1-4 family residential mortgage loans with a significant proportion of residential mortgage loans sold into the secondary market, as well as commercial and multi-family mortgage loans at a volume to maintain current loan outstandings. To a lesser extent, the Company extends consumer loans. Details regarding the Company’s loan portfolio composition are included in Exhibits I-7 and I-8, while Exhibit I-9 provides details of the Company’s loan portfolio by contractual maturity date.
| RP® Financial, LC. | OVERVIEW AND FINANCIAL ANALYSIS | |
| I.21 |
Residential Lending
As of December 31, 2013, 1-4 family residential mortgage loans approximated $225.5 million, or 43.1% of total loans. Macon offers both fixed rate and adjustable rate 1-4 family permanent mortgage loans with maturities generally up to 30 years. Loans are underwritten to secondary market guidelines, as the Company’s current philosophy is to generally sell 15 and 30 year fixed rate loans into the secondary market.
As of December 31, 2013, Macon’s ARM loans equaled $132.1 million, or approximately 60% of total residential loans in the portfolio. The Company does not originate “interest only” 1-4 family residential mortgage loans and does not offer loans that provide for negative amortization of principal.
Macon originates 1-4 family residential loans for portfolio up to a loan-to-value (“LTV”) ratio of 89%, with or without private mortgage insurance (“PMI”) being required subject to satisfactory underwriting. PMI is required for loans in excess of an 80% LTV ratio. The majority of the 1-4 family mortgage loans that have been originated or purchased by the Company are secured by residences in the Company’s primary and expanded market areas.
The Company’s 1-4 family lending activities include home equity loans and home equity lines of credit that are secured by the borrower’s primary or secondary residence. Home equity loans and lines of credit are currently originated with fixed or adjustable rates of interest and offered up to a LTV ratio of 80% inclusive of other liens on the property for loans secured by a primary residence and 70% for loans secured by a secondary residence. As of December 31, 2013, home equity loans and lines of credit totaled $56.8 million, equal to 10.9% of total loans.
Historically, the Company sold most residential loans with maturities greater than 15 years. During the years ending December 31, 2013, 2012 and 2011 the Company sold $59.7 million, $40.7 million and $18.2 million of conforming 1-4 family residential loans. The Company generally sells loans with the servicing rights retained. At December 31, 2013 the Company’s residential loans serviced for others totaled $241.2 million.
Commercial Real Estate and Multi-Family Mortgage Lending
CRE and multi-family loans totaled $155.6 million or 29.7% of total loans at December 31, 2013 and were secured primarily by owner occupied properties, small office buildings, office suites, and income producing real estate, substantially located in the Company’s primary market
| RP® Financial, LC. | OVERVIEW AND FINANCIAL ANALYSIS | |
| I.22 |
area. Macon originates CRE loans up to a maximum LTV (or loan to purchase price) ratio of 80% and generally requires a minimum debt-coverage ratio of 1.25 times. CRE loans generally carry higher interest rates and have shorter terms than 1-4 family residential loans. Also, CRE loans generally have greater credit risks than 1-4 family residential loans typically due to the larger loan amount concentrated with a single borrower or related borrowers.
Commercial loan participations serviced totaled $29.8 million, of which $15.5 million was owned by the Company and $14.3 million was owned by co-participants. From time to time, the Company has participated in loans originated by other financial institutions that service and remit payments to Macon. Participations purchased were $3.3 million as of December 31, 2013.
Construction and Land Loans
Construction loans originated by the Company consist of loans to finance the construction of 1-4 family residences, multi-family properties, and nonresidential real estate. In the prevailing market environment, the Company’s construction lending activities are limited to construction/permanent loans. In the past, the Company originated loans to developers for speculative construction of houses. At December 31, 2013, only $2.6 million of the construction loan portfolio consisted of loans to developers for speculative residential construction. Construction loans are originated up to a LTV ratio of 80% based on the appraised value upon completion and require payment of interest only during the construction period, which generally does not exceed 12 months, and convert to permanent, fully-amortizing financing following the completion of construction. As of December 31, 2013, Macon’s outstanding balance of construction and land loans totaled $73.9 million, or 14.1% of total loans.
Non-Mortgage Loans
The Company’s diversification into non-mortgage types of lending consists primarily of commercial business loans and, to a lesser extent, consumer loans. Commercial business loans are offered as term loans and lines of credit, secured and unsecured to customers in the Company’s market area for purposes of working capital and other general business purposes. Commercial business loans offered by the Company consist of prime rate based loans, as well as fixed rate loans. The Company seeks to originate loans to small and medium size businesses with principal balances between $150,000 to $750,000 and also originates SBA 7(a) loans with higher balances and sells the guaranteed portion. The Company also provides SBA loans to franchise owners throughout certain areas of the country. Commercial business loans
| RP® Financial, LC. | OVERVIEW AND FINANCIAL ANALYSIS | |
| I.23 |
are generally offered for terms of up to 10 years. The Company also may participate in commercial SNCs to increase commercial production as necessary. However, the Board has established conservative exposure limits regarding these commercial participations. Expansion of commercial business lending is a targeted area of lending emphasis for the Company, pursuant to which the Company will seek to become a full service community bank to its commercial loan customers through offering a full range of commercial loan products that can be packaged with lower cost commercial deposit products. As of December 31, 2013, Macon’s total outstanding balance of commercial business loans equaled $8.3 million or 1.6% of total loans.
Consumer lending has been a relatively minor area of lending diversification for the Company. The consumer loan portfolio, exclusive of home equity loans and home equity lines of credit, consists of various types of installment loans, primarily auto loans, and loans secured by deposits. As of December 31, 2013, the Company’s outstanding balance of consumer loans equaled $3.7 million or 0.7% of total loans.
Asset Quality
Historically, the Company’s credit quality measures implied limited credit risk exposure, as highlighted by the favorably low ratios maintained for non-performing loans and non-performing assets prior to 2008. However, the Company realized significant increases in the level of NPAs and TDRs in 2008 through 2010 and while NPAs remain elevated, total NPAs have been decreasing for the past three years since 2010. The economic recession experienced nationally impacted the Company’s markets, in terms of job losses, increasing rates of unemployment, and a decrease in demand for second homes, which in turn, has resulted in increased loan delinquency rates and loan foreclosures. Additionally, real estate prices, including the prices of residential and income producing/commercial properties, diminished, continuing to erode the collateral value of the properties securing the Company’s mortgage loans and OREO properties.
As shown in Exhibit I-10, total adjusted NPAs ranged from a high of $82.0 million (excluding performing TDRs) or 8.02% of total assets as of December 31, 2010 to a low of $26.1 million or 3.33% of total assets as of December 31, 2013. The Company also maintains a significant balance of performing TDRs, which totaled $23.0 million as of December 31, 2013. NPAs to total assets including performing TDRs was 9.50% as of December 31, 2010 compared to 6.26% as of December 31, 2013. In light of the very weak market for new development,
| RP® Financial, LC. | OVERVIEW AND FINANCIAL ANALYSIS | |
| I.24 |
credit quality deterioration has been most evident in the Company’s portfolios of construction and land loans and CRE. Adjusted NPAs, excluding performing TDRs, consisted of $15.6 million of non-accruing loans and $10.5 million of OREO as of December 31, 2013. CRE loans accounted for $13.2 million or 51% of total adjusted NPAs and construction and land loans accounted for $8.5 million or 33% of adjusted NPAs as of December 31, 2013.
To track the Company’s asset quality and the adequacy of valuation allowances, Macon has established detailed asset classification policies and procedures that are consistent with regulatory guidelines. Classified assets are reviewed monthly by senior management and the Board. Pursuant to these procedures, when needed, the Company establishes additional valuation allowances to cover anticipated losses in classified or non-classified assets. Consistent with the level of problem assets, the Company’s loan chargeoffs and valuation losses on OREO have significantly decreased over the past two years, but remain elevated. Net charge-offs to average loans peaked at 3.68% for fiscal 2011 compared to 0.94% for fiscal 2013. Valuation losses on OREO were $4.3 million or 0.51% of assets for fiscal 2013, which is a significant decrease from the peak of $8.7 million or 0.78% of assets for fiscal 2009. However, valuation losses on OREO for fiscal 2013 increased 29% over the prior year reflecting continued market value declines on such properties and the increasing rate in which the Company was disposing of the OREO properties. The Company projects ongoing valuation losses on OREO and loan losses, although at a diminishing rate.
Funding Composition and Strategy
Deposits have consistently served as the Company’s primary funding source. Exhibit I-11 sets forth the Company’s deposit composition for the past three years based on average balances and Exhibit I-12 provides the interest rate and maturity composition of the CD portfolio at December 31, 2013. Notably, the Company’s demand accounts have steadily increased over the three year period representing 21.4% of total deposits or $146.2 million as of December 31, 2013, compared to 15.5% or $120.0 million as of December 31, 2011. Brokered deposits have significantly decreased over the period and averaged $16.1 million or 2.4% of total deposits for fiscal 2013 compared to $105.6 million or 13.6% of total deposits as of December 31, 2011. MMA and savings accounts slightly decreased over the period and totaled $207.2 million or 30.4% of total deposits as of December 31, 2013. Overall, average deposits decreased $95.2 million from December 31, 2011 to December 31, 2013, primarily as a result of the decrease in brokered deposits and also in time deposits, partially offset by an increase in demand deposits. Thus, shrinkage in deposits was primarily realized in brokered CDs reflecting the stated
| RP® Financial, LC. | OVERVIEW AND FINANCIAL ANALYSIS | |
| I.25 |
objectives of management. Further, the changes in the deposit composition over the three year period resulted in a decrease in the weighted average rate paid on deposits from 1.44% as of December 31, 2011 to 0.85% as of December 31, 2013, which is reflected in the Company’s cost of funds.
Borrowings serve as an alternative funding source for the Company to facilitate management of funding costs and interest rate risk. The balance outstanding in borrowed funds diminished from $178.4 million as of December 31, 2009 to $40.0 million as of December 31, 2013. The Company increased its FHLB borrowings in the fourth quarter of 2013 by $15 million to take advantage of the current low interest rates and extend the average life of its liabilities. There has been no change in the amount of outstanding subordinated debentures over the past five years, however, the Company has deferred the interest payments since December 2010. After the Offering, the Company intends to pay the deferred interest payments and resume debt service on the subordinated debentures. Exhibit I-13 provides further detail of the Company’s borrowings activities during the past three years.
Going forward, the Company will continue its current practices of allowing brokered deposits to run off at maturity, focus on growth in transaction accounts from its primary market area and utilize borrowings for interest rate risk management objectives.
Subsidiaries
In addition to Macon Bank, the Company has one non-bank subsidiary, Macon Capital, a Delaware statutory trust, formed in 2003 to facilitate issuance of trust preferred securities or subordinated debentures. Macon Bank has one subsidiary, Macon Services, Inc., which currently holds a real estate investment. No other activities are currently planned for Macon Services, Inc.
Legal Proceedings
The Company is not currently party to any pending legal proceedings that the Company’s management believes would have a material adverse effect on the Company’s financial condition, results of operations, or cash flows.
| RP® Financial, LC. | MARKET AREA ANALYSIS | |
| II.1 |
II. MARKET AREA ANALYSIS
Introduction
Macon operates through its corporate headquarters in Franklin, North Carolina and eleven full service branch offices located throughout western North Carolina. Franklin is approximately 70 miles west of Asheville and maintains a population of approximately 3,800. The Company maintains the corporate headquarters and three branch offices in Macon County, two branch offices each in Henderson, Jackson, and Polk Counties, and single branch office locations in Transylvania and Cherokee Counties. The Company considers these North Carolina counties, where retail branch offices are located, its primary market area. The Company also extends loans to customers located in neighboring counties, including Buncombe, Clay, Haywood, and Rutherford Counties in North Carolina; Fannin, Rabun, Towns, and Union Counties in Georgia; and, Cherokee, Greenville, Oconee, Pickens, and Spartanburg Counties in South Carolina. A map showing the Company’s office coverage is set forth below and details regarding the Company’s offices are set forth in Exhibit II-1.
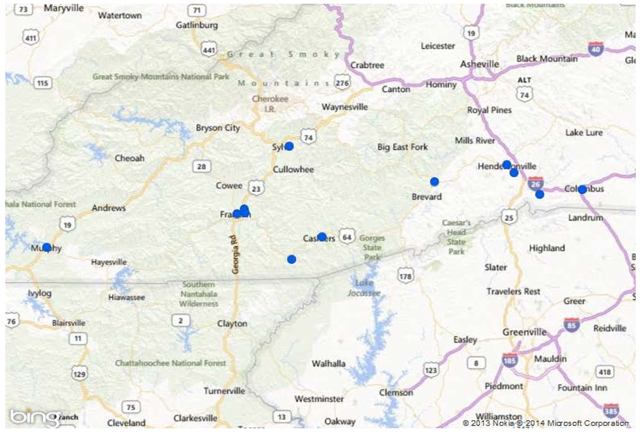
| RP® Financial, LC. | MARKET AREA ANALYSIS | |
| II.2 |
Future growth opportunities for the Company depend on the future growth and stability of the regional economy, demographic growth trends, and the nature and intensity of the competitive environment. These factors have been briefly examined to help determine the growth potential that exists for the Company and the relative economic health of the Company’s market area.
National Economic Factors
The business potential of a financial institution is partially dependent on the future operating environment and growth opportunities for the banking industry and the economy as a whole. The national economy experienced a severe downturn during 2008 and 2009, as the fallout of the housing crisis caused the wider economy to falter, with most significant indicators of economic activity declining by substantial amounts. The overall economic recession was the worst since the great depression of the 1930s. Approximately 8 million jobs were lost during the recession, as consumers cut back on spending, causing a reduction in the demand for many products and services. Total personal wealth declined notably due to the housing crisis and the drop in real estate values. As measured by the nation’s gross domestic product (“GDP”), the recession officially ended in the fourth quarter of 2009, after the national GDP expanded for two consecutive quarters (1.7% annualized growth in the third quarter of 2009 and 3.8% annualized growth in fourth quarter of 2009). The economic expansion has continued since that date, with GDP growth ranging from 1.8% (2011) to 2.8% (2012) since the end of 2009, with GDP growth of 1.9% recorded for the most recent calendar year of 2013. Notably, a large portion of GDP growth during 2009 through 2013 was generated through federal stimulus programs, bringing into question the sustainability of the recovery without government support.
For 2012, the national inflation rate averaged an annual rate of 2.07% and for 2013, averaged an even lower rate of 1.47%. Indicating a level of improvement, the national unemployment rate equaled 6.7% as of December 2013, a moderate decline from 7.9% as of December 2012, but still high compared to recent historical levels. There remains uncertainty about the near term future, particularly in terms of the speed at which the economy will recover, the impact of the housing crisis on longer term economic growth, and the near-term future performance of the real estate industry, including both residential and commercial real estate prices, all of which have the potential to impact future economic growth. The current and projected size of government spending and deficits also has the ability to impact the longer-term economic performance of the country.
| RP® Financial, LC. | MARKET AREA ANALYSIS | |
| II.3 |
The major stock exchange indices have reflected improvement over the last 12 months. As an indication of the changes in the nation’s stock markets over the last 12 months, as of February 14, 2014, the Dow Jones Industrial Average closed at 16,154.39, an increase of 15.6% from February 14, 2013, while the NASDAQ Composite Index stood at 4,244.03, an increase of 32.7% over the same time period. The Standard & Poors 500 Index totaled 1,838.63 as of February 14, 2014, an increase of 20.9% from February 14, 2013.
Based on the consensus outlook of 48 economists surveyed by The Wall Street Journal in January 2014, economic growth is expected to improve from a forecasted growth rate of 2.5% in 2013 to 2.9% in 2016. Most of the economists expect that the unemployment rate will continue to steadily decline at a modest pace from 6.7% in December 2013 to 6.3% in December 2014, and is forecasted to fall below 6% by the end of 2015. On average, the economists expect that the unemployment rate will be 6.3% by the end of 2014, with the economy adding around 200,000 jobs a month over the next year. On average, the economists did not expect the Federal Reserve to begin raising its target rate until mid-2015 at the very earliest, and the yield on the 10-year Treasury would increase to over 4% by the end of 2015. Inflation pressures were forecasted to remain below 2.5% through the end of 2015, and that the price of oil was expected to decline to approximately $95 a barrel through the end of 2014. The Federal Housing Finance Agency house price index was projected to rise by 5% in 2014, while projections for housing starts were mostly steady.
The January 2014 housing forecast from the Mortgage Bankers Association (the “MBA”) was for existing home sales to increase by approximately 3.9% from 2013 levels and new home sales were expected to increase by 9.1% in 2014. Furthermore, the MBA forecasts a slightly larger increase in existing home sales of 4.4% and slower growth in new home sales of approximately 4.1% during 2015. The MBA forecast showed increases in the median sale price for new and existing homes in 2014 and 2015. Total mortgage production is forecasted to be down in 2014 to $1.1 trillion compared to $1.8 trillion in 2013. The reduction in 2014 originations is largely due to a 60% reduction in refinancing volume, with refinancing volume forecasted to total only $440 billion in 2014. Comparatively, home purchase mortgage originations are predicted to increase by 3.8% in 2014, with purchase lending forecasted to total $677 billion in 2014. For 2015, refinancing volume is projected to continue to decline, at a modest pace, while house purchase mortgage originations are projected to increase by a larger 17.6%.
| RP® Financial, LC. | MARKET AREA ANALYSIS | |
| II.4 |
Interest Rate Environment
Reflecting a strengthening economy which could lead to inflation, the Federal Reserve increased interest rates a total of 17 times from 2004 to 2006, with the Federal Funds rate and discount rate peaking at 5.25% and 6.25% in 2006. The Federal Reserve then held these two interest rates steady until mid-2007, at which time the downturn in the economy was evident, and the Federal Reserve began reacting to the increasingly negative economic news. Beginning in August 2007 and through December 2008, the Federal Reserve decreased market interest rates a total of 12 times in an effort to stimulate the economy.
As of January 2009, the Discount Rate had been lowered to 0.50%, and the Federal Funds rate target was 0.00% to 0.25%. These historically low rates were intended to enable a faster recovery of the housing industry, while at the same time lower business borrowing costs, and such rates remained in effect through early 2010. In February 2010, the Fed increased the discount rate to 0.75%, reflecting a slight change to monetary strategy. The effect of the interest rate decreases since mid-2008 has been most evident in short term rates, which decreased more than longer term rates, increasing the slope of the yield curve. This low interest rate environment has been maintained as part of a strategy to stimulate the economy by keeping both personal and business borrowing costs as low as possible. The strategy has achieved its goals, as borrowing costs for residential housing have been at or near historical lows for an extended period of time, and the prime rate of interest remains at a low level. Longer-term interest rates (10-year treasury) increased somewhat in mid-2013 in response to the expectation that the Federal Reserve will cease its treasury buying efforts to keep longer term rates low. The Federal Reserve’s mid-December announcement that it would begin to taper its stimulus program provided for a general upward trend in interest rates throughout December, with the 10-year Treasury yield edging above 3.0% in late-December, but interest rates eased lower at the start of 2014, with the 10-year Treasury yield dipping below 3.0%. The downward trend in long-term Treasury yields continued through the balance of January, as investors sought the safe haven of Treasury bonds amid turmoil in emerging markets and soft jobs data. The Federal Reserve concluded its late-January meeting by voting to scale back its bond buying program by another $10 billion. As of February 14, 2014, one- and ten-year U.S. government bonds were yielding 0.11% and 2.75%, respectively, compared to 0.16% and 2.00%, as of February 14, 2013. This has had a mixed impact on the net interest margins of many financial institutions, as they rely on a spread between the yields on longer term assets and the costs of shorter term funding sources. However, institutions who originate substantial
| RP® Financial, LC. | MARKET AREA ANALYSIS | |
| II.5 |
volumes of prime-based loans have given up some of this pickup in yield as the prime rate declined from 5.00% as of June 30, 2008 to 3.25% as of December 31, 2008, and has remained at that level since that date. Data on historical interest rate trends is presented in Exhibit II-2.
Market Area Demographics
Table 2.1 presents information regarding the demographic and economic trends for the Company’s primary market area from 2010 to 2013 and projected through 2018, with additional detail presented in Exhibit II-3. Data for the nation and the state of North Carolina is included for comparative purposes.
Population and household data indicate that markets served by the Company’s branches are largely rural in nature, with five out of the six primary market area counties maintaining populations of less than 50,000, and a correspondingly low number of households. Henderson County, which is part of the Asheville metropolitan statistical area (“MSA”), is the largest primary market area county served by the Company with a population of 110,000.
Demographic growth trends reflect relatively strong growth in the counties that make up the Company’s market area. From 2010 through 2014, annual population growth rates in the Company’s market area ranged from a low of 0.4% in Cherokee County to a high of 1.6% in Macon County. The growth rate in Macon County, along with those in Henderson and Jackson Counties, exceeded the North Carolina growth rate of 1.0% and the U.S. growth rate of 0.6%. Growth rates for households mirrored the population growth rates, with annual growth rates ranging from 0.5% in Polk County to 1.6% in Macon County. Most of the primary market area counties are projected to experience overall slower population and household growth over the next five years, compared to projected growth trends for North Carolina and the U.S. remaining generally the same as the growth rates for 2010-2013.
Income levels in the market area tend to reflect the nature of the rural markets served by the Company across western North Carolina, as median household income for all of the market area counties, except Henderson County, fell below the statewide median. Similarly, per capita income measures for three out of the six primary market area counties were less than the comparable North Carolina measure and median household and per capita income for all the market area counties fell well below the comparable U.S. measures. Among the primary market area counties, income levels were the highest in Henderson County and lowest in Cherokee County.
| RP® Financial, LC. | MARKET AREA ANALYSIS | |
| II.6 |
Table 2.1
Macon Bancorp
Summary Demographic Data
| Year | Growth Rate | |||||||||||||||||||
| 2010 | 2013 | 2018 | 2010-2013 | 2013-2018 | ||||||||||||||||
| (%) | (%) | |||||||||||||||||||
Population (000) | ||||||||||||||||||||
United States | 308,746 | 314,468 | 323,986 | 0.6 | % | 0.6 | % | |||||||||||||
North Carolina | 9,535 | 9,827 | 10,365 | 1.0 | % | 1.1 | % | |||||||||||||
Macon County | 34 | 36 | 37 | 1.6 | % | 0.6 | % | |||||||||||||
Henderson County | 107 | 111 | 117 | 1.2 | % | 1.1 | % | |||||||||||||
Jackson County | 40 | 42 | 43 | 1.2 | % | 0.7 | % | |||||||||||||
Polk County | 21 | 21 | 21 | 0.5 | % | -0.1 | % | |||||||||||||
Transylvania County | 33 | 34 | 34 | 0.7 | % | 0.2 | % | |||||||||||||
Cherokee County | 27 | 28 | 28 | 0.4 | % | 0.0 | % | |||||||||||||
Households (000) | ||||||||||||||||||||
United States | 116,716 | 118,979 | 122,665 | 0.6 | % | 0.6 | % | |||||||||||||
North Carolina | 3,745 | 3,864 | 4,080 | 1.0 | % | 1.1 | % | |||||||||||||
Macon County | 15 | 15 | 16 | 1.6 | % | 0.6 | % | |||||||||||||
Henderson County | 45 | 47 | 50 | 1.3 | % | 1.1 | % | |||||||||||||
Jackson County | 16 | 17 | 18 | 1.4 | % | 0.8 | % | |||||||||||||
Polk County | 9 | 9 | 9 | 0.5 | % | -0.1 | % | |||||||||||||
Transylvania County | 14 | 15 | 15 | 0.8 | % | 0.3 | % | |||||||||||||
Cherokee County | 12 | 12 | 12 | 0.6 | % | 0.0 | % | |||||||||||||
Median Household Income ($) | ||||||||||||||||||||
United States | NA | 51,314 | 56,895 | NA | 2.1 | % | ||||||||||||||
North Carolina | NA | 44,373 | 50,853 | NA | 2.8 | % | ||||||||||||||
Macon County | NA | 38,969 | 40,204 | NA | 0.6 | % | ||||||||||||||
Henderson County | NA | 47,465 | 51,391 | NA | 1.6 | % | ||||||||||||||
Jackson County | NA | 37,922 | 40,135 | NA | 1.1 | % | ||||||||||||||
Polk County | NA | 39,573 | 47,587 | NA | 3.8 | % | ||||||||||||||
Transylvania County | NA | 38,758 | 42,998 | NA | 2.1 | % | ||||||||||||||
Cherokee County | NA | 37,906 | 38,289 | NA | 0.2 | % | ||||||||||||||
Per Capita Income ($) | ||||||||||||||||||||
United States | NA | 27,567 | 29,882 | NA | 1.6 | % | ||||||||||||||
North Carolina | NA | 24,910 | 26,628 | NA | 1.3 | % | ||||||||||||||
Macon County | NA | 22,202 | 22,978 | NA | 0.7 | % | ||||||||||||||
Henderson County | NA | 25,859 | 27,248 | NA | 1.1 | % | ||||||||||||||
Jackson County | NA | 21,067 | 23,440 | NA | 2.2 | % | ||||||||||||||
Polk County | NA | 23,381 | 28,877 | NA | 4.3 | % | ||||||||||||||
Transylvania County | NA | 25,202 | 26,809 | NA | 1.2 | % | ||||||||||||||
Cherokee County | NA | 20,587 | 21,144 | NA | 0.5 | % | ||||||||||||||
2013 Age Distribution (%) | 0-14 Yrs. | 15-34 Yrs. | 35-54 Yrs. | 55-69 Yrs. | 70+ Yrs. | |||||||||||||||
United States | 19.4 | 27.5 | 26.7 | 17.1 | 9.4 | |||||||||||||||
North Carolina | 19.4 | 26.9 | 27.3 | 17.3 | 9.1 | |||||||||||||||
Macon County | 15.5 | 20.1 | 23.2 | 24.2 | 16.9 | |||||||||||||||
Henderson County | 16.9 | 19.8 | 25.2 | 21.5 | 16.6 | |||||||||||||||
Jackson County | 14.6 | 33.6 | 22.2 | 19.2 | 10.4 | |||||||||||||||
Polk County | 14.8 | 18.0 | 24.5 | 24.7 | 18.0 | |||||||||||||||
Transylvania County | 13.9 | 20.4 | 22.7 | 23.7 | 19.3 | |||||||||||||||
Cherokee County | 15.3 | 18.6 | 24.5 | 25.6 | 16.0 | |||||||||||||||
| Less Than | $25,000 to | $50,000 to | ||||||||||||||
2013 HH Income Dist. (%) | $25,000 | $50,000 | $100,000 | $100,000+ | ||||||||||||
United States | 24.0 | 24.6 | 30.2 | 21.2 | ||||||||||||
North Carolina | 27.9 | 26.6 | 30.2 | 15.3 | ||||||||||||
Macon County | 28.9 | 33.2 | 28.2 | 9.7 | ||||||||||||
Henderson County | 24.9 | 27.0 | 36.0 | 12.1 | ||||||||||||
Jackson County | 33.6 | 28.7 | 26.8 | 10.9 | ||||||||||||
Polk County | 29.2 | 31.3 | 27.6 | 12.0 | ||||||||||||
Transylvania County | 31.3 | 27.2 | 28.9 | 12.5 | ||||||||||||
Cherokee County | 33.5 | 29.7 | 28.2 | 8.6 | ||||||||||||
Source: SNL Financial, LC.
| RP® Financial, LC. | MARKET AREA ANALYSIS | |
| II.7 |
Over the next five years, projected growth rates for median household income and per capita income in the majority of the market area counties are projected to be below the North Carolina and U.S. growth rates. Exceptionally, projected median household and per capita income growth for Polk County is expected to exceed both the state and national rates. The rural nature of the Company’s market area is further evidenced by the household income distribution measures, as the primary market area counties maintained higher percentages of households with incomes of less than $25,000, and lower percentages of households with incomes over $100,000 relative to the U.S. measures.
Local Economy
The Company’s primary market area is within the Smokey Mountains region of North Carolina and, thus, tourism and outdoor recreational activities have a significant influence on the local economy. As an attractive location for vacationers and retirees, the second home market constitutes a major portion of the regional housing market. Accordingly, with the onset of the economic recession which began in 2008, the dry-up in demand for second homes has had a fairly significant adverse impact on the regional housing market and economy in general.
Table 2.2 provides an overview of employment by sector for the state of North Carolina and the primary market area counties.
Table 2.2
Macon Bancorp
Primary Market Area Employment Sectors
(Percent of Labor Force)
| Macon | Henderson | Jackson | Polk | Transylvania | Cherokee | |||||||||||||||||||||||
Employment Sector | North Carolina | County | County | County | County | County | County | |||||||||||||||||||||
| (% of Total Employment) | ||||||||||||||||||||||||||||
Services | 27.5 | % | 29.9 | % | 26.1 | % | 47.0 | % | 29.9 | % | 37.0 | % | 19.4 | % | ||||||||||||||
Healthcare | 10.9 | % | 14.3 | % | 13.9 | % | 11.8 | % | 15.4 | % | 9.9 | % | 12.6 | % | ||||||||||||||
Government | 6.9 | % | 6.0 | % | 5.1 | % | 5.1 | % | 8.5 | % | 11.0 | % | 11.5 | % | ||||||||||||||
Wholesale/Retail Trade | 26.5 | % | 26.6 | % | 26.5 | % | 22.6 | % | 19.0 | % | 21.4 | % | 26.8 | % | ||||||||||||||
Finance/Insurance/Real Estate | 5.9 | % | 4.8 | % | 4.4 | % | 4.0 | % | 5.1 | % | 4.9 | % | 3.6 | % | ||||||||||||||
Manufacturing | 10.3 | % | 6.1 | % | 14.2 | % | 2.5 | % | 10.7 | % | 2.8 | % | 15.2 | % | ||||||||||||||
Construction | 5.2 | % | 7.6 | % | 5.1 | % | 3.9 | % | 5.0 | % | 6.9 | % | 5.5 | % | ||||||||||||||
Information | 1.2 | % | 0.4 | % | 0.3 | % | 0.2 | % | 0.3 | % | 1.5 | % | 0.8 | % | ||||||||||||||
Transportation/Utility | 3.4 | % | 1.7 | % | 2.5 | % | 1.3 | % | 2.7 | % | 1.1 | % | 1.2 | % | ||||||||||||||
Agriculture | 1.4 | % | 2.4 | % | 1.1 | % | 1.2 | % | 2.5 | % | 2.6 | % | 2.0 | % | ||||||||||||||
Other | 0.9 | % | 0.4 | % | 0.6 | % | 0.4 | % | 1.0 | % | 1.1 | % | 1.5 | % | ||||||||||||||
|
|
|
|
|
|
|
|
|
|
|
|
|
| |||||||||||||||
| 100.0 | % | 100.0 | % | 100.0 | % | 100.0 | % | 100.0 | % | 100.0 | % | 100.0 | % | |||||||||||||||
Source: SNL Financial
| RP® Financial, LC. | MARKET AREA ANALYSIS | |
| II.8 |
The Company’s primary market area has a fairly diversified local economy, with employment in services, wholesale/retail trade, health care and government serving as the basis of the market area county economies. Service jobs were the largest employment sector in all of the primary market area counties except Cherokee, followed by wholesale/retail trade as the second largest employment sector. Compared to the state, the market area counties generally have higher levels of employment in services, health care, manufacturing, construction, and agriculture. At the same time, compared to North Carolina, the market area counties display lower concentrations of jobs in finance, information and transportation. Contrary to employment distribution in many areas across the country, manufacturing and construction jobs constituted a fairly significant employment sector in all of the primary market area counties.
Table 2.3 lists the largest employers in the Company’s primary market area counties. Due to the presence of the Asheville metropolitan area and the county’s larger population, most of the market area’s largest employers are located in Henderson County. Among the market area’s largest employers, the most prominent industries are education and health care, followed by manufacturing, trade and other services.
Table 2.3
Macon Bancorp
Market Area Largest Employers
Company/Institution | Industry | County | Employees | |||
Henderson Co Board Of Public Ed | Education | Henderson | 1000+ | |||
Margaret R Pardee Memorial Hosp | Health Care | Henderson | 1000+ | |||
Park Ridge Health | Health Care | Henderson | 1000+ | |||
Charter Hr Inc | Professional Services | Henderson | 1000+ | |||
Ingles Markets Inc | Trade | Henderson | 1000+ | |||
Western Carolina University | Education | Jackson | 1000+ | |||
Cherokee County Board Of Education | Education | Cherokee | 500-999 | |||
Murphy Medical Center Inc | Health Care | Cherokee | 500-999 | |||
County Of Henderson | Government | Henderson | 500-999 | |||
Wilsonart Llc | Manufacturing | Henderson | 500-999 | |||
Continental Automotive Systems Inc | Manufacturing | Henderson | 500-999 | |||
Wal-Mart Associates Inc | Trade | Henderson | 500-999 | |||
Meritor Heavy Vehicle Systems Llc | Manufacturing | Henderson | 500-999 | |||
C J Harris Community Hospital Inc | Health Care | Jackson | 500-999 | |||
Jackson County Public Schools | Education | Jackson | 500-999 | |||
Macon County Public Schools | Education | Macon | 500-999 | |||
Drake Enterprises Ltd (A Corp) | Professional Services | Macon | 500-999 | |||
Transylvania County Schools | Education | Transylvania | 500-999 | |||
Transylvania Community Hospital Inc | Health Care | Transylvania | 500-999 |
Source: North Carolina Department of Commerce, 2013.
| RP® Financial, LC. | MARKET AREA ANALYSIS | |
| II.9 |
Unemployment Trends
Unemployment trends for the primary market area counties, North Carolina, and the U.S. are displayed in Table 2.4. The data indicates that the December 2013 unemployment rate of 6.6% for North Carolina was similar to the comparable U.S. unemployment rate of 6.7%. December 2013 unemployment rates for the primary market area counties ranged from a low of 4.6% in Polk County to a high of 9.0% in Cherokee County. Four out of the six market area counties exhibited unemployment rates equal to or lower than the comparable state and national aggregates. Consistent with the state and national trends, all of the primary market area counties maintained lower unemployment rates in December 2013 compared to a year ago. Moreover, the decreases in unemployment rates in the market area counties over the last year were generally more significant than the declines in the North Carolina and United States unemployment rates.
Table 2.4
Macon Bancorp
Unemployment Trends
Region | December 2012 Unemployment | December 2013 Unemployment | ||||||
United States | 7.8 | % | 6.7 | % | ||||
North Carolina | 9.5 | % | 6.6 | % | ||||
Macon County | 11.1 | % | 7.3 | % | ||||
Henderson County | 7.2 | % | 4.9 | % | ||||
Jackson County | 9.6 | % | 5.8 | % | ||||
Polk County | 7.8 | % | 4.6 | % | ||||
Transylvania County | 10.1 | % | 6.6 | % | ||||
Cherokee County | 12.8 | % | 9.0 | % | ||||
Source: SNL Financial, LC and U.S. Bureau of Labor Statistics.
Real Estate Trends
Home Sales
Home sales activity across North Carolina during the month of December 2013 surpassed the mark posted during December 2012, a positive indicator for an industry that has been impacted by the recession that commenced in 2008. According to statistics provided by the North Carolina Association of Realtors (“NCAR”), single-family home sales during the twelve
| RP® Financial, LC. | MARKET AREA ANALYSIS | |
| II.10 |
months ended December 2013 totaled 8,642, a 13.9% increase from the same period posted in 2012 (when the market recorded 7,598 sales). In addition, the average sales price increased by 3.8% (to $210,634) for the twelve months ended December 2013, from the level for the same time period ended December 2012 ($202,945).
Locally, according to statistics provided by Trulia, a national real estate listings website, home sales in the Company’s primary market area reflected a declining trend, as within the city of Franklin, for the month of December 2013, single-family home sales were down 42% compared with the month of December in 2012 (approximately 26 home sales in December 2013 versus 45 home sales in December 2012). On the other hand, the average sales price of a single-family home increased by 19.5% to equal $121,250 in December 2013 as compared to the month of December in 2012 ($101,464).
According to statistics provided by the NCAR, home sales in the city of Hendersonville, within Henderson County where the Company maintained its second highest concentration of deposits, reflected an increasing trend. During December 2013, single-family home sales were up 26% compared with the month of December in 2012 (approximately 132 home sales in December 2013 versus 105 home sales in December 2012). In addition, the average sales price of a single-family home increased by 7.5% to equal $211,694 for the year ended 2013 as compared to the twelve months ended 2012 ($196,850).
Foreclosure Trends
Single family foreclosures statewide trended generally downward over the twelve months ended December 2013, according to RealtyTrac, a company specializing in real estate foreclosure data. In December 2013, the number of properties that received a foreclosure filing in North Carolina was 13% lower than the same time last year. Specifically, one in every 2,037 housing units in North Carolina received a foreclosure filing for December 2013.
Market Area Deposit Characteristics and Competition
The Company’s retail deposit base is closely tied to the economic fortunes of southwestern North Carolina and, in particular, the markets that are nearby to Macon’s office locations. Table 2.5 displays deposit market trends for the past four years for the Company’s market area counties as well as the state of North Carolina. From 2009 to 2013, annual bank and thrift deposit growth in North Carolina equaled 3.4%. However, all of the primary market area counties exhibited overall declines in total deposits, ranging from a decline of 1.2% in Henderson County to a decline of 3.7% in Transylvania County, except for nominal deposit growth of 0.3% in Cherokee County.
| RP® Financial, LC. | MARKET AREA ANALYSIS | |
| II.11 |
Table 2.5
Macon Bancorp
Deposit Summary
| As of June 30, | ||||||||||||||||||||||||||||
| 2009 | 2013 | Deposit | ||||||||||||||||||||||||||
| Market | No. of | Market | No. of | Growth Rate | ||||||||||||||||||||||||
| Deposits | Share | Branches | Deposits | Share | Branches | 2009-2013 | ||||||||||||||||||||||
| (Dollars in Thousands) | (%) | |||||||||||||||||||||||||||
North Carolina | $ | 304,589,436 | 100.0 | % | 2,790 | $ | 348,055,186 | 100.0 | % | 2,634 | 3.4 | % | ||||||||||||||||
Commercial Banks | 297,401,245 | 97.6 | % | 2,625 | 342,382,785 | 98.4 | % | 2,516 | 3.6 | % | ||||||||||||||||||
Savings Institutions | 7,188,191 | 2.4 | % | 165 | 5,672,401 | 1.6 | % | 118 | -5.7 | % | ||||||||||||||||||
Macon County | $ | 861,120 | 100.0 | % | 17 | $ | 796,797 | 100.0 | % | 15 | -1.9 | % | ||||||||||||||||
Commercial Banks | 474,067 | 55.1 | % | 14 | 493,754 | 62.0 | % | 12 | 1.0 | % | ||||||||||||||||||
Savings Institutions | 387,053 | 44.9 | % | 3 | 303,043 | 38.0 | % | 3 | -5.9 | % | ||||||||||||||||||
Macon Bank | 387,053 | 44.9 | % | 3 | 303,043 | 38.0 | % | 3 | -5.9 | % | ||||||||||||||||||
Henderson County | $ | 1,907,447 | 100.0 | % | 33 | $ | 1,814,791 | 100.0 | % | 31 | -1.2 | % | ||||||||||||||||
Commercial Banks | 1,531,967 | 80.3 | % | 26 | 1,540,652 | 84.9 | % | 26 | 0.1 | % | ||||||||||||||||||
Savings Institutions | 375,480 | 19.7 | % | 7 | 274,139 | 15.1 | % | 5 | -7.6 | % | ||||||||||||||||||
Macon Bank | 99,183 | 5.2 | % | 2 | 96,692 | 5.3 | % | 2 | -0.6 | % | ||||||||||||||||||
Jackson County | $ | 482,393 | 100.0 | % | 14 | $ | 428,808 | 100.0 | % | 12 | -2.9 | % | ||||||||||||||||
Commercial Banks | 358,529 | 74.3 | % | 11 | 325,781 | 76.0 | % | 9 | -2.4 | % | ||||||||||||||||||
Savings Institutions | 123,864 | 25.7 | % | 3 | 103,027 | 24.0 | % | 3 | -4.5 | % | ||||||||||||||||||
Macon Bank | 104,760 | 21.7 | % | 2 | 82,989 | 19.4 | % | 2 | -5.7 | % | ||||||||||||||||||
Polk County | $ | 437,493 | 100.0 | % | 11 | $ | 410,520 | 100.0 | % | 10 | -1.6 | % | ||||||||||||||||
Commercial Banks | 216,400 | 49.5 | % | 7 | 189,397 | 46.1 | % | 6 | -3.3 | % | ||||||||||||||||||
Savings Institutions | 221,093 | 50.5 | % | 4 | 221,123 | 53.9 | % | 4 | 0.0 | % | ||||||||||||||||||
Macon Bank | 54,737 | 12.5 | % | 2 | 71,685 | 17.5 | % | 2 | 7.0 | % | ||||||||||||||||||
Transylvania County | $ | 599,553 | 100.0 | % | 12 | $ | 515,051 | 100.0 | % | 12 | -3.7 | % | ||||||||||||||||
Commercial Banks | 440,079 | 73.4 | % | 9 | 427,170 | 82.9 | % | 10 | -0.7 | % | ||||||||||||||||||
Savings Institutions | 159,474 | 26.6 | % | 3 | 87,881 | 17.1 | % | 2 | -13.8 | % | ||||||||||||||||||
Macon Bank | 73,017 | 12.2 | % | 1 | 65,716 | 12.8 | % | 1 | -2.6 | % | ||||||||||||||||||
Cherokee County | $ | 487,940 | 100.0 | % | 13 | $ | 493,860 | 100.0 | % | 12 | 0.3 | % | ||||||||||||||||
Commercial Banks | 388,514 | 79.6 | % | 11 | 435,935 | 88.3 | % | 11 | 2.9 | % | ||||||||||||||||||
Savings Institutions | 99,426 | 20.4 | % | 2 | 57,925 | 11.7 | % | 1 | -12.6 | % | ||||||||||||||||||
Macon Bank | 55,423 | 11.4 | % | 1 | 57,925 | 11.7 | % | 1 | 1.1 | % | ||||||||||||||||||
Source: FDIC.
With the exception of Polk County, commercial banks maintained a larger market share of deposits than savings institutions in all of the primary market area counties. Macon’s largest holding and highest market share of deposits is in Macon County, where the Company
| RP® Financial, LC. | MARKET AREA ANALYSIS | |
| II.12 |
maintains its corporate center and three branch locations. The Company’s $303.0 million of deposits at the Macon County branches represented a 38.0% market share of bank and thrift deposits at June 30, 2013. The Company’s deposit market share in the five other primary market area counties ranged from 5.3% in Henderson County to 19.4% in Jackson County.
During the four year period covered in Table 2.5, the Company experienced decreases in deposits held in most of the market area counties, ranging from a decrease of 0.6% in Henderson County to a more significant decline of 5.9% in Macon County, except for in Polk and Cherokee Counties, where the Company exhibited deposit growth of 7.0% and 1.1% respectively. However, the Company experienced overall increases in deposit market share in most market area counties, ranging from a minimal increase of 0.1% in Henderson County to a larger gain of 5.0% in Polk County, except for in Macon and Jackson Counties, where it lost 6.9% and 2.4% market share respectively.
Competition among financial institutions in the Company’s market area is viewed to be significant, particularly in light of the largely rural nature of the markets that are served by the Company’s branches. Among the Company’s competitors are much larger and more diversified institutions, which have greater resources than Macon. Financial institution competitors in the Company’s primary market area include other locally-based thrifts and banks, as well as regional, super regional and money center banks. From a competitive standpoint, Macon has sought to emphasize its community orientation in the markets served by its branches. Table 2.6 lists the Company’s largest competitors in the Company’s market area counties, based on deposit market share as noted parenthetically. The Company held the largest deposit market share in Macon County, and was generally ranked in the upper half of all deposit holding institutions in the other market area counties.
| RP® Financial, LC. | MARKET AREA ANALYSIS | |
| II.13 |
Table 2.6
Macon Bancorp
Market Area Deposit Competitors
Location | Name | Market Share | Rank | |||||||
Macon County | Macon Bancorp | 38.03 | % | 1 out of 9 | ||||||
| PNC Financial Services Group | 19.91 | % | ||||||||
| Wells Fargo & Co. | 11.78 | % | ||||||||
| First Citizens BancShares Inc. | 11.08 | % | ||||||||
Henderson County | First Citizens BancShares Inc. | 42.03 | % | |||||||
| Wells Fargo & Co. | 12.39 | % | ||||||||
| Toronto-Dominion Bank | 9.92 | % | ||||||||
| Macon Bancorp | 5.33 | % | 6 out of 14 | |||||||
Jackson County | United Community Banks Inc. | 27.54 | % | |||||||
| Wells Fargo & Co. | 22.28 | % | ||||||||
| Macon Bancorp | 19.35 | % | 3 out of 8 | |||||||
| First Citizens BancShares Inc. | 8.96 | % | ||||||||
Polk County | Home Trust Banchsares Inc. | 36.40 | % | |||||||
| First Citizens BancShares Inc. | 23.12 | % | ||||||||
| Macon Bancorp | 17.46 | % | 3 out of 5 | |||||||
| Bank of America Corp. | 15.35 | % | ||||||||
Transylvania County | First Citizens BancShares Inc. | 26.20 | % | |||||||
| Wells Fargo & Co. | 18.91 | % | ||||||||
| United Community Banks Inc. | 14.08 | % | ||||||||
| Macon Bancorp | 12.76 | % | 4 out of 9 | |||||||
Cherokee County | United Community Banks Inc. | 35.47 | % | |||||||
| First Citizens BancShares Inc. | 18.06 | % | ||||||||
| PNC Financial Services Group | 13.29 | % | ||||||||
| Macon Bancorp | 11.73 | % | 4 out of 7 | |||||||
Source: SNL
| RP® Financial, LC. | PEER GROUP ANALYSIS | |
| III.1 |
III. PEER GROUP ANALYSIS
This chapter presents an analysis of Macon’s operations versus a group of comparable companies (the “Peer Group”) selected from the universe of all publicly-traded savings institutions (excluding mutual holding companies (“MHCs”)) in a manner consistent with the regulatory valuation guidelines. The basis of the pro forma market valuation of the Company was derived from the pricing ratios of the Peer Group institutions, incorporating valuation adjustments for key differences in relation to the Peer Group. Since no Peer Group can be exactly comparable to the Company, key areas examined for differences are: financial condition; profitability, growth and viability of earnings; asset growth; primary market area; dividends; liquidity of the shares; marketing of the issue; management; and, effect of government regulations and regulatory reform.
Peer Group Selection Process
The Peer Group selection process is governed by the general parameters set forth in the regulatory valuation guidelines. Accordingly, the Peer Group is comprised of only those publicly-traded savings institutions whose common stock is either listed on a national exchange (NYSE or AMEX), or is NASDAQ listed, since their stock trading activity is regularly reported and generally more frequent than non-listed (traded on the Over the Counter Bulletin Board (“OTC”) or Pink Sheets), or non publicly traded and closely-held institutions. Institutions that are not listed on a national exchange or NASDAQ are inappropriate, since the trading activity for thinly-traded or closely-held stocks is typically highly irregular in terms of frequency and price and thus may not be a reliable indicator of market value. We have also excluded from the Peer Group those companies under acquisition or subject to rumored acquisition, MHCs and recent conversions, since their pricing ratios are subject to unusual distortion and/or have limited trading history. Thrifts that were converted less than one year ago are typically excluded as their financial results do not reflect a full year of reinvestments and the stock trading activity is not seasoned. A recent listing of the universe of all publicly-traded savings institutions is included as Exhibit III-1.
Ideally, the Peer Group, which must have at least 10 members to comply with the regulatory valuation guidelines, should be comprised of locally- or regionally-based institutions with comparable resources, strategies and financial characteristics. There are approximately 119 publicly-traded institutions nationally, which includes 15 publicly traded MHCs and, thus, it
| RP® Financial, LC. | PEER GROUP ANALYSIS | |
| III.2 |
is typically the case that the Peer Group will be comprised of institutions with relatively comparable characteristics. To the extent that differences exist between the converting institution and the Peer Group, valuation adjustments will be applied to account for the differences. Since Macon will be a 100% stock public company upon completion of the Offering, we considered only full stock public companies (excluding those in MHC form) to be viable candidates for inclusion in the Peer Group,.
Based on the foregoing and from the universe of publicly-traded thrifts, we selected 10 institutions with characteristics similar to those of Macon. The Peer Group selection process focused on companies operating in similar markets, with similar asset sizes, comparable asset quality, and comparable core earnings over the last twelve month period. We believe these characteristics are given significant weight by investors in evaluating Macon and similarly situated institutions.
Accordingly, for inclusion in the Peer Group, we selected all Southeast headquartered, publicly-traded thrifts with total assets between $400 million and $2.0 billion, core earnings between -1.0% and 1.0% of average assets on a trailing twelve month basis, and NPAs of over 2.0% and up to 10.0% of assets. Four publicly-traded thrifts met the criteria and only three were included in the Peer Group, as one company (First Federal Bancshares of Arkansas) was excluded due to unusual operating characteristics as a result of its current proposed private placement to sell 2.5 million shares of its common stock and a pending acquisition of another company. As the regulatory valuation guidelines require that the Peer Group include at least 10 companies, we also evaluated publicly-traded thrifts headquartered in the Midwest with the same selection criteria in terms of total assets, core earnings, and NPAs. This process yielded seven companies, all of which were included in the Peer Group, resulting in a total of 10 companies comprising our Peer Group.
The considerations incorporated into the Peer Group selection process are as follows:
| • | Core Return on Average Assets (“ROAA”) between -1.0% and 1.0%. Given the Company’s recent operating losses and considering the Company reported minimal pre-tax earnings of $60,000 for fiscal year 2013 and a small loss of $236,600 on a core basis, our Peer Group selection focused on selecting comparable publicly-traded thrifts with a core ROAA between -1.0% and 1.0%. Despite the selection criterion, which was designed to include any companies with core net losses, each of the Peer Group companies reported a positive core ROAA, ranging from 0.16% to 0.77% and median and average core ROAA of 0.59% and 0.56%, respectively, as shown in Table 4.3. |
| RP® Financial, LC. | PEER GROUP ANALYSIS | |
| III.3 |
| • | NPAs to Assets greater than 2.0% and up to 10%. As of December 31, 2013 the Company’s NPAs to assets ratio was 6.26% (including performing TDRs) and adjusted NPAs was 3.33% of assets. The Peer Group companies reported NPAs to assets ranging from 2.14% to 5.98% and adjusted NPAs to assets ranging from 1.04% to 5.27%. The Peer Group’s median NPAs to assets and adjusted NPAs to assets ratios of 3.29% and 2.10%, respectively, were both lower than the Company’s ratios. |
| • | The Bank is subject to the Order and the Company is subject to the Written Agreement, both of which could continue to be in effect following the Conversion. None of the ten Peer Group institutions are subject to formal regulatory agreements from their primary regulators (see the rightmost columns in Table 3.1). While no two regulatory agreements are exactly the same in terms of their requirements and impact on the subject financial institution, they typically limit the operating flexibility of a financial institution and can result in greater regulatory sanctions if the terms of the agreements are not met. Moreover, regulatory agreements can impact shareholder value for a variety of reasons, for example as a result of the costs of compliance, reduced operating flexibility, and more limited ability to grow. |
Table 3.1 shows the general characteristics of each of the ten Peer Group companies and Exhibit III-2 provides summary demographic and deposit market share data for the primary market areas served by each of the Peer Group companies. While there are expectedly some differences between the Peer Group companies and Macon, we believe that the Peer Group companies, on average, provide a good basis for valuation subject to valuation adjustments. The following sections present a comparison of the Company’s financial condition, income and expense trends, loan composition, credit risk, and interest rate risk as of or for the twelve months ended December 31, 2013 versus the Peer Group as of or for the twelve months ended September 30, 2013.
| RP® Financial, LC. | PEER GROUP ANALYSIS | |
| �� | III.4 |
Table 3.1
Peer Group of Publicly-Traded Thrifts
| As of February 14, 2014 | Status of Regulatory Agreements With Primary Regulator | |||||||||||||||||||||||||||||||||||||
Ticker | Financial Institution | Exchange | Region | City | State | Total Assets (1) | Offices | Fiscal Mth End | Conv. Date | Stock Price | Market Value | Type of Agreement | Date of Action | |||||||||||||||||||||||||
| ($Mil) | ($) | ($Mil) | ||||||||||||||||||||||||||||||||||||
UCFC | United Community Finl Corp. | NASDAQ | MW | Youngstown | OH | $ | 1,756 | 33 | Dec | 7/9/98 | $ | 3.48 | $ | 175 | None Disclosed | — | ||||||||||||||||||||||
HTBI | HomeTrust Bancshares Inc. | NASDAQ | SE | Asheville | NC | 1,674 | 21 | Jun | 7/11/12 | 15.55 | 308 | None Disclosed | — | |||||||||||||||||||||||||
PULB | Pulaski Financial Corp. | NASDAQ | MW | Saint Louis | MO | 1,276 | 13 | Sep | 12/3/98 | 10.32 | 117 | None Disclosed | — | |||||||||||||||||||||||||
FRNK | Franklin Financial Corp. | NASDAQ | SE | Glen Allen | VA | 1,059 | 8 | Sep | 4/28/11 | 19.11 | 231 | None Disclosed | — | |||||||||||||||||||||||||
ASBB | ASB Bncp Inc | NASDAQ | SE | Asheville | NC | 751 | 13 | Dec | 10/12/11 | 17.45 | 88 | None Disclosed | — | |||||||||||||||||||||||||
FSFG | First Savings Financial Group | NASDAQ | MW | Clarksville | IN | 660 | 16 | Sep | 10/7/08 | 23.25 | 53 | None Disclosed | — | |||||||||||||||||||||||||
FCLF | First Clover Leaf Fin Corp. | NASDAQ | MW | Edwardsville | IL | 647 | 5 | Dec | 7/11/06 | 9.09 | 64 | None Disclosed | — | |||||||||||||||||||||||||
CHEV | Cheviot Financial | NASDAQ | MW | Cheviot | OH | 592 | 12 | Dec | 1/18/12 | 10.45 | 71 | None Disclosed | — | |||||||||||||||||||||||||
UCBA | United Community Bancorp | NASDAQ | MW | Lawrenceburg | IN | 511 | 8 | Jun | 1/10/13 | 11.00 | 57 | None Disclosed | — | |||||||||||||||||||||||||
WAYN | Wayne Savings Bancshares | NASDAQ | MW | Wooster | OH | 400 | 12 | Dec | 1/9/03 | 11.00 | 31 | None Disclosed | — | |||||||||||||||||||||||||
| (1) | As of September 30, 2013. |
| Source: | SNL Financial, LC. |
| RP® Financial, LC. | PEER GROUP ANALYSIS | |
| III.5 |
A summary description of the key comparable characteristics of each of the Peer Group companies relative to Macon’s characteristics is detailed below.
| • | United Community Financial Corp (“UCFC”), Youngstown, OH operates 33 branches in Northeast Ohio, with a concentration of branches around Youngstown. UCFC’s revenues are more diversified as UCFC provides mortgage loans throughout Ohio and Western Pennsylvania, services loans for others, and offers investment and insurance products through its subsidiary company. UCFC had lower loans to total assets and higher MBS and investments to assets, as well as a less diversified loan portfolio than Macon . UCFC’s loan portfolio was concentrated in 1-4 family residential loans with minimal other loan types except for a CRE loan portfolio. UCFC’s deposits to assets were less due to its higher borrowings and higher equity to assets. Total NPAs plus 90 day delinquent loans-to-assets was more favorable than Macon . Reserves to loans were lower and reserves to NPLs and to NPAs plus 90 day delinquent loans were higher, while net loan charge-offs were lower. In terms of income statement composition, UCFC’s net interest income to assets was lower, primarily due to lower asset yields. Other non-interest income was higher, primarily due to UCFC’s large loan servicing operations ($1.1 billion loans serviced for others). Overall, UCFC’s net income to average assets was higher (Macon reported a net loss) due to its lower provision expense, higher other non-interest income and lower non-interest expense to average assets, partially offset by lower net interest income to average assets. At September 30, 2013, UCFC had total assets of $1.8 billion and as of February 14, 2014, UCFC’s market capitalization was $175 million. |
| • | HomeTrust Bancshares, Inc. (“HTBI”), Ashville, NC is also headquartered in North Carolina and operates 21 branches in Western North Carolina and South Carolina. HTBI has branches primarily outside of several different metropolitan areas in North Carolina with three of its offices located in two of the same counties as Macon branches. HTBI had higher cash and equivalents, significantly lower MBS and investments, and a similar loan portfolio composition. HTBI’s significantly higher equity to assets level provides a meaningful source of funding as reflected in its lower deposits and borrowings as a percent of assets and significantly lower interest expense to average assets ratio. HTBI’s asset quality and reserve coverage ratios are similar while net loan charge offs were lower as a percent of loans. HTBI’s net income to average assets was higher than the Company with slightly higher net interest income and similar non-interest income as a percent of average assets. Operating expenses are lower and HTBI had a negative provision expense for loan losses over the last twelve month period. At September 30, 2013, HTBI had total assets of $1.7 billion and as of February 14, 2014, HTBI’s market capitalization was $308 million. |
| • | Pulaski Financial Corp (“PULB”), Saint Louis, MO operates 13 branches primarily within and to the east of St Louis. PULB is a more diversified financial services company as, in addition to traditional community banking, PULB has a significant mortgage banking operation with loan production offices throughout Missouri, Eastern Kansas, Omaha, Nebraska and Council Bluffs, Iowa. In addition, investment products are offered through the Bank’s service corporation subsidiary. PULB had a significantly higher loans to assets ratio and significantly less MBS and investments to assets than Macon. PULB’s loan portfolio was more diversified as it has a meaningful commercial business loan portfolio with moderately less 1-4 residential loans and MBS combined, and slightly higher CRE loans. As a percent of assets, PULB had lower deposits, a similar level of subordinated debt, a higher level of borrowings, and higher equity. |
| RP® Financial, LC. | PEER GROUP ANALYSIS | |
| III.6 |
PULB’s NPAs plus 90 day delinquent loans to assets ratio was lower with similar net loan charge-offs as a percent of loans and similar reserve coverage ratios. However, as a percent of average assets, provisions for loan losses was considerably higher than Macon and gains on sale of loans was significantly higher and contributed to PULB’s higher net income to average assets. At September 30, 2013, PULB had total assets of $1.3 billion and as of February 14, 2014, PULB’s market capitalization was $117 million. |
| • | Franklin Financial Corp. (“FRNK”), Glen Allen, VA operates 8 branches outside Richmond, Virginia. FRNK’s asset composition reflects significantly lower loans, higher MBS and investments, and higher cash and equivalents than Macon. In addition, FRNK relied significantly more on borrowed funds and its significantly higher level of equity as funding sources. FRNK’s loan composition reflects minimal 1-4 family residential loans but a high level of MBS with the majority of the loan portfolio consisting of CRE, multi-family, and construction and land loans. FRNK’s asset quality measures were comparable, while reserve coverage and net loan charge-offs as a percent of loans were lower. While FRNK’s net interest income and non-interest income as a percent of average assets were lower, FRNK’s non-interest expense and provisions for loan losses as a percent of average assets were significantly lower than Macon, resulting in a higher net income to average assets ratio. At September 30, 2013, FRNK had total assets of $1.1 billion and as of February 14, 2014, FRNK’s market capitalization was $231 million. |
| • | ASB Bancorp, Inc. (“ASBB”), Asheville, NC is also headquartered in North Carolina, within 70 miles of Macon’s headquarters and operates 13 branches in and around Western North Carolina. ASBB operates branches in two of the same counties as Macon. Overall ASBB’s asset composition reflected a lower level of loans than Macon, with 1-4 family residential loans (inclusive of MBS) representing the highest loan concentration, although ASBB’s exposure to CRE loans was higher. Asset quality measures were more favorable overall. ASBB’s level of borrowings were similar to Macon’s borrowings (inclusive of subordinated debt), although ASBB’s equity to assets ratio was significantly higher. ASBB’s net income to average assets was greater than Macon’s, primarily due to its negative loan loss provision expense, higher non-interest operating income, and higher non-operating gains, which was partially offset by its lower level of net interest income (driven by its significantly lower asset yield) and higher level of non-interest expense. At September 30, 2013, ASBB had total assets of $751 million and as of February 14, 2014, ASBB’s market capitalization was $88 million. |
| • | First Savings Financial Group (“FSFG”), Clarksville, IN operates 16 branches in south central Indiana across the river from Louisville, Kentucky. FSFG had higher MBS and investments and lower loans as a percent of assets than the Company. Loan portfolio composition was similar, albeit with lower 1-4 family residential loans (inclusive of MBS). Asset quality was more favorable and net loan charge-offs were lower, which supported the significantly lower reserves to loans ratio. As a percent of assets, deposits were lower, while borrowings and equity (reported and tangible) were higher. Net income to average assets was higher, driven by higher interest income coupled with lower interest expense and lower provision and non-interest expenses. At September 30, 2013, FSFG had total assets of $660 million and as of February 14, 2014, FSFG’s market capitalization was $53 million. |
| • | First Clover Leaf Financial Corp. (“FCLF”), Edwardsville, IL operates 5 branches in suburbs around St. Louis, Missouri. FCLF had a higher level of cash and equivalents and lower loans as a percent of assets. Loan composition was broadly similar to Macon, although with a higher level of commercial business loans. Asset quality was more |
| RP® Financial, LC. | PEER GROUP ANALYSIS | |
| III.7 |
favorable, with a lower level of net loan charge-offs, which support the significantly lower reserves to loans ratio. Funding composition included a higher level of borrowings and higher level of equity (on a reported and tangible basis). As a percent of average assets, net income was higher despite lower net interest income and lower non-interest income as the provisions for loan losses and non-interest expense were significantly lower. At September 30, 2013, FCLF had total assets of $647 million and as of February 14, 2014, FCLF’s market capitalization was $64 million. |
| • | Cheviot Financial Corp. (“CHEV”), Cheviot, OH operates 12 branches in suburbs around Cincinnati, Ohio. CHEV’s asset composition reflected a lower level of loans, while its loan composition was similar to Macon, except for CHEV’s lack of construction and land loans and lower concentration in CRE loans. Risk weighted assets as a percent of assets was also significantly lower. CHEV’s deposits to assets ratio and borrowings (including subordinated debentures) to assets ratio were lower than Macon’s because of its significantly higher equity to assets ratio, on both a reported and tangible basis. CHEV’s asset quality measures were more favorable overall, but reserve coverage ratios for CHEV were less favorable. CHEV had a lower net interest income to average assets ratio (primarily due to its lower asset yield) and lower non-interest income to average assets ratio, while CHEV’s provision for loan losses and non-interest expense to average assets ratios were lower, resulting in a higher net income to average assets ratio. At September 30, 2013, CHEV had total assets of $592 million and as of February 14, 2014, CHEV’s market capitalization was $71 million. |
| • | United Community Bancorp (“UCBA”), Lawrenceburg, IN operates 8 branches in both rural and suburban markets in Indiana to the East of Cincinnati, Ohio. UCBA had a significantly lower loans to total assets ratio and a higher MBS and investments to assets ratio, as well as a less diversified loan portfolio than Macon. UCBA’s assets were concentrated in 1-4 family residential loans (inclusive of MBS), with a lower level of CRE loans and an insignificant level of construction and land loans. Risk weighted assets as a percent of assets were also significantly lower. UCBA had a significantly higher equity to assets ratio on both a reported and tangible basis. UCBA’s NPAs plus 90 day delinquent loans to assets ratio was lower, while NPLs as a percent of loans were higher, although with similar reserve coverage. UCBA reported net recoveries on loans, while Macon reported net loan charge-offs. Net interest income was significantly lower than Macon, primarily due to the lower yield on assets; however, UCBA also recorded a negative loan loss provision. Non-interest income to average assets was similar, while non-interest expense as a percent of average assets was lower. UCBA’s net income to average assets ratio was higher, primarily driven by the difference in loan loss provision expense and lower non-interest expense. At September 30, 2013, UCBA had total assets of $511 million and as of February 14, 2014, UCBA’s market capitalization was $57 million. |
| • | Wayne Savings Bancshares (“WAYN”), Wooster, OH operates 12 branches in rural areas in northeast Ohio, approximately 35 miles west of Akron, Ohio. WAYN’s asset composition was similar to Macon. Loan composition was more heavily weighted toward 1-4 family residential mortgages (inclusive of MBS), but was otherwise broadly similar. Asset quality was more favorable and reserve coverage related to NPLs and NPAs were comparable with lower loan charge-offs supporting a lower reserves to loans ratio. Funding composition reflected a somewhat higher level of borrowings and a higher level of equity. WAYN’s lower asset yield and lower cost of funds lead to a slightly higher level of net interest income, which combined with a lower provision expense and lower non-interest expense, was only partially offset by a lower level of non-interest income, |
| RP® Financial, LC. | PEER GROUP ANALYSIS | |
| III.8 |
which resulted in higher net income to average assets ratio. At September 30, 2013, WAYN had total assets of $400 million and as of February 14, 2014, WAYN’s market capitalization was $31 million. |
As a result of the Peer Group selection process employed, the Peer Group companies reflect less favorable asset quality than the industry median (3.29% NPAs to assets plus 90 day delinquent loans versus 1.74% for all publicly-traded thrifts). In aggregate, the Peer Group companies maintained a higher level of tangible equity than the thrift industry median (12.32% of assets versus 11.33% of assets for all publicly-traded thrifts) and recorded a comparable level of net income as a percent of average assets to the industry median (0.62% versus 0.60% for all publicly-traded thrifts). The Peer Group’s comparable level of net income stems from the combination of lower net interest income, slightly lower provision expense and non-interest expense, and a lower effective tax rate.
The table below compares key financial characteristics and pricing ratios of the Peer Group to fully converted non-MHC publicly-traded thrifts. The Peer Group’s median price/core earnings (“P/Core”), price/tangible book (“P/TB”) and price/assets (“P/A”) ratios reflected discounts to the fully converted publicly-traded thrifts, although the P/Core discount was minimal.
| Fully Conv. Publicly- | ||||||||
| Traded Thrifts | Peer Group | |||||||
Financial Characteristics (Medians) | ||||||||
Assets ($Mil) | $ | 771 | $ | 710 | ||||
Market capitalization ($Mil) | $ | 94.66 | $ | 79.69 | ||||
Tangible Equity/Tangible Assets (%) | 11.57 | % | 12.25 | % | ||||
Core Return on Average Assets (%) | 0.60 | % | 0.59 | % | ||||
Core Return on Average Equity (%) | 4.34 | % | 3.90 | % | ||||
Pricing Ratios (Medians)(1) | ||||||||
Price/Core Earnings (x) | 17.20 | x | 17.07 | x | ||||
Price/Book (%) | 96.11 | % | 86.30 | % | ||||
Price/Tangible Book (%) | 102.39 | % | 92.06 | % | ||||
Price/Assets (%) | 12.34 | % | 10.51 | % | ||||
| (1) | Based on market prices as of February 14, 2014 per Table 4.3. |
Given the limitation in finding an appropriate number of fully public-traded companies that are similar to Macon in terms of total assets and market capitalization, the thrifts selected for the Peer Group were relatively comparable to the Company in terms of the overall selection criteria and are considered the “best fit” group. While there are many similarities between
| RP® Financial, LC. | PEER GROUP ANALYSIS | |
| III.9 |
Macon and the Peer Group on average, there are some notable differences that lead to the valuation adjustments discussed herein. The following comparative analysis highlights key similarities and differences between the Bank and the Peer Group.
Financial Condition
Table 3.2 shows comparative balance sheet measures for Macon as of December 31, 2013, while the Peer Group reflects balances as of September 30, 2013. The Company’s equity-to-assets and tangible equity-to-assets ratios of 4.14% were well below the Peer Group’s median ratios of 13.07% and 12.32%, respectively, and were also lower than all of the Peer Group companies.
As discussed in Chapter 1, in addition to the significant operating losses reported for each of the three fiscal years ending December 31, 2011, which were primarily driven by large provisions for loan losses and valuation losses on OREO, two other items have also significantly impacted the Company’s equity as of December 31, 2013. First, as of December 31, 2013, the Company’s deferred tax asset totaled $26.8 million and there was a valuation allowance equal to $22.6 million against this asset resulting in a net deferred tax asset equal to $4.2 million. Secondly, there was a $7.5 million accumulated other comprehensive loss ($5.5 million unrealized losses on AFS securities and $2.0 million unrealized loss on AFS securities transferred to HTM). A valuation allowance of $2.9 million on the deferred tax benefit related to the unrealized losses on AFS securities was included in the $22.6 million DTA valuation allowance. Under certain circumstances (including the Company’s ability and timing to generate future taxable earnings, not triggering a change in control under the Internal Revenue Code, among other items), the Company’s substantial NOLs would be available to offset future taxable income potentially resulting in the reversal of the valuation allowance on the DTA, positively impacting capital.
The Company’s tier 1 leverage ratio was 6.90%, tier 1 risk based ratio was 10.52%, and its total risk based capital ratio was 11.79% as of December 31, 2013. Moreover, the Company did not meet its internal capital target of 7.00% for tier 1 leverage, but did meet the 10.00% for tier 1 risk based and 11.00% for total risk based targets. While the Company’s regulatory capital ratios were lower than the Peer Group medians, both the Company’s and the Peer Group’s regulatory capital ratios reflected capital surpluses with respect to the minimum regulatory capital requirements. The Bank’s capital ratios were higher than the Company’s as a portion of the Company’s subordinated debentures, proceeds of which were infused into the
| RP® Financial, LC. | PEER GROUP ANALYSIS | |
| III.10 |
Table 3.2
Balance Sheet Composition and Growth Rates
Comparable Institution Analysis
As of September 30, 2013
| Balance Sheet as a Percent of Assets | Balance Sheet Annual Growth Rates | Regulatory Capital | ||||||||||||||||||||||||||||||||||||||||||||||||||||||||||||||||||||||||||||||||||
| Cash & Equivalents | MBS & Invest | BOLI | Net Loans (1) | Deposits | Borrowed Funds | Sub. Debt | Total Equity | Goodwill & Intang | Tangible Equity | Assets | MBS, Cash & Investments | Loans | Deposits | Borrows. &Subdebt | Total Equity | Tangible Equity | Tangible Capital (2) | Tier 1 Risk-Based | Risk-Based Capital | |||||||||||||||||||||||||||||||||||||||||||||||||||||||||||||||||
Macon Bancorp | ||||||||||||||||||||||||||||||||||||||||||||||||||||||||||||||||||||||||||||||||||||
December 31, 2013 | 4.37 | % | 22.84 | % | 2.54 | % | 65.42 | % | 87.21 | % | 5.10 | % | 1.84 | % | 4.14 | % | 0.00 | % | 4.14 | % | 1.90 | % | 34.38 | % | -6.09 | % | 1.35 | % | 38.04 | % | -23.11 | % | -23.11 | % | 7.02 | % | 10.52 | % | 11.79 | % | ||||||||||||||||||||||||||||||||||||||||||||
All Public Companies | ||||||||||||||||||||||||||||||||||||||||||||||||||||||||||||||||||||||||||||||||||||
Averages | 6.03 | % | 20.83 | % | 1.86 | % | 66.92 | % | 74.39 | % | 10.80 | % | 0.38 | % | 13.23 | % | 0.71 | % | 12.52 | % | 3.34 | % | 4.23 | % | 5.06 | % | 3.80 | % | 1.71 | % | 4.67 | % | 3.78 | % | 12.60 | % | 19.42 | % | 20.52 | % | ||||||||||||||||||||||||||||||||||||||||||||
Medians | 3.76 | % | 16.71 | % | 1.94 | % | 69.25 | % | 75.80 | % | 8.67 | % | 0.00 | % | 12.35 | % | 0.02 | % | 11.33 | % | 1.01 | % | -0.58 | % | 3.31 | % | 1.18 | % | -2.09 | % | -0.76 | % | -0.59 | % | 12.30 | % | 18.11 | % | 19.32 | % | ||||||||||||||||||||||||||||||||||||||||||||
State of NC | ||||||||||||||||||||||||||||||||||||||||||||||||||||||||||||||||||||||||||||||||||||
Averages | 12.31 | % | 16.24 | % | 1.88 | % | 63.49 | % | 76.01 | % | 3.49 | % | 0.00 | % | 17.84 | % | 0.10 | % | 17.74 | % | 0.83 | % | 3.13 | % | 2.74 | % | 3.34 | % | -45.19 | % | -6.59 | % | -7.03 | % | 15.04 | % | 23.19 | % | 24.45 | % | ||||||||||||||||||||||||||||||||||||||||||||
Medians | 12.31 | % | 16.24 | % | 1.88 | % | 63.49 | % | 76.01 | % | 3.49 | % | 0.00 | % | 17.84 | % | 0.10 | % | 17.74 | % | 0.83 | % | 3.13 | % | 2.74 | % | 3.34 | % | -45.19 | % | -6.59 | % | -7.03 | % | 15.04 | % | 23.19 | % | 24.45 | % | ||||||||||||||||||||||||||||||||||||||||||||
Comparable Group | ||||||||||||||||||||||||||||||||||||||||||||||||||||||||||||||||||||||||||||||||||||
Averages | 7.58 | % | 25.13 | % | 2.28 | % | 60.48 | % | 77.02 | % | 7.36 | % | 0.22 | % | 14.15 | % | 0.68 | % | 13.48 | % | 0.66 | % | 11.19 | % | -0.25 | % | 0.98 | % | -4.81 | % | -0.43 | % | -0.45 | % | 12.17 | % | 20.85 | % | 22.10 | % | ||||||||||||||||||||||||||||||||||||||||||||
Medians | 5.83 | % | 27.65 | % | 2.55 | % | 57.39 | % | 79.45 | % | 7.21 | % | 0.00 | % | 13.07 | % | 0.38 | % | 12.32 | % | -0.71 | % | -0.03 | % | -1.52 | % | -1.19 | % | -3.53 | % | -2.51 | % | -2.53 | % | 11.27 | % | 21.64 | % | 22.91 | % | ||||||||||||||||||||||||||||||||||||||||||||
Comparable Group | ||||||||||||||||||||||||||||||||||||||||||||||||||||||||||||||||||||||||||||||||||||
ASBB | ASB Bncp Inc | NC | 10.37 | % | 26.50 | % | 0.02 | % | 56.84 | % | 77.71 | % | 6.72 | % | 0.00 | % | 13.69 | % | 0.00 | % | 13.69 | % | -2.73 | % | -17.47 | % | 6.54 | % | -0.48 | % | -16.48 | % | -12.24 | % | -12.24 | % | NA | 24.73 | % | 25.99 | % | |||||||||||||||||||||||||||||||||||||||||||
CHEV | Cheviot Financial | OH | 2.68 | % | 31.46 | % | 2.64 | % | 56.96 | % | 79.68 | % | 3.40 | % | 0.00 | % | 15.74 | % | 1.84 | % | 13.90 | % | -6.58 | % | -17.64 | % | -1.97 | % | -4.74 | % | -20.83 | % | -13.27 | % | -14.57 | % | 13.47 | % | 25.00 | % | 25.50 | % | ||||||||||||||||||||||||||||||||||||||||||
FCLF | First Clover Leaf Fin Corp. | IL | 18.82 | % | 17.43 | % | 1.30 | % | 57.16 | % | 80.74 | % | 7.04 | % | 0.62 | % | 11.37 | % | 1.81 | % | 9.56 | % | 17.09 | % | 91.30 | % | -5.01 | % | 24.20 | % | -2.00 | % | -6.73 | % | -7.54 | % | 9.54 | % | 15.73 | % | 17.68 | % | ||||||||||||||||||||||||||||||||||||||||||
FSFG | First Savings Financial Group | IN | 3.38 | % | 27.15 | % | 1.96 | % | 61.89 | % | 72.33 | % | 14.48 | % | 0.00 | % | 12.45 | % | 1.51 | % | 10.94 | % | 3.37 | % | -3.14 | % | 4.89 | % | -3.34 | % | 69.23 | % | -0.81 | % | -0.45 | % | 10.36 | % | 15.78 | % | 17.04 | % | ||||||||||||||||||||||||||||||||||||||||||
FRNK | Franklin Financial Corp. | VA | 9.34 | % | 36.38 | % | 3.24 | % | 48.26 | % | 61.06 | % | 15.43 | % | 0.00 | % | 22.79 | % | 0.00 | % | 22.79 | % | -1.07 | % | -11.24 | % | 13.11 | % | 1.02 | % | -5.06 | % | -3.24 | % | -3.24 | % | 17.83 | % | 26.32 | % | 27.57 | % | ||||||||||||||||||||||||||||||||||||||||||
HTBI | HomeTrust Bancshares Inc. | NC | 14.25 | % | 5.97 | % | 3.74 | % | 70.13 | % | 74.30 | % | 0.25 | % | 0.00 | % | 21.99 | % | 0.20 | % | 21.79 | % | 4.40 | % | 23.74 | % | -1.07 | % | 7.17 | % | -73.91 | % | -0.94 | % | -1.81 | % | 15.04 | % | 21.64 | % | 22.91 | % | ||||||||||||||||||||||||||||||||||||||||||
PULB | Pulaski Financial Corp. | MO | 6.76 | % | 3.76 | % | 2.57 | % | 83.01 | % | 79.22 | % | 8.89 | % | 1.54 | % | 9.10 | % | 0.31 | % | 8.79 | % | -5.31 | % | 40.67 | % | -8.40 | % | -6.55 | % | 2.70 | % | -1.78 | % | -1.83 | % | NA | NA | NA | |||||||||||||||||||||||||||||||||||||||||||||
UCBA | United Community Bancorp | IN | 3.25 | % | 42.12 | % | 2.61 | % | 48.35 | % | 83.06 | % | 1.96 | % | 0.00 | % | 14.35 | % | 0.62 | % | 13.73 | % | 1.85 | % | 16.44 | % | -9.38 | % | -1.90 | % | -5.51 | % | 32.70 | % | 35.15 | % | 12.18 | % | 25.69 | % | 26.95 | % | ||||||||||||||||||||||||||||||||||||||||||
UCFC | United Community Finl Corp. | OH | 4.90 | % | 32.42 | % | 2.54 | % | 57.62 | % | 80.32 | % | 8.00 | % | 0.00 | % | 10.44 | % | 0.01 | % | 10.43 | % | -4.08 | % | 3.09 | % | -8.79 | % | -5.37 | % | -0.01 | % | 6.84 | % | 6.91 | % | 10.26 | % | 18.52 | % | 19.78 | % | ||||||||||||||||||||||||||||||||||||||||||
WAYN | Wayne Savings Bancshares | OH | 2.00 | % | 28.16 | % | 2.24 | % | 64.54 | % | 81.72 | % | 7.37 | % | 0.00 | % | 9.62 | % | 0.45 | % | 9.18 | % | -0.35 | % | -13.79 | % | 7.59 | % | -0.23 | % | 3.75 | % | -4.88 | % | -4.88 | % | 8.71 | % | 14.23 | % | 15.48 | % | ||||||||||||||||||||||||||||||||||||||||||
| (1) | Includes loans held for sale. |
| (2) | The tangible capital ratio as defined under the latest OTS guidelines at period-end. For holding companies this represents the value for the company’s largest subsidiary. |
| Source: | SNL Financial, LC. and RP® Financial, LC. calculations. The information provided in this table has been obtained from sources we believe are reliable, but we cannot guarantee the accuracy or completeness of such information. |
Copyright (c) 2014 by RP® Financial, LC.
| RP® Financial, LC. | PEER GROUP ANALYSIS | |
| III.11 |
Bank as additional capital, did not qualify as Tier 1 capital for the Company as of December 31, 2013. Moreover, the Bank’s Tier 1 leverage capital ratio of 7.02% as of December 31, 2013 did not meet the 8.00% requirement of the Bank’s Order, while the Bank’s total risk based capital ratio of 11.97% was above the 11.00% required by the Order. The Bank’s pro forma capital ratios are above the leverage and risk based capital ratio requirements of the Bank’s Order and the Bank must maintain those capital levels as long as the Order is in place; therefore, limiting the Bank’s ability to leverage the new capital beyond those capital requirements.
The Company’s regulatory capital ratios (tangible capital as defined by the OTS and total risk based capital) of 7.02% and 11.79%, respectively, are significantly less than the Peer Group medians of 11.27% and 22.91%. The Company’s pro forma capital position will increase with the addition of stock proceeds from the Conversion; however, the Company’s pro forma equity-to-assets and tangible equity-to-assets ratios of 8.81% at the midpoint, will still be measurably lower than the Peer Group medians of 12.90% and 12.25%, respectively. Accordingly, the Company will continue to have relatively lower equity protection from a risk perspective and in terms of future earnings potential that could be realized through leverage and lower overall funding costs driven by higher equity, the Company will be more limited in its ability to leverage. At the same time, the Company’s relatively higher pro forma capitalization compared to actual December 31, 2013 capital levels, will negatively impact the return on equity.
The IEA compositions for the Company and the Peer Group were similar, with loans constituting the bulk of IEA for both. The Company’s loans-to-assets ratio of 65.42% was slightly higher than the median Peer Group ratio of 57.39%. Comparatively, the Company’s MBS and investments to assets ratio of 22.84% was slightly lower than the Peer Group median ratio of 27.65%. The Company’s cash and equivalents to assets ratio of 4.37% was lower than the ratio for the Peer Group’s median of 5.83%. The Company reported BOLI as a percent of assets of 2.54%, similar to the Peer Group median of 2.55%. Overall, Macon’s IEA amounted to 92.63% of assets, which was slightly higher than the Peer Group median ratio of 90.87%. Both Macon’s and the Peer Group’s IEA ratios exclude BOLI as an interest-earning asset. On a pro forma basis, immediately following the Offering, a portion of the Offering proceeds will initially be invested in shorter-term securities, increasing the relative proportion of cash and investments for the Company in comparison to the Peer Group over the short term, pending longer term deployment into higher yielding loans. Furthermore, IEA to total assets for the Company will strengthen.
| RP® Financial, LC. | PEER GROUP ANALYSIS | |
| III.12 |
The Company’s funding liabilities reflected a funding strategy that included a greater proportion of deposits than the Peer Group’s funding composition. The Company’s deposits equaled 87.21% of assets, which was above the Peer Group’s median ratio of 79.45%. Comparatively, the Company reported borrowings to assets of 6.94% (including subordinated debentures), while the Peer Group’s average and median ratios were 7.58% and 7.21%. With a significantly lower equity to assets ratio of 4.14% versus 13.07% for the Peer Group median, the Peer Group had significantly greater funding capacity stemming from equity.
Total interest-bearing liabilities (“IBL”) as a percent of assets maintained by the Company of 94.15% was higher than the Peer Group average and median of 84.60% and 86.66%, respectively. Following the increase in equity resulting from the Offering, the Company’s ratio of IBLs to assets will compare more favorably to the Peer Group’s level.
A key measure of balance sheet strength for a thrift institution is its IEA/IBL ratio. Presently, the Company’s IEA/IBL ratio of 98.39% was lower than the Peer Group’s median ratio of 104.86%, primarily because of its significantly lower equity. The additional equity realized from stock proceeds will serve to strengthen the Company’s IEA/IBL ratio in comparison to the Peer Group ratio, as the increase in equity provided by the infusion of stock proceeds will lower the level of IBL funding assets and will be primarily deployed into IEA.
The Company recorded asset growth of 1.90%, minimal deposit growth of 0.90%, and borrowings growth of 38.04%, over the last twelve month period compared to the Peer Group’s median asset shrinkage of 0.71% funded primarily by deposit and borrowings shrinkage of 1.19% and 3.53%, respectively. The Company’s overall asset growth was reflected in MBS, cash, and investment growth of 34.38%, while loans decreased 6.09%. Comparatively, the Peer Group’s loans declined at a median rate of 1.52%, while MBS, cash, and investments decreased by a minimal 0.03%. The balance sheet growth rates in Table 3.2 reflect soft loan demand and higher credit standards in general, resulting in slight asset shrinkage primarily from the repayment of borrowings for the Peer Group. The Company’s balance sheet growth on the other hand reflects curtailed lending activity and an increase in investments funded by an increase in deposits and also new borrowings intended to extend liabilities and lock in relatively favorable borrowing rates.
The Company’s total equity and tangible equity both declined by 23.11% over the past twelve months due primarily to an increase in the unrealized loss on securities AFS. Further, an increase in the DTA valuation allowance against the deferred tax benefit associated with the unrealized loss on AFS securities also increased, contributing to the Company’s decline in
| RP® Financial, LC. | PEER GROUP ANALYSIS | |
| III.13 |
equity. Comparatively, the Peer Group’s median total equity and tangible equity declined by 2.51% and 2.53%, respectively. Macon reported a net loss compared to the Peer Group’s median net income (-0.05% of average assets versus 0.62% of average assets, respectively). As a mutual, the Company does not pay dividends while the Peer Group’s median dividend payout ratio was 31.53%. The Company’s equity has decreased at an annual rate of 20.55% over the past four years and while the Company’s stock proceeds will increase the Company’s equity, the Company’s ability to further increase equity will depend on its ability to further reduce valuation losses on OREO and loan loss provision expenses, which would facilitate earnings improvement and better position the Company for capital growth.
Income and Expense Components
Table 3.3 shows comparative income statement measures for the Company and the Peer Group, reflecting earnings for fiscal 2013 for the Company and for the twelve months ended September 30, 2013 for the Peer Group. The Company reported a net loss of 0.05% of average assets for fiscal 2013, which was lower than the median net income of 0.62% of average assets for the Peer Group. The Company reported pre-tax income of $60,000 and an after tax net loss of $415,000, or 0.05% of average assets. The Company’s net interest income to average assets was higher than the Peer Group’s, primarily because of higher interest income and the higher yield on IEA driven by the higher level of loans and lower level of cash and investments, partially offset by higher interest expense and higher cost of funds. The Company is currently deferring its interest payments on the trust-preferred debentures, however the interest expense related to the debentures was accrued and reflected in the Company’s interest expense.
The Company recorded higher loan loss provisions (0.53% versus 0.09% for the Peer Group median), resulting in slightly lower net interest income after provision (2.40% versus 2.60% for the Peer Group median). The higher loan loss provision expense was related to the significantly higher level of net loan charge-offs recorded by the Company (0.94% versus 0.32% for the Peer Group median), which is the result of its higher level of problem assets. Although, higher than the Peer Group, the Company’s loan loss provision for fiscal 2013 was the lowest provision in the past five years and represents a significant decrease from the prior years as reflected in Table 1.2.
Non-interest income to average assets was higher for the Company (0.72% versus 0.59% for the Peer Group median) and primarily driven by its higher gain on sale of loans. The
| RP® Financial, LC. | PEER GROUP ANALYSIS | |
| III.14 |
Table 3.3
Income as Percent of Average Assets and Yields, Costs, Spreads
Comparable Institution Analysis
For the 12 Months Ended September 30, 2013
| Net Interest Income | Non-Interest Income | Non-Op. Items | Yields, Costs, and Spreads | |||||||||||||||||||||||||||||||||||||||||||||||||||||||||||||||||||||
| Net Income | Income | Expense | NII | Loss Provis. on IEA | NII After Provis. | Gain on Sale of Loans | Other Non-Int Income | Total Non-Int Expense (1) | Net Gain/Loss & Nonrecurring Inc/Exp (2) | Extrao. Items | Provision for Taxes | Yield On IEA | Cost Of IBL | Yld-Cost Spread | MEMO: Assets/ FTE Emp. | MEMO: Effective Tax Rate | ||||||||||||||||||||||||||||||||||||||||||||||||||||||||
Macon Bancorp | ||||||||||||||||||||||||||||||||||||||||||||||||||||||||||||||||||||||||
December 31, 2013 | -0.05 | % | 3.77 | % | 0.84 | % | 2.92 | % | 0.53 | % | 2.40 | % | 0.27 | % | 0.45 | % | 3.16 | % | 0.04 | % | 0.00 | % | 0.06 | % | 4.37 | % | 1.07 | % | 3.30 | % | $ | 4,241 | NM | |||||||||||||||||||||||||||||||||||||||
All Public Companies | ||||||||||||||||||||||||||||||||||||||||||||||||||||||||||||||||||||||||
Averages | 0.52 | % | 3.75 | % | 0.75 | % | 3.01 | % | 0.22 | % | 2.79 | % | 0.45 | % | 0.56 | % | 3.04 | % | 0.12 | % | 0.00 | % | 0.28 | % | 4.04 | % | 0.96 | % | 3.10 | % | $ | 5,542 | 29.28 | % | ||||||||||||||||||||||||||||||||||||||
Medians | 0.60 | % | 3.75 | % | 0.70 | % | 3.06 | % | 0.15 | % | 2.87 | % | 0.10 | % | 0.46 | % | 2.84 | % | 0.04 | % | 0.00 | % | 0.27 | % | 4.08 | % | 0.93 | % | 3.12 | % | $ | 4,989 | 31.73 | % | ||||||||||||||||||||||||||||||||||||||
State of NC | ||||||||||||||||||||||||||||||||||||||||||||||||||||||||||||||||||||||||
Averages | 0.44 | % | 3.39 | % | 0.51 | % | 2.88 | % | -0.18 | % | 3.06 | % | 0.25 | % | 0.53 | % | 3.32 | % | 0.21 | % | 0.00 | % | 0.19 | % | 3.74 | % | 0.64 | % | 3.10 | % | $ | 4,720 | 29.87 | % | ||||||||||||||||||||||||||||||||||||||
Medians | 0.44 | % | 3.39 | % | 0.51 | % | 2.88 | % | -0.18 | % | 3.06 | % | 0.25 | % | 0.53 | % | 3.32 | % | 0.21 | % | 0.00 | % | 0.19 | % | 3.74 | % | 0.64 | % | 3.10 | % | $ | 4,720 | 29.87 | % | ||||||||||||||||||||||||||||||||||||||
Comparable Group | ||||||||||||||||||||||||||||||||||||||||||||||||||||||||||||||||||||||||
Averages | 0.58 | % | 3.55 | % | 0.68 | % | 2.88 | % | 0.14 | % | 2.73 | % | 0.24 | % | 0.47 | % | 2.69 | % | 0.09 | % | 0.00 | % | 0.23 | % | 3.87 | % | 0.85 | % | 3.09 | % | $ | 5,156 | 27.59 | % | ||||||||||||||||||||||||||||||||||||||
Medians | 0.62 | % | 3.62 | % | 0.60 | % | 2.83 | % | 0.09 | % | 2.60 | % | 0.15 | % | 0.44 | % | 2.78 | % | 0.05 | % | 0.00 | % | 0.25 | % | 3.79 | % | 0.77 | % | 2.95 | % | $ | 4,530 | 27.86 | % | ||||||||||||||||||||||||||||||||||||||
Comparable Group | ||||||||||||||||||||||||||||||||||||||||||||||||||||||||||||||||||||||||
ASBB | ASB Bncp Inc | NC | 0.18 | % | 3.06 | % | 0.60 | % | 2.46 | % | -0.19 | % | 2.65 | % | 0.29 | % | 0.64 | % | 3.58 | % | 0.37 | % | 0.00 | % | 0.07 | % | 3.24 | % | 0.72 | % | 2.52 | % | $ | 4,368 | 29.68 | % | ||||||||||||||||||||||||||||||||||||
CHEV | Cheviot Financial | OH | 0.30 | % | 3.23 | % | 0.75 | % | 2.49 | % | 0.20 | % | 2.29 | % | 0.14 | % | 0.39 | % | 2.37 | % | -0.04 | % | 0.00 | % | 0.11 | % | 3.72 | % | 0.93 | % | 2.79 | % | $ | 4,973 | 26.35 | % | ||||||||||||||||||||||||||||||||||||
FCLF | First Clover Leaf Fin Corp. | IL | 0.66 | % | 3.39 | % | 0.61 | % | 2.78 | % | 0.14 | % | 2.64 | % | 0.16 | % | 0.24 | % | 2.13 | % | 0.06 | % | 0.00 | % | 0.31 | % | 3.59 | % | 0.79 | % | 2.80 | % | $ | 6,880 | 31.83 | % | ||||||||||||||||||||||||||||||||||||
FSFG | First Savings Financial Group | IN | 0.72 | % | 4.17 | % | 0.60 | % | 3.57 | % | 0.29 | % | 3.28 | % | 0.08 | % | 0.58 | % | 2.94 | % | 0.00 | % | 0.00 | % | 0.28 | % | 4.75 | % | 0.77 | % | 3.98 | % | $ | 3,862 | 27.83 | % | ||||||||||||||||||||||||||||||||||||
FRNK | Franklin Financial Corp. | VA | 0.88 | % | 3.76 | % | 1.34 | % | 2.42 | % | 0.05 | % | 2.37 | % | 0.01 | % | 0.26 | % | 1.58 | % | 0.12 | % | 0.00 | % | 0.30 | % | 4.08 | % | 1.74 | % | 2.34 | % | $ | 11,150 | 25.52 | % | ||||||||||||||||||||||||||||||||||||
HTBI | HomeTrust Bancshares Inc. | NC | 0.70 | % | 3.72 | % | 0.41 | % | 3.30 | % | -0.17 | % | 3.47 | % | 0.22 | % | 0.43 | % | 3.07 | % | 0.05 | % | 0.00 | % | 0.30 | % | 4.25 | % | 0.56 | % | 3.69 | % | $ | 5,071 | 30.05 | % | ||||||||||||||||||||||||||||||||||||
PULB | Pulaski Financial Corp. | MO | 0.75 | % | 3.97 | % | 0.50 | % | 3.47 | % | 0.93 | % | 2.54 | % | 0.98 | % | 0.46 | % | 2.86 | % | 0.00 | % | 0.00 | % | 0.37 | % | 4.24 | % | 0.56 | % | 3.68 | % | $ | 2,810 | 32.84 | % | ||||||||||||||||||||||||||||||||||||
UCBA | United Community Bancorp | IN | 0.55 | % | 2.99 | % | 0.60 | % | 2.39 | % | -0.15 | % | 2.54 | % | 0.13 | % | 0.59 | % | 2.64 | % | 0.15 | % | 0.00 | % | 0.21 | % | 3.22 | % | NA | NA | $ | 4,692 | 27.88 | % | ||||||||||||||||||||||||||||||||||||||
UCFC | United Community Finl Corp. | OH | 0.57 | % | 3.65 | % | 0.77 | % | 2.88 | % | 0.33 | % | 2.56 | % | 0.33 | % | 0.71 | % | 3.09 | % | 0.21 | % | 0.00 | % | 0.14 | % | 3.83 | % | 0.88 | % | 2.95 | % | $ | 3,670 | 19.09 | % | ||||||||||||||||||||||||||||||||||||
WAYN | Wayne Savings Bancshares | OH | 0.51 | % | 3.58 | % | 0.59 | % | 2.99 | % | 0.02 | % | 2.96 | % | 0.04 | % | 0.37 | % | 2.69 | % | 0.00 | % | 0.00 | % | 0.17 | % | 3.75 | % | 0.73 | % | 3.02 | % | $ | 4,082 | 24.86 | % | ||||||||||||||||||||||||||||||||||||
| (1) | Includes net valuation losses on OREO, if applicable. |
| (2) | Includes gain/loss on sale of securities and nonrecurring income and expense. |
| Source: | SNL Financial, LC. and RP® Financial, LC. calculations. The information provided in this table has been obtained from sources we believe are reliable, but we cannot guarantee the accuracy or completeness of such information. |
Copyright (c) 2014 by RP® Financial, LC.
| RP® Financial, LC. | PEER GROUP ANALYSIS | |
| III.15 |
Company’s operating expense ratio of 3.16% of average assets, which was negatively impacted by the high valuation losses on OREO, was significantly higher than the Peer Group’s median of 2.78%. On a post-Offering basis, the Company’s operating expenses are expected to initially increase modestly due to the additional stock-related benefit plans and certain other expenses associated with operating as a publicly-traded company. The Company will seek to offset these additional expenses through balance sheet growth and reinvestment of the Offering proceeds. Moreover, the Company also projects ongoing valuation losses on OREO; although at a diminishing rate. These expenses are included as part of core earnings for both the Company and the Peer Group.
The Company’s efficiency ratio (operating expenses as a percent of the sum of non-interest operating income and net interest income) of 86.8% was slightly less favorable than the Peer Group’s median ratio of 85.0%. This is due to the Company’s higher operating expenses, which more than offset the benefit of its higher net interest income and non-interest income ratios. Additionally, and as previously mentioned, the Company’s high loan loss provisions, which are not incorporated into the efficiency ratio calculation, have also been a material factor in the Company’s inferior net income versus the Peer Group’s.
Non-operating items for the Company and the Peer Group were similar with both recording minimal levels of net gains on the sale of securities. Comparatively, to the extent that gains have been derived through selling fixed rate loans into the secondary market, such gains may be considered to be an ongoing activity for an institution and, therefore, warrant some consideration as a core earnings factor for an institution; therefore they are not considered to be non-operating items. However, loan sale gains are still viewed as a more volatile source of income than income generated through the net interest margin and non-interest operating income. Neither the Company nor the Peer Group recorded extraordinary items. Overall, non-operating items were not a factor for the Company or the Peer Group.
Importantly, the Company recorded a tax expense of 0.06% of average assets versus the Peer Group’s tax expense of 0.25% of average assets based on the median. As the Company’s tax expense was primarily driven by the increase in the DTA valuation allowance, the Company’s effective tax rate is considered not meaningful, whereas the Peer Group had an effective tax rate of 27.86%. To the extent the Company reports future pretax earnings, the Company has projected an effective tax rate of approximately 30% beginning in the fourth quarter of 2014.
| RP® Financial, LC. | PEER GROUP ANALYSIS | |
| III.16 |
Loan Composition
Table 3.4 presents data related to the Company’s and the Peer Group’s loan portfolio compositions (including the investment in MBS). The Company’s loan portfolio composition reflected a slightly higher concentration of 1-4 family residential mortgage loans than maintained by the Peer Group (35.99% of assets versus 32.52% for the Peer Group median). The Company also maintained a higher ratio of MBS as a percent of assets (13.69% of assets versus 12.39% for the Peer Group median). The Company reported a balance of loans serviced for others of $225.5 million, while six of the ten Peer Group companies also reported a balance of loans serviced for others, resulting in a Peer Group average and median of $149.6 million and $18.2 million. The Company and the Peer Group also maintained relative balances of loan servicing assets.
Diversification into higher risk and higher yielding types of lending was also similar for the Company and the Peer Group. The Company’s CRE loans of 18.96% to assets was similar to the Peer Group median of 17.00% of assets, while the Company and the Peer Group both had relatively insignificant exposure to multi-family loans (0.87% of assets versus the Peer Group median of 3.84% of assets). Both the Company and the Peer Group also recorded minimal commercial business and consumer loans as a percent of assets. The Company’s construction and land loans-to-assets ratio of 9.42% was higher than the Peer Group median of 2.99% of assets. The Company’s risk weighted assets of 65.27% of assets was slightly higher than the Peer Group median of 61.13% due to the Company’s higher level of construction and land loans and somewhat higher loans to assets ratio, as well as a somewhat lower level of cash and equivalents as a percent of assets.
Credit Risk
Given the importance of asset quality in an investors’ perception of value in the current environment, we sought to include thrifts with similar asset quality characteristics in the Peer Group. Accordingly, the ratio of NPAs (including 90+ day delinquencies) to assets equaled 6.26% for the Company and 3.29% for the Peer Group median, as shown in Table 3.5. While our selection criteria included thrifts with NPAs to assets above 2.00% and not higher than 10.00%, none of the Peer Group members had more than 6.00% of NPAs as a percent of assets. Adjusted NPAs to assets (including 90+ day delinquencies), were 3.33% for the Company versus 2.10% for the Peer Group, indicating that the Company had a more significant level of performing TDRs (which are reported as NPAs, but not adjusted NPAs), which also
| RP® Financial, LC. | PEER GROUP ANALYSIS | |
| III.17 |
Table 3.4
Loan Portfolio Composition and Related Information
Comparable Institution Analysis
As of September 30, 2013
| Portfolio Composition as a Percent of Assets | ||||||||||||||||||||||||||||||||||||||||||||
| MBS | 1-4 Family (1) | Constr. & Land | Multi- Family | Comm RE | Commerc. Business | Consumer | RWA/ Assets | Serviced For Others | Servicing Assets | |||||||||||||||||||||||||||||||||||
| (%) | (%) | (%) | (%) | (%) | (%) | (%) | (%) | ($000) | ($000) | |||||||||||||||||||||||||||||||||||
Macon Bancorp | ||||||||||||||||||||||||||||||||||||||||||||
December 31, 2013 | 13.69 | % | 35.99 | % | 9.42 | % | 0.87 | % | 18.96 | % | 1.06 | % | 0.47 | % | 65.27 | % | $ | 255,475 | $ | 1,883 | ||||||||||||||||||||||||
All Public Companies | ||||||||||||||||||||||||||||||||||||||||||||
Averages | 12.38 | % | 33.17 | % | 2.92 | % | 7.27 | % | 17.31 | % | 4.13 | % | 1.86 | % | 64.71 | % | $ | 1,583,919 | $ | 15,855 | ||||||||||||||||||||||||
Medians | 10.41 | % | 32.22 | % | 2.00 | % | 2.48 | % | 17.76 | % | 2.87 | % | 0.32 | % | 65.36 | % | $ | 30,304 | $ | 275 | ||||||||||||||||||||||||
State of NC | ||||||||||||||||||||||||||||||||||||||||||||
Averages | 8.38 | % | 35.38 | % | 3.89 | % | 1.34 | % | 17.55 | % | 1.27 | % | 2.06 | % | 62.17 | % | $ | 0 | $ | 0 | ||||||||||||||||||||||||
Medians | 8.38 | % | 35.38 | % | 3.89 | % | 1.34 | % | 17.55 | % | 1.27 | % | 2.06 | % | 62.17 | % | $ | 0 | $ | 0 | ||||||||||||||||||||||||
Comparable Group | ||||||||||||||||||||||||||||||||||||||||||||
Averages | 13.22 | % | 31.94 | % | 3.25 | % | 4.34 | % | 16.18 | % | 3.64 | % | 0.92 | % | 59.12 | % | $ | 149,571 | $ | 921 | ||||||||||||||||||||||||
Medians | 12.39 | % | 32.52 | % | 2.99 | % | 3.84 | % | 17.00 | % | 1.51 | % | 0.35 | % | 61.13 | % | $ | 18,237 | $ | 162 | ||||||||||||||||||||||||
Comparable Group | ||||||||||||||||||||||||||||||||||||||||||||
ASBB | ASB Bncp Inc | NC | 14.01 | % | 26.88 | % | 2.71 | % | 1.17 | % | 21.88 | % | 1.44 | % | 3.87 | % | 58.51 | % | $ | 0 | $ | 0 | ||||||||||||||||||||||
CHEV | Cheviot Financial | OH | 2.20 | % | 40.84 | % | 0.41 | % | 3.86 | % | 9.98 | % | 1.48 | % | 0.46 | % | 52.66 | % | $ | 149,616 | $ | 1,292 | ||||||||||||||||||||||
FCLF | First Clover Leaf Fin Corp. | IL | 5.38 | % | 20.84 | % | 3.22 | % | 4.89 | % | 19.03 | % | 8.58 | % | 0.23 | % | 61.90 | % | $ | 110,527 | $ | 885 | ||||||||||||||||||||||
FSFG | First Savings Financial Group | IN | 10.77 | % | 30.66 | % | 3.97 | % | 4.05 | % | 17.81 | % | 3.65 | % | 1.45 | % | 63.81 | % | $ | 0 | $ | 0 | ||||||||||||||||||||||
FRNK | Franklin Financial Corp. | VA | 24.75 | % | 6.92 | % | 7.70 | % | 11.71 | % | 22.84 | % | 0.00 | % | 0.00 | % | 64.53 | % | $ | 0 | $ | 0 | ||||||||||||||||||||||
HTBI | HomeTrust Bancshares Inc. | NC | 2.76 | % | 43.88 | % | 5.07 | % | 1.51 | % | 13.22 | % | 1.09 | % | 0.24 | % | 65.82 | % | $ | 0 | $ | 0 | ||||||||||||||||||||||
PULB | Pulaski Financial Corp. | MO | 0.35 | % | 34.38 | % | 4.78 | % | 3.83 | % | 23.37 | % | 15.51 | % | 0.19 | % | NA | $ | 6,124 | $ | 49 | |||||||||||||||||||||||
UCBA | United Community Bancorp | IN | 34.27 | % | 30.63 | % | 0.82 | % | 5.75 | % | 10.29 | % | 0.71 | % | 0.75 | % | 46.76 | % | $ | 71,825 | $ | 695 | ||||||||||||||||||||||
UCFC | United Community Finl Corp. | OH | 17.80 | % | 42.42 | % | 2.76 | % | 3.16 | % | 7.21 | % | 1.53 | % | 1.76 | % | 56.98 | % | $ | 1,127,267 | $ | 6,018 | ||||||||||||||||||||||
WAYN | Wayne Savings Bancshares | OH | 19.92 | % | 41.99 | % | 1.09 | % | 3.51 | % | 16.19 | % | 2.40 | % | 0.25 | % | 61.13 | % | $ | 30,349 | $ | 274 | ||||||||||||||||||||||
| (1) | Loans secured by 1-4 family residential properties, including first and second mortgages and home equity/HELOCs. |
| Source: | SNL Financial LC. and RP® Financial, LC. calculations. The information provided in this table has been obtained from sources we believe are reliable, but we cannot guarantee the accuracy or completeness of such information. |
Copyright (c) 2014 by RP® Financial, LC.
| RP® Financial, LC. | PEER GROUP ANALYSIS | |
| III.18 |
Table 3.5
Credit Risk Measures and Related Information
Comparable Institution Analysis
As of September 30, 2013
| REO/ Assets | NPAs & 90+Del/ Assets (1) | Adj NPAs & 90+Del/ Assets (2) | NPLs/ Loans (3) | Rsrves/ Loans HFI | Rsrves/ NPLs (3) | Rsrves/ NPAs & 90+Del (1) | Net Loan Chargeoffs (4) | NLCs/ Loans | ||||||||||||||||||||||||||||||||
| (%) | (%) | (%) | (%) | (%) | (%) | (%) | ($000) | (%) | ||||||||||||||||||||||||||||||||
Macon Bancorp | ||||||||||||||||||||||||||||||||||||||||
December 31, 2013 | 1.34 | % | 6.26 | % | 3.33 | % | 7.32 | % | 2.73 | % | 36.88 | % | 29.00 | % | $ | 4,981 | 0.94 | % | ||||||||||||||||||||||
All Public Companies | ||||||||||||||||||||||||||||||||||||||||
Averages | 0.41 | % | 2.67 | % | 1.72 | % | 3.29 | % | 1.43 | % | 68.48 | % | 55.00 | % | $ | 6,321 | 0.43 | % | ||||||||||||||||||||||
Medians | 0.16 | % | 1.74 | % | 1.28 | % | 2.32 | % | 1.25 | % | 52.57 | % | 44.95 | % | $ | 1,219 | 0.23 | % | ||||||||||||||||||||||
State of NC | ||||||||||||||||||||||||||||||||||||||||
Averages | 1.46 | % | 4.47 | % | 3.59 | % | 4.35 | % | 2.10 | % | 71.76 | % | 31.60 | % | $ | 2,575 | 0.31 | % | ||||||||||||||||||||||
Medians | 1.46 | % | 4.47 | % | 3.59 | % | 4.35 | % | 2.10 | % | 71.76 | % | 31.60 | % | $ | 2,575 | 0.31 | % | ||||||||||||||||||||||
Comparable Group | ||||||||||||||||||||||||||||||||||||||||
Averages | 0.65 | % | 3.68 | % | 2.62 | % | 4.95 | % | 1.65 | % | 41.78 | % | 28.66 | % | $ | 2,623 | 0.34 | % | ||||||||||||||||||||||
Medians | 0.58 | % | 3.29 | % | 2.10 | % | 4.16 | % | 1.79 | % | 35.76 | % | 31.41 | % | $ | 1,195 | 0.32 | % | ||||||||||||||||||||||
Comparable Group | ||||||||||||||||||||||||||||||||||||||||
ASBB | ASB Bncp Inc | NC | 2.05 | % | 2.97 | % | 2.27 | % | 1.60 | % | 1.77 | % | 109.37 | % | 34.02 | % | $ | 1,163 | 0.28 | % | ||||||||||||||||||||
CHEV | Cheviot Financial | OH | 0.71 | % | 2.60 | % | 2.02 | % | 3.30 | % | 0.47 | % | 14.06 | % | 10.20 | % | $ | 1,646 | 0.49 | % | ||||||||||||||||||||
FCLF | First Clover Leaf Fin Corp. | IL | 0.93 | % | 2.22 | % | 2.10 | % | 2.23 | % | 1.48 | % | 66.18 | % | 38.56 | % | $ | 964 | 0.25 | % | ||||||||||||||||||||
FSFG | First Savings Financial Group | IN | 0.12 | % | 2.39 | % | 1.49 | % | 3.58 | % | 1.34 | % | 37.36 | % | 35.08 | % | $ | 1,226 | 0.30 | % | ||||||||||||||||||||
FRNK | Franklin Financial Corp. | VA | 0.63 | % | 5.79 | % | 5.27 | % | 10.49 | % | 1.87 | % | 17.83 | % | 15.88 | % | $ | 1,069 | 0.22 | % | ||||||||||||||||||||
HTBI | HomeTrust Bancshares Inc. | NC | 0.87 | % | 5.98 | % | 4.92 | % | 7.11 | % | 2.44 | % | 34.15 | % | 29.19 | % | $ | 3,987 | 0.33 | % | ||||||||||||||||||||
PULB | Pulaski Financial Corp. | MO | 0.50 | % | 4.84 | % | 3.00 | % | 4.74 | % | 1.82 | % | 35.88 | % | 29.67 | % | $ | 10,901 | 0.94 | % | ||||||||||||||||||||
UCBA | United Community Bancorp | IN | 0.12 | % | 4.22 | % | 1.98 | % | 8.31 | % | 2.17 | % | 26.10 | % | 25.36 | % | ($ | 553 | ) | -0.21 | % | |||||||||||||||||||
UCFC | United Community Finl Corp. | OH | 0.53 | % | 3.61 | % | 2.10 | % | 4.94 | % | 2.04 | % | 41.25 | % | 33.16 | % | $ | 4,952 | 0.47 | % | ||||||||||||||||||||
WAYN | Wayne Savings Bancshares | OH | 0.01 | % | 2.14 | % | 1.04 | % | 3.27 | % | 1.17 | % | 35.65 | % | 35.49 | % | $ | 870 | 0.35 | % | ||||||||||||||||||||
| (1) | NPAs are defined as nonaccrual loans, performing TDRs, and OREO. |
| (2) | Adjusted NPAs are defined as nonaccrual loans and OREO (performing TDRs are excluded). |
| (3) | NPLs are defined as nonaccrual loans and performing TDRs. |
| (4) | Net loan chargeoffs are shown on a last twelve month basis. |
| Source: | SNL Financial, LC and RP® Financial, LC. calculations. The information provided in this table has been obrained from sources we believe are reliable, but we cannot guarantee the accuracy or completeness of such information. |
Copyright (c) 2014 by RP® Financial, LC.
| RP® Financial, LC. | PEER GROUP ANALYSIS | |
| III.19 |
contributed to the Company’s NPLs to loans ratio, which was significantly higher than the Peer Group median (7.32% of loans versus 4.16% of loans).
Reflective of the Company’s higher level of problem assets was the higher level of net loan charge-offs (0.94% of loans versus 0.32% of loans for the Peer Group median). The Company also maintained a higher level of reserves to loans compared to the Peer Group median (2.73% versus 1.79%) and comparable levels of reserves to NPLs of (36.88% versus 35.76%) and reserves to NPAs and 90 days delinquent loans (29.00% versus 31.41%).
Interest Rate Risk
Table 3.6 reflects various key ratios highlighting the relative interest rate risk exposure of the Company versus the Peer Group. In terms of balance sheet composition, the Company’s interest rate risk characteristics were considered to be less favorable than the Peer Group. The Company’s tangible equity-to-assets ratio of 4.14% was significantly lower than the Peer Group’s median of 12.40% and the Company’s IEA/IBL of 113.32% was also lower than the Peer Group’s ratio of 118.75%, thereby implying a greater dependence on the yield-cost spread to sustain the net interest margin for the Company. On a pro forma basis, the infusion of stock proceeds can be expected to provide the Company with more comparable interest rate risk characteristics as currently maintained by the Peer Group, particularly with respect to the increases that will be realized in the Company’s equity-to-assets and IEA/IBL ratios.
To analyze interest rate risk associated with the net interest margin, we reviewed quarterly changes in net interest income as a percent of average assets for Macon and the Peer Group. The relative fluctuations in Macon’s net interest income to average assets ratio were slightly higher than the Peer Group and, thus, based on the interest rate environment that prevailed during the period analyzed in Table 3.6, the Company is exposed to a somewhat greater degree of interest rate risk exposure in the net interest margin. The stability of the Company’s net interest margin should be enhanced by the infusion of stock proceeds, as the increase in capital will reduce the level of interest rate sensitive liabilities funding the Company’s assets.
Summary
Based on the above analysis and the criteria employed in the selection of the Peer Group companies, recognizing that the primary selection criteria were the financial characteristics and the market in which the Peer Group companies operate, RP Financial
| RP® Financial, LC. | PEER GROUP ANALYSIS | |
| III.20 |
Table 3.6
Interest Rate Risk Measures and Net Interest Income Volatility
Comparable Institution Analysis
As of September 30, 2013
| Balance Sheet Measures | ||||||||||||||||||||||||||||||||||||||||
| Tangible | Avg | Non-Earn. | Quarterly Change in Net Interest Income | |||||||||||||||||||||||||||||||||||||
| Equity/ Assets | IEA/ Avg IBL | Assets/ Assets | 9/30/2013 | 6/30/2013 | 3/31/2013 | 12/31/2012 | 9/30/2012 | 6/30/2012 | ||||||||||||||||||||||||||||||||
| (%) | (%) | (%) | (change in net interest income is annualized in basis points) | |||||||||||||||||||||||||||||||||||||
Macon Bancorp | ||||||||||||||||||||||||||||||||||||||||
December 31, 2013 | 4.14 | % | 113.32 | % | 4.77 | % | -7 | 10 | -16 | 11 | 27 | 5 | ||||||||||||||||||||||||||||
All Public Companies | 12.59 | % | 121.20 | % | 7.55 | % | 2 | -2 | -7 | -2 | -1 | -1 | ||||||||||||||||||||||||||||
State of NC | 17.76 | % | 128.48 | % | 8.03 | % | 4 | -1 | -6 | 14 | -8 | -8 | ||||||||||||||||||||||||||||
Comparable Group | ||||||||||||||||||||||||||||||||||||||||
Average | 13.56 | % | 118.64 | % | 8.18 | % | 3 | -6 | -7 | 1 | -11 | 0 | ||||||||||||||||||||||||||||
Median | 12.40 | % | 118.75 | % | 7.71 | % | 2 | -4 | -7 | 1 | -7 | -1 | ||||||||||||||||||||||||||||
Comparable Group | ||||||||||||||||||||||||||||||||||||||||
ASBB | ASB Bncp Inc | NC | 13.69 | % | 125.89 | % | 6.05 | % | 10 | -2 | 0 | 11 | -2 | 2 | ||||||||||||||||||||||||||
CHEV | Cheviot Financial | OH | 14.16 | % | 109.51 | % | 12.37 | % | -4 | -4 | -4 | 1 | 0 | -4 | ||||||||||||||||||||||||||
FCLF | First Clover Leaf Fin Corp. | IL | 9.73 | % | 116.52 | % | 12.89 | % | -4 | -10 | -10 | -20 | -7 | 4 | ||||||||||||||||||||||||||
FSFG | First Savings Financial Group | IN | 11.11 | % | 115.65 | % | 8.81 | % | 1 | -14 | 12 | 1 | -25 | 4 | ||||||||||||||||||||||||||
FRNK | Franklin Financial Corp. | VA | 22.79 | % | 121.37 | % | 7.31 | % | 12 | -4 | 4 | -8 | 1 | -4 | ||||||||||||||||||||||||||
HTBI | HomeTrust Bancshares Inc. | NC | 21.83 | % | 131.07 | % | 10.01 | % | -2 | -1 | -13 | 16 | -13 | -19 | ||||||||||||||||||||||||||
PULB | Pulaski Financial Corp. | MO | 8.81 | % | 123.96 | % | 8.12 | % | 0 | -3 | -17 | 12 | -7 | -6 | ||||||||||||||||||||||||||
UCBA | United Community Bancorp | IN | 13.81 | % | 108.65 | % | 7.07 | % | 3 | -5 | -19 | -4 | -18 | 8 | ||||||||||||||||||||||||||
UCFC | United Community Finl Corp. | OH | 10.43 | % | 120.99 | % | 3.68 | % | 10 | -7 | -21 | 7 | -36 | 23 | ||||||||||||||||||||||||||
WAYN | Wayne Savings Bancshares | OH | 9.22 | % | 112.76 | % | 5.49 | % | 6 | -7 | 0 | -10 | 1 | -4 | ||||||||||||||||||||||||||
NA=Change is greater than 100 basis points during the quarter.
| Source: | SNL Financial LC. and RP® Financial, LC. calculations. The information provided in this table has been obtained from sources we believe are reliable, but we cannot guarantee the accuracy or completeness of such information. |
Copyright (c) 2014 by RP® Financial, LC.
| RP® Financial, LC. | PEER GROUP ANALYSIS | |
| III.21 |
concluded that the Peer Group forms a reasonable basis for determining the pro forma market value of the Company. In those areas where key differences exist, we will apply appropriate valuation adjustments in Chapter IV.
| RP® Financial, LC. | VALUATION ANALYSIS | |
| IV.1 |
IV. VALUATION ANALYSIS
Introduction
This chapter presents the valuation analysis and methodology, prepared pursuant to the regulatory valuation guidelines, and valuation adjustments and assumptions used to determine the estimated pro forma market value of the common stock to be issued in conjunction with the Company’s conversion transaction.
Appraisal Guidelines
The written regulatory appraisal guidelines required by the Federal bank regulatory agencies specify the market value methodology for estimating the pro forma market value of a converting institution. Pursuant to this methodology: (1) a peer group of comparable publicly-traded institutions is selected; (2) a financial and operational comparison of the subject company to the peer group is conducted to discern key differences leading to valuation adjustments; and (3) a valuation analysis in which the pro forma market value of the subject company is determined based on the market pricing of the peer group as of the date of valuation, incorporating valuation adjustments for key differences. In addition, the pricing characteristics of recent conversions, both at conversion and in the aftermarket, must be considered.
RP Financial Approach to the Valuation
The valuation analysis herein complies with such regulatory appraisal guidelines. Accordingly, the valuation incorporates a detailed analysis based on the Peer Group, discussed in Chapter III, which constitutes “fundamental analysis” techniques. Additionally, the valuation incorporates a “technical analysis” of recently completed stock conversions, including closing pricing and aftermarket trading of such offerings. It should be noted that no valuation analyses can possibly fully account for all the market forces which impact trading activity and pricing characteristics of a particular stock on a given day.
The pro forma market value determined herein is a preliminary value for the Company’s to-be-issued stock. Throughout the conversion process, RP Financial will: (1) review changes in the Company’s operations and financial condition; (2) monitor the Company’s operations and financial condition relative to the Peer Group to identify any fundamental changes; (3) monitor the external factors affecting value including, but not limited to, local and national economic
| RP® Financial, LC. | VALUATION ANALYSIS | |
| IV.2 |
conditions, interest rates, and the stock market environment, including the market for thrift stocks; and (4) monitor pending conversion offerings (including those in the offering phase), both regionally and nationally. If material changes should occur during the conversion process, RP Financial will evaluate whether updated valuation reports should be prepared reflecting such changes and their related impact on value, if any. RP Financial will also prepare a final valuation update at the closing of the Offering to determine if the prepared valuation analysis and resulting range of value continues to be appropriate.
The appraised value determined herein is based on the current market and operating environment for the Company and for all thrifts. Subsequent changes in the local and national economy, the legislative and regulatory environment, the stock market, interest rates, and other external forces (such as natural disasters or major world events), which may occur from time to time (often with great unpredictability) may materially impact the market value of all thrift stocks, including the Company’s value, or the Company’s value alone. To the extent a change in factors impacting the Company’s value can be reasonably anticipated and/or quantified, RP Financial has incorporated the estimated impact into the analysis.
Valuation Analysis
A fundamental analysis discussing similarities and differences relative to the Peer Group was presented in Chapter III. The following sections summarize the key differences between the Company and the Peer Group and how those differences affect the pro forma valuation. Emphasis is placed on the specific strengths and weaknesses of the Company relative to the Peer Group in such key areas as financial condition, profitability, growth and viability of earnings, asset growth, primary market area, dividends, liquidity of the shares, marketing of the issue, management, and the effect of government regulations and/or regulatory reform. We have also considered the market for thrift stocks, in particular new issues, to assess the impact on value of the Company coming to market at this time.
| RP® Financial, LC. | VALUATION ANALYSIS | |
| IV.3 |
| 1. | Financial Condition |
The financial condition of an institution is an important determinant in pro forma market value because investors typically look to such factors as liquidity, capital, asset composition and quality, and funding sources in assessing investment attractiveness. The similarities and differences in the Company’s and the Peer Group’s financial strengths are noted as follows:
| • | Overall Asset/Liability Composition. The level of IEA to assets for the Company and the Peer Group were similar. Loans were the primary component of both Macon’s and the Peer Group’s assets, with the Company recording a slightly higher concentration of loans and somewhat lower MBS. The Company’s loan portfolio composition reflected slightly higher concentrations of 1-4 family residential loans and MBS, but had similar diversification into higher risk and higher yielding types of loans with higher exposure to construction and land development loans. Cash and cash equivalents were somewhat lower and the RWA to assets ratio was somewhat higher for the Company. Macon’s funding composition reflected a higher level of IBL consisting of higher deposits and slightly lower borrowings (including subordinated debentures) than the Peer Group and significantly lower equity. Overall, the Company reported a higher yield on IEA than the Peer Group median, which was only partially offset by a higher cost of IBL, which resulted in a higher yield-cost spread than the Peer Group median. IEA/IBL for the Company was lower than the Peer Group median because of the Company’s significantly lower equity. After factoring in the impact of the net stock proceeds, the Company’s IEA/IBL ratio will be more comparable, but remain below the Peer Group’s median ratio. On balance, RP Financial concluded that asset/liability composition was a slightly negative factor in our adjustment for financial condition. |
| • | Credit Quality. The Company’s NPAs (including 90+ day delinquencies) to assets ratio was higher than the Peer Group median (6.26% versus 3.29%). Adjusted NPAs (excluding performing TDRs) as a percentage of assets of 3.33% was also higher than the Peer Group median of 2.10%, indicating that the Company has a materially higher level of performing TDRs. This high level of performing TDRs also contributed to the Company’s higher NPLs to loans ratio as compared to the Peer Group median (7.32% versus 4.16%). The Company had a higher level of reserves to total loans (2.73% versus 1.79% for the Peer Group median) and comparable reserve coverage to NPLs and to NPAs (including 90+ day delinquencies). However, the Company’s net loan charge-offs were also higher at 0.94% of loans versus the Peer Group median of 0.32%, which resulted in higher provisions for loan loss expense (0.53% of average assets versus 0.09% of average assets) than the Peer Group median. Moreover, the Company recorded valuation losses on OREO of 0.51% of assets, which contributed to higher operating expenses (3.16% versus 2.78% of average assets for the Peer Group). The Company’s RWA-to-assets ratio was also somewhat higher than the Peer Group’s. In the context of the Peer Group selection criteria, which consists of companies with comparable credit quality, Macon’s higher NPAs, adjusted NPAs (excluding performing TDRs), and NPLs, as well as the Company’s somewhat higher RWA, combined with higher net loan charge-offs and valuation losses on OREO, lead RP Financial to conclude that credit quality was a moderately negative factor contributing to our adjustment for financial condition. |
| • | Balance Sheet Liquidity. The Company operated with a lower level of cash and investment securities relative to the Peer Group (27.21% of assets versus 33.48% for the Peer Group median) and slightly lower borrowings (including subordinated debentures). As a result of the Offering, the Company’s cash and investments ratio is expected to increase. The bulk of the Offering proceeds will be infused into the Bank as capital (at the midpoint, 80% of net Offering proceeds will be infused into the Bank), with the remainder used to make deferred payments on the subordinated |
| RP® Financial, LC. | VALUATION ANALYSIS | |
| IV.4 |
debentures (subject to prior regulatory approval) and deployed into investments. While the Company does not expect to repay the principal on either its subordinated debentures or other borrowings upon completion of the Conversion, the Company plans to make deferred interest payments on its subordinated debentures, which have been deferred since December 31, 2010 and totaled $1.6 million as of December 31, 2013. In addition, after the Offering, the Company expects to continue to service the debt going forward. Importantly, the interest rate on the subordinated debentures is adjustable and based on the current interest rate approximates $440,000 per year. RP Financial concluded that balance sheet liquidity was a neutral factor in our adjustment for financial condition. |
| • | Funding Liabilities. Macon’s funding composition reflected a higher level of IBL as a percent of assets compared to the Peer Group’s median (94.15% versus 86.66%), which was attributable to the Company’s lower capital position. Higher deposits, which included minimal brokered CDs and slightly lower borrowings (including subordinated debentures) translated into a higher cost of funds for the Company. Following the Offering, the increase in the Company’s capital position will reduce the level of IBL funding the Company’s assets and the IEA/IBL, which is currently lower than the Peer Group’s ratio, is expected to improve. Nonetheless, Macon’s equity to assets ratio will remain well below the Peer Group median. Overall, RP Financial concluded that funding liabilities was a moderately negative factor in our adjustment for financial condition. |
| • | Equity. The Company currently operates with significantly lower equity-to-assets and tangible equity-to-assets ratios than the Peer Group. As a result of the Offering, Macon’s equity-to-assets ratio, although improved, will continue to be less favorable than the Peer Group’s. The Company’s pro forma capital position implies less leverage capacity than the Peer Group, more dependence on IBL to fund assets, and a lower capital cushion to absorb credit quality related losses than the Peer Group. RP Financial concluded that equity was a moderately negative factor in our adjustment for financial condition. |
On balance, the Company’s balance sheet strength was considered to be less favorable than the Peer Group’s and, thus, a moderate downward adjustment was applied for the Company’s financial condition.
| 2. | Profitability, Growth and Viability of Earnings |
Earnings are a key factor in determining pro forma market value, as the level and risk characteristics of an institution’s earnings stream and the prospects and ability to generate future earnings heavily influence the multiple that the investment community will pay for earnings. The major factors considered in the valuation are described below.
| • | Reported Earnings. The Company reported a higher yield on IEA (4.37% versus 3.79% for the Peer Group median), higher cost of IBL (1.07% versus 0.77% for the Peer Group median), higher loan loss provision expense (0.53% versus 0.09% of average assets for the Peer Group median), and higher operating expenses (3.16% |
| RP® Financial, LC. | VALUATION ANALYSIS | |
| IV.5 |
versus 2.78% of average assets for the Peer Group median), which included 0.51% of average assets in valuation losses on OREO. The Company had minimal pre-tax earnings and a tax expense that resulted in a reported net loss of 0.05% of average assets for fiscal 2013. Accordingly, the Company’s effective tax rate was not meaningful. Comparatively, the Peer Group had an effective tax rate of 27.86% and reported net income to average assets of 0.62% based on the median. Reinvestment and leveraging of stock proceeds into IEA will serve to increase the Company’s earnings, with the benefit of reinvesting proceeds expected to be somewhat offset by continued higher operating expenses, including from additional Company projected valuation losses on OREO, as well as expenses related to new benefit plans being implemented in conjunction with the Offering and the expenses typically associated with operating as a publicly-traded company. On balance, RP Financial concluded that the Company’s reported earnings were a significantly negative factor in our adjustment for profitability, growth and viability of earnings. |
| • | Core Earnings. Both the Company and the Peer Group recorded similar gains on the sale of securities, which is not considered to be part of core earnings. Accordingly, the Company recorded a core loss for fiscal 2013, while the Peer Group recorded meaningful core earnings over the last twelve months. As reflected in Table 1.2, although the Company’s valuation losses on OREO (which are considered part of recurring operating expenses for both the Company and the Peer Group) decreased between 2011 and 2012, valuation losses on OREO have increased from 2012 to 2013 from 0.39% to 0.51% of average assets. Future core earnings are largely dependent on whether loan loss provision expense and valuation losses on OREO will decrease. RP Financial concluded that the Company’s core earnings were a significant negative factor in our adjustment for profitability, growth and viability of earnings. |
| • | Interest Rate Risk. Quarterly changes in the Company’s and the Peer Group’s net interest income to average assets ratios indicated the degree of volatility associated with the Company’s net interest margin falling outside the range exhibited by the Peer Group. Other measures of interest rate risk such as the capital and the IEA/IBL ratios were significantly less favorable for the Company, indicating that the Company maintained a higher dependence on the yield-cost spread to sustain net interest income. On a pro forma basis, the Company’s capital position and IEA/IBL ratio will be enhanced by the infusion of stock proceeds and, thus, diminish the Peer Group’s relative advantage, in this regard, and improve the Company’s interest rate risk exposure position. On balance, interest rate risk was a somewhat negative factor in our adjustment for profitability, growth and viability of earnings. |
| • | Credit Risk. As noted above, higher charge-offs, provisions for loan losses and valuation losses on OREO were negative factors contributing to the Company’s operating losses. Higher levels of NPAs, adjusted NPAs, which exclude performing TDRs, and NPLs expose the Company to relatively higher credit risk. Consistent with the Company’s higher charge-offs, their higher reserve coverage ratios reflected somewhat higher coverage to total loans and similar coverage to NPLs and NPAs. RWA as a percent of assets are somewhat higher than the Peer Group median, while a higher loans-to-assets ratio coupled with greater exposure to relatively higher risk construction and land loans were the drivers of the Company’s higher RWA to assets ratio. The Company’s higher level of NPAs continues to expose Macon to relatively higher credit risk than the Peer Group and the Company projects continued |
| RP® Financial, LC. | VALUATION ANALYSIS | |
| IV.6 |
measurable valuation losses on OREO. Accordingly, RP Financial concluded that credit risk was a moderately negative factor in our adjustment for profitability, growth and viability of earnings. |
| • | Earnings Growth Potential. Several factors were considered in assessing earnings growth potential. The Company’s higher level of NPAs and adjusted NPAs, which are reflected in the loan charge-offs and valuation losses on OREO, expose the Company to a relatively greater threat to future growth and profitability. The high level of performing TDRs could negatively impact earnings if any of these loans become non-performing. In addition, at this late stage in the credit cycle, the Company projects ongoing elevated loan loss provision expense and additional valuation losses on OREO and whether the Company achieves the projected reductions in such expenses is uncertain. Accordingly, future reductions in core operating costs could therefore come at a slower pace compared to the Peer Group. Moreover, the Company’s lower equity to assets ratio (which on a pro-forma basis will continue to be well below the Peer Group median), combined with the fact that the Bank continues to be subject to the Order (and the Company to the Written Agreement), will continue to have a negative impact on the Company’s earnings growth potential. While the Company has a valuation allowance established for a portion of its DTA, under certain circumstances (including the Company’s ability to generate future taxable earnings, not triggering a change in control under the Internal Revenue Code, among other items), the Company’s valuation allowance on its DTA could be reversed, positively impacting capital and providing for additional leverage capacity and increased earnings. On balance, RP Financial concluded that earnings growth potential was a moderately negative factor in our adjustment for profitability, growth and viability of earnings. |
| • | Return on Equity. Current operating losses have resulted in negative returns and erosion of the Company’s capital base, while all of the Peer Group members have reported positive earnings. The Company’s ability to generate positive future operating income is largely dependent on the projected further decreases in both loan loss provision expense and OREO valuation losses. Accordingly, return on equity was a moderately negative factor in the adjustment for profitability, growth and viability of earnings. |
On balance, the Company’s profitability, growth and viability of earnings was considered to be significantly less favorable than the Peer Group’s and, thus, a significant downward adjustment was applied.
| 3. | Asset Growth |
After shrinking for three of the past four years, the Company’s assets grew by 1.90% over the last fiscal year, while the Peer Group median reflected a (0.71%) reduction in assets over the last twelve month period. Over the four year period, the Company’s assets shrank at an annual rate of 7.65%. The Company’s asset growth during fiscal 2013 was driven by MBS, cash and investment growth of 34.38%, as loans decreased by 6.09%, compared to the Peer
| RP® Financial, LC. | VALUATION ANALYSIS | |
| IV.7 |
Group, which saw loans decrease by only 1.52% and experienced minimal change in MBS, cash and investments. The Company’s asset growth was funded largely by increased borrowings. On a pro-forma basis, the Company’s equity to assets and tangible equity to assets ratios of 8.81% will continue to be measurably less favorable than the Peer Group’s ratios of 12.90% and 12.25%, respectively, resulting in less leverage capacity. Moreover, as long as the Order is in effect, the Bank’s ability to leverage capital will be limited compared to the Peer Group due to the higher Tier 1 and Total Risk Based capital ratios imposed by the Order. On balance, RP Financial concluded that a slight downward adjustment for asset growth was warranted.
| 4. | Primary Market Area |
The general condition of an institution’s market area has an impact on value, as future success is in part dependent upon opportunities for profitable activities in the local market served. Operating in the Smokey Mountains region in western North Carolina, the Company serves a somewhat rural market area, as indicated by low population density and relatively low household income compared to the statewide aggregate (except for Henderson County, which was higher) and low per capita income (except for Henderson and Transylvania Counties, which were higher). Per capita income measures for four out of the six primary market area counties were less than the comparable North Carolina measure and median household and per capita income for all of the market area counties, as well as the state of North Carolina, fell well below the comparable nationwide measures. The December 2013 unemployment rates for the counties in which the Company has branches varied with Macon and Cherokee Counties reporting higher unemployment rates than those for the United States and North Carolina, while the remaining counties reported unemployment rates that were the same or lower than on a nationwide and statewide basis.
Overall, the markets served by the Peer Group companies were more favorable with respect to supporting growth opportunities, as they generally operated in more populous and affluent markets than those served by the Company. As the Company’s lending markets have a relatively higher proportion of older residents, lending continues to be sluggish as demand for second homes and vacation rental properties remains curtailed. The Company’s competitive position in the primary market area, as indicated by deposit market share, was stronger than maintained by the Peer Group companies in general. Macon’s deposit market share equaled 38.03% in Macon County versus a 11.51% average and a 10.42% median deposit market share
| RP® Financial, LC. | VALUATION ANALYSIS | |
| IV.8 |
indicated for the Peer Group companies in their respective primary market area counties. On the other hand, Macon County reported a slightly higher unemployment rate of 7.3% than the average and median of the Peer Group companies of 6.2% and 6.0%. Summary demographic and deposit market share data for the Company and the Peer Group is provided in Exhibit III-2. On balance, we concluded that a slight downward adjustment was appropriate for the Company’s market area.
| 5. | Dividends |
Based on the various restrictions contained in the Order and the Written Agreement, the Bank may not pay dividends to the Company and the Company may not accept dividends from the Bank or pay dividends on its common stock without the prior written approval of the FRB. Future declarations of dividends by the Company’s Board of Directors will depend upon a number of factors, including investment opportunities, growth objectives, financial condition, profitability, tax considerations, minimum capital requirements, regulatory limitations, stock market characteristics and general economic conditions.
Six of the ten Peer Group companies paid regular cash dividends, with implied dividend yields ranging from 1.72% to 3.68%. The median dividend yield on the stocks of the Peer Group institutions equaled 1.95% as of February 14, 2014, representing a median payout ratio of 31.53% of earnings. As of February 14, 2014, 71% of all fully-converted publicly-traded thrifts had adopted cash dividend policies (see Exhibit IV-1), exhibiting a median yield of 1.48%. The dividend paying thrifts generally maintain higher than average profitability ratios, facilitating their ability to pay cash dividends.
From an equity perspective, the Company’s dividend payment capacity will be enhanced by the Conversion and resulting increase in capital, although Macon’s equity position will continue to be less favorable than the Peer Group’s and core earnings remain at a minimal net loss on a pro forma basis. In addition, the Company’s Written Agreement and the Bank’s Order, both of which restrict dividend payments while in place, are both negative with respect to the dividend. In addition, the Company will not be able to pay a dividend on its common stock until it makes good on previously deferred payments on its subordinated debentures and resumes regular interest payments on this debt. Furthermore, in accordance with the Written Agreement, the Company must obtain prior approval from the FRB before paying the deferred interest on the subordinated debt and resuming regular interest payments. On balance, we concluded that a moderate downward adjustment was warranted for this factor.
| RP® Financial, LC. | VALUATION ANALYSIS | |
| IV.9 |
| 6. | Liquidity of the Shares |
The Peer Group is by definition composed of companies that are traded in the public markets. All ten of the Peer Group companies trade on the NASDAQ. Typically, the number of shares outstanding and market capitalization provides an indication of how much liquidity there will be in a particular stock. The market capitalization of the Peer Group companies ranged from $31.28 million to $307.64 million as of February 14, 2014 with average and median market values of $119.42 million and $79.69 million, respectively. The shares issued and outstanding to the public shareholders of the Peer Group companies ranged from 2.3 million to 50.2 million, with average and median shares outstanding of 12.3 million and 6.9 million, respectively. The Company’s Offering is expected to have a pro forma market capitalization and shares outstanding that fall within the range of the Peer Group. Like all of the Peer Group companies, the Company’s stock will be quoted on the NASDAQ following the Offering. Overall, we anticipate that the Company’s common stock will have comparable liquidity to the Peer Group companies, with shares outstanding and market capitalization falling within the range of the Peer Group. Therefore, RP Financial concluded that no adjustment was necessary for this factor.
| 7. | Marketing of the Issue |
We believe that three separate markets exist for thrift stocks, including those coming to market such as Macon: (1) the after-market for public companies, in which trading activity is regular and investment decisions are made based upon financial condition, earnings, capital, ROE, dividends and future prospects; (2) the new issue market in which converting thrifts are evaluated on the basis of the same factors, but on a pro forma basis without the benefit of prior operations as a fully-converted publicly-held company and stock trading history; and (3) the acquisition market for thrift franchises in North Carolina. All three of these markets were considered in the valuation of the Company’s to-be-issued stock.
| A. | The Public Market |
The value of publicly-traded thrift stocks is easily measurable, and is tracked by most investment houses and related organizations. Exhibit IV-1 provides pricing and financial data on all publicly-traded thrifts. In general, thrift stock values react to market stimuli such as interest rates, inflation, perceived industry health, projected rates of economic growth, regulatory issues, and stock market conditions in general. Exhibit IV-2 displays historical stock market trends for various indices and includes historical stock price index values for thrifts and commercial banks. Exhibit IV-3 displays various stock price indices for thrifts only.
| RP® Financial, LC. | VALUATION ANALYSIS | |
| IV.10 |
In terms of assessing general stock market conditions, the overall stock market has generally trended higher in recent quarters, although there has been some pullback in the market year-to-date. The rally in the broader stock market that started at the end of the second quarter of 2013 continued during the first half of July 2013, as the Dow Jones Industrial Average (“DJIA”) closed at multiple new highs in mid-July. Some favorable economic data and assurances from the Federal Reserve that it would continue its easy monetary policies were noteworthy factors that fueled the gains in the broader stock market. The broader stock market traded in a narrow range during the second half of July, as investors digested some mixed second quarter earnings reports and awaited fresh data on the economy. Economic data showing a pick-up in manufacturing activity and new unemployment claims hitting a five-year low propelled the DJIA to a new record high at the beginning of August. Following sluggish job growth reflected in the July employment report and lowered sales forecast by some retailers, stocks retreated heading into mid-August. The downward trend in stocks continued through the second half of August, with the DJIA hitting a two-month low in late-August. Ongoing worries about the tapering of economic stimulus by the Federal Reserve and the prospect of a military strike on Syria were noteworthy factors that contributed to the downturn. Some favorable economic reports as well as subsiding investor concerns about Syria and the Federal Reserve scaling back its easy monetary policies helped stocks to regain some upward momentum during the first half of September. Stocks reversed course and traded down to close out the third quarter, which was attributed to renewed fears over the Federal Reserve scaling back its financial stimulus program and mounting concerns over the budget standoff in Washington.
Stocks fell broadly at the beginning of the fourth quarter of 2013, as investors weighed the consequences of the budget impasse in Washington and the possibility of an extended shutdown of the U.S. Government. Indications that lawmakers were nearing a deal to raise the federal debt ceiling and end the shutdown of the U.S. Government fueled a stock market rally heading into mid-October. A last minute compromise to raise the debt ceiling, which averted a default on the national debt and allowed for the re-opening of the U.S. Government sustained the positive trend in stocks through late-October. The DJIA closed at a record high in late-October, as weaker-than-expected job growth reflected in the September employment data and subdued inflation readings raised expectations that the Federal Reserve would stay the course on its easy money policies at its end of October meeting. An overall
| RP® Financial, LC. | VALUATION ANALYSIS | |
| IV.11 |
strong month for stocks closed with consecutive losses at the end of October, as investors who were expecting the Federal Reserve to downgrade its economic outlook were surprised that the Federal Reserve’s assessment of the economy was unchanged and, thereby, raised expectations that it could taper its stimulus efforts as early as its next policy meeting in December. Favorable reports on manufacturing and nonmanufacturing activity in October, along with comments from a Federal Reserve President suggesting that the Federal Reserve should wait for stronger evidence of economic momentum before tapering its bond-buying program, contributed to a rebound in stocks at the start of November. The DJIA closed at multiple record highs through mid-November, with a better-than-expected employment report for October and comments made by Federal Reserve Chairman nominee Janet Yellen during confirmation hearings that the Federal Reserve’s economic stimulus efforts would continue under her leadership contributed to the rally that included the DJIA closing above 16,000 for the first time. Stocks edged higher in the final week of November, as positive macroeconomic news contributed to the gains. Stocks traded lower at the start of December 2013, as a number of favorable economic reports stoked concerns that the Federal Reserve would start to wind down its stimulus efforts in the near future. After five consecutive losses in the DJIA, the stock market rebounded on news of the strong employment report for November. The rebound was temporary, as stocks eased lower ahead of the Federal Reserve’s mid-December meeting. Stocks surged at the conclusion of the Federal Reserve’s meeting, as investors approved of the Federal Reserve’s action to begin measured paring of its $85 billion a-month bond buying program. The DJIA moved to record highs in late-December, as more favorable economic reports helped to sustain the stock market rally through the end of 2013. Overall, the DJIA was up 30% during 2013, which was its strongest performance in 18 years.
Stocks retreated at the start of 2014, as profit taking and a disappointing employment report for December weighed on the broader stock market. Mixed fourth quarter earnings reports translated into an up and down stock market in mid-January. Concerns about weakening economies in emerging market countries precipitated a global stock market selloff heading into the second half of January, as the DJIA posted five consecutive losses. News that the Federal Reserve voted again to scale back its monthly bond buying program by another $10 billion, despite recent turmoil in emerging markets and soft jobs data, added to the selloff to close out January. A significant decline in January manufacturing activity drove stocks sharply lower at the start of February. Stocks rebounded heading into mid-February, as disappointing job growth reflected in the January employment report and congressional testimony by the new
| RP® Financial, LC. | VALUATION ANALYSIS | |
| IV.12 |
Federal Reserve Chairwoman eased investor concerns that the Federal Reserve would not continue on its current course of easy monetary policies. On February 14, 2014, the DJIA closed at 16,154.39, an increase of 15.5% from one year ago and a decrease of 2.5% year-to-date, and the NASDAQ closed at 4,244.03, an increase of 33.0% from one year ago and an increase of 1.6% year-to-date. The Standard & Poor’s 500 Index closed at 1,838.63 on February 14, 2014, an increase of 21.0% from one year ago and a decrease of 0.5% year-to-date.
The market for thrift stocks has also generally shown a positive trend in recent quarters, while pulling back in January 2014. The rally in thrift stocks started at the end of the second quarter of 2013 gained momentum early in the third quarter of 2013, as June employment data showed job growth beating expectations. Financial shares led the broader stock market higher heading into the second half of July, as some large banks beat second quarter earnings estimates. Thrift stocks edged lower at the end of July, as investors took some profit following the extended run-up in thrift prices. Some favorable economic data boosted thrift shares at the beginning of August, which was followed by a downturn amid indications from the Federal Reserve that tapering of quantitative easing was becoming more likely. After trading in a narrow range through mid-August, financial shares sold-off in late-August on the threat of a military strike on Syria and a weak report on consumer spending. Thrift stocks rebounded along with the broader stock market during the first half of September, which was followed by a slight downturn on expectations that the Federal Reserve could begin tapering its monthly asset purchases at its next meeting and the looming threat of the budget impasse shutting down the U.S. government.
Thrift issues stabilized at the start of the fourth quarter of 2013 and then traded lower as the budget impasse in Washington continued into a second week. A deal to raise the federal debt ceiling and re-open the U.S. Government lifted thrift stocks and the broader stock market to healthy gains in mid-October. Third quarter earnings reports and signs of merger activity picking up in the thrift sector boosted thrift shares in late-October, which was followed by a slight downturn at the end of October and into early-November as the Federal Reserve concluded its two day meeting by staying the course on quantitative easing and the benchmark interest rate. Thrift shares followed the broader stock market higher through mid-November, as the financial sector benefited from the better-than-expected employment report for October and a continuation of low interest rates. A larger-than-expected increase in a November consumer sentiment index and a decline in weekly jobless claims supported a modest gain for the thrift
| RP® Financial, LC. | VALUATION ANALYSIS | |
| IV.13 |
sector in late-November. Thrift issues generally followed trends in the broader stock market throughout December 2013, declining in early-December on the uncertain outlook for the Federal Reserve’s stimulus efforts and then rallying higher on the stronger-than-expected job growth reflected in the November employment data. After trading in a narrow range into mid-December, the rally in thrift issues resumed following the Federal Reserve’s mid-December meeting and announcement that it will begin to taper its bond buying. Thrift stocks participated in the broader stock market rally to close out 2013, with the SNL Index for all publicly-traded thrifts posting a gain of 25% for all of 2013.
Shares of thrift issues traded down at the start of 2014, as the 10-year Treasury yield approached 3.0% in early-January. Thrift stocks were also hurt by the disappointing employment report for December and then traded in a narrow range in mid-January, as investors reacted to mixed fourth quarter earnings reports from the banking sector at the start of the fourth quarter earnings season. Financial shares participated in the selloff experienced in the broader stock market during the second half of January and the first trading day of February. Janet Yellen’s debut congressional testimony as Federal Reserve Chairwoman helped to spark a rally in thrift stocks heading into mid-February, as she indicated that there are no plans to change course from the Federal Reserve’s current monetary policies. On February 14, 2014, the SNL Index for all publicly-traded thrifts closed at 685.1, an increase of 16.1% from one year ago and a decrease of 3.0% year-to-date.
| B. | The New Issue Market |
In addition to thrift stock market conditions in general, the new issue market for converting thrifts is also an important consideration in determining the Company’s pro forma market value. The new issue market is separate and distinct from the market for seasoned thrift stocks in that the pricing ratios for converting issues are computed on a pro forma basis, specifically: (1) the numerator and denominator are both impacted by the conversion offering amount, unlike existing stock issues in which price change affects only the numerator; and (2) the pro forma pricing ratio incorporates assumptions regarding source and use of proceeds, effective tax rates, stock plan purchases, etc. which impact pro forma financials, whereas pricing for existing issues are based on reported financials. The distinction between pricing of converting and existing issues is perhaps no clearer than in the case of the P/B ratio in that the P/B ratio of a converting thrift will typically result in a discount to book value whereas in the current market for existing thrifts the P/B ratio may reflect a premium to book value. Therefore, it is appropriate to also consider the market for new issues, both at the time of the conversion and in the aftermarket.
| RP® Financial, LC. | VALUATION ANALYSIS | |
| IV.14 |
Table 4.1, reflects two standard conversions and one second step conversion that have been completed during the past three months. The two standard conversion offerings are considered to be more relevant for the Company’s pro forma pricing. Both offerings were completed in January 2014, closing at an average of 109% of the midpoint valuation range, raising an average of $28.1 million of gross proceeds. These two offerings closed at an average pro forma P/TB ratio of 63.6% and reflected average price appreciation of 5.0% after the first week of trading. Through February 14, 2014, these two standard conversion stocks were trading at an average of 2.2% above the offering price.
Importantly, there are some similarities and some key differences between the Company and the two recent standard conversions. Edgewater Bancorp, Inc. of Michigan (“Edgewater”), which closed its offering on January 17, 2014, at a P/TB ratio of 55.0% had a lower level of NPAs on a pre-conversion basis (3.84% NPAs-to-assets versus 6.26% for the Company) and was reporting losses on a trailing twelve month basis (pro forma core ROA equal to -1.4%). Gross proceeds of Edgewater’s offering equaled only $6.7 million and thus, the post-conversion market capitalization and expected liquidity of the newly-issued shares of Macon will be well in excess of Edgewater’s issued shares. Edgewater is not listed on NASDAQ and is significantly smaller in asset size ($120 million), but operates in relatively similar rural markets.
Coastway Bancorp, Inc. of Rhode Island (“Coastway”) closed its offering on January 15, 2014 at a pro forma P/TB ratio of 72.1%. Coastway is also smaller than Macon in terms of asset size ($381 million) and has a lower NPA-to-assets ratio (2.16%) and was profitable in the period leading up to the completion of its conversion (core ROA equal to 0.1%). Coastway’s gross offering proceeds of $49.5 million fell roughly in the middle of Macon’s Offering range and Coastway’s common stock currently trades on NASDAQ.
We believe that of these two newly-converted companies, Coastway is relatively more comparable to Macon as it is larger than Edgewater and has a similar size branch network (11 branches) in comparison to Macon (13 branches). Coastway had a significantly higher tangible equity to assets ratio as compared to Macon on a pro-forma basis (16.3% versus 8.81% for Macon), which suggests that the Company should be at a discount relative to Coastway’s pro forma conversion pricing ratios.
| RP® Financial, LC. | VALUATION ANALYSIS | |
| IV.15 |
Table 4.1
Pricing Characteristics and After-Market Trends
Conversions Completed in the Last Three Months
| Pre-Conversion Data | Contribution to | Insider Purchases | ||||||||||||||||||||||||||||||||||||||||||||||||||||||||||||||||
Institutional Information | Financial Info. | Asset Quality | Offering Information | Char. Found. | % Off Incl. Fdn.+Merger Shares | |||||||||||||||||||||||||||||||||||||||||||||||||||||||||||||
| Excluding Foundation | % of | Benefit Plans | ||||||||||||||||||||||||||||||||||||||||||||||||||||||||||||||||
| Public Off. | Initial | |||||||||||||||||||||||||||||||||||||||||||||||||||||||||||||||||
Institution | Conversion Date | Ticker | Assets | Equity/ Assets | NPAs/ Assets | Res. Cov. | Gross Proc. | % Offer | % of Mid. | Exp./ Proc. | Form | Excl. Fdn. | ESOP | Recog. Plans | Stk Option | Mgmt.& Dirs. | Div. Yield | |||||||||||||||||||||||||||||||||||||||||||||||||
| ($Mil) | (%) | (%) | (%) | ($Mil.) | (%) | (%) | (%) | (%) | (%) | (%) | (%) | (%)(1) | (%) | |||||||||||||||||||||||||||||||||||||||||||||||||||||
Standard Conversions | ||||||||||||||||||||||||||||||||||||||||||||||||||||||||||||||||||
Edgewater Bancorp, Inc. - MI | 1/17/14 | EGDW-OTCBB | $ | 120 | 8.15 | % | 3.84 | % | 33 | % | $ | 6.7 | 100 | % | 86 | % | 19.5 | % | N.A | N.A. | 8.0 | % | 4.0 | % | 10.0 | % | 13.5 | % | 0.00 | % | ||||||||||||||||||||||||||||||||||||
Coastway Bancorp, Inc. - RI* | 1/15/14 | CWAY-NASDAQ | $ | 381 | 7.24 | % | 2.16 | % | 25 | % | $ | 49.5 | 100 | % | 132 | % | 3.2 | % | C/S | $ | 300K/2.5 | % | 8.0 | % | 4.0 | % | 10.0 | % | 1.8 | % | 0.00 | % | ||||||||||||||||||||||||||||||||||
Averages - Standard Conversions: | $ | 250 | 7.70 | % | 3.00 | % | 29 | % | $ | 28.1 | 100 | % | 109 | % | 11.3 | % | N.A. | N.A. | 8.0 | % | 4.0 | % | 10.0 | % | 7.6 | % | 0.00 | % | ||||||||||||||||||||||||||||||||||||||
Medians - Standard Conversions: | $ | 250 | 7.70 | % | 3.00 | % | 29 | % | $ | 28.1 | 100 | % | 109 | % | 11.3 | % | N.A. | N.A. | 8.0 | % | 4.0 | % | 10.0 | % | 7.6 | % | 0.00 | % | ||||||||||||||||||||||||||||||||||||||
Second Step Conversions | ||||||||||||||||||||||||||||||||||||||||||||||||||||||||||||||||||
Waterstone Financial, Inc. - WI* | 1/23/14 | WSBF-NASDAQ | $ | 1,598 | 13.32 | % | 5.04 | % | 43 | % | $ | 253.0 | 74 | % | 115 | % | 3.4 | % | N.A. | N.A. | 8.0 | % | 4.0 | % | 10.0 | % | 0.8 | % | 0.00 | % | ||||||||||||||||||||||||||||||||||||
Averages - Second Step Conversions: | $ | 1,598 | 13.32 | % | 5.04 | % | 43 | % | $ | 253.0 | 74 | % | 115 | % | 3.4 | % | N.A. | N.A. | 8.0 | % | 4.0 | % | 10.0 | % | 0.8 | % | 0.00 | % | ||||||||||||||||||||||||||||||||||||||
Medians - Second Step Conversions: | $ | 1,598 | 13.32 | % | 5.04 | % | 43 | % | $ | 253.0 | 74 | % | 115 | % | 3.4 | % | N.A. | N.A. | 8.0 | % | 4.0 | % | 10.0 | % | 0.8 | % | 0.00 | % | ||||||||||||||||||||||||||||||||||||||
Averages - All Conversions: | $ | 699 | 9.57 | % | 3.68 | % | 34 | % | $ | 103.1 | 91 | % | 111 | % | 8.7 | % | N.A. | N.A. | 8.0 | % | 4.0 | % | 10.0 | % | 5.4 | % | 0.00 | % | ||||||||||||||||||||||||||||||||||||||
Medians - All Conversions: | $ | 381 | 8.15 | % | 3.84 | % | 33 | % | $ | 49.5 | 100 | % | 115 | % | 3.4 | % | N.A. | N.A. | 8.0 | % | 4.0 | % | 10.0 | % | 1.8 | % | 0.00 | % | ||||||||||||||||||||||||||||||||||||||
| Pro Forma Data | Post-IPO Pricing Trends | |||||||||||||||||||||||||||||||||||||||||||||||||||||||||||||||||
Institutional Information | Pricing Ratios(2)(5) | Financial Charac. | Closing Price: | |||||||||||||||||||||||||||||||||||||||||||||||||||||||||||||||
| First | After First | After First | ||||||||||||||||||||||||||||||||||||||||||||||||||||||||||||||||
Institution | Conversion Date | Ticker | P/TB | Core P/E | P/A | Core ROA | TE/A | Core ROE | IPO Price | Trading Day | % Chge | Weeks(3) | % Chge | Month(4) | % Chge | Thru 2/14/14 | % Chge | |||||||||||||||||||||||||||||||||||||||||||||||||
| (%) | (x) | (%) | (%) | (%) | (%) | ($) | ($) | (%) | ($) | (%) | ($) | (%) | ($) | (%) | ||||||||||||||||||||||||||||||||||||||||||||||||||||
Standard Conversions | ||||||||||||||||||||||||||||||||||||||||||||||||||||||||||||||||||
Edgewater Bancorp, Inc. - MI | 1/17/14 | EGDW-OTCBB | 55.0 | % | NM | 5.5 | % | -1.4 | % | 10.0 | % | -13.1 | % | $ | 10.00 | $ | 10.00 | 0.0 | % | $ | 10.25 | 2.5 | % | $ | 10.25 | 2.5 | % | $ | 10.25 | 2.5 | % | |||||||||||||||||||||||||||||||||||
Coastway Bancorp, Inc. - RI* | 1/15/14 | CWAY-NASDAQ | 72.1 | % | 114.2 | x | 11.7 | % | 0.1 | % | 16.3 | % | 0.6 | % | $ | 10.00 | $ | 10.92 | 9.2 | % | $ | 10.75 | 7.5 | % | $ | 10.19 | 1.9 | % | $ | 10.19 | 1.9 | % | ||||||||||||||||||||||||||||||||||
Averages - Standard Conversions: | 63.6 | % | 114.2 | x | 8.6 | % | -0.6 | % | 13.1 | % | -6.2 | % | $ | 10.00 | $ | 10.46 | 4.6 | % | $ | 10.50 | 5.0 | % | $ | 10.22 | 2.2 | % | $ | 10.22 | 2.2 | % | ||||||||||||||||||||||||||||||||||||
Medians - Standard Conversions: | 63.6 | % | 114.2 | x | 8.6 | % | -0.6 | % | 13.1 | % | -6.2 | % | $ | 10.00 | $ | 10.46 | 4.6 | % | $ | 10.50 | 5.0 | % | $ | 10.22 | 2.2 | % | $ | 10.22 | 2.2 | % | ||||||||||||||||||||||||||||||||||||
Second Step Conversions | ||||||||||||||||||||||||||||||||||||||||||||||||||||||||||||||||||
Waterstone Financial, Inc. - WI* | 1/23/14 | WSBF-NASDAQ | 80.7 | % | 23.05 | 19.0 | % | 0.8 | % | 23.5 | % | 3.5 | % | $ | 10.00 | $ | 10.66 | 6.6 | % | $ | 10.58 | 5.8 | % | $ | 10.60 | 6.0 | % | $ | 10.60 | 6.0 | % | |||||||||||||||||||||||||||||||||||
Averages - Second Step Conversions: | 80.7 | % | 23.1 | x | 19.0 | % | 0.8 | % | 23.5 | % | 3.5 | % | $ | 10.00 | $ | 10.66 | 6.6 | % | $ | 10.58 | 5.8 | % | $ | 10.60 | 6.0 | % | $ | 10.60 | 6.0 | % | ||||||||||||||||||||||||||||||||||||
Medians - Second Step Conversions: | 80.7 | % | 23.1 | x | 19.0 | % | 0.8 | % | 23.5 | % | 3.5 | % | $ | 10.00 | $ | 10.66 | 6.6 | % | $ | 10.58 | 5.8 | % | $ | 10.60 | 6.0 | % | $ | 10.60 | 6.0 | % | ||||||||||||||||||||||||||||||||||||
Averages - All Conversions: | 69.3 | % | 68.6 | x | 12.1 | % | -0.1 | % | 16.6 | % | -3.0 | % | $ | 10.00 | $ | 10.53 | 5.3 | % | $ | 10.53 | 5.3 | % | $ | 10.35 | 3.5 | % | $ | 10.35 | 3.5 | % | ||||||||||||||||||||||||||||||||||||
Medians - All Conversions: | 72.1 | % | 68.6 | x | 11.7 | % | 0.1 | % | 16.3 | % | 0.6 | % | $ | 10.00 | $ | 10.66 | 6.6 | % | $ | 10.58 | 5.8 | % | $ | 10.25 | 2.5 | % | $ | 10.25 | 2.5 | % | ||||||||||||||||||||||||||||||||||||
Note: * - Appraisal performed by RP Financial; BOLD = RP Fin. Did the business plan, “NT” - Not Traded; “NA” - Not Applicable, Not Available; C/S-Cash/Stock.
| (1) | As a percent of MHC offering for MHC transactions. |
| (2) | Does not take into account the adoption of SOP 93-6. |
| (3) | Latest price if offering is less than one week old. |
| (4) | Latest price if offering is more than one week but less than one month old. |
| (5) | Mutual holding company pro forma data on full conversion basis. |
| (6) | Simultaneously completed acquisition of another financial institution. |
| (7) | Simultaneously converted to a commercial bank charter. |
| (8) | Former credit union. |
February 14, 2014
| RP® Financial, LC. | VALUATION ANALYSIS | |
| IV.16 |
As noted previously, neither of the two companies completing standard conversions over the last three months was based in the Southeast. There have been no standard conversions completed in the Southeast since July 2012.
Shown in Table 4.2 are the current pricing ratios for the offerings completed during the past three months that trade on NASDAQ. Coastway Bancorp, the company that completed a standard conversion during that timeframe is considered to be more relevant. The current P/TB ratio of Coastway Bancorp equaled 73.47% as of February 14, 2014.
| C. | The Acquisition Market |
Also considered in the valuation was the potential impact on Macon’s conversion value of recently completed and pending acquisitions of other thrift institutions operating in North Carolina. As shown in Exhibit IV-4, there were 13 thrift acquisitions completed from the beginning of 2000 through February 14, 2014. Additionally, there were 63 acquisitions of commercial banks in North Carolina over the corresponding timeframe. The recent acquisition activity may imply a certain degree of acquisition speculation for the Company’s stock. To the extent that acquisition speculation may impact the Company’s Offering, we have largely taken this into account in selecting companies for the Peer Group which operate in markets that have experienced a comparable level of acquisition activity as the Company’s market and, thus, are subject to the same type of acquisition speculation that may influence Macon’s stock. However, since converting thrifts are subject to a three-year regulatory moratorium from being acquired, acquisition speculation in Macon’s stock would tend to be less, compared to the stocks of the Peer Group companies.
* * * * * * * * * * *
In determining our valuation adjustment for marketing of the issue, we considered trends in both the overall thrift market, the new issue market including the new issue market for thrift conversions and the local acquisition market for thrift and bank stocks. Taking these factors and trends into account, RP Financial concluded that no adjustment was appropriate in the valuation analysis for purposes of marketing of the issue.
| RP® Financial, LC. | VALUATION ANALYSIS | |
| IV.17 |
Table 4.2
Market Pricing Comparatives
Prices As of February 14, 2014
| Market | Per Share Data | |||||||||||||||||||||||||||||||||||||||||||||||||||||||||||||||||||||||||||||||||
| Capitalization | Core | Book | Dividends(3) | Financial Characteristics(5) | ||||||||||||||||||||||||||||||||||||||||||||||||||||||||||||||||||||||||||||||
Financial Institution | Price/ | Market | 12 Month | Value/ | Pricing Ratios(2) | Amount/ | Payout | Total | Equity/ | Tang Eq/ | NPAs/ | Reported | Core | |||||||||||||||||||||||||||||||||||||||||||||||||||||||||||||||||||||
| Share | Value | EPS(1) | Share | P/E | P/B | P/A | P/TB | P/Core | Share | Yield | Ratio(4) | Assets | Assets | Assets | Assets | ROA | ROE | ROA | ROE | |||||||||||||||||||||||||||||||||||||||||||||||||||||||||||||||
| ($) | ($Mil) | ($) | ($) | (x) | (%) | (%) | (%) | (x) | ($) | (%) | (%) | ($Mil) | (%) | (%) | (%) | (%) | (%) | (%) | (%) | |||||||||||||||||||||||||||||||||||||||||||||||||||||||||||||||
All Non-MHC Public Companies | $ | 16.51 | $ | 344.10 | $ | 0.82 | $ | 15.47 | 17.42 | x | 104.92 | % | 13.36 | % | 113.87 | % | 18.14 | x | $ | 0.29 | 1.72 | % | 47.73 | % | $ | 2,478 | 13.23 | % | 12.34 | % | 3.00 | % | 0.55 | % | 4.13 | % | 0.51 | % | 4.01 | % | ||||||||||||||||||||||||||||||||||||||||||
Converted Last 3 Months (no MHC) | $ | 10.40 | $ | 207.57 | $ | 0.49 | $ | 10.03 | 11.75 | x | 122.40 | % | 17.39 | % | 122.64 | % | 11.82 | x | $ | 0.00 | 0.00 | % | 0.00 | % | $ | 989 | 10.28 | % | 10.26 | % | 5.27 | % | 1.00 | % | 8.41 | % | 1.04 | % | 8.90 | % | ||||||||||||||||||||||||||||||||||||||||||
Converted Last 3 Months (no MHC) | ||||||||||||||||||||||||||||||||||||||||||||||||||||||||||||||||||||||||||||||||||
CWAY | Coastway Bancorp, Inc. of RI | $ | 10.19 | $ | 50.43 | $ | 0.09 | $ | 13.87 | NM | 73.47 | % | 11.96 | % | 73.47 | % | NM | $ | 0.00 | 0.00 | % | 0.00 | % | $ | 381 | 7.24 | % | 7.24 | % | 3.90 | % | 0.13 | % | 1.74 | % | 0.20 | % | 2.80 | % | |||||||||||||||||||||||||||||||||||||||||||
WSBF | Waterstone Financial, Inc. of WI | $ | 10.60 | $ | 364.71 | $ | 0.90 | $ | 6.19 | 11.75 | x | 171.32 | % | 22.82 | % | 171.81 | % | 11.82 | x | $ | 0.00 | 0.00 | % | 0.00 | % | $ | 1,598 | 13.32 | % | 13.29 | % | 6.63 | % | 1.88 | % | 15.08 | % | 1.87 | % | 14.99 | % | |||||||||||||||||||||||||||||||||||||||||
| (1) | Core income, on a diluted per-share basis. Core income is net income after taxes and before extraordinary items, less net income attributable to noncontrolling interest, gain on the sale of securities, amortization of intangibles, goodwill and nonrecurring items. Assumed tax rate is 35%. |
| (2) | P/E = Price to earnings; P/B = Price to book; P/A = Price to assets; P/TB = Price to tangible book value; and P/Core = Price to core earnings. P/E and P/Core =NM if the ratio is negative or above 35x. |
| (3) | Indicated 12 month dividend, based on last quarterly dividend declared. |
| (4) | Indicated 12 month dividend as a percent of trailing 12 month earnings. |
| (5) | ROAA (return on average assets) and ROAE (return on average equity) are indicated ratios based on trailing 12 month earnings and average equity and assets balances. |
| (6) | Excludes from averages and medians those companies the subject of actual or rumored acquisition activities or unusual operating characteristics. |
| Source: | SNL Financial, LC. and RP® Financial, LC. calculations. The information provided in this report has been obtained from sources we believe are reliable, but we cannot guarantee the accuracy or completeness of such information. |
Copyright (c) 2014 by RP® Financial, LC.
| RP® Financial, LC. | VALUATION ANALYSIS | |
| IV.18 |
| 8. | Management |
The Company’s management team appears to have experience and expertise in all of the key areas of the Company’s operations. Exhibit IV-5 provides summary resumes of the Company’s Board of Directors and senior management. The financial characteristics of the Bank suggest that the Board and senior management have been effective and made progress in addressing deficiencies and implementing an operating strategy that can be well managed by the Company’s present organizational structure. Currently the Company does not have any senior management positions that are vacant. The Company recently hired a new CFO with public accounting experience to prepare Macon to operate as a public company and its prior CFO, who has been with the Company for approximately eight years, is now its Chief Operating Officer. Moreover, the Company has and continues to strengthen commercial lending management. Similarly, the returns, equity positions, and other operating measures of the Peer Group companies are indicative of well-managed financial institutions, which have Boards and management teams that have been effective in making progress toward the safety and soundness of their companies and in implementing competitive operating strategies. Therefore, we concluded no valuation adjustment relative to the Peer Group was appropriate for this factor.
| 9. | Effect of Government Regulation and Regulatory Reform |
As a fully-converted regulated institution, the Company will operate in substantially the same regulatory environment as the Peer Group companies. At the same time, the Bank is subject to the terms of the Order and Macon is subject to the Written Agreement and both are assumed to remain in effect post-Conversion. We have considered the regulatory restrictions on the Bank paying and the Company receiving common stock dividends, regulatory restrictions on the Company paying dividends on its common stock and making distributions of interest on subordinated debentures, and the enhanced regulatory oversight that regulatory agreements imply. Exhibit IV-6 reflects the Bank’s pro forma regulatory capital ratios. Based on the available public disclosures, none of the ten Peer Group companies are subject to similar regulatory agreements.
Taking these factors into account, a moderate downward adjustment has been applied for the effect of government regulation and regulatory reform.
| RP® Financial, LC. | VALUATION ANALYSIS | |
| IV.19 |
Summary of Adjustments
Overall, based on the factors discussed above, we concluded that the Company’s pro forma market value should reflect the following valuation adjustments relative to the Peer Group:
Key Valuation Parameters: | Valuation Adjustment | |
Financial Condition | Moderate Downward | |
Profitability, Growth and Viability of Earnings | Significant Downward | |
Asset Growth | Slight Downward | |
Primary Market Area | Slight Downward | |
Dividends | Moderate Downward | |
Liquidity of the Shares | No Adjustment | |
Marketing of the Issue | No Adjustment | |
Management | No Adjustment | |
Effect of Govt. Regulations and Regulatory Reform | Moderate Downward | |
Valuation Approaches
In applying the accepted valuation methodology originally promulgated by the OTS and accepted by the FRB and the Commissioner, i.e., the pro forma market value approach, we considered the three key pricing ratios in valuing the Company’s to-be-issued stock — price/earnings (“P/E”), price/book (“P/B”), and price/assets (“P/A”) approaches — all performed on a pro forma basis including the effects of the stock proceeds. In computing the pro forma impact of the Conversion and the related pricing ratios, we have incorporated the valuation parameters disclosed in the Company’s prospectus for reinvestment rate, effective tax rate, stock benefit plan assumptions, insider purchases, and Offering expenses (summarized in Exhibits IV-7 and IV-8).
In our estimate of value, we assessed the relationship of the pro forma pricing ratios relative to the Peer Group and recent conversion offerings.
RP Financial’s valuation placed an emphasis on the following:
| • | P/E Approach. The P/E approach is generally the best indicator of long-term value for a stock. However, the Company’s operating results for fiscal year 2013, including on a pro-forma basis, rendered the P/E multiple not meaningful in this valuation. Accordingly we have considered the Company’s recorded and core earnings vs. the Peer Group’s but did not consider the P/E multiple to be meaningful given the Company’s lack of reported and core earnings. |
| RP® Financial, LC. | VALUATION ANALYSIS | |
| IV.20 |
| • | P/B Approach. P/B ratios have generally served as a useful benchmark in the valuation of thrift stocks, particularly in the context of a conversion offering, as the earnings approach involves assumptions regarding the use of proceeds. RP Financial considered the P/B approach to be a valuable indicator of pro forma value; particularly as the earnings approach has been rendered less meaningful to the Company’s valuation in view of Macon’s recent operating loss and low earnings reported by the Peer Group. We have also modified the P/B approach to exclude the impact of intangible assets (i.e., price/tangible book value or “P/TB”), in that the investment community frequently makes this adjustment in its evaluation of this pricing approach. |
| • | P/A Approach. P/A ratios are generally a less reliable indicator of market value, as investors typically assign less weight to assets and attribute greater weight to book value and earnings. Furthermore, this approach as set forth in the regulatory valuation guidelines does not take into account the amount of stock purchases funded by deposit withdrawals, thus understating the pro forma P/A ratio. At the same time, the P/A ratio is an indicator of franchise value, and, in the case of highly capitalized institutions, high P/A ratios may limit the investment community’s willingness to pay market multiples for earnings or book value when ROE is expected to be low. |
Based on the application of the three valuation approaches, taking into consideration the valuation adjustments discussed previously, RP Financial concluded that, as of February 14, 2014, the pro forma market value of Macon’s conversion stock was $43,000,000 at the midpoint, equal to 4,300,000 shares at $10.00 per share.
1.Price-to-Earnings (“P/E”). The application of the P/E valuation method requires calculating the Company’s pro forma market value by applying a valuation P/E multiple to the pro forma earnings base. In applying this technique, we considered both reported earnings and a recurring earnings base, that is, earnings adjusted to exclude any one-time non-operating items, plus the estimated after-tax earnings benefit of the reinvestment of the net proceeds. The reinvestment rate of 1.23% (net of tax) was based on the Company’s assumption that the proceeds would initially be invested in short-to-intermediate term U.S. Treasury securities and the 1.75% yield assumption reflects the prevailing five year Treasury rate as of December 31, 2013. In deriving core earnings, adjustments made to reported earnings are to eliminate non-operating items, such as gains on the sale of securities. The derivation of the Company’s core earnings for fiscal 2013 is set forth in the table on the following page.
| Amount | ||||
| ($000) | ||||
Reported Net Loss | ($ | 415 | ) | |
Less: Gain on Sale of Investments (Tax effected @ 30%) | (251 | ) | ||
Addback: Change in DTA Valuation Allowance | 429 | |||
|
| |||
Core earnings/(loss) estimate | ($ | 237 | ) | |
| RP® Financial, LC. | VALUATION ANALYSIS | |
| IV.21 |
On a reported basis, the Company recorded a net loss of $415,000 or 0.05% of average assets for fiscal 2013. Deducting the gain on sale of securities of $358,000 (or $251,000 on a tax effected basis) and increasing the DTA valuation allowance of $429,000, resulted in a net loss of $237,000 or 0.03% of average assets on a core basis for Macon. Both the Company’s reported and core earnings were significantly lower than the Peer Group median reported and core ROAA of 0.62% and 0.59% of average assets, respectively. There is a positive impact of $125,935 on reported and core earnings from the Conversion (at the midpoint), which represents the net of the reinvestment income from the conversion proceeds less the expense associated with the benefit plans. The resulting pro forma reported and core net losses are $289,065 and $110,665, respectively. Accordingly, the Company’s pro forma P/E ratios are not meaningful on either a reported or core basis. The Peer Group’s average and median P/E ratios were 20.23 and 18.24 times and the average and median P/Core earnings ratios were 18.74 and 17.07 times.
2.Price-to-Book (“P/B”). The application of the P/B valuation method requires calculating the Company’s pro forma market value by applying a valuation P/B ratio, derived from the Peer Group’s P/B ratio, to the Company’s pro forma book value. In applying the P/B approach, we considered both reported book value and tangible book value. Based on the $43.0 million midpoint valuation, the Company’s pro forma P/B and P/TB ratios both equaled 59.17%, as shown in Table 4.3. In comparison to the average P/B and P/TB ratios indicated for the Peer Group of 88.13% and 93.57%, the Company’s ratios reflected discounts of 32.9% and 36.8%, respectively. In comparison to the median P/B and P/TB ratios indicated for the Peer Group of 86.30% and 92.06%, the Company’s ratios reflected discounts of 31.4% and 35.7%, respectively. At the top of the super range, the Company’s P/B and P/TB ratios both equaled 66.14% and reflected discounts of 29.3% relative to the Peer Group P/TB average and 28.2% relative to the Peer Group P/TB median.
3.Price-to-Assets (“P/A”). The P/A valuation methodology determines market value by applying a valuation P/A ratio to the Company’s pro forma asset base, conservatively
| RP® Financial, LC. | VALUATION ANALYSIS | |
| IV.22 |
Table 4.3
Public Market Pricing Versus Peer Group
Entegra Financial Corp.
As of February 14, 2014
| Market | Per Share Data | |||||||||||||||||||||||||||||||||||||||||||||||||||||||||||||||||||||||||||||||||||
| Capitalization | Core | Book | Dividends(3) | Financial Characteristics(5) | ||||||||||||||||||||||||||||||||||||||||||||||||||||||||||||||||||||||||||||||||
| Price/ | Market | 12 Month | Value/ | Pricing Ratios(2) | Amount/ | Yield | Payout | Total | Equity/ | Tang. Eq./ | NPAs/ | Reported | Core | |||||||||||||||||||||||||||||||||||||||||||||||||||||||||||||||||||||||
| Share | Value | EPS(1) | Share | P/E | P/B | P/A | P/TB | P/Core | Share | Ratio(4) | Assets | Assets | T. Assets | Assets | ROAA | ROAE | ROAA | ROAE | ||||||||||||||||||||||||||||||||||||||||||||||||||||||||||||||||||
| ($) | ($Mil) | ($) | ($) | (x) | (%) | (%) | (%) | (x) | ($) | (%) | (%) | ($Mil) | (%) | (%) | (%) | (%) | (%) | (%) | (%) | |||||||||||||||||||||||||||||||||||||||||||||||||||||||||||||||||
Entegra Financial Corp. | ||||||||||||||||||||||||||||||||||||||||||||||||||||||||||||||||||||||||||||||||||||
Supermaximum | $ | 10.00 | $ | 56.87 | ($ | 0.01 | ) | $ | 15.12 | NM | 66.14 | % | 6.79 | % | 66.14 | % | NM | $ | 0.00 | 0.00 | % | 0.00 | % | $ | 838 | 10.26 | % | 10.26 | % | 5.86 | % | -0.03 | % | -0.28 | % | -0.01 | % | -0.08 | % | |||||||||||||||||||||||||||||||||||||||||||||
Maximum | $ | 10.00 | $ | 49.45 | ($ | 0.02 | ) | $ | 15.95 | NM | 62.70 | % | 5.95 | % | 62.70 | % | NM | $ | 0.00 | 0.00 | % | 0.00 | % | $ | 831 | 9.49 | % | 9.49 | % | 5.92 | % | -0.03 | % | -0.34 | % | -0.01 | % | -0.11 | % | |||||||||||||||||||||||||||||||||||||||||||||
Midpoint | $ | 10.00 | $ | 43.00 | ($ | 0.03 | ) | $ | 16.90 | NM | 59.17 | % | 5.21 | % | 59.17 | % | NM | $ | 0.00 | 0.00 | % | 0.00 | % | $ | 825 | 8.81 | % | 8.81 | % | 5.96 | % | -0.04 | % | -0.40 | % | -0.01 | % | -0.15 | % | |||||||||||||||||||||||||||||||||||||||||||||
Minimum | $ | 10.00 | $ | 36.55 | ($ | 0.04 | ) | $ | 18.20 | NM | 54.95 | % | 4.47 | % | 54.95 | % | NM | $ | 0.00 | 0.00 | % | 0.00 | % | $ | 819 | 8.12 | % | 8.12 | % | 6.00 | % | -0.04 | % | -0.47 | % | -0.02 | % | -0.20 | % | |||||||||||||||||||||||||||||||||||||||||||||
All Non-MHC Public Companies(6) | ||||||||||||||||||||||||||||||||||||||||||||||||||||||||||||||||||||||||||||||||||||
Averages | $ | 16.51 | $ | 344.10 | $ | 0.82 | $ | 15.47 | 17.42 | x | 104.92 | % | 13.36 | % | 113.87 | % | 18.14 | x | $ | 0.29 | 1.72 | % | 47.73 | % | $ | 2,478 | 13.23 | % | 12.34 | % | 3.00 | % | 0.55 | % | 4.13 | % | 0.51 | % | 4.01 | % | ||||||||||||||||||||||||||||||||||||||||||||
Median | $ | 15.05 | $ | 94.66 | $ | 0.67 | $ | 14.91 | 16.28 | x | 96.11 | % | 12.34 | % | 102.39 | % | 17.20 | x | $ | 0.24 | 1.48 | % | 42.53 | % | $ | 771 | 12.29 | % | 11.57 | % | 2.26 | % | 0.63 | % | 4.68 | % | 0.60 | % | 4.34 | % | ||||||||||||||||||||||||||||||||||||||||||||
All Non-MHC State of NC(6) | ||||||||||||||||||||||||||||||||||||||||||||||||||||||||||||||||||||||||||||||||||||
Averages | $ | 16.50 | $ | 197.79 | $ | 0.45 | $ | 19.08 | 25.92 | x | 86.45 | % | 15.44 | % | 86.86 | % | 24.41 | x | $ | 0.00 | $ | 0.00 | $ | 0.00 | $ | 1,181 | 17.88 | % | 17.80 | % | 3.90 | % | 0.46 | % | 2.29 | % | 0.47 | % | 2.27 | % | ||||||||||||||||||||||||||||||||||||||||||||
Medians | $ | 16.50 | $ | 197.79 | $ | 0.45 | $ | 19.08 | 25.92 | x | 86.45 | % | 15.44 | % | 86.86 | % | 24.41 | x | $ | 0.00 | $ | 0.00 | $ | 0.00 | $ | 1,181 | 17.88 | % | 17.80 | % | 3.90 | % | 0.46 | % | 2.29 | % | 0.47 | % | 2.27 | % | ||||||||||||||||||||||||||||||||||||||||||||
Comparable Group | ||||||||||||||||||||||||||||||||||||||||||||||||||||||||||||||||||||||||||||||||||||
Averages | $ | 13.07 | $ | 119.42 | $ | 0.65 | $ | 15.15 | 20.23 | x | 88.13 | % | 11.98 | % | 93.57 | % | 18.74 | x | $ | 0.19 | 1.66 | % | 40.82 | % | $ | 933 | 14.05 | % | 13.46 | % | 3.44 | % | 0.58 | % | 4.30 | % | 0.56 | % | 4.13 | % | ||||||||||||||||||||||||||||||||||||||||||||
Medians | $ | 11.00 | $ | 79.69 | $ | 0.58 | $ | 13.99 | 18.24 | x | 86.30 | % | 10.51 | % | 92.06 | % | 17.07 | x | $ | 0.24 | 1.95 | % | 31.53 | % | $ | 710 | 12.90 | % | 12.25 | % | 3.13 | % | 0.62 | % | 4.55 | % | 0.59 | % | 3.90 | % | ||||||||||||||||||||||||||||||||||||||||||||
State of NC(6) | ||||||||||||||||||||||||||||||||||||||||||||||||||||||||||||||||||||||||||||||||||||
ASBB | ASB Bncp Inc | NC | $ | 17.45 | $ | 87.95 | $ | 0.26 | $ | 20.06 | NM | 87.00 | % | 12.00 | % | 87.00 | % | NM | $ | 0.00 | 0.00 | % | 0.00 | % | $ | 733 | 13.79 | % | 13.79 | % | 2.82 | % | 0.19 | % | 1.37 | % | 0.16 | % | 1.13 | % | ||||||||||||||||||||||||||||||||||||||||||||
HTBI | HomeTrust Bancshares Inc. | NC | $ | 15.55 | $ | 307.64 | $ | 0.64 | $ | 18.10 | 25.92 | x | 85.91 | % | 18.88 | % | 86.73 | % | 24.41 | x | $ | 0.00 | 0.00 | % | 0.00 | % | $ | 1,629 | 21.98 | % | 21.82 | % | 4.97 | % | 0.73 | % | 3.21 | % | 0.77 | % | 3.40 | % | ||||||||||||||||||||||||||||||||||||||||||
Comparable Group | ||||||||||||||||||||||||||||||||||||||||||||||||||||||||||||||||||||||||||||||||||||
ASBB | ASB Bncp Inc | NC | $ | 17.45 | $ | 87.95 | $ | 0.26 | $ | 20.06 | NM | 87.00 | % | 12.00 | % | 87.00 | % | NM | $ | 0.00 | 0.00 | % | 0.00 | % | $ | 733 | 13.79 | % | 13.79 | % | 2.82 | % | 0.19 | % | 1.37 | % | 0.16 | % | 1.13 | % | ||||||||||||||||||||||||||||||||||||||||||||
CHEV | Cheviot Financial | OH | $ | 10.45 | $ | 71.42 | $ | 0.25 | $ | 13.30 | NM | 78.55 | % | 12.17 | % | 89.19 | % | NM | $ | 0.36 | 3.44 | % | 171.43 | % | $ | 587 | 15.49 | % | 13.90 | % | 2.60 | % | 0.24 | % | 1.46 | % | 0.29 | % | 1.77 | % | ||||||||||||||||||||||||||||||||||||||||||||
FCLF | First Clover Leaf Fin Corp. | IL | $ | 9.09 | $ | 63.72 | $ | 0.53 | $ | 10.49 | 16.84 | x | 86.69 | % | 9.85 | % | 103.14 | % | 17.07 | x | $ | 0.24 | 2.64 | % | 44.44 | % | $ | 647 | 11.37 | % | 9.73 | % | 2.22 | % | 0.66 | % | 5.11 | % | 0.65 | % | 5.03 | % | ||||||||||||||||||||||||||||||||||||||||||
FSFG | First Savings Financial Group | IN | $ | 23.25 | $ | 52.59 | $ | 2.09 | $ | 28.88 | 11.63 | x | 80.51 | % | 7.85 | % | 94.92 | % | 11.12 | x | $ | 0.40 | 1.72 | % | 20.00 | % | $ | 687 | 12.00 | % | 10.71 | % | 2.29 | % | 0.71 | % | 5.64 | % | 0.76 | % | 5.90 | % | ||||||||||||||||||||||||||||||||||||||||||
FRNK | Franklin Financial Corp. | VA | $ | 19.11 | $ | 230.76 | $ | 0.69 | $ | 19.97 | 23.02 | x | 95.69 | % | 21.54 | % | 95.69 | % | 27.65 | x | $ | 0.00 | 0.00 | % | 0.00 | % | $ | 1,075 | 22.51 | % | 22.51 | % | 5.59 | % | 0.91 | % | 3.98 | % | 0.75 | % | 3.32 | % | ||||||||||||||||||||||||||||||||||||||||||
HTBI | HomeTrust Bancshares Inc. | NC | $ | 15.55 | $ | 307.64 | $ | 0.64 | $ | 18.10 | 25.92 | x | 85.91 | % | 18.88 | % | 86.73 | % | 24.41 | x | $ | 0.00 | 0.00 | % | 0.00 | % | $ | 1,629 | 21.98 | % | 21.82 | % | 4.97 | % | 0.73 | % | 3.21 | % | 0.77 | % | 3.40 | % | ||||||||||||||||||||||||||||||||||||||||||
PULB | Pulaski Financial Corp. | MO | $ | 10.32 | $ | 117.35 | $ | 0.70 | $ | 9.04 | 14.74 | x | 114.14 | % | 8.90 | % | 118.86 | % | 14.76 | x | $ | 0.38 | 3.68 | % | 54.29 | % | $ | 1,294 | 9.04 | % | 8.76 | % | 4.33 | % | 0.72 | % | 7.58 | % | 0.72 | % | 7.59 | % | ||||||||||||||||||||||||||||||||||||||||||
UCBA | United Community Bancorp | IN | $ | 11.00 | $ | 56.65 | $ | 0.52 | $ | 14.41 | 19.64 | x | 76.33 | % | 11.06 | % | 79.70 | % | 21.29 | x | $ | 0.24 | 2.18 | % | 75.00 | % | $ | 512 | 14.49 | % | 13.96 | % | 3.98 | % | 0.52 | % | 3.77 | % | 0.48 | % | 3.47 | % | ||||||||||||||||||||||||||||||||||||||||||
UCFC | United Community Finl Corp. | OH | $ | 3.48 | $ | 174.80 | $ | 0.04 | $ | 3.65 | 34.80 | x | 95.34 | % | 9.95 | % | 95.43 | % | NM | $ | 0.00 | 0.00 | % | 0.00 | % | $ | 1,756 | 10.44 | % | 10.43 | % | 3.43 | % | 0.57 | % | 5.62 | % | 0.44 | % | 4.34 | % | |||||||||||||||||||||||||||||||||||||||||||
WAYN | Wayne Savings Bancshares | OH | $ | 11.00 | $ | 31.28 | $ | 0.74 | $ | 13.56 | 15.28 | x | 81.13 | % | 7.62 | % | 85.00 | % | 14.85 | x | $ | 0.32 | 2.91 | % | 43.06 | % | $ | 410 | 9.40 | % | 9.01 | % | 2.14 | % | 0.51 | % | 5.24 | % | 0.53 | % | 5.40 | % | ||||||||||||||||||||||||||||||||||||||||||
| (1) | Core income, on a diluted per-share basis. Core income is net income after taxes and before extraordinary items, less net income attributable to noncontrolling interest, gain on the sale of securities, amortization of intangibles, goodwill and nonrecurring items. Assumed tax rate is 35%. |
| (2) | P/E = Price to earnings; P/B = Price to book; P/A = Price to assets; P/TB = Price to tangible book value; and P/Core = Price to core earnings. P/E and P/Core =NM if the ratio is negative or above 35x. |
| (3) | Indicated 12 month dividend, based on last quarterly dividend declared. |
| (4) | Indicated 12 month dividend as a percent of trailing 12 month earnings. |
| (5) | ROAA (return on average assets) and ROAE (return on average equity) are indicated ratios based on trailing 12 month earnings and average equity and assets balances. |
| (6) | Excludes from averages and medians those companies the subject of actual or rumored acquisition activities or unusual operating characteristics. |
| Source: | SNL Financial, LC. and RP Financial, LC. calculations. The information provided in this report has been obtained from sources we believe are reliable, but we cannot guarantee the accuracy or completeness of such information. |
Copyright (c) 2014 by RP® Financial, LC.
| RP® Financial, LC. | VALUATION ANALYSIS | |
| IV.23 |
assuming no deposit withdrawals are made to fund stock purchases. In all likelihood there will be deposit withdrawals, which results in understating the pro forma P/A ratio that is computed herein. At the $43.0 million midpoint of the valuation range, the Company’s value equaled 5.21% of pro forma assets. Comparatively, the Peer Group companies exhibited an average P/A ratio of 11.98%, which implies a discount of 56.5% has been applied to the Company’s pro forma P/A ratio. In comparison to the Peer Group’s median P/A ratio of 10.51%, the Company’s pro forma P/A ratio at the midpoint value reflects a discount of 50.4%.
Comparison to Recent Offerings
As indicated at the beginning of this chapter, RP Financial’s analysis of recent conversion offering pricing characteristics at closing and in the aftermarket has been limited to a “technical” analysis and, thus, the pricing characteristics of recent conversion offerings can not be a primary determinant of value. Particular focus was placed on the P/TB approach in this analysis, since the P/E multiples do not reflect the actual impact of reinvestment and the source of the stock proceeds (i.e., external funds versus deposit withdrawals) and were not meaningful for the Company. As discussed previously, two standard conversions have been completed within the past three months and closed at an average pro forma P/TB ratio of 63.6% (see Table 4.1) and, on average, increased 5.0% from their IPO prices during the first week of trading. In comparison, the Company’s 59.17% pro forma P/TB ratio at the appraised midpoint value reflects a discount of 7.0%. The current P/TB ratio of the only recent standard conversion that trades on NASDAQ (Coastway) based on pricing as of February 14, 2014, equaled 73.47%. In comparison to the current P/TB ratio of this recent standard conversion, the Company’s P/TB ratio at the midpoint value reflects an implied discount of 19.5% and at the supermaximum value, the Company’s 66.14% P/TB ratio reflects an implied discount of 10.0%.
Valuation Conclusion
Based on the foregoing, it is our opinion that, as of February 14, 2014, the estimated aggregate pro forma market value of the shares to be issued immediately following the conversion, equaled $43,000,000 at the midpoint, equal to 4,300,000 shares offered at a per share value of $10.00. Pursuant to conversion guidelines, the 15% offering range indicates a minimum value of $36,550,000 and a maximum value of $49,450,000. Based on the $10.00 per share offering price determined by the Board, this valuation range equates to total shares outstanding of 3,655,000 at the minimum and 4,945,000 at the maximum. In the event the appraised value is subject to an increase, the aggregate pro forma market value may be
| RP® Financial, LC. | VALUATION ANALYSIS | |
| IV.24 |
increased up to a supermaximum value of $56,867,500 without a resolicitation. Based on the $10.00 per share offering price, the supermaximum value would result in total shares outstanding of 5,686,750. The pro forma valuation calculations relative to the Peer Group are shown in Table 4.3 and are detailed in Exhibit IV-7 and Exhibit IV-8.