2015 Shareholder Meeting
Forward Looking Statements
Information in this presentation may contain “forward-looking statements”. Such statements involve known and unknown risks, uncertainties and other factors that may cause actual results to differ materially. Forward-looking statements are often characterized by the use of qualifying words such as “expects,” “anticipates,” “believes,” “estimates,” “plans,” “projects,” or other statements concerning opinions or judgments of the Company and its management about future events. The accuracy of such forward looking statements could be affected by factors including, but not limited to, the financial success or changing conditions or strategies of the Company’s customers or vendors, fluctuations in interest rates, actions of government regulators, the availability of capital and personnel or general economic conditions. Additional factors that could cause actual results to differ materially from those anticipated by forward looking statements are discussed in the Company’s filings with the Securities and Exchange Commission, including without limitation its Registration Statement on Form S-1, annual report on Form 10-K, quarterly reports on Form 10-Q and current reports on Form 8-K. Entegra Financial Corp. undertakes no obligation to revise or update these statements following the date of this presentation.

Executive Management
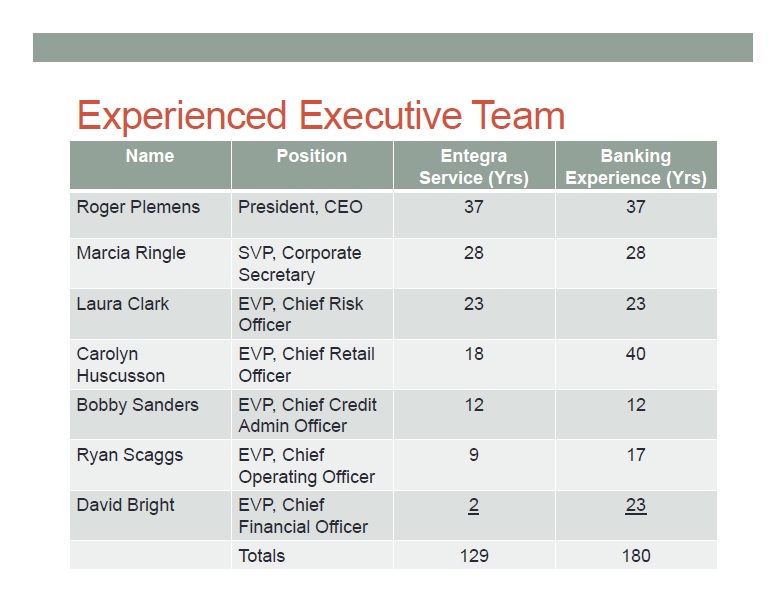
Experienced Executive Team
Name Position Entegra Service (Yrs) Banking Experience (Yrs) Roger Plemens President, CEO 37 37 Marcia Ringle SVP, Corporate Secretary 28 28 Laura Clark EVP, Chief Risk Officer 23 23 Carolyn Huscusson EVP, Chief Retail Officer 18 40 Bobby Sanders EVP, Chief Credit Admin Officer 12 12 Ryan Scaggs EVP, Chief Operating Officer 9 17 David Bright EVP, Chief Financial Officer 2 23 Totals 129 180
Strategic Overview

Successful Capital Raise
Adj Maximum Midpoint Maximum Minimum 65,464 42,075 49,500 56,925 - 10,000 20,000 30,000 40,000 50,000 60,000 70,000 Offering Significantly Oversubscribed at Adjusted Maximum

93 Years of History … And Counting
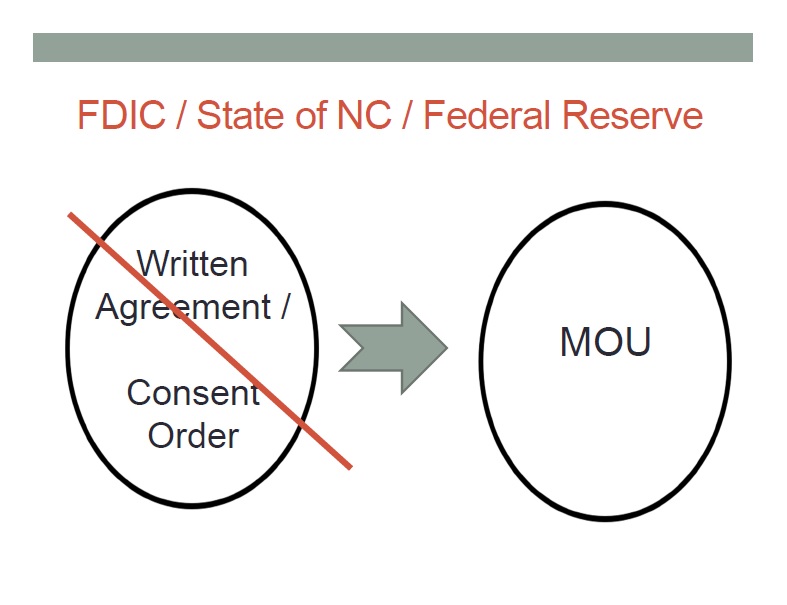
FDIC / State of NC / Federal Reserve Written Agreement / Consent Order MOU
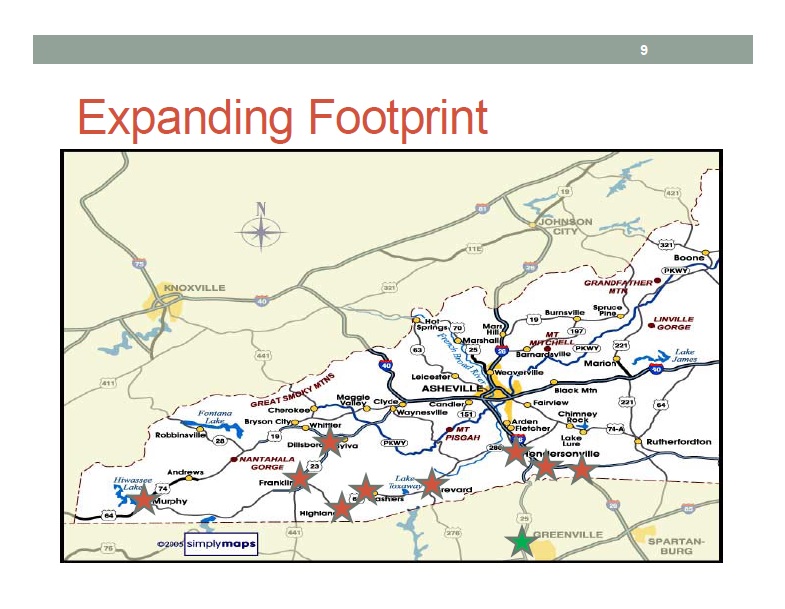
Expanding Footprint

Greenville, SC Regional HQ 11,000 SF Class A Bldg with Drive- Thru • Branch / LPO/ Finance / Operations • Upstate SC is a $19.0B Deposit Market
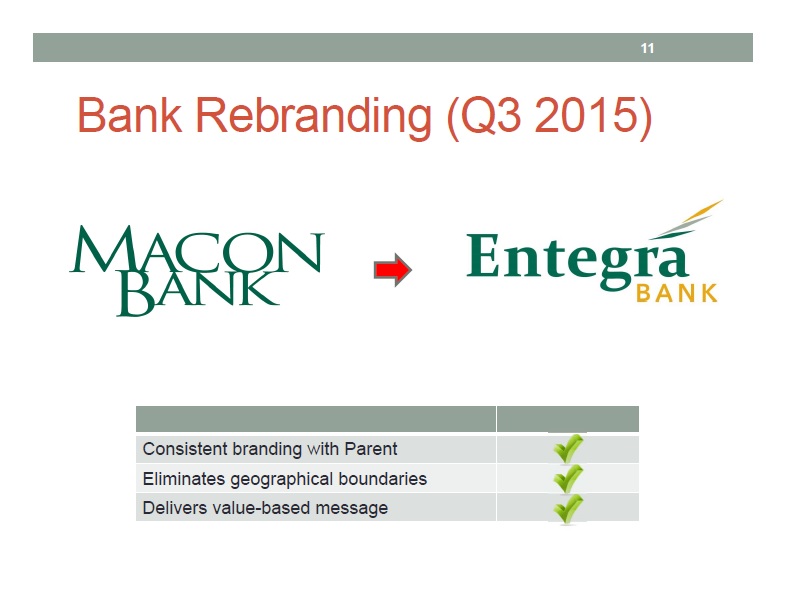
Bank Rebranding (Q3 2015)
Consistent branding with Parent Eliminates geographical boundaries Delivers value-based message

Enterprise Risk Management ERM: Implementation Process Underway
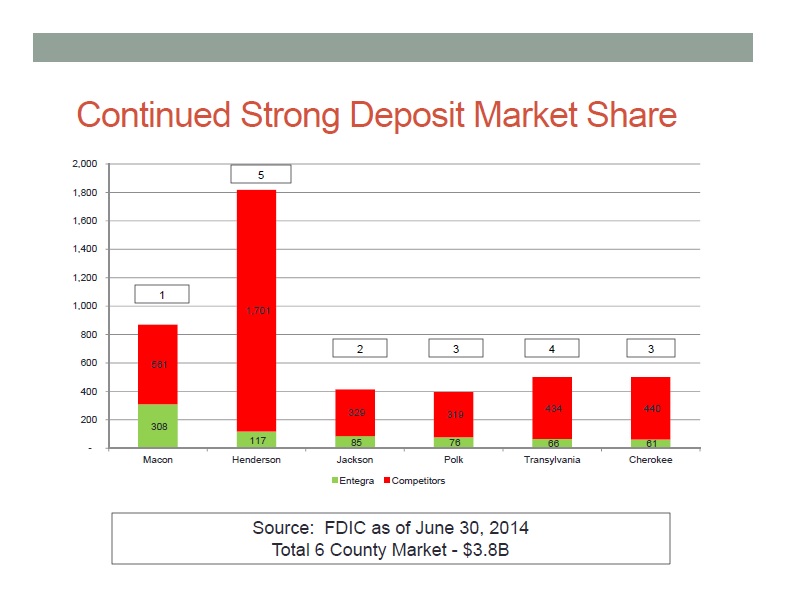
Continued Strong Deposit Market Share - 200 400 600 800 1,000 1,200 1,400 1,600 1,800 2,000 1 5 2 3 4 3 561 1,701 329 319 434 440 308 117 85 76 66 61 Macon Henderson Jackson Polk Transylvania Cherokee Entegra Competitors Source: FDIC as of June 30, 2014 Total 6 County Market - $3.8B

Top 10 Deposit Market Share Rank Institution No. Branches Deposits (000’s) Market Share 1 First-Citizens 16 1,167 25.96% 2 Macon Bank 11 713 15.86% 3 Wells Fargo 9 527 11.72% 4 United Community 10 465 10.33% 5 PNC 5 339 7.55% 6 Home Trust 3 260 5.78% 7 TD Bank 6 259 5.76% 8 Bank of America 4 161 3.59% 9 BB&T 5 151 3.35% 10 Sun Trust 3 120 2.67% Source: FDIC as of June 30, 2014

Financial Overview

A Lot of Good News ….
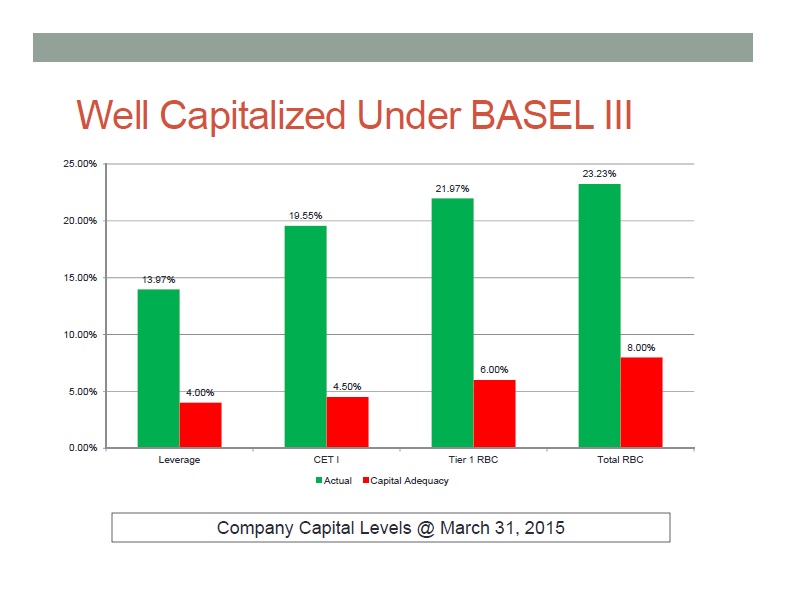
Well Capitalized Under BASEL III 0.00% 5.00% 10.00% 15.00% 20.00% 25.00% 13.97% 19.55% 21.97% 23.23% 4.00% 4.50% 6.00% 8.00% Leverage CET I Tier 1 RBC Total RBC Actual Capital Adequacy Company Capital Levels @ March 31, 2015

We Are Growing Again 200,000 400,000 600,000 800,000 1,000,000 1,200,000 1,114,528 1,078,537 1,021,777 874,706 769,939 784,893 903,648 919,050 2008 2009 2010 2011 2012 2013 2014 Q1 2015 Total Assets at Period End

Loan Balance Trends 2014 2013 2012 2011 2010 2009 2008 Q1 2015 540,479 521,874 560,717 615,540 715,313 770,448 815,959 549,874 100,000 200,000 300,000 400,000 500,000 600,000 700,000 800,000 900,000 Loan Balances at Period End

Loan Composition Trends 20.0% 40.0% 60.0% 80.0% 100.0% 120.0% 0.0% 3.4% 2.9% 2.7% 2.2% 2.2% 2.3% 4.3% 6.0% 22.1% 25.4% 28.0% 29.4% 31.0% 29.6% 32.8% 31.9% 47.5% 47.0% 47.8% 50.0% 53.2% 55.2% 53.2% 52.3% 27.0% 24.7% 21.5% 18.3% 13.6% 13.0% 9.7% 9.9% 2008 2009 2010 2011 2012 2013 2014 Q1 2015 ADC Res RE Comm RE C&I / Other Loan Balances at Period End
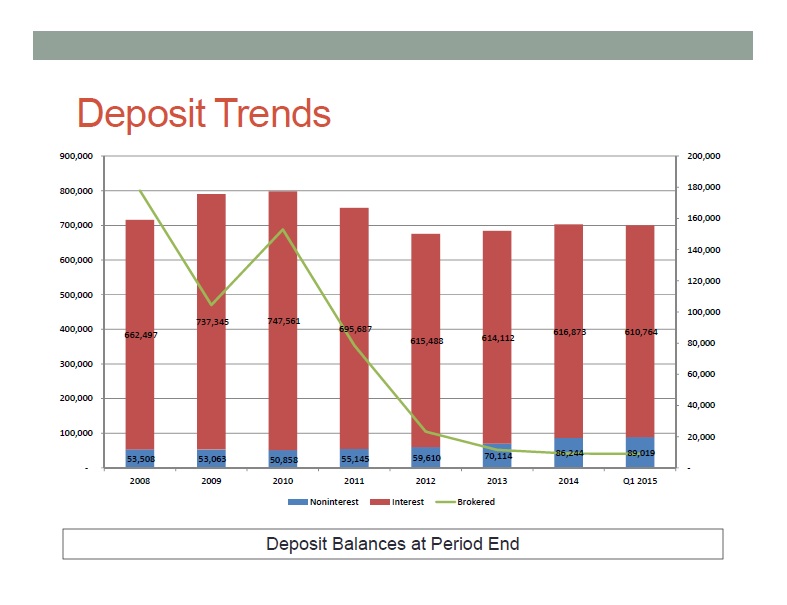
Deposit Trends 100,000 200,000 300,000 400,000 500,000 600,000 700,000 800,000 900,000 40,000 60,000 80,000 100,000 120,000 140,000 160,000 180,000 200,000 20,000 662,497 737,345 747,561 695,687 615,488 614,112 616,873 610,764 53,508 53,063 50,858 55,145 59,610 70,114 86,244 89,019 2008 2009 2010 2011 2012 2013 2014 Q1 2015 Noninterest Interest Brokered Deposit Balances at Period End

Pre-Tax Income Is Improving (25,000) (20,000) (15,000) (10,000) (5,000) - 5,000 10,000 15,000 (30,000) 9,425 (13,878) (10,553) (24,606) (78) 60 8,151 2,795 2008 2009 2010 2011 2012 2013 2014 Q1 2015 Q1 2015 Includes $1.5M Negative Provision
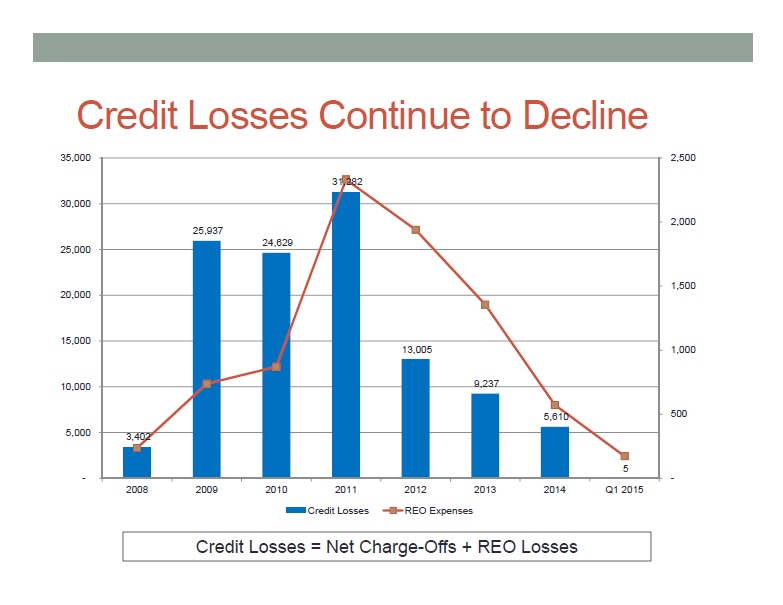
Credit Losses Continue to Decline 10,000 15,000 20,000 25,000 30,000 35,000 5,000 3,402 25,937 24,629 31,282 13,005 9,237 5,610 5 2008 2009 2010 2011 2012 2013 2014 Q1 2015 500 1,000 1,500 2,000 2,500 Credit Losses REO Expenses Credit Losses = Net Charge-Offs + REO Losses
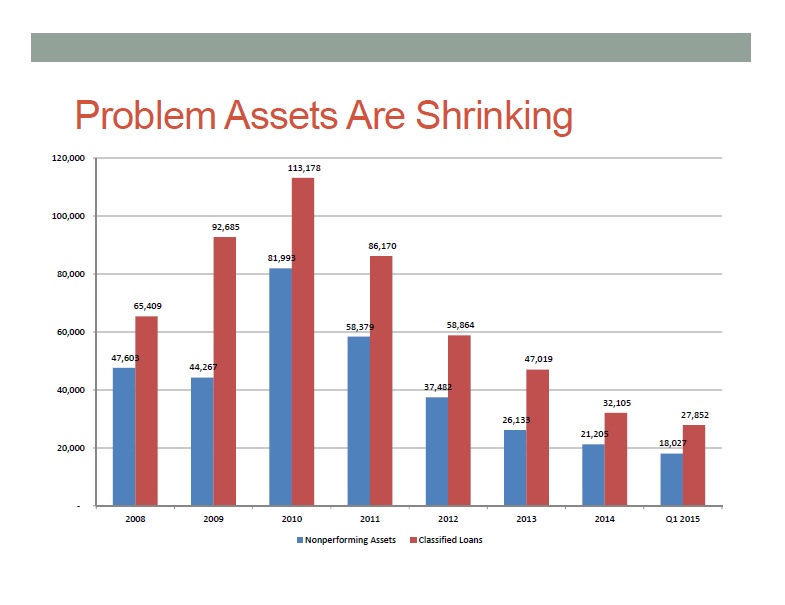
Problem Assets Are Shrinking 20,000 40,000 60,000 80,000 100,000 120,000 47,603 44,267 81,993 58,379 37,482 26,133 21,205 18,027 65,409 92,685 113,178 86,170 58,864 47,019 32,105 27,852 2008 2009 2010 2011 2012 2013 2014 Q1 2015 Nonperforming Assets Classified Loans

And Our Stock Has Responded 2.00 4.00 6.00 8.00 10.00 12.00 14.00 16.00 18.00 10.00 13.40 13.90 14.39 15.46 15.77 15.51 15.51 16.38 IPO Price Oct, 2014 Nov, 2014 Dec, 2014 Jan, 2015 Feb, 2015 Mar, 2015 Apr, 2015 May 19, 2015 63.8% Return From IPO Price of $10
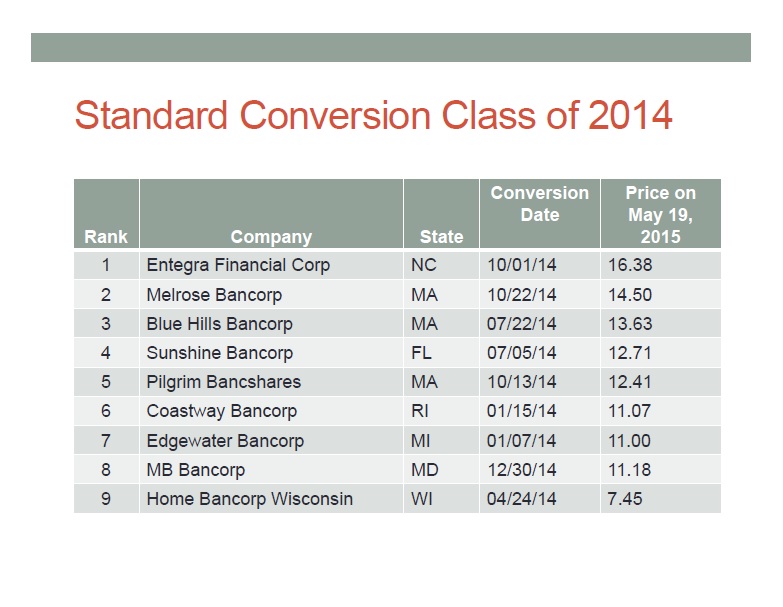
Standard Conversion Class of 2014 Rank Company State Conversion Date Price on May 19, 2015 1 Entegra Financial Corp NC 10/01/14 16.38 2 Melrose Bancorp MA 10/22/14 14.50 3 Blue Hills Bancorp MA 07/22/14 13.63 4 Sunshine Bancorp FL 07/05/14 12.71 5 Pilgrim Bancshares MA 10/13/14 12.41 6 Coastway Bancorp RI 01/15/14 11.07 7 Edgewater Bancorp MI 01/07/14 11.00 8 MB Bancorp MD 12/30/14 11.18 9 Home Bancorp Wisconsin WI 04/24/14 7.45
But, We Remain Focused On….
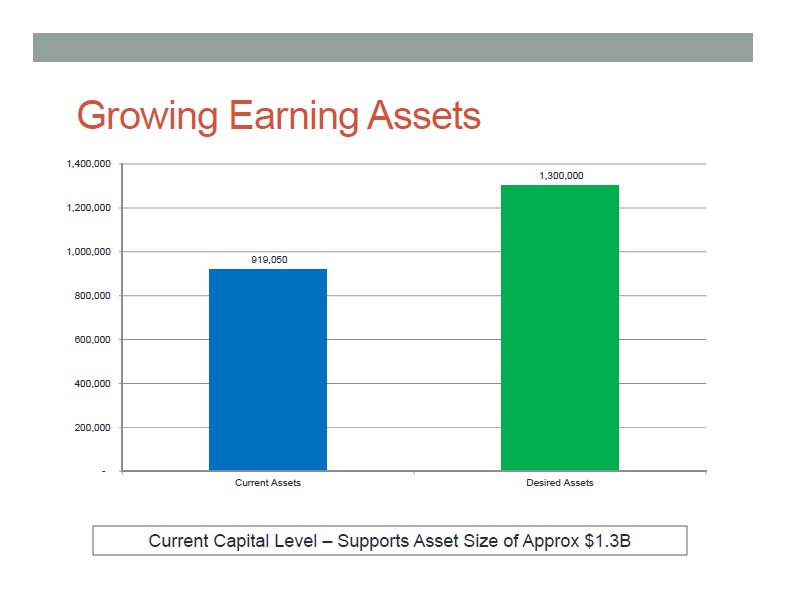
Growing Earning Assets 200,000 400,000 600,000 800,000 1,000,000 1,200,000 1,400,000 919,050 1,300,000 Current Assets Desired Assets Current Capital Level – Supports Asset Size of Approx $1.3B
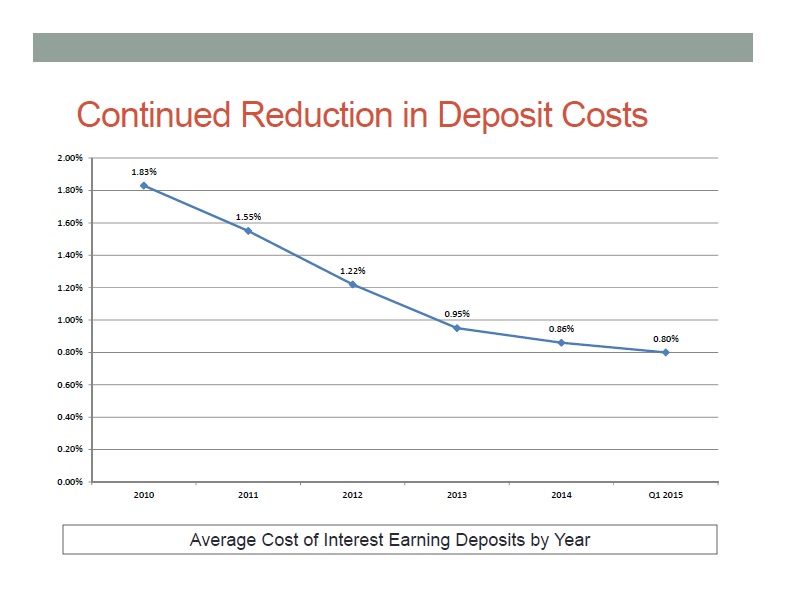
Continued Reduction in Deposit Costs 0.00% 0.20% 0.40% 0.60% 0.80% 1.00% 1.20% 1.40% 1.60% 1.80% 2.00% 1.83% 1.55% 1.22% 0.95% 0.86% 0.80% 2010 2011 2012 2013 2014 Q1 2015 Average Cost of Interest Earning Deposits by Year

Managing our Capital 0.00% 2.00% 4.00% 6.00% 8.00% 10.00% 12.00% 14.00% 16.00% 13.97% 10.00% Current Leverage Desired Leverage Stock buybacks • Dividends • Asset growth • Cash acquisitions

Increasing Fee Income 211 255 629 800 258 2,149 - 1,005 - 500 1,000 1,500 2,000 2,500 SBA Gains Mortgage Banking 2012 2013 2014 Q1 2015
Summary
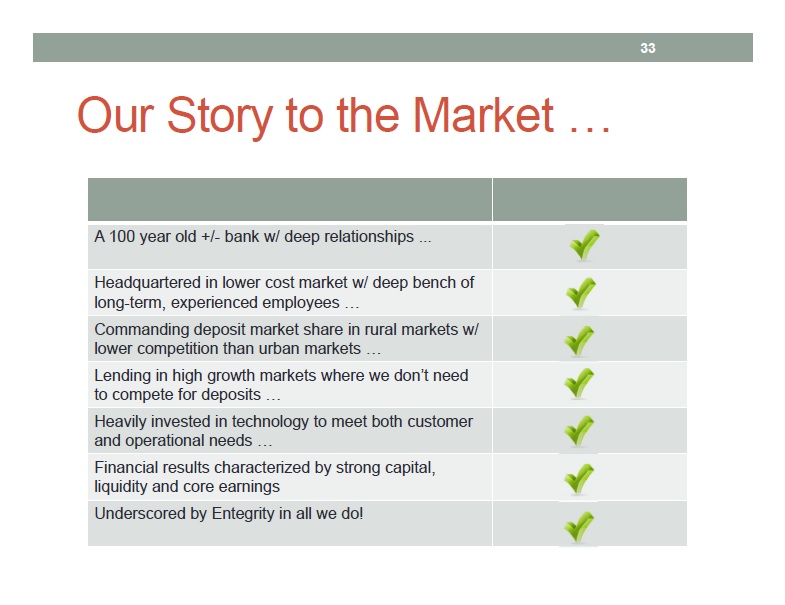
Our Story to the Market … A 100 year old +/- bank w/ deep relationships ... Headquartered in lower cost market w/ deep bench of long-term, experienced employees … Commanding deposit market share in rural markets w/ lower competition than urban markets … Lending in high growth markets where we don’t need to compete for deposits … Heavily invested in technology to meet both customer and operational needs … Financial results characterized by strong capital, liquidity and core earnings Underscored by Entegrity in all we do!