
Fall 2016 Investor Meetings
The discussions included in this document may contain “forward - looking statements” within the meaning of the Private Securities Litigation Reform Act of 1995 , including Section 21 E of the Securities Exchange Act of 1934 and Section 27 A of the Securities Act of 1933 . Such statements involve known and unknown risks, uncertainties and other factors that may cause actual results to differ materially . For the purposes of these discussions, any statements that are not statements of historical fact may be deemed to be “forward - looking statements . ” Such statements are often characterized by the use of qualifying words such as “expects,” “anticipates,” “believes,” “estimates,” “plans,” “projects,” or other statements concerning opinions or judgments of the Company and its management about future events . The accuracy of such forward looking statements could be affected by factors including, but not limited to, the financial success or changing conditions or strategies of the Company’s customers or vendors, fluctuations in interest rates, actions of government regulators, the availability of capital and personnel or general economic conditions . These forward looking statements express management’s current expectations, plans or forecasts of future events, results and condition, including financial and other estimates . Additional factors that could cause actual results to differ materially from those anticipated by forward looking statements are discussed in the Company’s filings with the Securities and Exchange Commission, including without limitation its annual report on Form 10 - K, quarterly reports on Form 10 - Q and current reports on Form 8 - K . The Company undertakes no obligation to revise or update these statements following the date of this presentation . Forward Looking Statements
Statements included in this document include non - GAAP financial measures and should be read along with the accompanying tables in Appendix A to our quarterly earnings release, which provide a reconciliation of non - GAAP financial measures to GAAP financial measures . This document discusses financial measures, such as core return on average equity and core efficiency ratio, which are non - GAAP measures . We believe that such non - GAAP measures are useful because they enhance the ability of investors and management to evaluate and compare the Company’s operating results from period to period in a meaningful manner . Non - GAAP measures should not be considered as an alternative to any measure of performance as promulgated under GAAP . Investors should consider the Company’s performance and financial condition as reported under GAAP and all other relevant information when assessing the performance or financial condition of the Company . Non - GAAP measures have limitations as analytical tools, and investors should not consider them in isolation or as a substitute for analysis of the Company’s results or financial condition as reported under GAAP . Non - GAAP Measurements

Who We Are
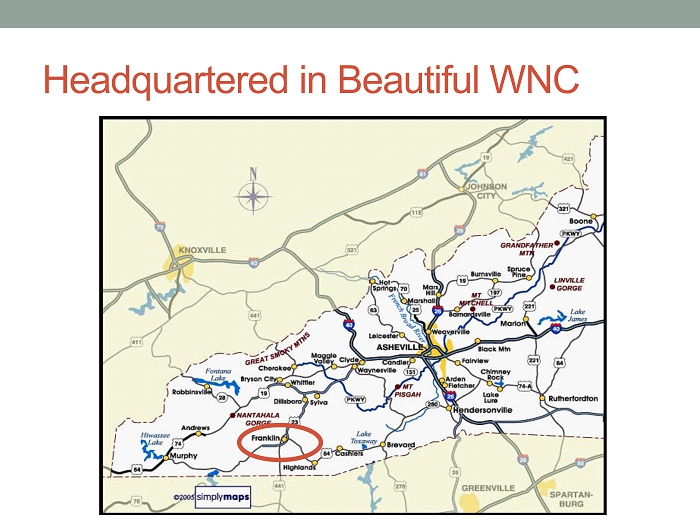
Headquartered in Beautiful WNC

94 Years of History … And Counting Founded
Thrift Charter, But ….
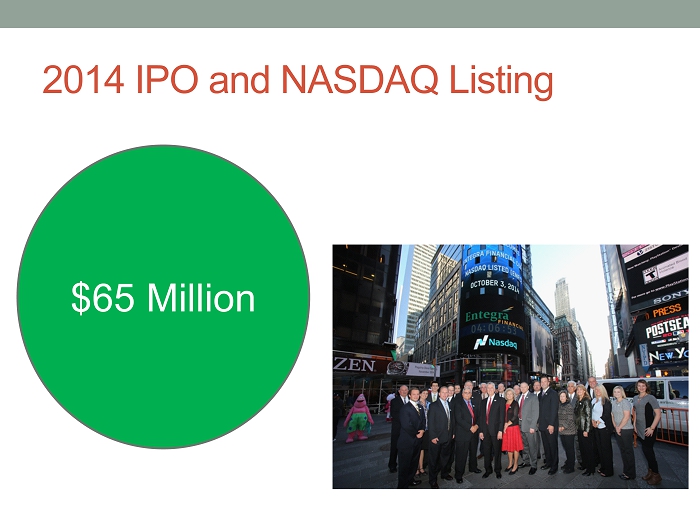
2014 IPO and NASDAQ Listing $65 Million
What’s In A Name? Integrity (Noun) “the quality of being honest and having strong moral principles ; moral uprightness . ”
Integrity: More Important Than Ever
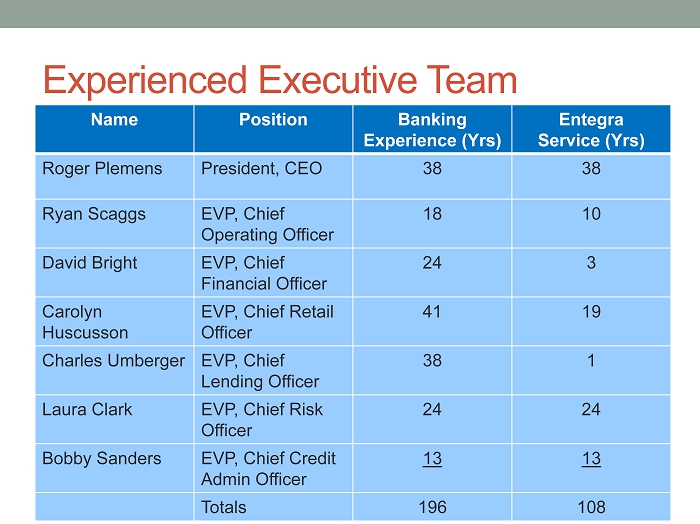
Experienced Executive Team Name Position Banking Experience ( Yrs ) Entegra Service ( Yrs ) Roger Plemens President, CEO 38 38 Ryan Scaggs EVP, Chief Operating Officer 18 10 David Bright EVP, Chief Financial Officer 24 3 Carolyn Huscusson EVP, Chief Retail Officer 41 19 Charles Umberger EVP, Chief Lending Officer 38 1 Laura Clark EVP, Chief Risk Officer 24 24 Bobby Sanders EVP, Chief Credit Admin Officer 13 13 Totals 196 108
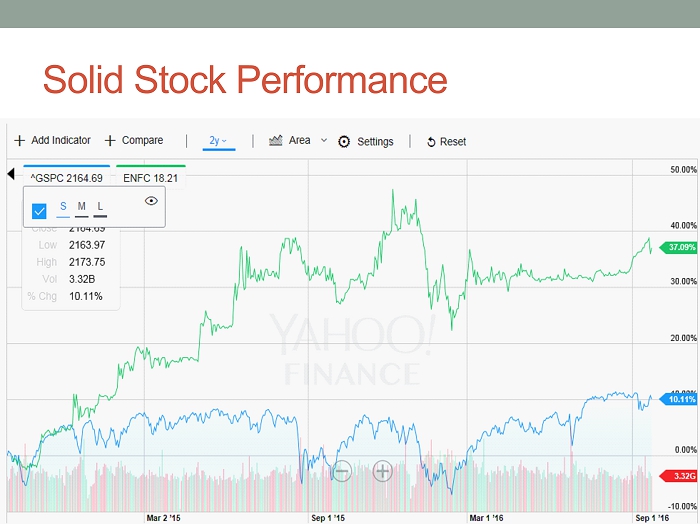
Solid Stock Performance
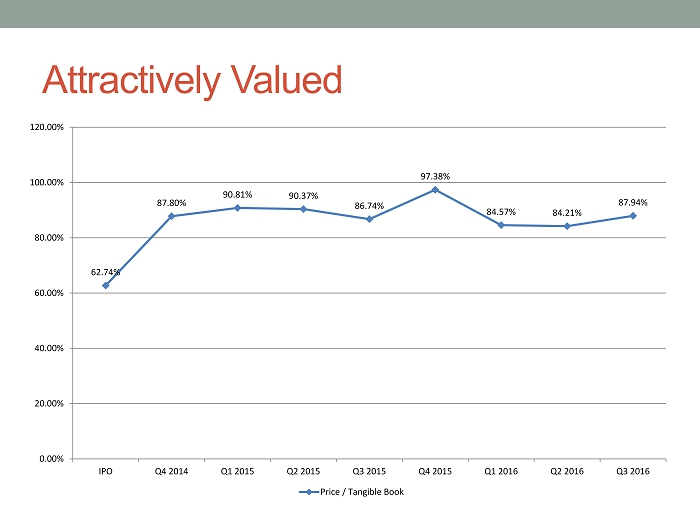
Attractively Valued 62.74% 87.80% 90.81% 90.37% 86.74% 97.38% 84.57% 84.21% 87.94% 0.00% 20.00% 40.00% 60.00% 80.00% 100.00% 120.00% IPO Q4 2014 Q1 2015 Q2 2015 Q3 2015 Q4 2015 Q1 2016 Q2 2016 Q3 2016 Price / Tangible Book

SNL – “One of the Feel - Good Stories”

#2 Legacy Deposit Market Share 38% 21% 20% 13% 13% 11% 6% - 1 2 3 4 5 6 7 0% 5% 10% 15% 20% 25% 30% 35% 40% Macon Jackson Polk Cherokee Haywood Transylvania Henderson Deposits Market Share

NOL Protection Plan Limits 5% Investors To Protect $10M Deferred Tax Asset 35,353 43,059 31,240 37,998 27,243 31,999 - 5,000 10,000 15,000 20,000 25,000 30,000 35,000 40,000 45,000 50,000 Federal State Dec, 2014 Dec, 2015 Sep, 2016
Strategy Summary

Continued Execution of Strategic Plan High Growth Contiguous Markets Disciplined M&A Activity Strong ROE Proper Capital Usage Goal – High Performing, Independent Bank

Proper Capital Usage 14.12% 13.94% 13.97% 14.46% 14.12% 13.85% 13.38% 11.84% 11.76% 10.25% 5.00% 6.00% 7.00% 8.00% 9.00% 10.00% 11.00% 12.00% 13.00% 14.00% 15.00% Sep, 2014 Dec, 2014 Mar, 2015 June, 2015 Sep, 2015 Dec, 2015 Mar, 2016 Jun, 2016 Sep, 2016 Jasper Pro- Forma (Est) Holding Company Leverage Ratios Arthur State Oldtown Jasper

Disciplined Acquisitions December, 2015 2 Branches - $40M April, 2016 Whole Bank - $110M First Quarter, 2017 2 Branches - $150M

Strategic De Novo Activity Mortgage LPO July, 2016 LPO - Jan, 2015 Branch – Oct, 2015 $43M
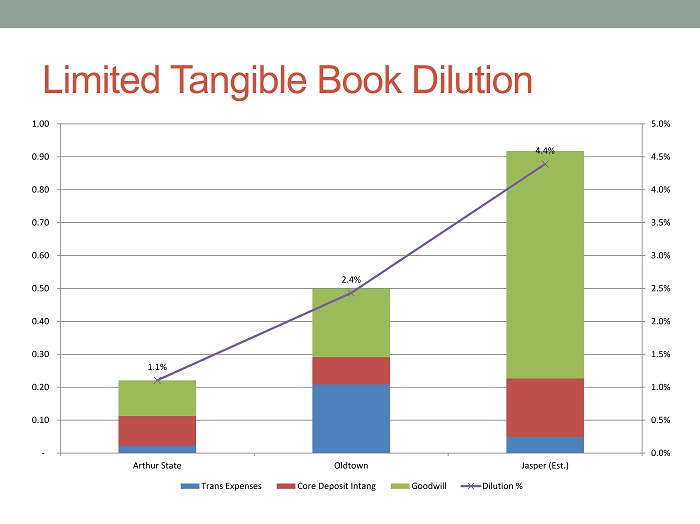
Limited Tangible Book Dilution 1.1% 2.4% 4.4% 0.0% 0.5% 1.0% 1.5% 2.0% 2.5% 3.0% 3.5% 4.0% 4.5% 5.0% - 0.10 0.20 0.30 0.40 0.50 0.60 0.70 0.80 0.90 1.00 Arthur State Oldtown Jasper (Est.) Trans Expenses Core Deposit Intang Goodwill Dilution %
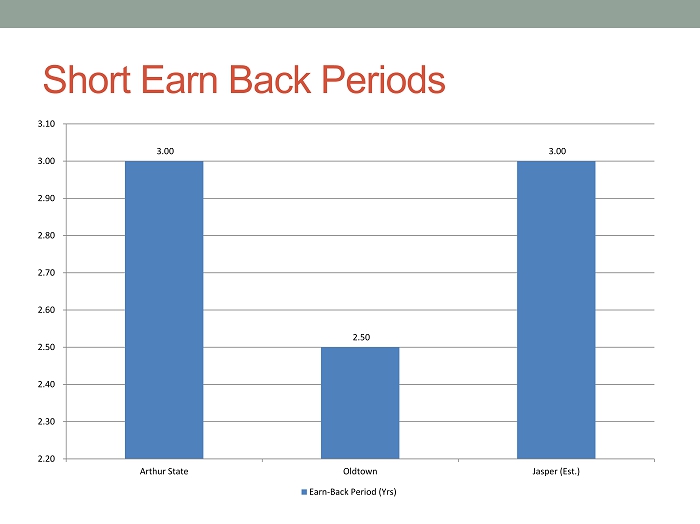
Short Earn Back Periods 3.00 2.50 3.00 2.20 2.30 2.40 2.50 2.60 2.70 2.80 2.90 3.00 3.10 Arthur State Oldtown Jasper (Est.) Earn-Back Period (Yrs)
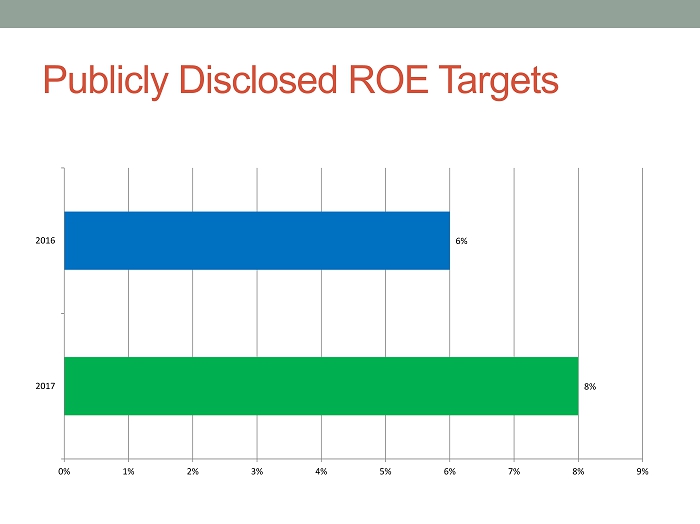
Publicly Disclosed ROE Targets 8% 6% 0% 1% 2% 3% 4% 5% 6% 7% 8% 9% 2017 2016

Research Coverage

What About Share Repurchases? • Other opportunities • F ranchise value • Upside potential • Fund stock compensation

Market Overview
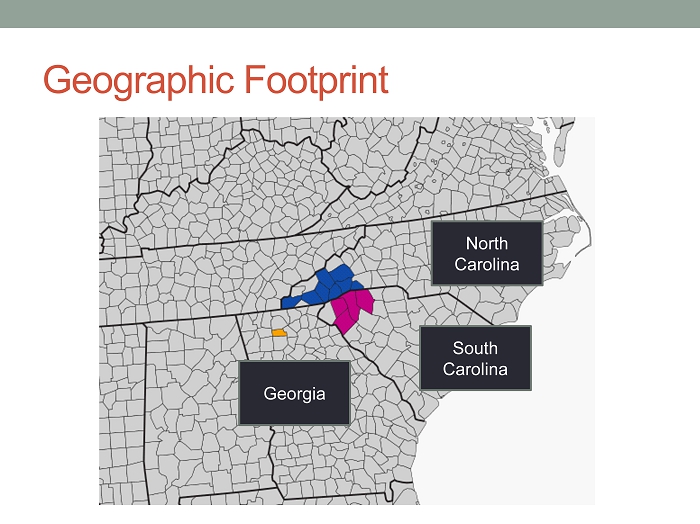
Geographic Footprint South Carolina North Carolina Georgia

$29.5B Deposit Market $18.8B $9.8B $0.7B
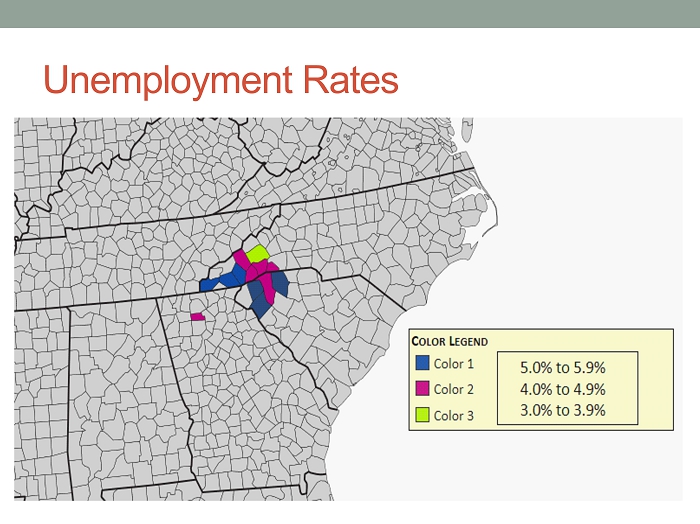
Unemployment Rates

Expected Population Growth

Financial Overview
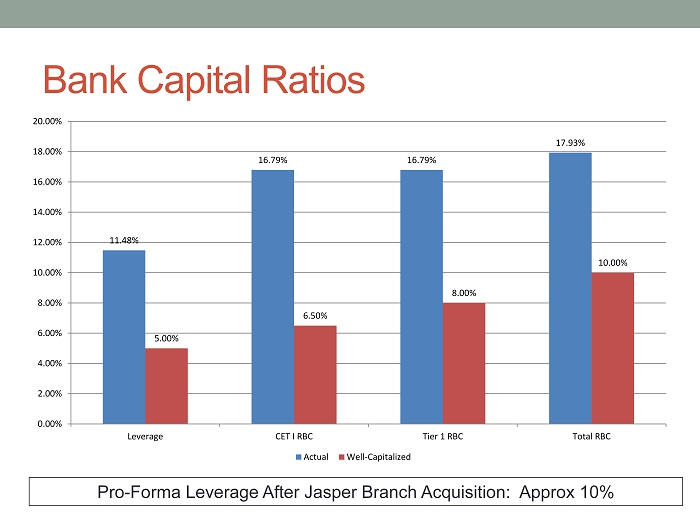
Bank Capital Ratios Pro - Forma Leverage After Jasper Branch Acquisition: Approx 10% 11.48% 16.79% 16.79% 17.93% 5.00% 6.50% 8.00% 10.00% 0.00% 2.00% 4.00% 6.00% 8.00% 10.00% 12.00% 14.00% 16.00% 18.00% 20.00% Leverage CET I RBC Tier 1 RBC Total RBC Actual Well-Capitalized
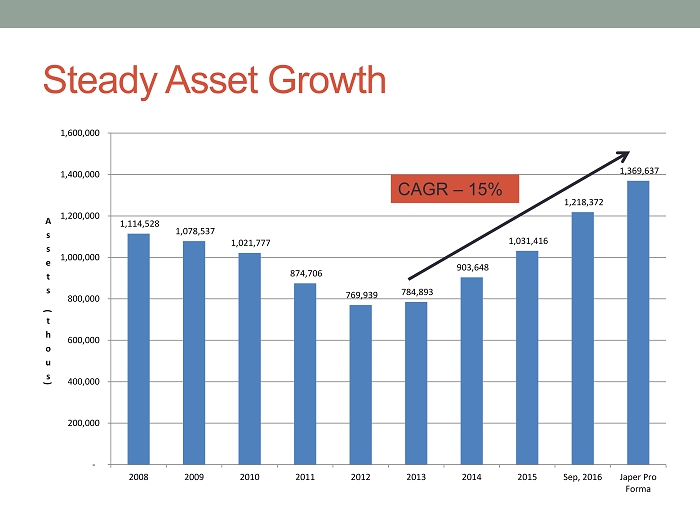
Steady Asset Growth 1,114,528 1,078,537 1,021,777 874,706 769,939 784,893 903,648 1,031,416 1,218,372 1,369,637 - 200,000 400,000 600,000 800,000 1,000,000 1,200,000 1,400,000 1,600,000 2008 2009 2010 2011 2012 2013 2014 2015 Sep, 2016 Japer Pro Forma A s s e t s ( t h o u s ) CAGR – 15%
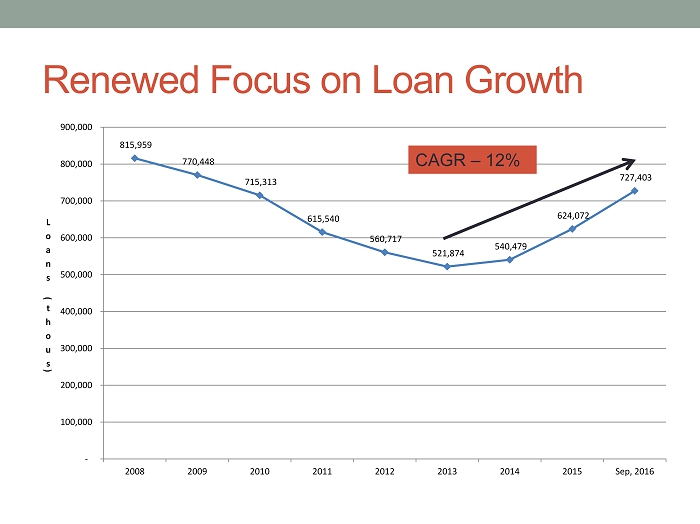
Renewed Focus on Loan Growth 815,959 770,448 715,313 615,540 560,717 521,874 540,479 624,072 727,403 - 100,000 200,000 300,000 400,000 500,000 600,000 700,000 800,000 900,000 2008 2009 2010 2011 2012 2013 2014 2015 Sep, 2016 L o a n s ( t h o u s ) CAGR – 12%
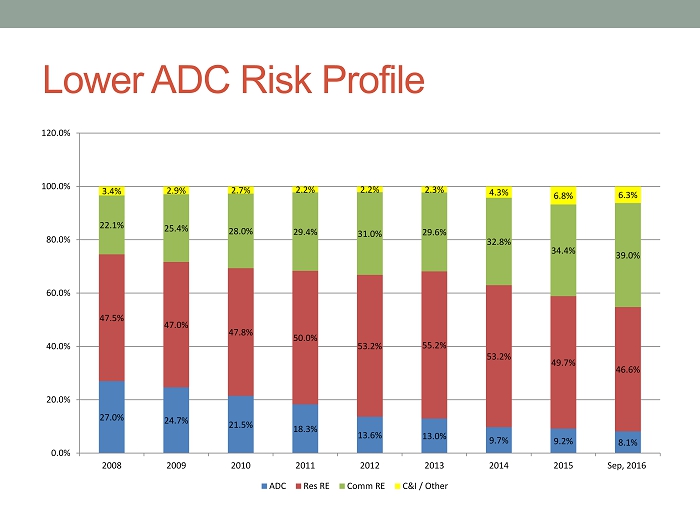
Lower ADC Risk Profile 27.0% 24.7% 21.5% 18.3% 13.6% 13.0% 9.7% 9.2% 8.1% 47.5% 47.0% 47.8% 50.0% 53.2% 55.2% 53.2% 49.7% 46.6% 22.1% 25.4% 28.0% 29.4% 31.0% 29.6% 32.8% 34.4% 39.0% 3.4% 2.9% 2.7% 2.2% 2.2% 2.3% 4.3% 6.8% 6.3% 0.0% 20.0% 40.0% 60.0% 80.0% 100.0% 120.0% 2008 2009 2010 2011 2012 2013 2014 2015 Sep, 2016 ADC Res RE Comm RE C&I / Other

ADC / CRE Within Regulatory Limits Note: ADC Includes 1 - 4 Family Construction 56% 100% 266% 300% 0% 50% 100% 150% 200% 250% 300% 350% 400% 450% Entegra Reg Guidance ADC CRE

Growing Deposits w / Minimal Brokered 53,508 53,063 50,858 55,145 59,610 70,114 86,244 121,062 142,174 158,475 662,497 737,345 747,561 695,687 615,488 614,112 616,873 595,555 678,221 812,122 - 20,000 40,000 60,000 80,000 100,000 120,000 140,000 160,000 180,000 200,000 - 200,000 400,000 600,000 800,000 1,000,000 1,200,000 2008 2009 2010 2011 2012 2013 2014 2015 Sep, 2016 Jasper Pro- Forma B r o k e r e d D e p o s i t s ( t h o u s ) D e p o s i t s ( t h o u s ) Noninterest Interest Brokered
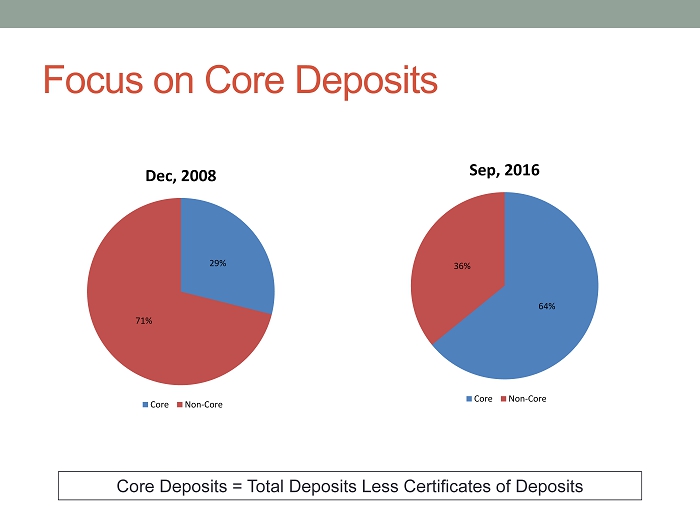
Focus on Core Deposits Core Deposits = Total Deposits Less Certificates of Deposits 29% 71% Dec, 2008 Core Non-Core 64% 36% Sep, 2016 Core Non-Core
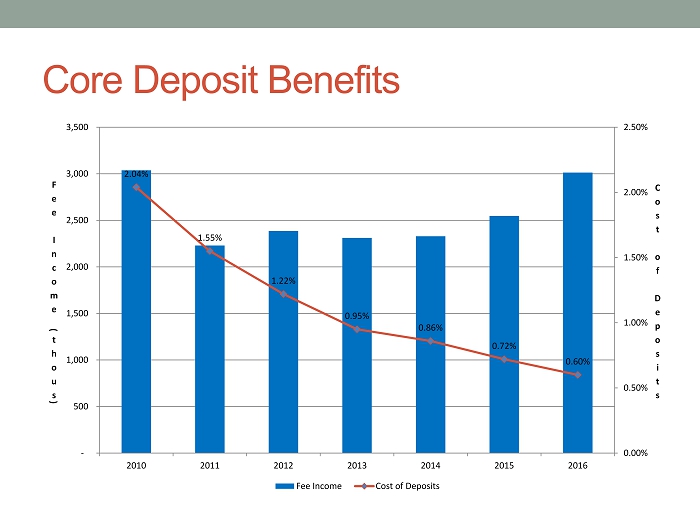
Core Deposit Benefits 2.04% 1.55% 1.22% 0.95% 0.86% 0.72% 0.60% 0.00% 0.50% 1.00% 1.50% 2.00% 2.50% - 500 1,000 1,500 2,000 2,500 3,000 3,500 2010 2011 2012 2013 2014 2015 2016 C o s t o f D e p o s i t s F e e I n c o m e ( t h o u s ) Fee Income Cost of Deposits
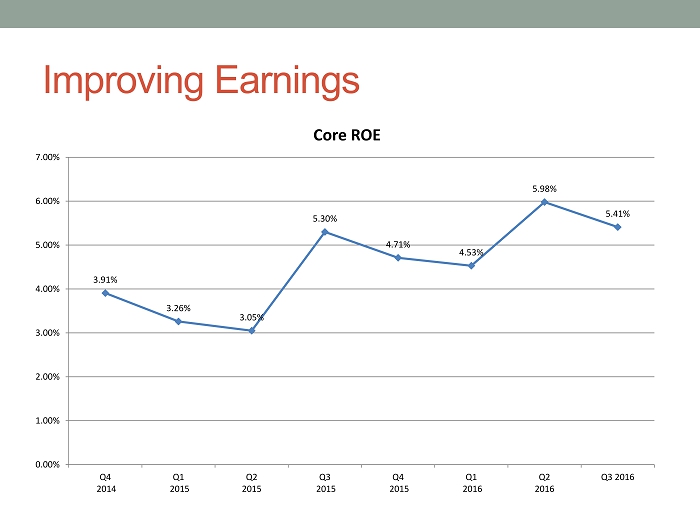
Improving Earnings 3.91% 3.26% 3.05% 5.30% 4.71% 4.53% 5.98% 5.41% 0.00% 1.00% 2.00% 3.00% 4.00% 5.00% 6.00% 7.00% Q4 2014 Q1 2015 Q2 2015 Q3 2015 Q4 2015 Q1 2016 Q2 2016 Q3 2016 Core ROE
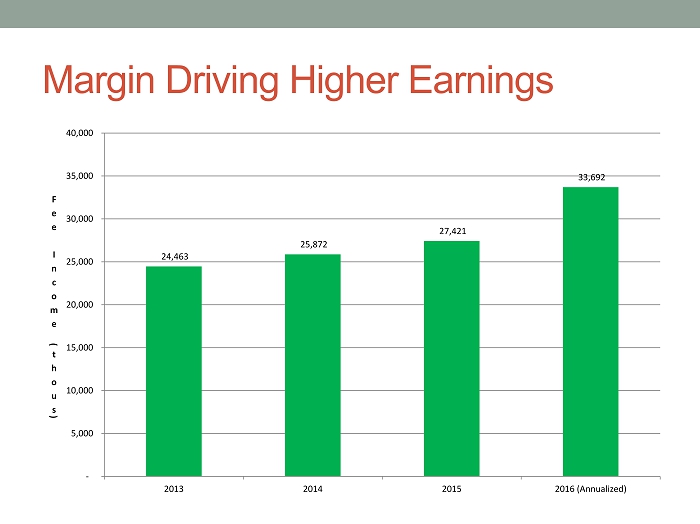
Margin Driving Higher Earnings 24,463 25,872 27,421 33,692 - 5,000 10,000 15,000 20,000 25,000 30,000 35,000 40,000 2013 2014 2015 2016 (Annualized) F e e I n c o m e ( t h o u s )
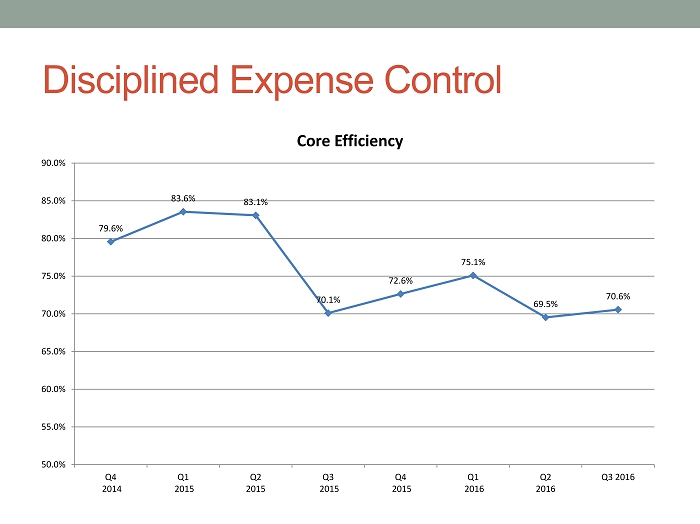
Disciplined Expense Control 79.6% 83.6% 83.1% 70.1% 72.6% 75.1% 69.5% 70.6% 50.0% 55.0% 60.0% 65.0% 70.0% 75.0% 80.0% 85.0% 90.0% Q4 2014 Q1 2015 Q2 2015 Q3 2015 Q4 2015 Q1 2016 Q2 2016 Q3 2016 Core Efficiency
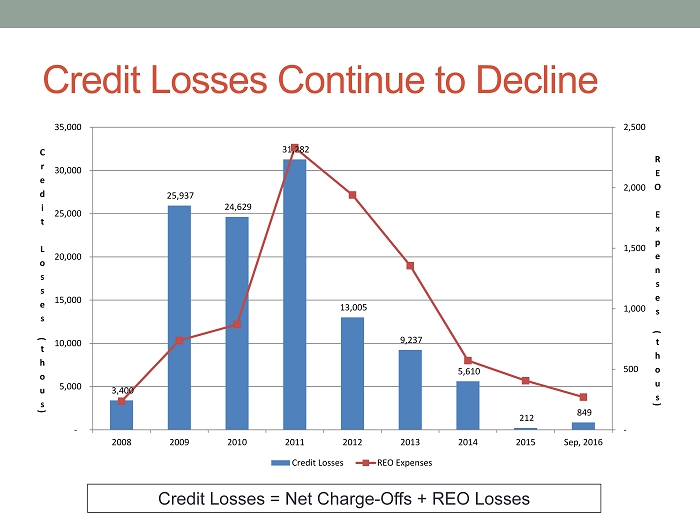
Credit Losses Continue to Decline Credit Losses = Net Charge - Offs + REO Losses 3,400 25,937 24,629 31,282 13,005 9,237 5,610 212 849 - 500 1,000 1,500 2,000 2,500 - 5,000 10,000 15,000 20,000 25,000 30,000 35,000 2008 2009 2010 2011 2012 2013 2014 2015 Sep, 2016 R E O E x p e n s e s ( t h o u s ) C r e d i t L o s s e s ( t h o u s ) Credit Losses REO Expenses
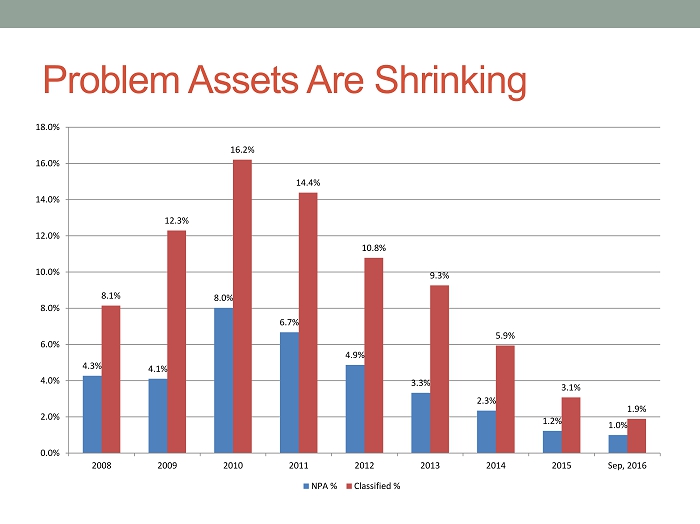
Problem Assets Are Shrinking 4.3% 4.1% 8.0% 6.7% 4.9% 3.3% 2.3% 1.2% 1.0% 8.1% 12.3% 16.2% 14.4% 10.8% 9.3% 5.9% 3.1% 1.9% 0.0% 2.0% 4.0% 6.0% 8.0% 10.0% 12.0% 14.0% 16.0% 18.0% 2008 2009 2010 2011 2012 2013 2014 2015 Sep, 2016 NPA % Classified %
Summary
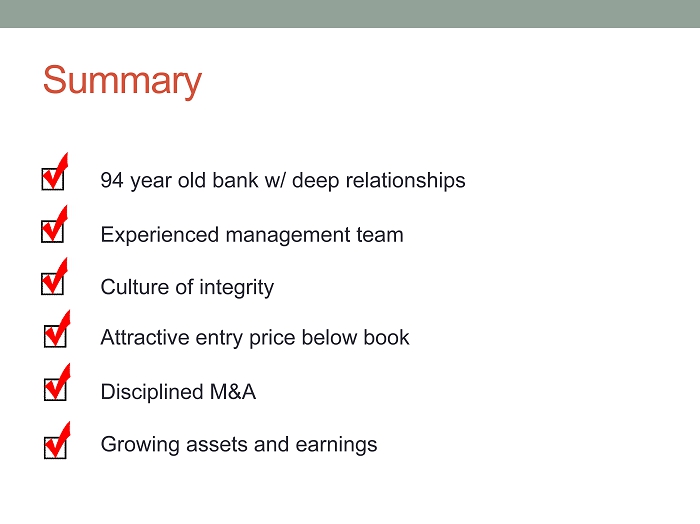
Summary 94 year o ld bank w/ deep relationships Experienced management team Culture of integrity Attractive entry price below book Disciplined M&A Growing assets and earnings
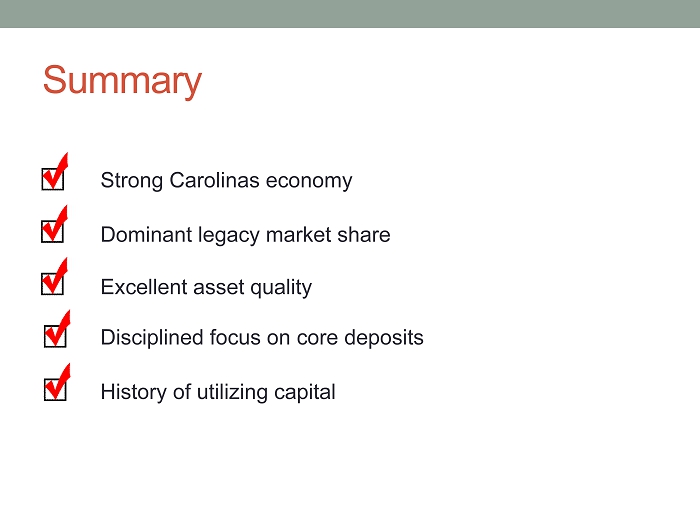
Summary Strong Carolinas economy Dominant legacy market share Excellent asset quality Disciplined focus on core deposits History of utilizing capital
GAAP Appendix
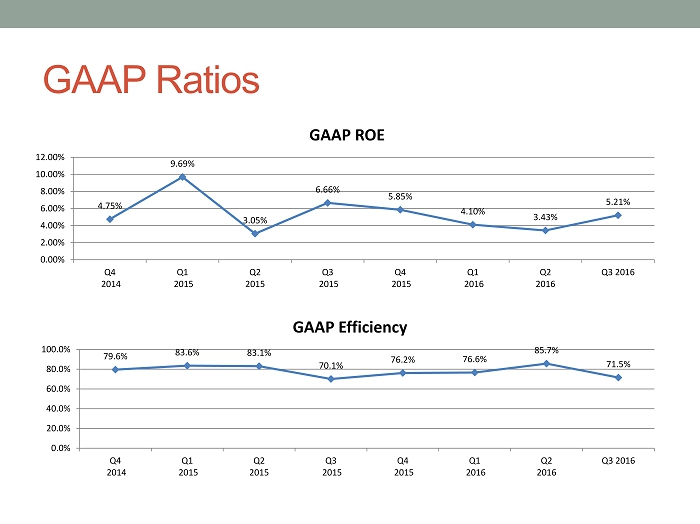
GAAP Ratios 4.75% 9.69% 3.05% 6.66% 5.85% 4.10% 3.43% 5.21% 0.00% 2.00% 4.00% 6.00% 8.00% 10.00% 12.00% Q4 2014 Q1 2015 Q2 2015 Q3 2015 Q4 2015 Q1 2016 Q2 2016 Q3 2016 GAAP ROE 79.6% 83.6% 83.1% 70.1% 76.2% 76.6% 85.7% 71.5% 0.0% 20.0% 40.0% 60.0% 80.0% 100.0% Q4 2014 Q1 2015 Q2 2015 Q3 2015 Q4 2015 Q1 2016 Q2 2016 Q3 2016 GAAP Efficiency