
November, 2017 Investor Presentation

The discussions included in this document may contain “forward - looking statements” within the meaning of the Private Securities Litigation Reform Act of 1995 , including Section 21 E of the Securities Exchange Act of 1934 and Section 27 A of the Securities Act of 1933 . Such statements involve known and unknown risks, uncertainties and other factors that may cause actual results to differ materially . For the purposes of these discussions, any statements that are not statements of historical fact may be deemed to be “forward - looking statements . ” Such statements are often characterized by the use of qualifying words such as “expects,” “anticipates,” “believes,” “estimates,” “plans,” “projects,” or other statements concerning opinions or judgments of the Company and its management about future events . The accuracy of such forward looking statements could be affected by factors including, but not limited to, the financial success or changing conditions or strategies of the Company’s customers or vendors, fluctuations in interest rates, actions of government regulators, the availability of capital and personnel or general economic conditions . These forward looking statements express management’s current expectations, plans or forecasts of future events, results and condition, including financial and other estimates . Additional factors that could cause actual results to differ materially from those anticipated by forward looking statements are discussed in the Company’s filings with the Securities and Exchange Commission, including without limitation its annual report on Form 10 - K, quarterly reports on Form 10 - Q and current reports on Form 8 - K . The Company undertakes no obligation to revise or update these statements following the date of this presentation . Forward Looking Statements 2
Statements included in this document include non - GAAP financial measures and should be read along with the accompanying tables in Appendix A to our quarterly earnings release, which provide a reconciliation of non - GAAP financial measures to GAAP financial measures . This document discusses financial measures, such as core return on average equity and core efficiency ratio, which are non - GAAP measures . We believe that such non - GAAP measures are useful because they enhance the ability of investors and management to evaluate and compare the Company’s operating results from period to period in a meaningful manner . Non - GAAP measures should not be considered as an alternative to any measure of performance as promulgated under GAAP . Investors should consider the Company’s performance and financial condition as reported under GAAP and all other relevant information when assessing the performance or financial condition of the Company . Non - GAAP measures have limitations as analytical tools, and investors should not consider them in isolation or as a substitute for analysis of the Company’s results or financial condition as reported under GAAP . Non - GAAP Measurements 3
All financial numbers included in this presentation are shown in thousands ( 000 ’s) unless otherwise noted, excluding per share data and percentages . All Sep, 2017 numbers are unaudited . Financial Basis 4
Who We Are 5

Sep, 2017 Financial Overview 6 1,420 - 500 1,000 1,500 Assets 7.72% 0.00% 2.00% 4.00% 6.00% 8.00% 10.00% Q3 Core ROE 0.73% 0.00% 0.20% 0.40% 0.60% 0.80% Q3 Core ROA 0.57% 0.00% 0.20% 0.40% 0.60% NPA's 0.39 - 0.10 0.20 0.30 0.40 0.50 Q3 Core EPS 120% 0% 50% 100% 150% 1 Price to Tangible Book
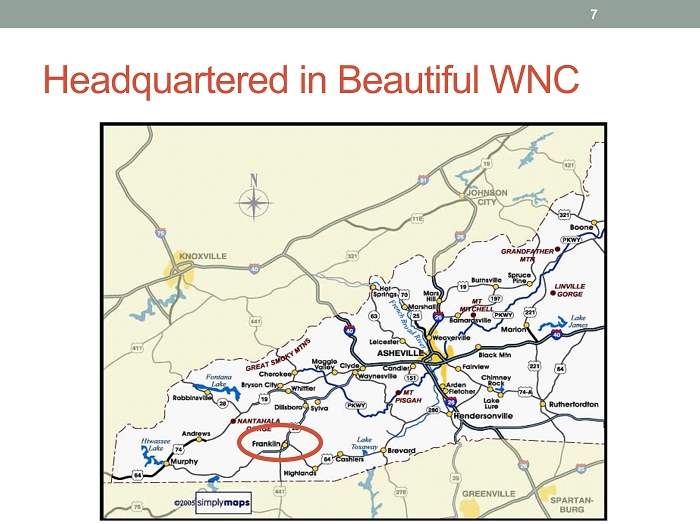
Headquartered in Beautiful WNC 7

2014 IPO and NASDAQ Listing $65 Million 8
95 Years of History … And Counting 9
What’s In A Name? Integrity (Noun) “the quality of being honest and having strong moral principles ; moral uprightness . ” 10
Integrity: More Important Than Ever 11
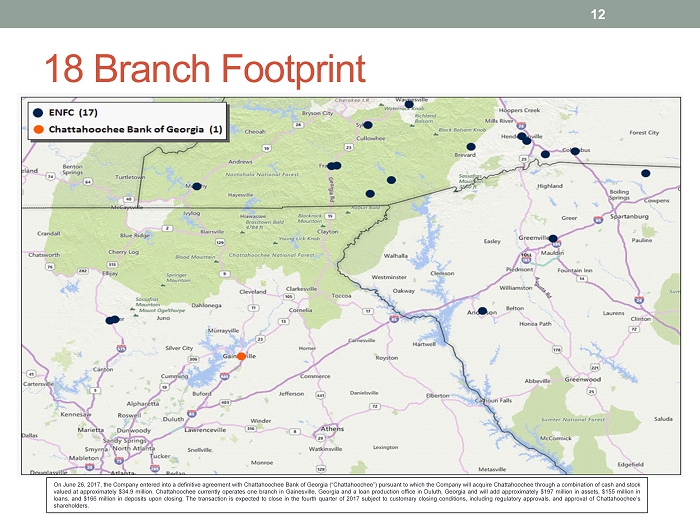
18 Branch Footprint 12 On June 26 , 2017 , the Company entered into a definitive agreement with Chattahoochee Bank of Georgia (“Chattahoochee”) pursuant to which the Company will acquire Chattahoochee through a combination of cash and stock valued at approximately $ 34 . 9 million . Chattahoochee currently operates one branch in Gainesville, Georgia and a loan production office in Duluth, Georgia and will add approximately $ 197 million in assets, $ 155 million in loans, and $ 166 million in deposits upon closing . The transaction is expected to close in the fourth quarter of 2017 subject to customary closing conditions, including regulatory approvals, and approval of Chattahoochee’s shareholders .

Strong Deposit Market Share 13 40% 20% 21% 22% 13% 11% 10% 6% 5% - 1 2 3 4 5 6 7 8 9 0% 5% 10% 15% 20% 25% 30% 35% 40% 45% Macon, NC Polk, NC Pickens, GA Jackson, NC Cherokee, NC Transylvania. NC Haywood, NC Henderson, NC Hall, GA M a r k e t P o s i t i o n M a r k e t S h a r e Market Share Market Position Note: Upstate SC Market Share < 1% of Respective Markets

#5 Community Bank 14 Note: Listing Excludes Recent Mergers of Park Sterling Bank and Paragon Commercial Bank 1 . First Bank $4,591,000 2 . HomeTrust Bank $3,207,000 3 . Southern Bank and Trust $2,546,000 4 . The Fidelity Bank $1,886,0000 5 . Entegra Financial Corp $1,420,000
Major Employers 15
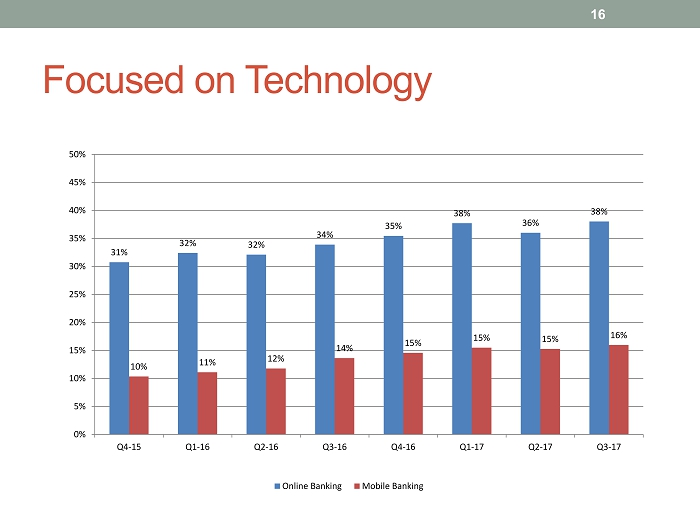
Focused on Technology 16 31% 32% 32% 34% 35% 38% 36% 38% 10% 11% 12% 14% 15% 15% 15% 16% 0% 5% 10% 15% 20% 25% 30% 35% 40% 45% 50% Q4-15 Q1-16 Q2-16 Q3-16 Q4-16 Q1-17 Q2-17 Q3-17 Online Banking Mobile Banking
Charter Conversion 17
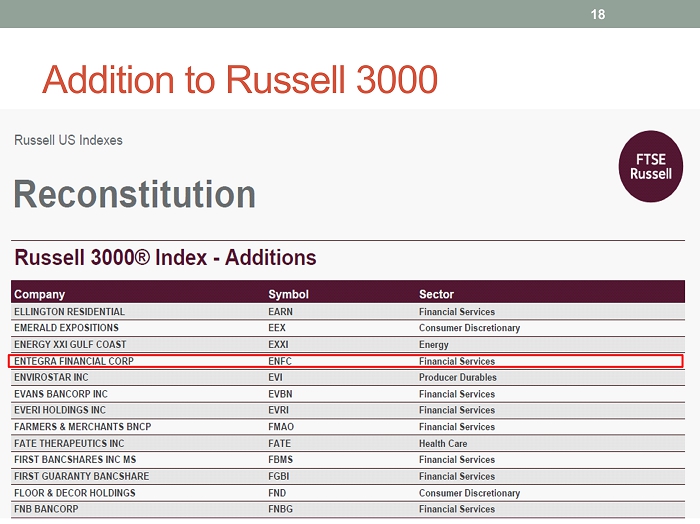
Addition to Russell 3000 18
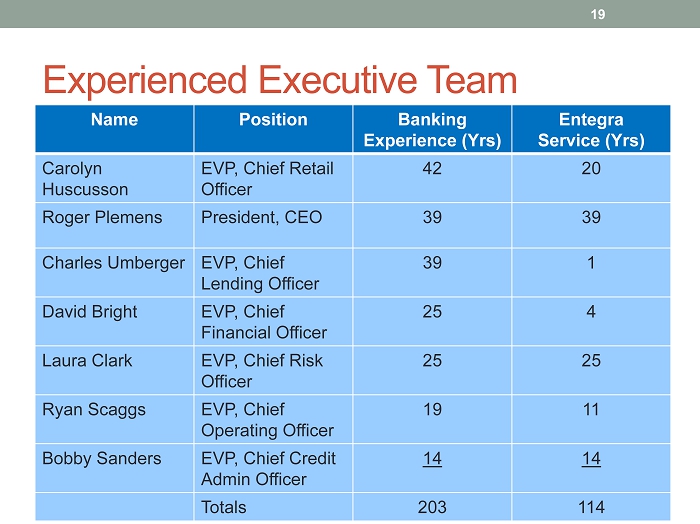
Experienced Executive Team Name Position Banking Experience ( Yrs ) Entegra Service ( Yrs ) Carolyn Huscusson EVP, Chief Retail Officer 42 20 Roger Plemens President, CEO 39 39 Charles Umberger EVP, Chief Lending Officer 39 1 David Bright EVP, Chief Financial Officer 25 4 Laura Clark EVP, Chief Risk Officer 25 25 Ryan Scaggs EVP, Chief Operating Officer 19 11 Bobby Sanders EVP, Chief Credit Admin Officer 14 14 Totals 203 114 19
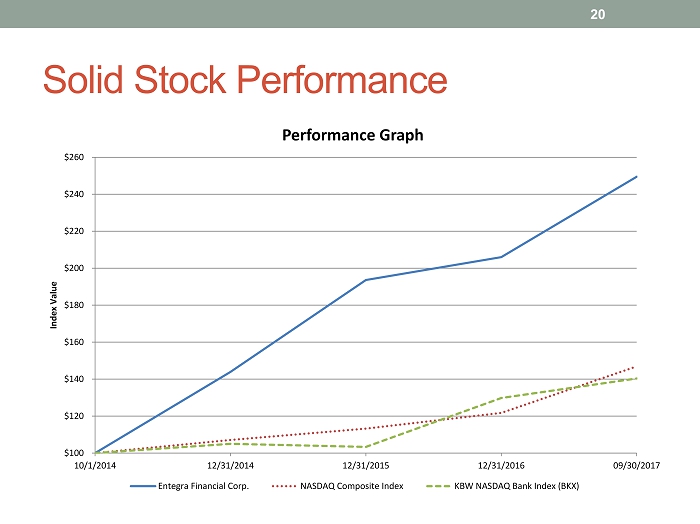
Solid Stock Performance 20 $100 $120 $140 $160 $180 $200 $220 $240 $260 10/1/2014 12/31/2014 12/31/2015 12/31/2016 09/30/2017 Index Value Performance Graph Entegra Financial Corp. NASDAQ Composite Index KBW NASDAQ Bank Index (BKX)
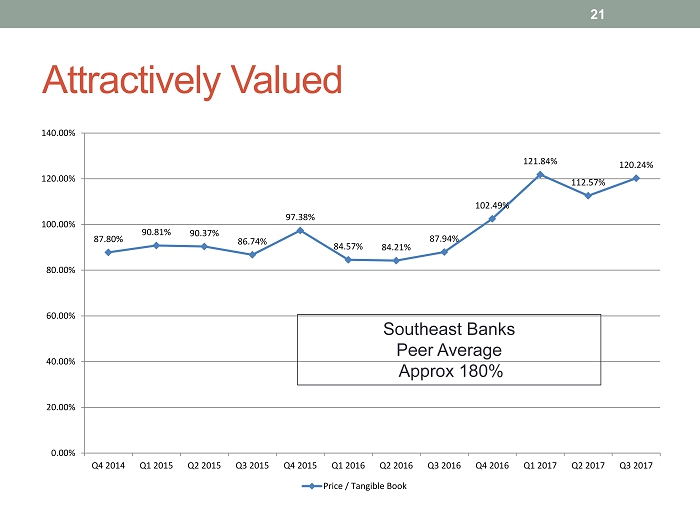
87.80% 90.81% 90.37% 86.74% 97.38% 84.57% 84.21% 87.94% 102.49% 121.84% 112.57% 120.24% 0.00% 20.00% 40.00% 60.00% 80.00% 100.00% 120.00% 140.00% Q4 2014 Q1 2015 Q2 2015 Q3 2015 Q4 2015 Q1 2016 Q2 2016 Q3 2016 Q4 2016 Q1 2017 Q2 2017 Q3 2017 Price / Tangible Book Attractively Valued Southeast Banks Peer Average Approx 180% 21

Research Coverage 22

Strategy Summary 23

Continued Execution of Strategic Plan High Growth Contiguous Markets Disciplined M&A Activity Strong ROE Proper Capital Usage Goal – High Performing Bank 24
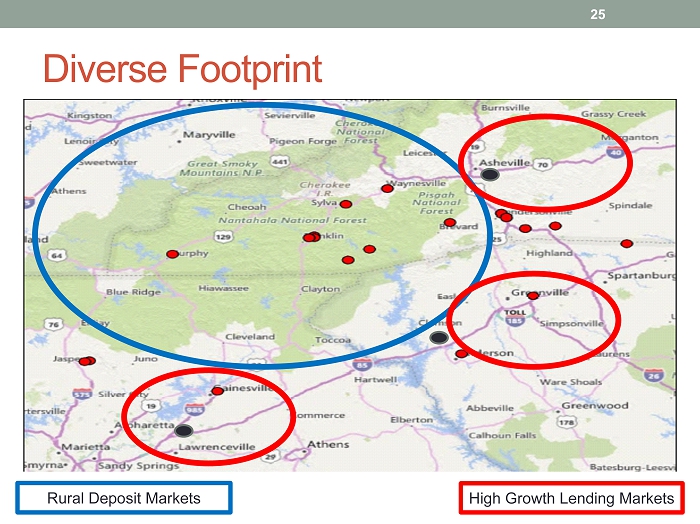
Diverse Footprint 25 Rural Deposit Markets High Growth Lending Markets
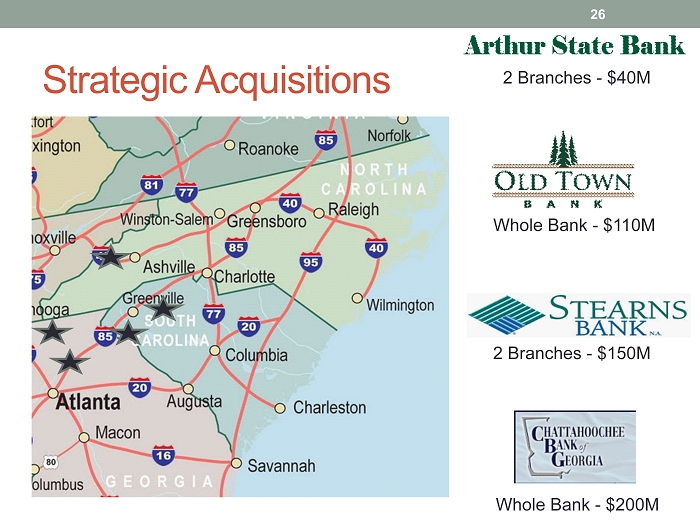
Strategic Acquisitions 2 Branches - $40M Whole Bank - $110M 2 Branches - $150M 26 Whole Bank - $200M
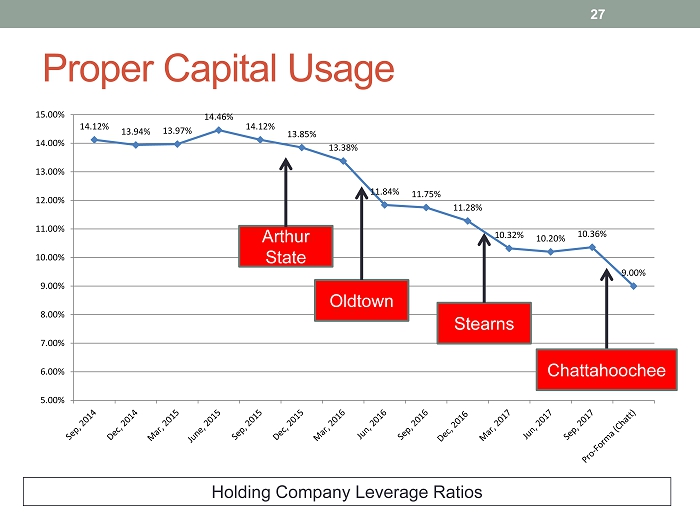
14.12% 13.94% 13.97% 14.46% 14.12% 13.85% 13.38% 11.84% 11.75% 11.28% 10.32% 10.20% 10.36% 9.00% 5.00% 6.00% 7.00% 8.00% 9.00% 10.00% 11.00% 12.00% 13.00% 14.00% 15.00% Proper Capital Usage Holding Company Leverage Ratios Arthur State Oldtown Stearns 27 Chattahoochee

ROE Targets 28 10% 8% 6% 0% 2% 4% 6% 8% 10% 12% Ultimate 2017 2016

Market Overview 29
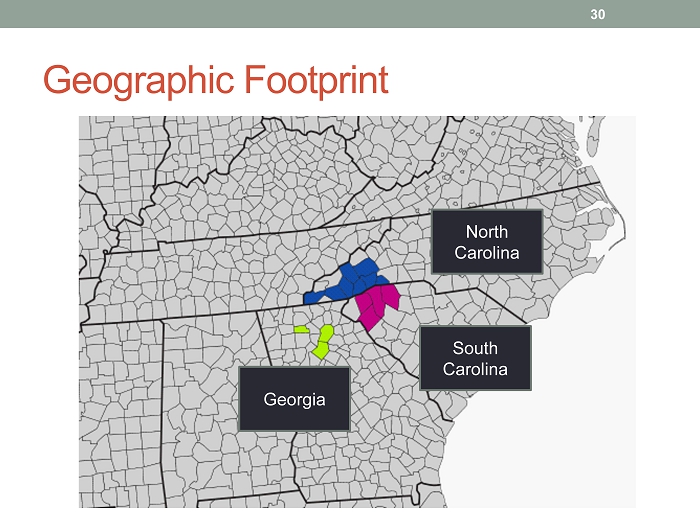
Geographic Footprint South Carolina North Carolina Georgia 30
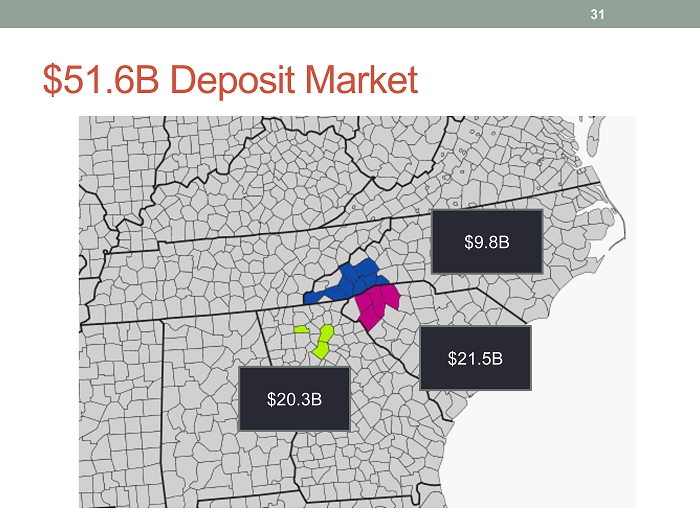
$51.6B Deposit Market $21.5B $9.8B $20.3B 31

Unemployment Rates 32 4.0% to 4.9% 3.2% to 3.7% 4.0% to 4.9% 3.4% to 3.9%

Population Growth (2010 - 2016) 33 0.3% to 4.9% 5.0% to 9.9% > 10%
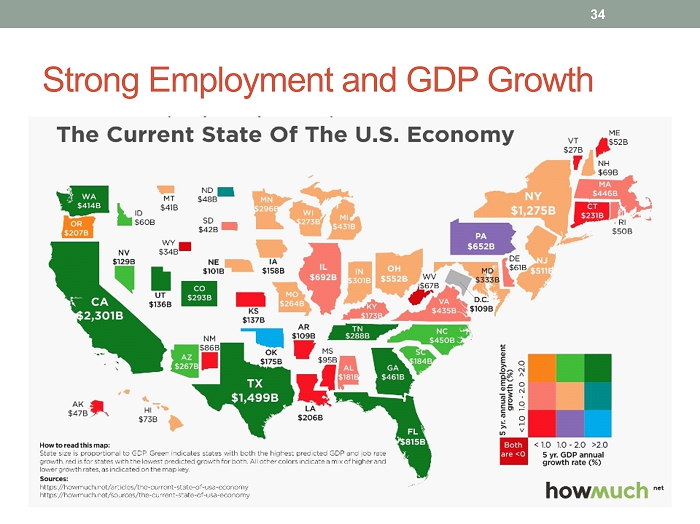
Strong Employment and GDP Growth 34

Financial Overview 35
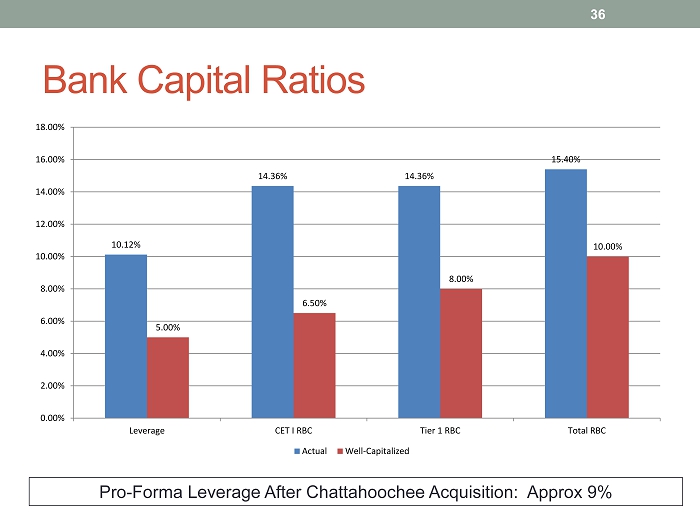
Bank Capital Ratios Pro - Forma Leverage After Chattahoochee Acquisition: Approx 9 % 36 10.12% 14.36% 14.36% 15.40% 5.00% 6.50% 8.00% 10.00% 0.00% 2.00% 4.00% 6.00% 8.00% 10.00% 12.00% 14.00% 16.00% 18.00% Leverage CET I RBC Tier 1 RBC Total RBC Actual Well-Capitalized

1,114,528 1,078,537 1,021,777 874,706 769,939 784,893 903,648 1,031,416 1,292,877 1,419,833 1,596,833 - 200,000 400,000 600,000 800,000 1,000,000 1,200,000 1,400,000 1,600,000 1,800,000 2008 2009 2010 2011 2012 2013 2014 2015 2016 Sep, 2017 Chatt Pro Forma Steady Asset Growth CAGR – 20% 37

Strong Securities Portfolio 38

But Needs Re - Mixed To Loans 39 161,400 239,200 - 50,000 100,000 150,000 200,000 250,000 300,000 350,000 400,000 450,000 Pledged Unpledged
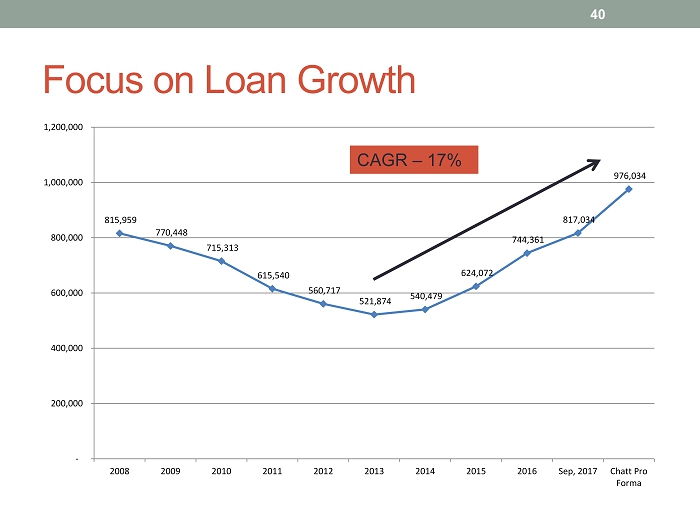
815,959 770,448 715,313 615,540 560,717 521,874 540,479 624,072 744,361 817,034 976,034 - 200,000 400,000 600,000 800,000 1,000,000 1,200,000 2008 2009 2010 2011 2012 2013 2014 2015 2016 Sep, 2017 Chatt Pro Forma Focus on Loan Growth CAGR – 17% 40
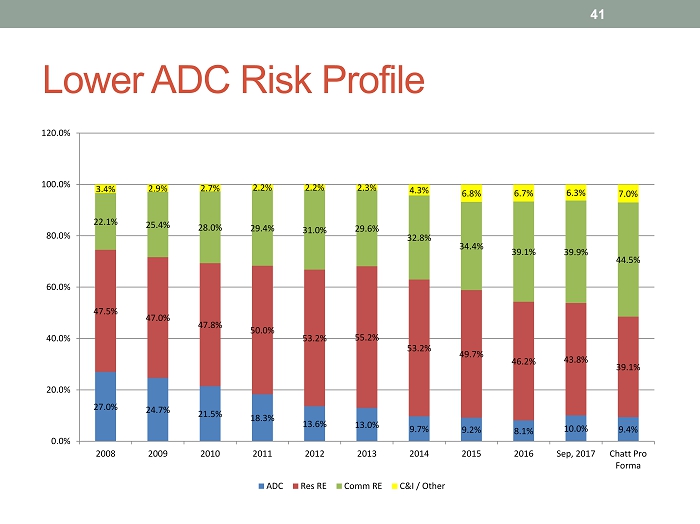
Lower ADC Risk Profile 41 27.0% 24.7% 21.5% 18.3% 13.6% 13.0% 9.7% 9.2% 8.1% 10.0% 9.4% 47.5% 47.0% 47.8% 50.0% 53.2% 55.2% 53.2% 49.7% 46.2% 43.8% 39.1% 22.1% 25.4% 28.0% 29.4% 31.0% 29.6% 32.8% 34.4% 39.1% 39.9% 44.5% 3.4% 2.9% 2.7% 2.2% 2.2% 2.3% 4.3% 6.8% 6.7% 6.3% 7.0% 0.0% 20.0% 40.0% 60.0% 80.0% 100.0% 120.0% 2008 2009 2010 2011 2012 2013 2014 2015 2016 Sep, 2017 Chatt Pro Forma ADC Res RE Comm RE C&I / Other
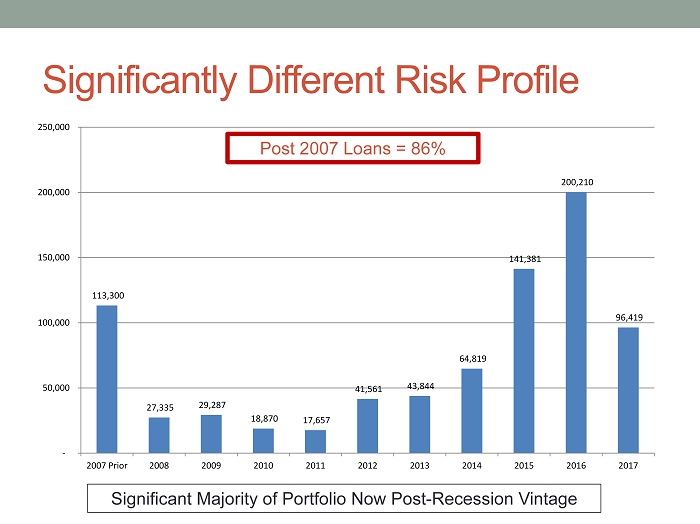
113,300 27,335 29,287 18,870 17,657 41,561 43,844 64,819 141,381 200,210 96,419 - 50,000 100,000 150,000 200,000 250,000 2007 Prior 2008 2009 2010 2011 2012 2013 2014 2015 2016 2017 Significantly Different Risk Profile Significant Majority of Portfolio Now Post - Recession Vintage Post 2007 Loans = 86%
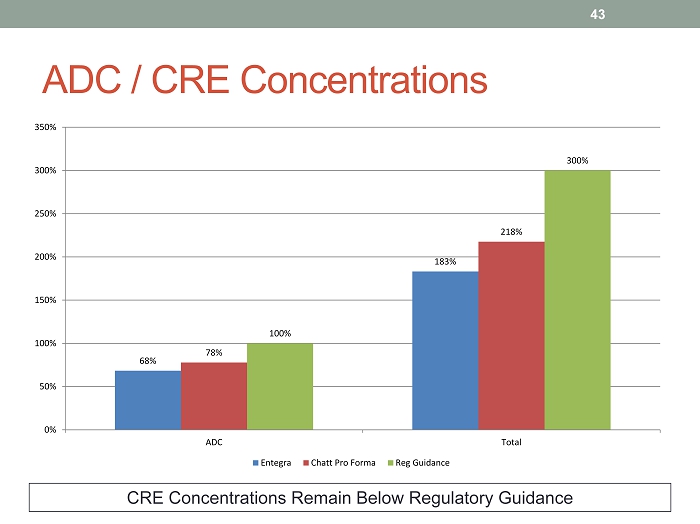
ADC / CRE Concentrations CRE Concentrations Remain Below Regulatory Guidance 43 68% 183% 78% 218% 100% 300% 0% 50% 100% 150% 200% 250% 300% 350% ADC Total Entegra Chatt Pro Forma Reg Guidance
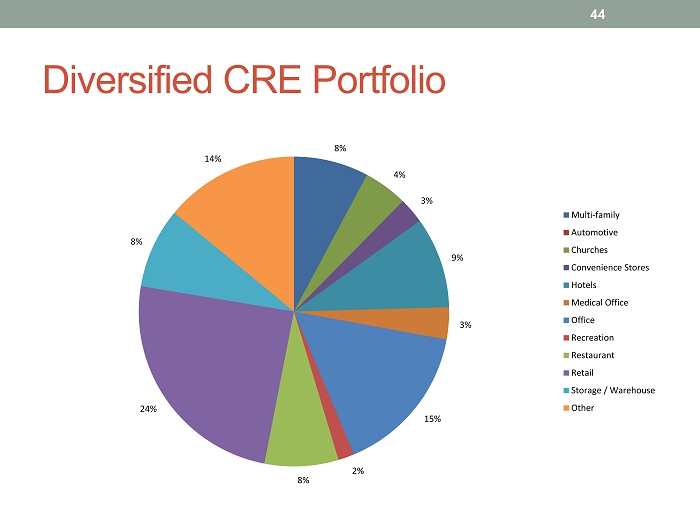
Diversified CRE Portfolio 44 8% 4% 3% 9% 3% 15% 2% 8% 24% 8% 14% Multi-family Automotive Churches Convenience Stores Hotels Medical Office Office Recreation Restaurant Retail Storage / Warehouse Other

Limited Land / ADC Exposure 45 11,471 7,296 28,508 2,753 34,145 20,380 Raw Land Land Development Lot Inventory Farm Commercial Construction Residential Construction
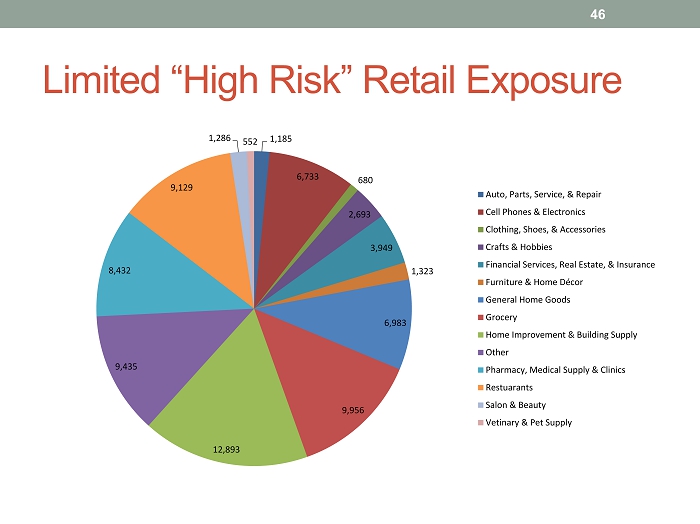
Limited “High Risk” Retail Exposure 46 1,185 6,733 680 2,693 3,949 1,323 6,983 9,956 12,893 9,435 8,432 9,129 1,286 552 Auto, Parts, Service, & Repair Cell Phones & Electronics Clothing, Shoes, & Accessories Crafts & Hobbies Financial Services, Real Estate, & Insurance Furniture & Home Décor General Home Goods Grocery Home Improvement & Building Supply Other Pharmacy, Medical Supply & Clinics Restuarants Salon & Beauty Vetinary & Pet Supply

Top 10 Lending Relationships 47 Borrower Commit ment # Loans Purpose 1 Local county $8.9M 1 Landfill 2 Real estate developer $8.6M 2 Retail shopping centers 3 Real estate developer $8.3M 3 Retail shopping centers 4 Building supply company $8.3M 8 Owner - occupied lumber yards and retail locations 5 Real estate investor $8.0M 5 Residential land developments and commercial real estate investments 6 Hotel ier real estate investor $7.8M 2 Hotel and convenience stores 7 Real estate investor $7.7M 2 Apartments 8 Real estate investor $7.1M 3 Retail shopping center 9 Real estate investor $6.8M 6 Leased bank branches and land 10 Real estate investor $6.3M 6 Improved commercial real estate and land Total $77.8M 38

Growing Deposits w / Minimal Brokered 48 53,508 53,063 50,858 55,145 59,610 70,114 86,244 121,062 139,136 160,718 189,436 662,497 737,345 747,561 695,687 615,488 614,112 616,873 595,555 690,877 844,121 981,027 - 20,000 40,000 60,000 80,000 100,000 120,000 140,000 160,000 180,000 200,000 - 200,000 400,000 600,000 800,000 1,000,000 1,200,000 1,400,000 2008 2009 2010 2011 2012 2013 2014 2015 2016 Sep, 2017 Chatt Pro Forma B r o k e r e d D e p o s i t s T o t a l D e p o s i t s Noninterest Interest Brokered Deposit
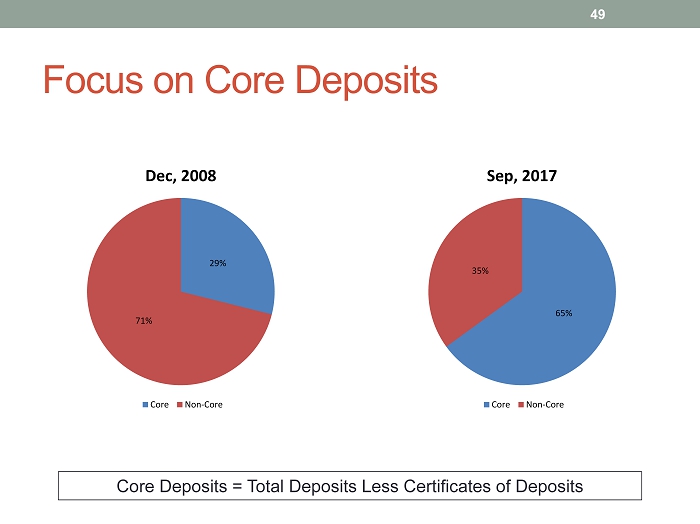
Focus on Core Deposits Core Deposits = Total Deposits Less Certificates of Deposits 29% 71% Dec, 2008 Core Non-Core 49 65% 35% Sep, 2017 Core Non-Core
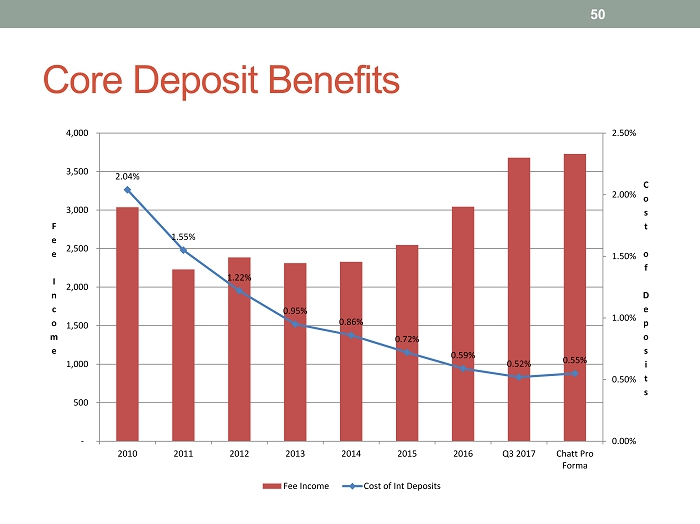
Core Deposit Benefits 50 2.04% 1.55% 1.22% 0.95% 0.86% 0.72% 0.59% 0.52% 0.55% 0.00% 0.50% 1.00% 1.50% 2.00% 2.50% - 500 1,000 1,500 2,000 2,500 3,000 3,500 4,000 2010 2011 2012 2013 2014 2015 2016 Q3 2017 Chatt Pro Forma C o s t o f D e p o s i t s F e e I n c o m e Fee Income Cost of Int Deposits

Improving Earnings 51 4.04% 4.81% 0.70% 5.31% 4.38% 3.90% 5.29% 4.75% 7.43% 6.50% 7.31% 7.72% 0.00% 1.00% 2.00% 3.00% 4.00% 5.00% 6.00% 7.00% 8.00% 9.00% Q4 2014 Q1 2015 Q2 2015 Q3 2015 Q4 2015 Q1 2016 Q2 2016 Q3 2016 Q4 2016 Q1 2017 Q2 2017 Q3 2017 Core ROE
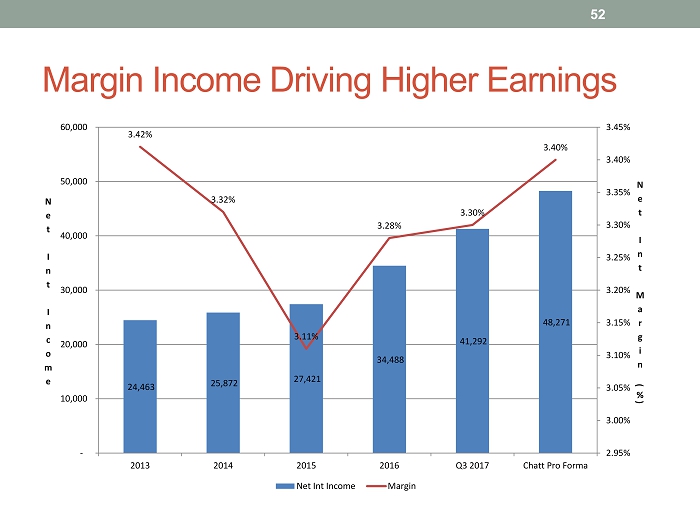
Margin Income Driving Higher Earnings 52 24,463 25,872 27,421 34,488 41,292 48,271 3.42% 3.32% 3.11% 3.28% 3.30% 3.40% 2.95% 3.00% 3.05% 3.10% 3.15% 3.20% 3.25% 3.30% 3.35% 3.40% 3.45% - 10,000 20,000 30,000 40,000 50,000 60,000 2013 2014 2015 2016 Q3 2017 Chatt Pro Forma N e t I n t M a r g i n ( % ) N e t I n t I n c o m e Net Int Income Margin
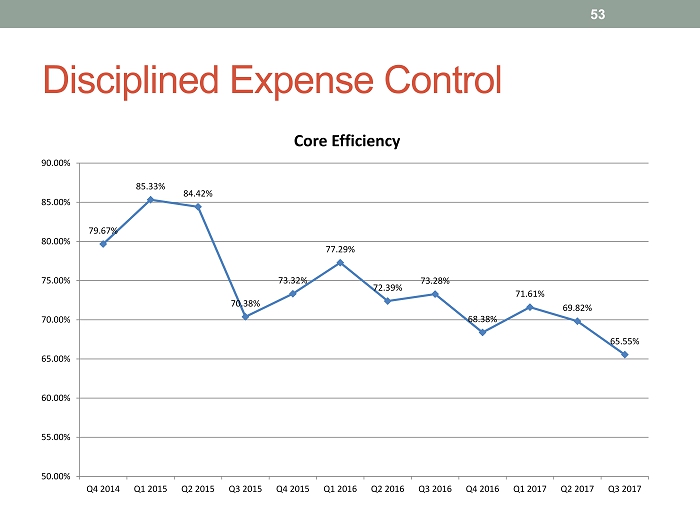
Disciplined Expense Control 53 79.67% 85.33% 84.42% 70.38% 73.32% 77.29% 72.39% 73.28% 68.38% 71.61% 69.82% 65.55% 50.00% 55.00% 60.00% 65.00% 70.00% 75.00% 80.00% 85.00% 90.00% Q4 2014 Q1 2015 Q2 2015 Q3 2015 Q4 2015 Q1 2016 Q2 2016 Q3 2016 Q4 2016 Q1 2017 Q2 2017 Q3 2017 Core Efficiency
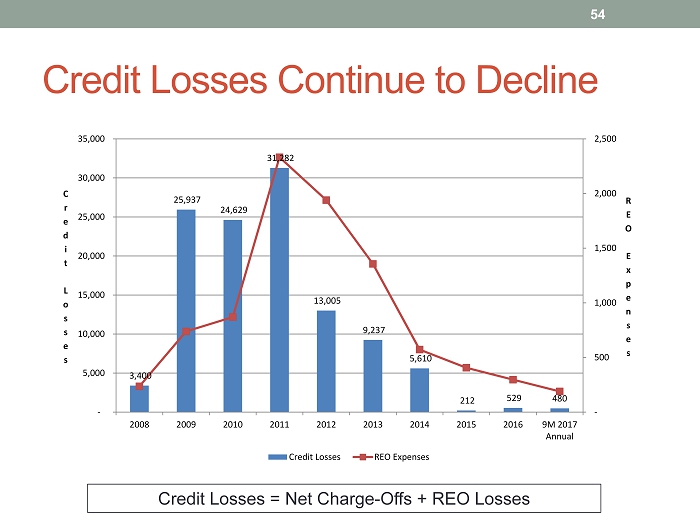
Credit Losses Continue to Decline Credit Losses = Net Charge - Offs + REO Losses 54 3,400 25,937 24,629 31,282 13,005 9,237 5,610 212 529 480 - 500 1,000 1,500 2,000 2,500 - 5,000 10,000 15,000 20,000 25,000 30,000 35,000 2008 2009 2010 2011 2012 2013 2014 2015 2016 9M 2017 Annual R E O E x p e n s e s C r e d i t L o s s e s Credit Losses REO Expenses

Problem Assets Are Shrinking 55 4.3% 4.1% 8.0% 6.7% 4.9% 3.3% 2.3% 1.2% 0.8% 0.6% 8.1% 12.3% 16.2% 14.4% 10.8% 9.3% 5.9% 3.1% 1.7% 1.2% 0.0% 2.0% 4.0% 6.0% 8.0% 10.0% 12.0% 14.0% 16.0% 18.0% 2008 2009 2010 2011 2012 2013 2014 2015 2016 Sep, 2017 NPA % Classified %
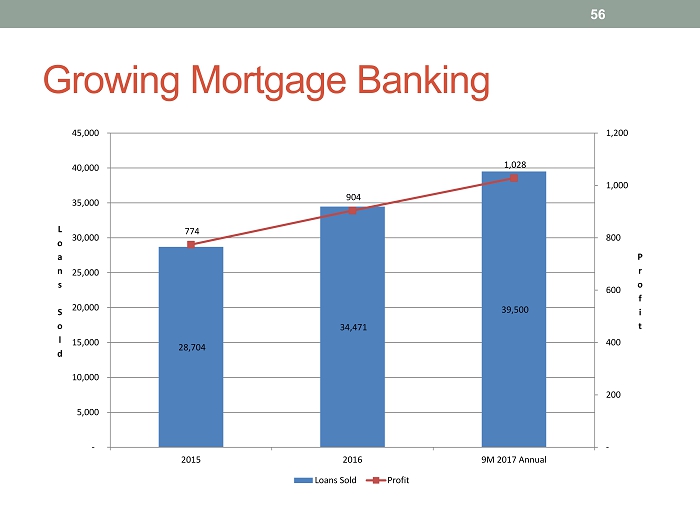
Growing Mortgage Banking 56 28,704 34,471 39,500 774 904 1,028 - 200 400 600 800 1,000 1,200 - 5,000 10,000 15,000 20,000 25,000 30,000 35,000 40,000 45,000 2015 2016 9M 2017 Annual P r o f i t L o a n s S o l d Loans Sold Profit

Neutral Interest Rate Risk Position 57 Change in Interest Rates (basis points) % Change in Pretax Net Interest Income + 300 (3.8) +200 (2.1) +100 (1.0) - 100 (2.0)

NOL Protection Plan Limits 5% Investors To Protect Deferred Tax Asset 58 35,406 43,203 30,713 37,998 24,458 28,425 18,372 20,174 - 5,000 10,000 15,000 20,000 25,000 30,000 35,000 40,000 45,000 50,000 Federal State Dec, 2014 Dec, 2015 Dec, 2016 Sep, 2017

Summary 59
Summary 95 year o ld bank w/ deep relationships Experienced management team Culture of integrity Attractive entry price Disciplined M&A Growing assets and earnings 60
Summary Strong Carolinas economy Dominant legacy deposit market share Excellent asset quality Disciplined focus on core deposits History of utilizing capital 61
GAAP Appendix 62
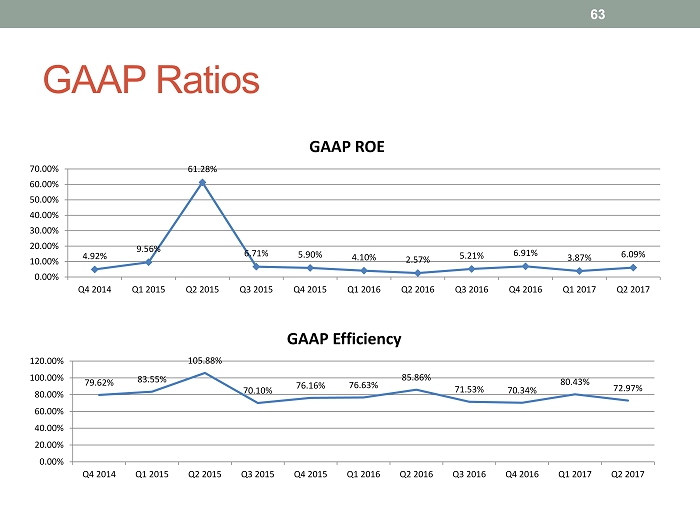
GAAP Ratios 63 4.92% 9.56% 61.28% 6.71% 5.90% 4.10% 2.57% 5.21% 6.91% 3.87% 6.09% 0.00% 10.00% 20.00% 30.00% 40.00% 50.00% 60.00% 70.00% Q4 2014 Q1 2015 Q2 2015 Q3 2015 Q4 2015 Q1 2016 Q2 2016 Q3 2016 Q4 2016 Q1 2017 Q2 2017 GAAP ROE 79.62% 83.55% 105.88% 70.10% 76.16% 76.63% 85.86% 71.53% 70.34% 80.43% 72.97% 0.00% 20.00% 40.00% 60.00% 80.00% 100.00% 120.00% Q4 2014 Q1 2015 Q2 2015 Q3 2015 Q4 2015 Q1 2016 Q2 2016 Q3 2016 Q4 2016 Q1 2017 Q2 2017 GAAP Efficiency