ENTEGRA FINANCIAL CORP. Third Quarter 2018 Earnings Call October 18, 2018
The discussions included in this document may contain “forward - looking statements” within the meaning of the Private Securities Litigation Reform Act of 1995 , including Section 21 E of the Securities Exchange Act of 1934 and Section 27 A of the Securities Act of 1933 . Such statements involve known and unknown risks, uncertainties and other factors that may cause actual results to differ materially from the anticipated results or other expectations expressed in the forward - looking statements . For the purposes of these discussions, any statements that are not statements of historical fact may be deemed to be “forward - looking statements . ” Such statements are often characterized by the use of qualifying words such as “expects,” “anticipates,” “believes,” “estimates,” “plans,” “projects,” or other statements concerning opinions or judgments of the Company and its management about future events . The accuracy of such forward - looking statements could be affected by factors including, but not limited to, the financial success or changing conditions or strategies of the Company’s customers or vendors, fluctuations in interest rates, actions of government regulators, the availability of capital and personnel or general economic conditions . These forward - looking statements express management’s current expectations, plans or forecasts of future events, results and condition, including financial and other estimates . Additional factors that could cause actual results to differ materially from those anticipated by forward - looking statements are discussed in the Company’s filings with the Securities and Exchange Commission, including without limitation its annual report on Form 10 - K, quarterly reports on Form 10 - Q and current reports on Form 8 - K . Forward - looking statements speak only as of the date they are made, and the Company undertakes no obligation to revise or update these statements following the date of this presentation . Forward - Looking Statements 2

Statements included in this press release include non - GAAP financial measures and should be read along with the accompanying tables in Appendix A, which provide a reconciliation of non - GAAP financial measures to GAAP financial measures . This press release and the accompanying tables discuss financial measures, such as adjusted noninterest expense, adjusted net income, adjusted diluted earnings per share, adjusted return on average assets, adjusted return on tangible average equity, adjusted efficiency ratio, tangible common equity, tangible assets and tangible book value per share, which are all non - GAAP measures . We believe that such non - GAAP measures are useful because they enhance the ability of investors and management to evaluate and compare the Company’s operating results from period to period in a meaningful manner . Non - GAAP measures should not be considered as an alternative to any measure of performance as promulgated under GAAP, nor are they necessarily comparable to non - GAAP performance measures that may be presented by other companies . Investors should consider the Company’s performance and financial condition as reported under GAAP and all other relevant information when assessing the performance or financial condition of the Company . Non - GAAP measures have limitations as analytical tools, and investors should not consider them in isolation or as a substitute for analysis of the Company’s results or financial condition as reported under GAAP . All financial numbers included in this presentation are shown in thousands ( 000 ’s) unless otherwise noted, excluding per share data and percentages . All interim numbers are unaudited . Non - GAAP / Financial Basis 3
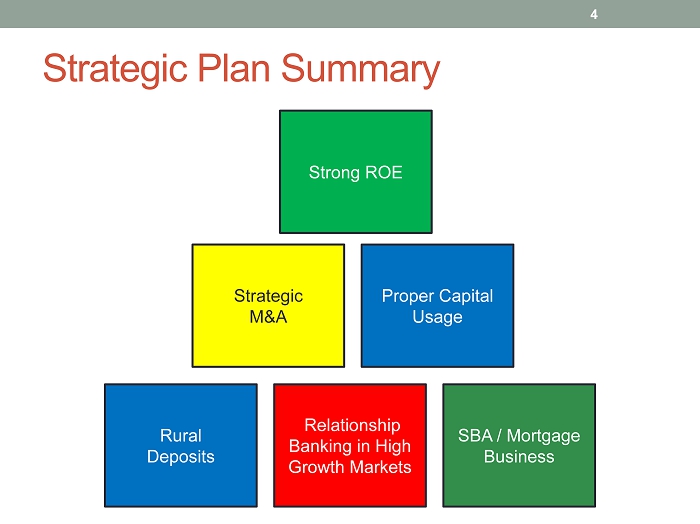
Strategic Plan Summary Strong ROE 4 Rural Deposits Relationship Banking in High Growth Markets SBA / Mortgage Business Strategic M&A Proper Capital Usage Strong ROE
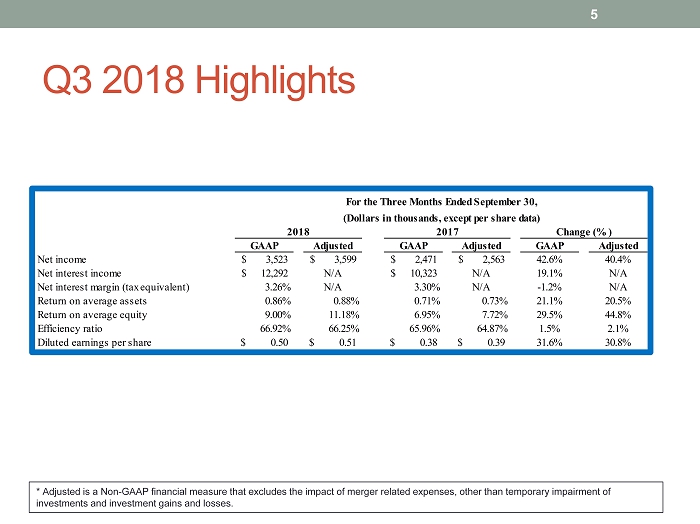
Q3 2018 Highlights 5 * Adjusted is a Non - GAAP financial measure that excludes the impact of merger related expenses, other than temporary impairment of investments and investment gains and losses. GAAP Adjusted GAAP Adjusted GAAP Adjusted Net income 3,523$ 3,599$ 2,471$ 2,563$ 42.6% 40.4% Net interest income 12,292$ N/A 10,323$ N/A 19.1% N/A Net interest margin (tax equivalent) 3.26% N/A 3.30% N/A -1.2% N/A Return on average assets 0.86% 0.88% 0.71% 0.73% 21.1% 20.5% Return on average equity 9.00% 11.18% 6.95% 7.72% 29.5% 44.8% Efficiency ratio 66.92% 66.25% 65.96% 64.87% 1.5% 2.1% Diluted earnings per share 0.50$ 0.51$ 0.38$ 0.39$ 31.6% 30.8% For the Three Months Ended September 30, (Dollars in thousands, except per share data) 2018 2017 Change (%)
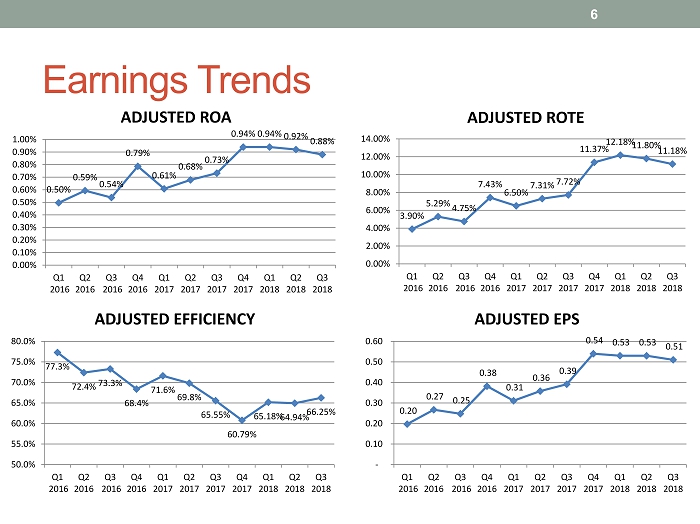
Earnings Trends 6 77.3% 72.4% 73.3% 68.4% 71.6% 69.8% 65.55% 60.79% 65.18% 64.94% 66.25% 50.0% 55.0% 60.0% 65.0% 70.0% 75.0% 80.0% Q1 2016 Q2 2016 Q3 2016 Q4 2016 Q1 2017 Q2 2017 Q3 2017 Q4 2017 Q1 2018 Q2 2018 Q3 2018 ADJUSTED EFFICIENCY 3.90% 5.29% 4.75% 7.43% 6.50% 7.31% 7.72% 11.37% 12.18% 11.80% 11.18% 0.00% 2.00% 4.00% 6.00% 8.00% 10.00% 12.00% 14.00% Q1 2016 Q2 2016 Q3 2016 Q4 2016 Q1 2017 Q2 2017 Q3 2017 Q4 2017 Q1 2018 Q2 2018 Q3 2018 ADJUSTED ROTE 0.20 0.27 0.25 0.38 0.31 0.36 0.39 0.54 0.53 0.53 0.51 - 0.10 0.20 0.30 0.40 0.50 0.60 Q1 2016 Q2 2016 Q3 2016 Q4 2016 Q1 2017 Q2 2017 Q3 2017 Q4 2017 Q1 2018 Q2 2018 Q3 2018 ADJUSTED EPS 0.50% 0.59% 0.54% 0.79% 0.61% 0.68% 0.73% 0.94% 0.94% 0.92% 0.88% 0.00% 0.10% 0.20% 0.30% 0.40% 0.50% 0.60% 0.70% 0.80% 0.90% 1.00% Q1 2016 Q2 2016 Q3 2016 Q4 2016 Q1 2017 Q2 2017 Q3 2017 Q4 2017 Q1 2018 Q2 2018 Q3 2018 ADJUSTED ROA

Yield Curve Flattening 7
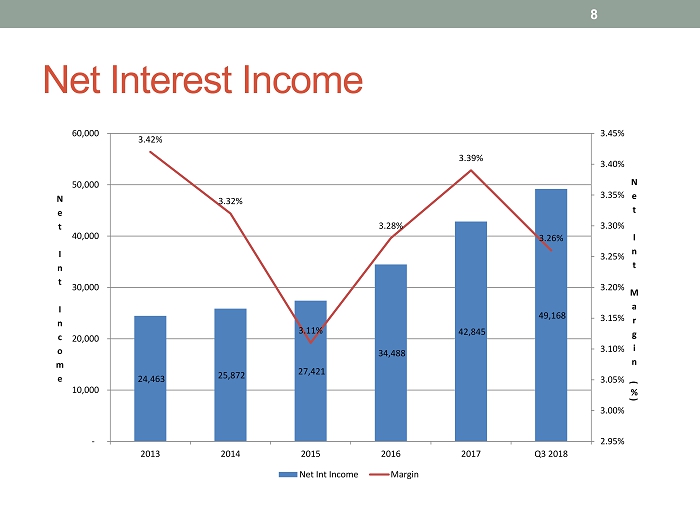
Net Interest Income 8 24,463 25,872 27,421 34,488 42,845 49,168 3.42% 3.32% 3.11% 3.28% 3.39% 3.26% 2.95% 3.00% 3.05% 3.10% 3.15% 3.20% 3.25% 3.30% 3.35% 3.40% 3.45% - 10,000 20,000 30,000 40,000 50,000 60,000 2013 2014 2015 2016 2017 Q3 2018 N e t I n t M a r g i n ( % ) N e t I n t I n c o m e Net Int Income Margin
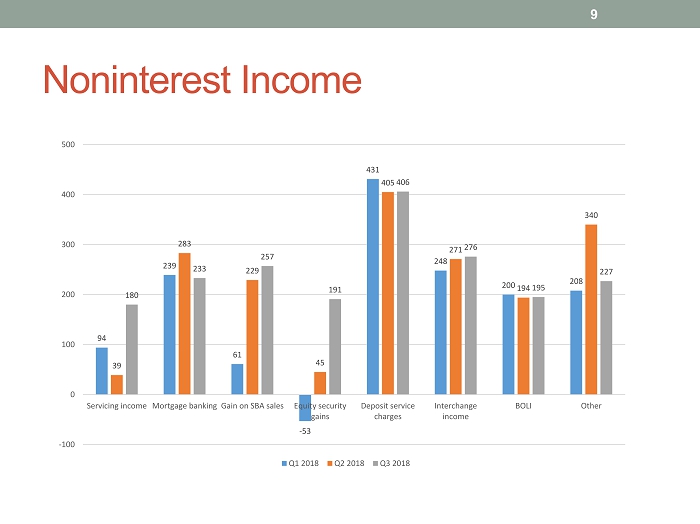
Noninterest Income 9 94 239 61 - 53 431 248 200 208 39 283 229 45 405 271 194 340 180 233 257 191 406 276 195 227 -100 0 100 200 300 400 500 Servicing income Mortgage banking Gain on SBA sales Equity security gains Deposit service charges Interchange income BOLI Other Q1 2018 Q2 2018 Q3 2018
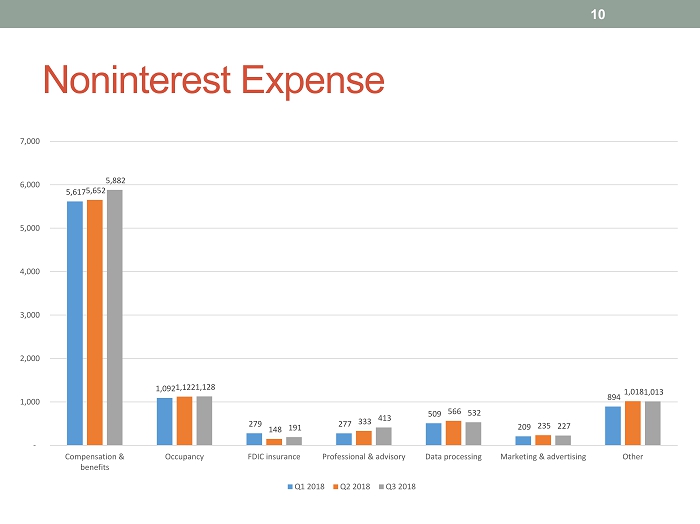
Noninterest Expense 10 5,617 1,092 279 277 509 209 894 5,652 1,122 148 333 566 235 1,018 5,882 1,128 191 413 532 227 1,013 - 1,000 2,000 3,000 4,000 5,000 6,000 7,000 Compensation & benefits Occupancy FDIC insurance Professional & advisory Data processing Marketing & advertising Other Q1 2018 Q2 2018 Q3 2018
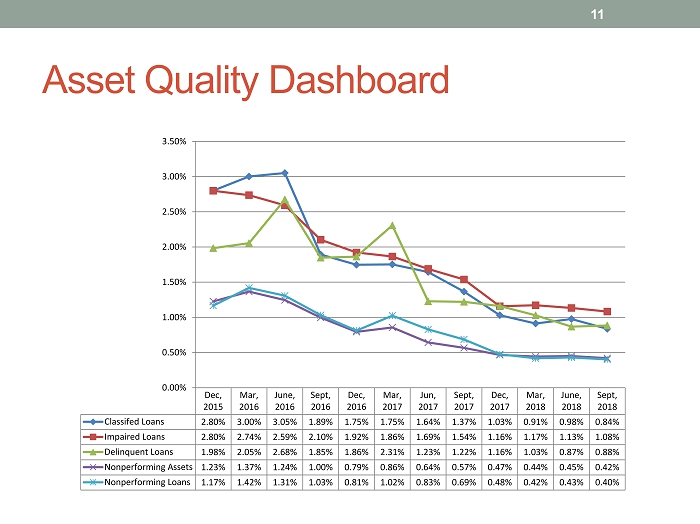
Asset Quality Dashboard 11 Dec, 2015 Mar, 2016 June, 2016 Sept, 2016 Dec, 2016 Mar, 2017 Jun, 2017 Sept, 2017 Dec, 2017 Mar, 2018 June, 2018 Sept, 2018 Classifed Loans 2.80% 3.00% 3.05% 1.89% 1.75% 1.75% 1.64% 1.37% 1.03% 0.91% 0.98% 0.84% Impaired Loans 2.80% 2.74% 2.59% 2.10% 1.92% 1.86% 1.69% 1.54% 1.16% 1.17% 1.13% 1.08% Delinquent Loans 1.98% 2.05% 2.68% 1.85% 1.86% 2.31% 1.23% 1.22% 1.16% 1.03% 0.87% 0.88% Nonperforming Assets 1.23% 1.37% 1.24% 1.00% 0.79% 0.86% 0.64% 0.57% 0.47% 0.44% 0.45% 0.42% Nonperforming Loans 1.17% 1.42% 1.31% 1.03% 0.81% 1.02% 0.83% 0.69% 0.48% 0.42% 0.43% 0.40% 0.00% 0.50% 1.00% 1.50% 2.00% 2.50% 3.00% 3.50%

Organic Loan Growth 12 7.95% 18.72% 11.25% 14.26% 12.14% 6.38% 6.02% 0.00% 2.00% 4.00% 6.00% 8.00% 10.00% 12.00% 14.00% 16.00% 18.00% 20.00% Mar, 2017 Jun, 2017 Sep, 2017 Dec, 2017 Mar, 2018 Jun, 2018 Sep, 2018

Deposit Betas 13 0% - 12% 0% 0% 0% - 8% - 4% - 8% 0% - 8% 16% 55% 59% -20% -10% 0% 10% 20% 30% 40% 50% 60% 70% 0.00% 0.10% 0.20% 0.30% 0.40% 0.50% 0.60% 0.70% 0.80% Q3 2015 Q4 2015 Q1 2016 Q2 2016 Q3 2016 Q4 2016 Q1 2017 Q2 2017 Q3 2017 Q4 2017 Q1 2018 Q2 2018 Q3 2018 Cost of Total Deposits Beta

Organic Deposit Growth 14 3.42% 4.34% - 2.30% - 2.91% - 2.18% - 5.14% 9.63% -6.00% -4.00% -2.00% 0.00% 2.00% 4.00% 6.00% 8.00% 10.00% 12.00% Mar, 2017 Jun, 2017 Sep, 2017 Dec, 2017 Mar, 2018 Jun, 2018 Sep, 2018