
Roadshow Investor Presentation February 2019
2 Compliance Disclosures Important Information for Shareholders and Investors This presentation does not constitute an offer to sell, the solicitation of an offer to sell, or the solicitation of an offer to buy any securities or the solicitation of any vote or approval of the shareholders of SmartFinancial , Inc . (“ SmartFinancial ” or “SMBK”) or Entegra Financial Corp . (“ Entegra ” or “ENFC ”), nor shall there be any sale of securities in any jurisdiction in which such offer, solicitation, or sale would be unlawful prior to registration or qualification under the securities laws of any such jurisdiction . In connection with the proposed transaction, SmartFinancial will file a registration statement on Form S - 4 with the Securities and Exchange Commission (the “SEC”), which will contain the joint proxy statement of SmartFinancial and Entegra and a prospectus of SmartFinancial . Shareholders of Entegra and SmartFinancial are encouraged to read the registration statement, including the joint proxy statement/prospectus that will be part of the registration statement, because it will contain important information about the proposed transaction, Entegra, and SmartFinancial . After the registration statement is filed with the SEC, the joint proxy statement/prospectus and other relevant documents will be mailed to Entegra and SmartFinancial shareholders and will be available for free on the SEC’s website (www . sec . gov) . The joint proxy statement/prospectus will also be made available for free by contacting Ron Gorczynski, SmartFinancial’s Chief Administrative Officer, at ( 865 ) 437 - 5724 or David Bright, the Chief Financial Officer of Entegra, at ( 828 ) 524 - 7000 . No offer of securities shall be made except by means of a prospectus meeting the requirements of Section 10 of the Securities Act of 1933 , as amended (the “Securities Act”) . Participants in the Solicitation SmartFinancial, Entegra and certain of their respective directors and executive officers may be deemed to be participants in the solicitation of proxies from Entegra and SmartFinancial shareholders in connection with the proposed transaction under the rules of the SEC . Information about the directors and executive officers of SmartFinancial may be found in the definitive proxy statement for SmartFinancial’s 2018 annual meeting of shareholders, filed with the SEC by SmartFinancial on April 2 , 2018 , and other documents subsequently filed by SmartFinancial with the SEC . Information about the directors and executive officers of Entegra may be found in the definitive proxy statement for Entegra’s 2018 annual meeting of shareholders, filed by Entegra with the SEC on April 2 , 2018 . Additional information regarding the interests of these participants will also be included in the joint proxy statement/prospectus regarding the proposed transaction when it becomes available . Free copies of these documents may be obtained as described in the paragraph above .

3 Legal Disclaimer Forward - Looking Statements Certain of the statements made in this investor presentation may constitute forward - looking statements within the meaning of the Private Securities Litigation Reform Act of 1995 , Section 27 A of the Securities Act and Section 21 E of the Securities Exchange Act of 1934 , as amended . The words “expect,” “anticipate,” “intend,” “plan,” “believe,” “seek,” and “estimate,” and similar expressions, are intended to identify such forward - looking statements, but other statements not based on historical information may also be considered forward - looking, including statements about the benefits to SmartFinancial and Entegra of the proposed merger, SmartFinancial’s and Entegra’s future financial and operating results and their respective plans, objectives, and intentions . All forward - looking statements are subject to risks, uncertainties, and other factors that may cause the actual results, performance, or achievements of SmartFinancial and Entegra to differ materially from any results, performance, or achievements expressed or implied by such forward - looking statements . Such risks, uncertainties, and other factors include, among others, ( 1 ) the risk that the cost savings and any revenue synergies from the proposed merger may not be realized or take longer than anticipated to be realized, ( 2 ) the risk that the cost savings and any revenue synergies from recently completed mergers may not be realized or may take longer than anticipated to realize, ( 3 ) disruption from the proposed merger, or recently completed mergers, with customer, supplier, or employee relationships, ( 4 ) the occurrence of any event, change, or other circumstances that could give rise to the termination of the merger agreement, ( 5 ) the failure to obtain necessary shareholder or regulatory approvals for the merger, ( 6 ) the possibility that the amount of the costs, fees, expenses, and charges related to the merger may be greater than anticipated, including as a result of unexpected or unknown factors, events, or liabilities, ( 7 ) the failure of the conditions to the merger to be satisfied, ( 8 ) the risk of successful integration of the two companies’ businesses, including the risk that the integration of Entegra’s operations with those of SmartFinancial will be materially delayed or will be more costly or difficult than expected, ( 9 ) the risk of expansion into new geographic or product markets, ( 10 ) reputational risk and the reaction of the parties’ customers to the merger, ( 11 ) the risk of potential litigation or regulatory action related to the merger, ( 12 ) the dilution caused by SmartFinancial’s issuance of additional shares of its common stock in the merger, and ( 13 ) general competitive, economic, political, and market conditions . Additional factors which could affect the forward - looking statements can be found in SmartFinancial’s annual report on Form 10 - K, quarterly reports on Form 10 - Q, and current reports on Form 8 - K, or Entegra’s annual report on Form 10 - K, quarterly reports on Form 10 - Q, and current reports on Form 8 - K, in each case filed with the SEC and available on the SEC’s website at http : //www . sec . gov . SmartFinancial and Entegra disclaim any obligation to update or revise any forward - looking statements contained in this communication, which speak only as of the date hereof, whether as a result of new information, future events, or otherwise . Non - GAAP Financial Measures Statements included in this presentation include non - GAAP financial measures and should be read along with the accompanying tables, which provide a reconciliation of non - GAAP financial measures to GAAP financial measures . The non - GAAP financial measures used in this presentation include : (i) tangible common equity, (ii) tangible book value per share, (iii) core net interest margin, (iv) operating efficiency ratio, (v) operating return on average assets, (vi) operating earnings per share, and (vii) operating return on tangible common equity . Tangible common equity excludes total preferred stock, preferred stock paid in capital, goodwill, and other intangible assets, and tangible book value per share reflects the per share value of tangible common equity . Core net interest margin adjusts net interest margin to exclude the impact of purchase accounting . The operating efficiency ratio excludes securities gains and losses and merger related expenses from the efficiency ratio . Net operating income excludes securities gains and losses and merger related expenses, and the effect of the December, 2017 tax law change on deferred tax assets, and the income tax effect of adjustments, and operating return on average assets is net operating income divided by GAAP total average assets . Operating earnings per share is net operating income divided by GAAP total average assets . Operating return on tangible common equity is net operating income divided by tangible common equity . Management believes that non - GAAP financial measures provide additional useful information that allows readers to evaluate the ongoing performance of the company and provide meaningful comparisons to its peers . Non - GAAP financial measures should not be considered as an alternative to any measure of performance or financial condition as promulgated under GAAP, and investors should consider SmartFinancial's performance and financial condition as reported under GAAP and all other relevant information when assessing the performance or financial condition of the company . Non - GAAP financial measures have limitations as analytical tools, and investors should not consider them in isolation or as a substitute for analysis of the results or financial condition as reported under GAAP .

4 Enhancing Value for Both Shareholder Bases ▪ $2.3 billion asset bank holding company – Headquartered in Knoxville, TN – Founded in 2007 – NASDAQ traded under ticker “SMBK” ▪ Double digit annual organic growth complemented by track record of strategic partnerships – 6 multi - state strategic partnerships since 2012 – Experience integrating MOE partnership via the Cornerstone Bancshares , Inc. merger completed in 2015 ▪ Consistent earnings growth and momentum – 48% Annual Operating EPS growth in 2018² – Delivering ~1.1% Operating Return on Average Assets² to shareholders in the most recent quarter ▪ $ 1.6 billion asset bank holding company – Headquartered in Franklin, NC – Founded in 1922 – NASDAQ traded under ticker “ENFC” ▪ Complementary mix of stable legacy and high - growth MSAs – Dominant market share in Cullowhee and Brevard, NC MSAs – Growth opportunities in Atlanta, GA, Greenville, SC and Asheville, NC MSAs ▪ Seasoned mortgage and SBA lending contributes to diversified fee income ▪ Strong asset quality and profitability improvement – 34% Annual Operating EPS growth in 2018² – ~1.0% Operating Return on Average Assets in the most recent quarter² – NPAs Excluding TDRs³ < 1.0% of Total Assets since Q3 2016 Combined Franchise x ~$ 4 billion asset banking footprint across six states in desirable Southeast markets x +20% EPS accretion for both SMBK & ENFC¹ x Return on Average Assets ~ 1.2%¹ x Return on Average Common Equity > 10%¹ x Disciplined use of capital with sub - 2.5 year tangible book value earn - back period x Increased scale and scarcity value, creating one of the top 20 largest banks by total assets in combined states of operation x Furthers strategic positioning and solidifies company as a future partner of choice x Improved stock liquidity with significant upside to current respective standalone trading prices x Retention of strong capital position Note: Financial data as of or for the period ended December 31, 2018, unless otherwise noted; combined states of operation re fer s to Alabama , Florida, Georgia, North Carolina, South Carolina and Tennessee (1) Assumes first full year of operations (2020) (2) Operating EPS and Operating Return on Average Assets are Non - GAAP measures; refer to the Appendix for GAAP to Non - GAAP reconciliation (3) Nonperforming assets excluding restructured loans defined as total nonaccrual loans, real estate owned and repossessed assets Sources: S&P Global Market Intelligence, FDIC

5 Combined Franchise Builds Significant Scarcity Value (1) Defined as Alabama, Florida, Georgia, North Carolina , South Carolina and Tennessee (2) Most recent quarter (MRQ) pro forma for acquisitions (whole - bank and branch) and branch divestitures that are pending or were completed after MRQ; does not reflect merger - related adjustments Source: S&P Global Market Intelligence Chattanooga Greenville Huntsville Panama City Pensacola Mobile Murfreesboro Tennessee North Carolina South Carolina Georgia Florida Alabama Birmingham Tuscaloosa Knoxville Gainesville Asheville Montgomery Tallahassee Nashville Atlanta SmartFinancial, Inc. Entegra Financial Corp. ▪ Increases depth of executive leadership team and Board of Directors highly capable of running a pro forma ~$ 4 billion asset, NASDAQ - traded financial institution ▪ Advances combined entity into the top 20 largest publicly traded banks headquartered in its combined states of operation¹ MRQ Assets Rank Institution Name ($mm) 1 Bank of America Corporation 2,354,507 2 BB&T Corporation 225,697 3 SunTrust Banks, Inc. 215,543 4 Regions Financial Corporation 125,688 5 Synovus Financial Corp.² 45,103 6 First Horizon National Corporation 40,833 7 First Citizens BancShares, Inc.² 36,628 8 BankUnited, Inc. 32,164 9 Pinnacle Financial Partners, Inc. 25,031 10 CenterState Bank Corporation² 16,548 11 Ameris Bancorp² 16,177 12 South State Corporation 14,676 13 United Community Banks, Inc. 12,573 14 Mercantil Bank Holding Corporation 8,124 15 ServisFirst Bancshares, Inc. 8,007 16 Seacoast Banking Corporation of Florida 6,748 17 First Bancorp 5,864 18 FB Financial Corporation² 5,528 19 Franklin Financial Network, Inc. 4,246 20 SmartFinancial, Inc. / Entegra Financial Corp. 3,911 21 Carolina Financial Corporation 3,791 22 Live Oak Bancshares, Inc. 3,670 23 HomeTrust Bancshares, Inc. 3,413 24 Capital City Bank Group, Inc. 2,959 25 Southern BancShares (N.C.), Inc. 2,675 26 Wilson Bank Holding Co. 2,544 27 Atlantic Capital Bancshares, Inc. 2,491 28 SmartFinancial, Inc. 2,274 33 Entegra Financial Corp. 1,636

6 Pro Forma Deposit Footprint and Market Share Alabama Birmingham Florida Georgia North Carolina Tennessee Tuscaloosa Montgomery Tallahassee Panama City Pensacola Mobile Huntsville Atlanta Gainesville Greenville Asheville Chattanooga Nashville Murfreesbor o Knoxville (1) Deposits as of June 30, 2018 FDIC deposit survey, adjusted for announced acquisitions Sources: S&P Global Market Intelligence, FDIC North Carolina 27% Georgia 10% South Carolina 3% Tennessee 42% Florida 3% Alabama 15% Pro Forma County Market Share #1 to #5 # 6 to #15 Greater than #15 Pro Forma Deposits by State¹ Market Deposits Number Share in Market of Rank Institution (%) ($mm) Branches 1 Regions Financial Corp. (AL) 10.27 9,207 131 2 SunTrust Banks Inc. (GA) 8.44 7,560 79 3 Wells Fargo & Co. (CA) 7.55 6,762 73 4 First Horizon National Corp. (TN) 7.06 6,325 60 5 BB&T Corp. (NC) 6.15 5,508 76 6 Bank of America Corp. (NC) 5.92 5,308 46 7 Pinnacle Financial Partners Inc. (TN) 3.74 3,349 23 8 SMBK / ENFC 3.50 3,134 47 9 Hancock Whitney Corp. (MS) 3.08 2,756 15 10 Synovus Financial Corp. (GA) 2.93 2,625 33 Total for Institutions in Markets 89,607 1,291 Pro Forma Counties of Operation¹ South Carolina

7 Atlanta Columbia Nashville Montgomery Gainesville Murfreesboro Spartanburg Greenville Asheville Pensacola Huntsville Chattanooga Knoxville Baldwin County Raleigh Combined Presence Across Several Key Growth Markets Note: Deposit data as of June 30, 2018 Source : S&P Global Market Intelligence, FDIC ▪ Establishes a presence in an attractive region covering Alabama, Florida, Georgia, North Carolina, South Carolina and Tennessee connecting 10 key identified markets across these six states ‒ SMBK/ENFC will be able to leverage its size and market reach to promote the recruitment of talented sales team members with the experience and market knowledge needed in order to continue to gather core deposits $5.9 bn $8.4 bn $6.0 bn $3.7 bn $3.9 bn $4.2 bn $5.6 bn $11.0 bn $3.8 bn $2.8 bn Gainesville, GA Murfreesboro, TN Asheville, NC Spartanburg, SC Baldwin County, AL Pensacola, FL Huntsville, AL Chattanooga, TN Greenville, SC Knoxville, TN Total Market Deposits → ~$55 billion in potential deposit opportunities in these attractive growth markets → I n the last year, the total deposits in these key markets grew ~7%

8 Key Markets to Successfully Execute Growth Strategy Note: Deposit data as of June 30, 2018; projected populated change reflects projected 5 - year CAGR Source : S&P Global Market Intelligence, FDIC, Claritas Greenville, SC Huntsville, AL Murfreesboro, TN Asheville, NC Current Population 69,570 Current Population 142,056 Current Population 198,318 Current Population 93,220 Projected Population Change +1.16% Projected Population Change +0.63% Projected Population Change +1.13% Projected Population Change +1.59% Median HHI $54,790 Median HHI $62,520 Median HHI $55,740 Median HHI $52,289 Total Deposits $8,361mm Total Deposits $5,856mm Total Deposits $3,765mm Total Deposits $3,665mm
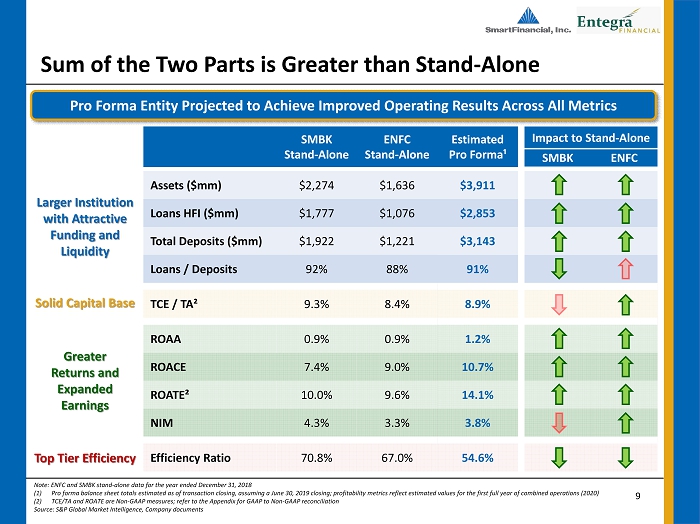
9 Sum of the Two Parts is Greater than Stand - Alone Note: ENFC and SMBK stand - alone data for the year ended December 31, 2018 (1) Pro forma balance sheet totals estimated as of transaction closing, assuming a June 30, 2019 closing; profitability metrics r efl ect estimated values for the first full year of combined operations (2020) (2) TCE/TA and ROATE are Non - GAAP measures; refer to the Appendix for GAAP to Non - GAAP reconciliation Source : S&P Global Market Intelligence, Company documents Assets ($mm) $2,274 $1,636 $3,911 Loans HFI ($mm) $1,777 $1,076 $2,853 Total Deposits ($mm) $1,922 $1,221 $3,143 Loans / Deposits 92% 88% 91% TCE / TA² 9.3% 8.4% 8.9% ROAA 0.9% 0.9% 1.2% ROACE 7.4% 9.0% 10.7% ROATE² 10.0% 9.6% 14.1% NIM 4.3% 3.3% 3.8% Efficiency Ratio 70.8% 67.0% 54.6% Larger Institution with Attractive Funding and Liquidity Solid Capital Base Greater Returns and Expanded Earnings Top Tier Efficiency SMBK Stand - Alone ENFC Stand - Alone Estimated Pro Forma¹ Impact to Stand - Alone SMBK ENFC Pro Forma Entity Projected to Achieve Improved Operating Results Across All Metrics

10 Extensive Due Diligence Completed ▪ Comprehensive, reciprocal reviews of culture, processes, core systems and business plans ▪ Experienced management teams with proven transaction integration expertise ▪ In - depth credit due diligence, utilizing experienced in - house and third - party specialists → Like - minded conservative underwriting methodology → ENFC has an extremely granular portfolio, averaging $135.7K per credit → Reviewed 54% of entire portfolio and 68% of watch - list loans: ▪ 24% of 1 - 4 family credits ▪ 68% of commercial real estate ▪ 56% of acquisition, development and construction ▪ Credit review resulted in a total credit mark of - $37.0 million → 45% of the total mark (~$16.7 million) assumed to accrete back straight - line over 4 years → - $2.4 million mark on adjusted nonperforming loans → - $34.6 million (~3%) mark on performing loans Extensive due diligence was performed by both SMBK and ENFC Source: Company Documents
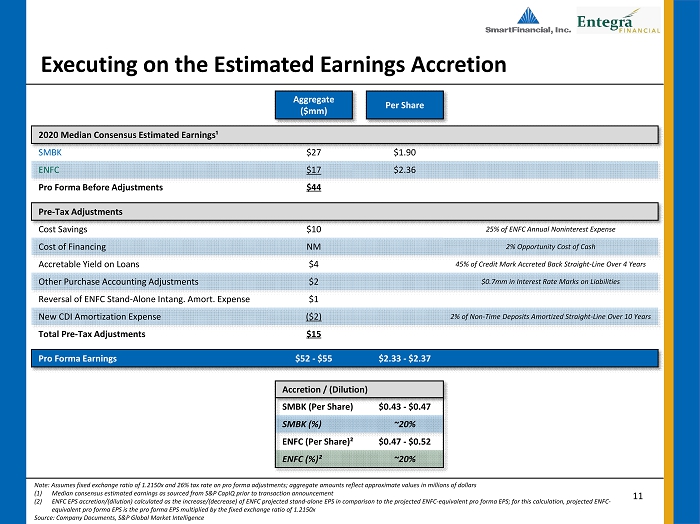
11 Executing on the Estimated Earnings Accretion Note: Assumes fixed exchange ratio of 1.2150x and 26% tax rate on pro forma adjustments; aggregate amounts reflect approximat e v alues in millions of dollars (1) Median consensus estimated earnings as sourced from S&P CapIQ prior to transaction announcement (2) ENFC EPS accretion/(dilution) calculated as the increase/(decrease) of ENFC projected stand - alone EPS in comparison to the proje cted ENFC - equivalent pro forma EPS; for this calculation , projected ENFC - equivalent pro forma EPS is the pro forma EPS multiplied by the fixed exchange ratio of 1.2150x Source: Company Documents, S&P Global Market Intelligence Aggregate ($mm) Per Share 2020 Median Consensus Estimated Earnings¹ SMBK $27 $1.90 ENFC $17 $2.36 Pro Forma Before Adjustments $44 Pre - Tax Adjustments Cost Savings $10 25% of ENFC Annual Noninterest Expense Cost of Financing NM 2% Opportunity Cost of Cash Accretable Yield on Loans $4 45% of Credit Mark Accreted Back Straight - Line Over 4 Years Other Purchase Accounting Adjustments $2 $0.7mm in Interest Rate Marks on Liabilities Reversal of ENFC Stand - Alone Intang . Amort . Expense $1 New CDI Amortization Expense ($2) 2% of Non - Time Deposits Amortized Straight - Line Over 10 Years Total Pre - Tax Adjustments $15 Pro Forma Earnings $52 - $55 $2.33 - $2.37 Accretion / (Dilution) SMBK (Per Share) $0.43 - $0.47 SMBK (%) ~20% ENFC (Per Share)² $0.47 - $0.52 ENFC (%)² ~20%
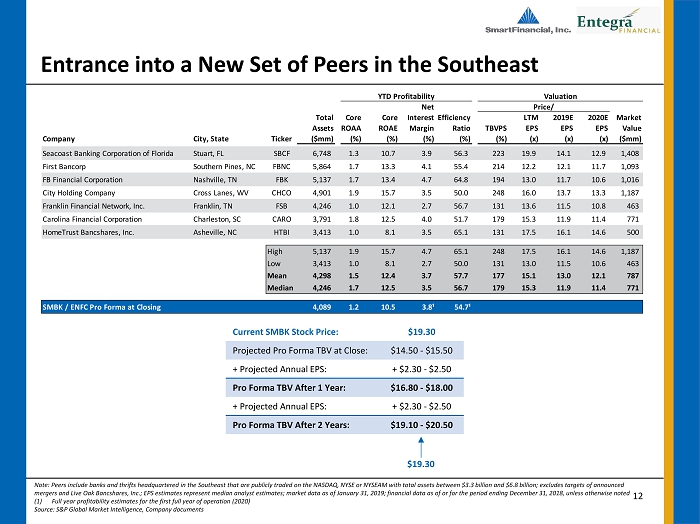
12 Entrance into a New Set of Peers in the Southeast Note: Peers include banks and thrifts headquartered in the Southeast that are publicly traded on the NASDAQ, NYSE or NYSEAM with total assets between $ 3.3 billion and $6.8 billion; excludes targets of announced mergers and Live Oak Bancshares, Inc.; EPS estimates represent median analyst estimates; market data as of January 31, 2019; fin ancial data as of or for the period ending December 31, 2018, unless otherwise noted (1) Full year profitability estimates for the first full year of operation (2020) Source: S&P Global Market Intelligence, Company documents YTD Profitability Valuation Net Price/ Total Core Core InterestEfficiency LTM 2019E 2020E Market Assets ROAA ROAE Margin Ratio TBVPS EPS EPS EPS Value Company City, State Ticker ($mm) (%) (%) (%) (%) (%) (x) (x) (x) ($mm) Seacoast Banking Corporation of Florida Stuart, FL SBCF 6,748 1.3 10.7 3.9 56.3 223 19.9 14.1 12.9 1,408 First Bancorp Southern Pines, NC FBNC 5,864 1.7 13.3 4.1 55.4 214 12.2 12.1 11.7 1,093 FB Financial Corporation Nashville, TN FBK 5,137 1.7 13.4 4.7 64.8 194 13.0 11.7 10.6 1,016 City Holding Company Cross Lanes, WV CHCO 4,901 1.9 15.7 3.5 50.0 248 16.0 13.7 13.3 1,187 Franklin Financial Network, Inc. Franklin, TN FSB 4,246 1.0 12.1 2.7 56.7 131 13.6 11.5 10.8 463 Carolina Financial Corporation Charleston, SC CARO 3,791 1.8 12.5 4.0 51.7 179 15.3 11.9 11.4 771 HomeTrust Bancshares, Inc. Asheville, NC HTBI 3,413 1.0 8.1 3.5 65.1 131 17.5 16.1 14.6 500 High 5,137 1.9 15.7 4.7 65.1 248 17.5 16.1 14.6 1,187 Low 3,413 1.0 8.1 2.7 50.0 131 13.0 11.5 10.6 463 Mean 4,298 1.5 12.4 3.7 57.7 177 15.1 13.0 12.1 787 Median 4,246 1.7 12.5 3.5 56.7 179 15.3 11.9 11.4 771 SMBK / ENFC Pro Forma at Closing 4,089 1.2 10.5 3.8¹ 54.7¹ Current SMBK Stock Price: $19.30 Projected Pro Forma TBV at Close: $14.50 - $15.50 + Projected Annual EPS: + $2.30 - $2.50 Pro Forma TBV After 1 Year: $16.80 - $18.00 + Projected Annual EPS: + $2.30 - $2.50 Pro Forma TBV After 2 Years: $19.10 - $20.50 $19.30
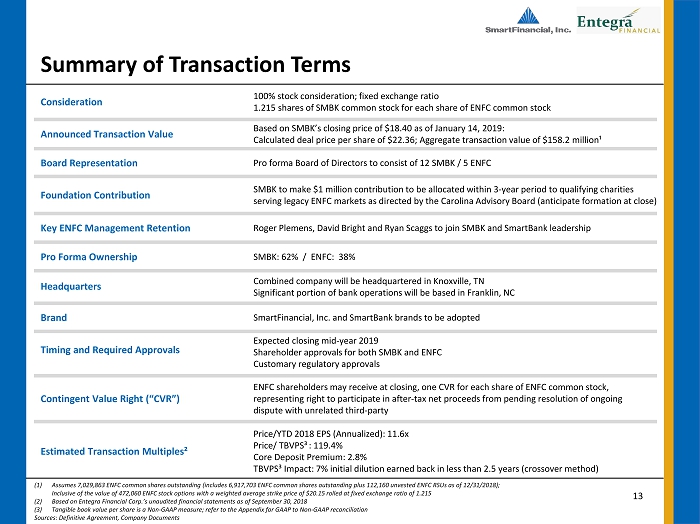
13 Based on SMBK’s closing price of $18.40 as of January 14, 2019: Calculated deal price per share of $ 22.36; Aggregate transaction value of $158.2 million¹ Summary of Transaction Terms SMBK to make $1 million contribution to be allocated within 3 - year period to qualifying charities serving legacy ENFC markets as directed by the Carolina Advisory Board (anticipate formation at close) Consideration 100% stock consideration; fixed exchange ratio 1.215 shares of SMBK common stock for each share of ENFC common stock Foundation Contribution Pro forma Board of Directors to consist of 12 SMBK / 5 ENFC Key ENFC Management Retention Roger Plemens, David Bright and Ryan Scaggs to join SMBK and SmartBank leadership Pro Forma Ownership SMBK: 62 % / ENFC : 38% Timing and Required Approvals Expected closing mid - year 2019 Shareholder approvals for both SMBK and ENFC Customary regulatory approvals Estimated Transaction Multiples² Price/YTD 2018 EPS (Annualized): 11.6x Price/ TBVPS³ : 119.4% Core Deposit Premium: 2.8% TBVPS³ Impact: 7% initial dilution earned back in less than 2.5 years (crossover method) Board Representation Announced Transaction Value (1) Assumes 7,029,863 ENFC common shares outstanding (includes 6,917,703 ENFC common shares outstanding plus 112,160 unvested ENFC RSUs as of 12/31/2018); Inclusive of the value of 472,060 ENFC stock options with a weighted average strike price of $20.15 rolled at fixed exchange ratio of 1.215 (2) Based on Entegra Financial Corp.’s unaudited financial statements as of September 30, 2018 (3) Tangible book value per share is a Non - GAAP measure; refer to the Appendix for GAAP to Non - GAAP reconciliation Sources: Definitive Agreement, Company Documents Contingent Value Right (“CVR”) ENFC shareholders may receive at closing, one CVR for each share of ENFC common stock, representing right to participate in after - tax net proceeds from pending resolution of ongoing dispute with unrelated third - party Headquarters Combined company will be headquartered in Knoxville, TN Significant portion of bank operations will be based in Franklin, NC Brand SmartFinancial , Inc. and SmartBank brands to be adopted

14 Advisory Fees 24% Severance & Retention 20% Employment Contracts & Change in Control 20% DP Contract Termination 12% Foundation Donation 7% Other 17% Compensation, Benefits & Director Fees 51% IT Efficiencies 19% Professional & Advisory Contracts 11% Other 10% Transaction - Related 7% Marketing / Advertising 2% Expect $10 million of pre - tax cost savings (25 % of ENFC’s annual projected n oninterest expense)¹ Reasonable Expected Cost Savings and Transaction Costs (1) Assumes 50% of annual cost savings are realized in 2019 and 100% realized thereafter Source: Company Documents Reasonable Transaction Expenses Achievable Cost Savings ~$15 million of pre - tax transaction - related costs

15 Demand 16% Transaction 17% MMDA & Savings 33% Retail CD 26% Jumbo CD 8% Demand 17% Transaction 16% MMDA & Savings 33% Retail CD 26% Jumbo CD 8% Demand 15% Transaction 17% MMDA & Savings 34% Retail CD 24% Jumbo CD 10% ADC 7% 1 - 4 27% Owner CRE 21% Other CRE 22% C&I 16% Other 7% ADC 11% 1 - 4 38% Owner CRE 22% Other CRE 20% C&I 3% Other 6% ADC 9% 1 - 4 31% Owner CRE 21% Other CRE 21% C&I 11% Other 7% Pro Forma Loan and Deposit Composition Note: Consolidated loan and deposit data for the quarter ended December 31, 2018 (1) Includes the effect of purchase accounting adjustments Source: Company documents ENFC SMBK Combined Average Loan Yield: 5.81%¹ Average Cost of Deposits: 1.00% Average Loan Yield: 4.85% Average Cost of Deposits: 0.83% Average Loan Yield: 5.44% Average Cost of Deposits: 0.94%

Appendix
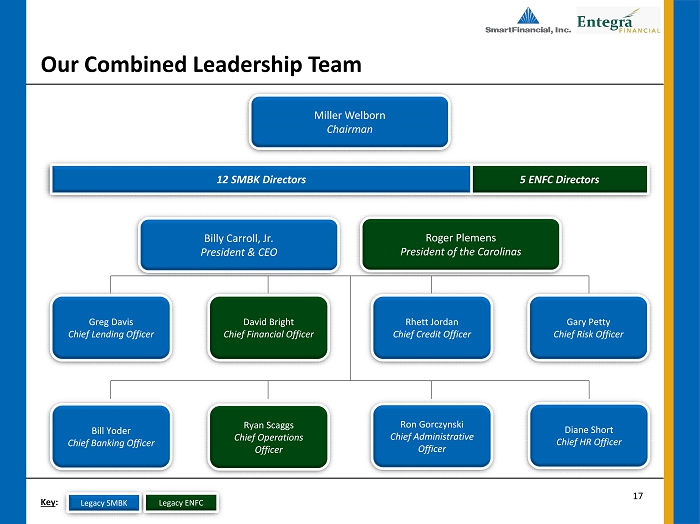
17 Our Combined Leadership Team 5 ENFC Directors David Bright Chief Financial Officer Billy Carroll, Jr . President & CEO Greg Davis Chief Lending Officer Bill Yoder Chief Banking Officer Ryan Scaggs Chief Operations Officer Gary Petty Chief Risk Officer Rhett Jordan Chief Credit Officer Ron Gorczynski Chief Administrative Officer Diane Short Chief HR Officer 12 SMBK Directors Miller Welborn Chairman Roger Plemens President of the Carolinas Legacy SMBK Legacy ENFC Key :
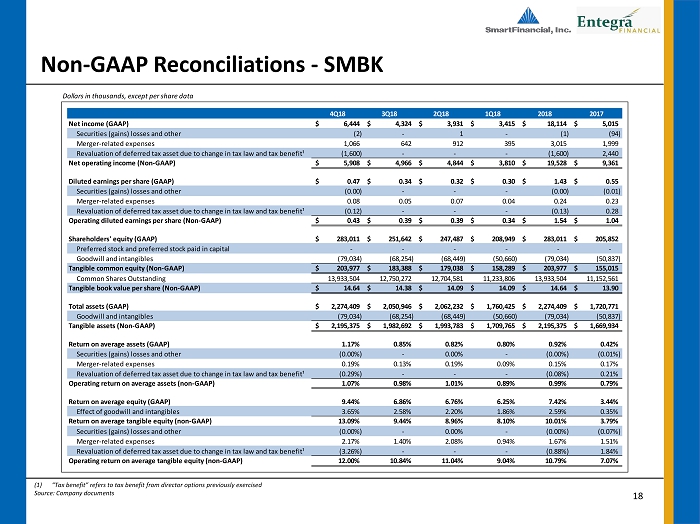
18 Non - GAAP Reconciliations - SMBK (1) “Tax benefit” refers to tax benefit from director options previously exercised Source : Company documents Dollars in thousands, except per share data 4Q18 3Q18 2Q18 1Q18 2018 2017 Net income (GAAP) 6,444$ 4,324$ 3,931$ 3,415$ 18,114$ 5,015$ Securities (gains) losses and other (2) - 1 - (1) (94) Merger-related expenses 1,066 642 912 395 3,015 1,999 Revaluation of deferred tax asset due to change in tax law and tax benefit¹ (1,600) - - - (1,600) 2,440 Net operating income (Non-GAAP) 5,908$ 4,966$ 4,844$ 3,810$ 19,528$ 9,361$ Diluted earnings per share (GAAP) 0.47$ 0.34$ 0.32$ 0.30$ 1.43$ 0.55$ Securities (gains) losses and other (0.00) - - - (0.00) (0.01) Merger-related expenses 0.08 0.05 0.07 0.04 0.24 0.23 Revaluation of deferred tax asset due to change in tax law and tax benefit¹ (0.12) - - - (0.13) 0.28 Operating diluted earnings per share (Non-GAAP) 0.43$ 0.39$ 0.39$ 0.34$ 1.54$ 1.04$ Shareholders' equity (GAAP) 283,011$ 251,642$ 247,487$ 208,949$ 283,011$ 205,852$ Preferred stock and preferred stock paid in capital - - - - - - Goodwill and intangibles (79,034) (68,254) (68,449) (50,660) (79,034) (50,837) Tangible common equity (Non-GAAP) 203,977$ 183,388$ 179,038$ 158,289$ 203,977$ 155,015$ Common Shares Outstanding 13,933,504 12,750,272 12,704,581 11,233,806 13,933,504 11,152,561 Tangible book value per share (Non-GAAP) 14.64$ 14.38$ 14.09$ 14.09$ 14.64$ 13.90$ Total assets (GAAP) 2,274,409$ 2,050,946$ 2,062,232$ 1,760,425$ 2,274,409$ 1,720,771$ Goodwill and intangibles (79,034) (68,254) (68,449) (50,660) (79,034) (50,837) Tangible assets (Non-GAAP) 2,195,375$ 1,982,692$ 1,993,783$ 1,709,765$ 2,195,375$ 1,669,934$ Return on average assets (GAAP) 1.17% 0.85% 0.82% 0.80% 0.92% 0.42% Securities (gains) losses and other (0.00%) - 0.00% - (0.00%) (0.01%) Merger-related expenses 0.19% 0.13% 0.19% 0.09% 0.15% 0.17% Revaluation of deferred tax asset due to change in tax law and tax benefit¹ (0.29%) - - - (0.08%) 0.21% Operating return on average assets (non-GAAP) 1.07% 0.98% 1.01% 0.89% 0.99% 0.79% Return on average equity (GAAP) 9.44% 6.86% 6.76% 6.25% 7.42% 3.44% Effect of goodwill and intangibles 3.65% 2.58% 2.20% 1.86% 2.59% 0.35% Return on average tangible equity (non-GAAP) 13.09% 9.44% 8.96% 8.10% 10.01% 3.79% Securities (gains) losses and other (0.00%) - 0.00% - (0.00%) (0.07%) Merger-related expenses 2.17% 1.40% 2.08% 0.94% 1.67% 1.51% Revaluation of deferred tax asset due to change in tax law and tax benefit¹ (3.26%) - - - (0.88%) 1.84% Operating return on average tangible equity (non-GAAP) 12.00% 10.84% 11.04% 9.04% 10.79% 7.07%

19 Non - GAAP Reconciliations - ENFC Source : Company documents Dollars in thousands, except per share data 4Q18 3Q18 2Q18 1Q18 2018 2017 Net income (GAAP) 3,723$ 3,523$ 3,087$ 3,582$ 13,915$ 2,579$ Securities (gains) losses and other 434 - 402 9 701 1,208 Merger-related expenses - 76 215 - 446 2,006 Revaluation of deferred tax asset due to tax rate change - - - 155 - 4,854 Net operating income (Non-GAAP) 4,157$ 3,599$ 3,704$ 3,746$ 15,062$ 10,647$ Diluted earnings per share (GAAP) 0.54$ 0.50$ 0.44$ 0.51$ 1.99$ 0.39$ Securities (gains) losses and other 0.06 - 0.06 - 0.10 0.18 Merger-related expenses - 0.01 0.03 0.02 0.06 0.30 Revaluation of deferred tax asset due to tax rate change - - - - - 0.73 Operating diluted earnings per share (Non-GAAP) 0.60$ 0.51$ 0.53$ 0.53$ 2.15$ 1.60$ Shareholders' equity (GAAP) 162,872$ 156,730$ 154,786$ 151,876$ 162,872$ 151,313$ Preferred stock and preferred stock paid in capital - - - - - - Goodwill and intangibles (27,480) (27,653) (27,826) (27,999) (27,480) (28,172) Tangible common equity (Non-GAAP) 135,392$ 129,077$ 126,960$ 123,877$ 135,392$ 123,141$ Common Shares Outstanding 6,917,703 6,891,672 6,891,672 6,888,415 6,917,703 6,879,191 Tangible book value per share (Non-GAAP) 19.57$ 18.73$ 18.42$ 17.98$ 19.57$ 17.90$ Total assets (GAAP) 1,636,441$ 1,669,566$ 1,628,294$ 1,625,444$ 1,636,441$ 1,581,449$ Goodwill and intangibles (27,480) (27,653) (27,826) (27,999) (27,480) (28,172) Tangible assets (Non-GAAP) 1,608,961$ 1,641,913$ 1,600,468$ 1,597,445$ 1,608,961$ 1,553,277$ Return on average assets (GAAP) 0.91% 0.86% 0.76% 0.90% 0.86% 0.18% Securities (gains) losses and other 0.10% - 0.10% - 0.04% 0.08% Merger-related expenses - 0.02% 0.06% 0.04% 0.03% 0.14% Revaluation of deferred tax asset due to tax rate change - - - - - 0.35% Operating return on average assets (non-GAAP) 1.01% 0.88% 0.92% 0.94% 0.93% 0.75% Return on average equity (GAAP) 9.40% 9.00% 8.04% 9.48% 8.98% 1.82% Effect of goodwill and intangibles 2.21% 1.99% 2.15% 2.26% 0.59% 0.68% Return on average tangible equity (non-GAAP) 11.61% 10.99% 10.19% 11.74% 9.57% 2.50% Securities (gains) losses and other 1.10% - 1.05% 0.03% 1.99% 0.85% Merger-related expenses - 0.19% 0.56% 0.41% 0.29% 1.41% Revaluation of deferred tax asset due to tax rate change - - - - - 3.42% Operating return on average tangible equity (non-GAAP) 12.71% 11.18% 11.80% 12.18% 11.85% 8.18%

20 Investor Contacts Miller Welborn Chairman Miller.Welborn@SmartBank.com Billy Carroll President and CEO Billy.Carroll@SmartBank.com Phone: (865) 437 - 5700 Roger Plemens President and CEO RPlemens@EntegraBank.com David Bright Chief Financial Officer and Treasurer DBright@EntegraBank.com Phone: (828) 524 - 7000
