TLYS 2022 ICR Conference Presentation TLYS 2022 ICR Conference Presentation

This presentation, and responses to certain questions about this presentation, will contain forward-looking statements within the meaning of the Private Securities Litigation Reform Act of 1995, particularly with regard to future financial and operating expectations, business plans and key initiatives. All such statements are subject to risks and uncertainties that could cause actual results or events to differ materially from those indicated by such forward- looking statements. Please see “Risk Factors” in our Annual and Quarterly Reports on Forms 10-K and 10-Q filed with the Securities and Exchange Commission for a description of such risks and uncertainties. We urge you not to place undue reliance on these forward-looking statements, which speak only as of the date of this presentation. We do not undertake any obligation to update or alter any forward-looking statements, whether as a result of new information, future events or otherwise. This presentation should be read in conjunction with our financial statements and notes thereto contained in our most recent Form 10-K for the fiscal year ended January 30, 2021 and our Form 10-Qs for the fiscal quarters ended May 1, July 31, and October 30, 2021. Safe Harbor Statement

• L e a d i n g s p e c i a l ty r e ta i l e r o f a p p a r e l , f o o t w e a r , a c c e s s o r i e s a n d h a r d g o o d s f o r y o u n g a d u l t s , t e e n s a n d c h i l d r e n • U n p a r a l l e l e d b l e n d o f i c o n i c g l o b a l , e me r g i n g , a n d p r o p r i e ta r y b r a n d s • 2 4 1 s to r e s i n 3 3 s t a t e s a t F Y 2 1 e n d ( ~ 5 7 % ma l l v s . ~ 4 3 % o f f -ma l l , 7 , 3 0 0 a v e r a g e s q u a r e f e e t ) • P r o f i ta b l e , g r o w i n g e - c o mme r c e b u s i n e s s ~ 2 1 % o f F Y 2 1 n e t s a l e s 3 2 % o f F Y 2 0 n e t s a l e s ( p a n d e m i c i m p a c t ) 1 6 % o f F Y 1 9 n e t s a l e s • H Q i n I r v i n e , CA, f o u n d e d i n 1 9 8 2 , I P O i n Ma y 2 0 1 2 Tillys at a Glance

Reasons to Consider Investing in TLYS • Strong track record of improving results over time • Digital-first approach to merchandising driving greater consumer interest overall • Ample opportunities for new store unit growth with flexibility in real estate formats • Growing, profitable e-com business • Consistent direct returns to shareholders • Continuous reinvestment in the business

TLYS Fiscal 2021 Overview • Successfully managed through the pandemic to enter FY21 with more cash/investments than entering FY20. • 6th special cash dividend paid in December 2021 • 5-year aggregate of $5.70/share, or $170M, paid to shareholders. • Store sales/SF of $331 on trailing 12-month basis thru November 2021 (best since 2012) • Forecasted FY21 GM % of ~35.9% (best since 2007) • Forecasted FY21 Operating Margin of ~11.4% (best since 2007) • Forecasted FY21 EPS of $2.07-$2.10 (all-time record)

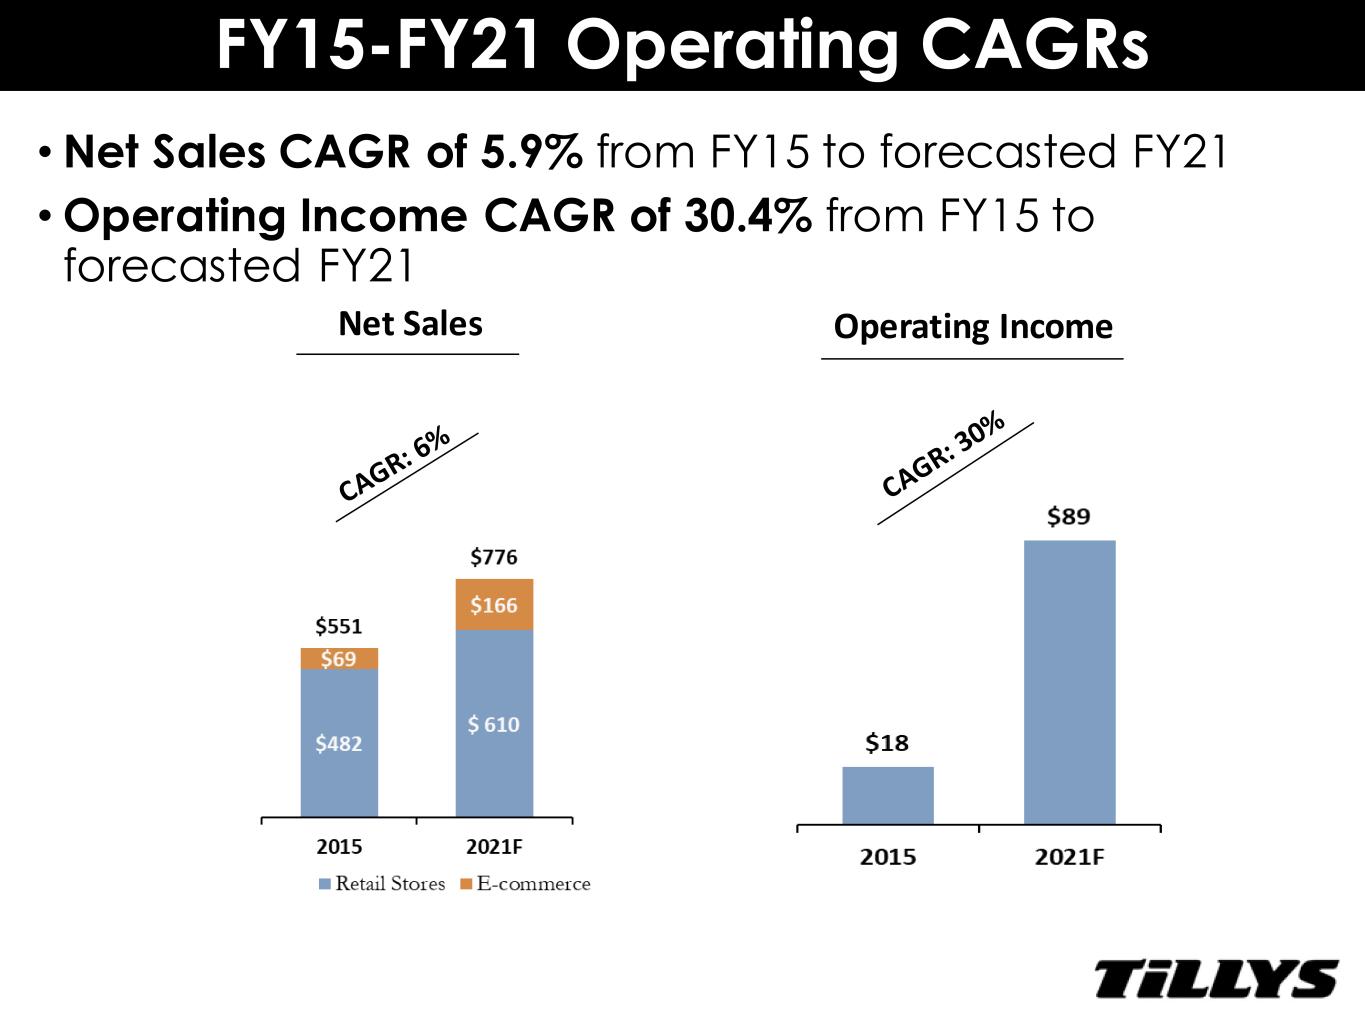
FY15-FY21 Operating CAGRs • Net Sales CAGR of 5.9% from FY15 to forecasted FY21 • Operating Income CAGR of 30.4% from FY15 to forecasted FY21 Net Sales Operating Income

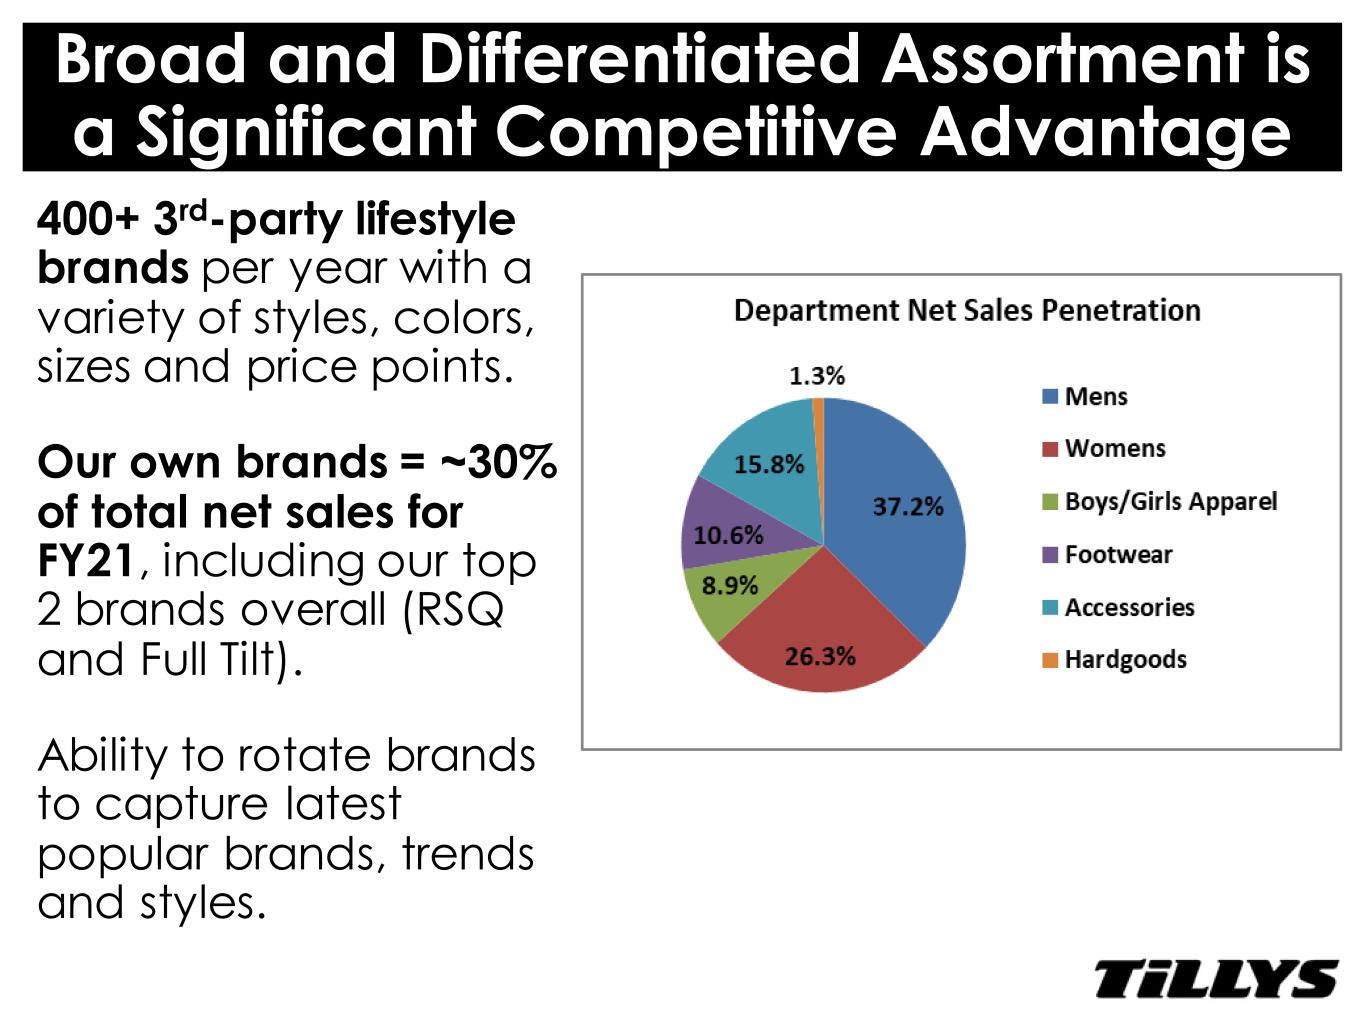
Broad and Differentiated Assortment is a Significant Competitive Advantage 400+ 3rd-party lifestyle brands per year with a variety of styles, colors, sizes and price points. Our own brands = ~30% of total net sales for FY21, including our top 2 brands overall (RSQ and Full Tilt). Ability to rotate brands to capture latest popular brands, trends and styles.

Lifestyle Photography

Digital First Approach • We are driving sales growth both in stores and online through our digital first mindset and with full omni-channel capabilities. • BOPIS, ship from store, curbside pickup, same-day delivery • Our youthful customer base constantly searches online via social media, mobile apps and websites for the latest trends/brands. • The first place you see newness from TLYS is online • Social media posts, email blasts, influencers, website content • Growing loyalty program • Early access to new product launches and special promotions for loyalty members

TLYS Store Growth Opportunities • Based on certain U.S. store counts of competitor concepts, we continue to believe there are ample opportunities for additional store unit growth for TLYS. • 15-20 new stores planned for FY2022, both mall and off- mall, within existing markets. • We believe we can continue adding 10-20 stores per year with desirable locations and economics.

Tillys Store Formats

TLYS E-Commerce Growth • E-com net sales grew by $75M and more than doubled in total sales penetration during the FY20 pandemic year. • Forecasted FY21 e-com sales are slightly below FY20 due to the resurgence of stores, but well above pre-pandemic FY19. • We expect e-com to continue to grow on an annual basis. • Improved profitability and expense leverage at these levels.

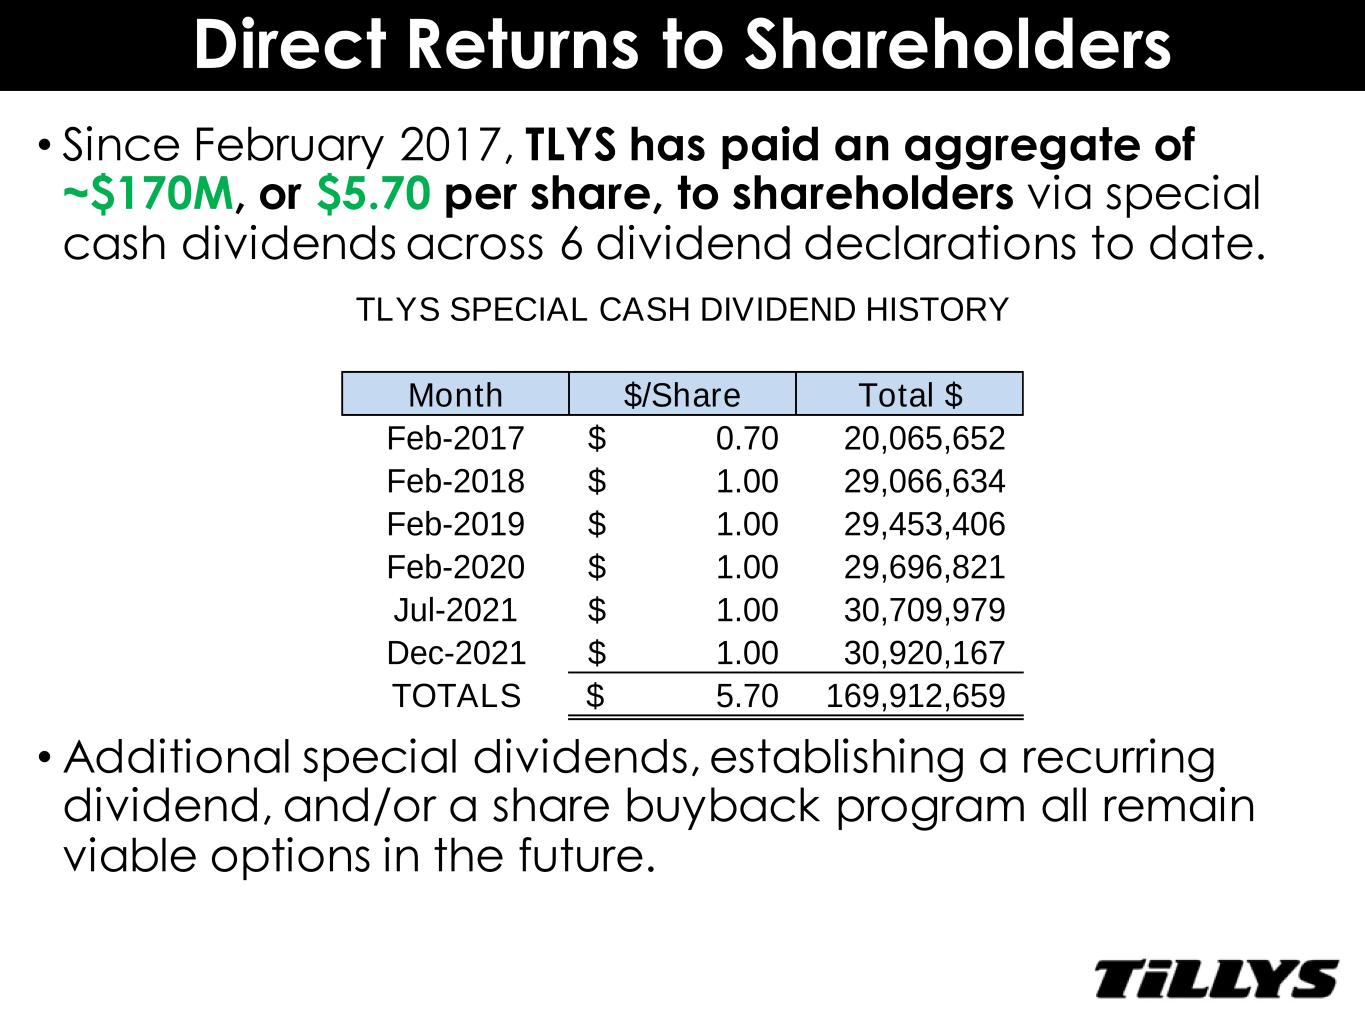
Direct Returns to Shareholders • Since February 2017, TLYS has paid an aggregate of ~$170M, or $5.70 per share, to shareholders via special cash dividends across 6 dividend declarations to date. • Additional special dividends, establishing a recurring dividend, and/or a share buyback program all remain viable options in the future. Month $/Share Total $ Feb-2017 0.70$ 20,065,652 Feb-2018 1.00$ 29,066,634 Feb-2019 1.00$ 29,453,406 Feb-2020 1.00$ 29,696,821 Jul-2021 1.00$ 30,709,979 Dec-2021 1.00$ 30,920,167 TOTALS 5.70$ 169,912,659 TLYS SPECIAL CASH DIVIDEND HISTORY

TLYS Ongoing Business Investments • Beyond new store growth opportunities, TLYS continues to reinvest in its business to improve customer convenience and position itself for further growth. • Upgrading website platform • Upgrading mobile app • Establishing print-on-demand offerings and vendor drop-ship capabilities • Enhancing product information features on website • Improving distribution efficiencies • FY22 capital expenditures of $25M - $30M.

Thank You!


