UNITED STATES
SECURITIES AND EXCHANGE COMMISSION
Washington, D.C. 20549
FORM N-CSR
CERTIFIED SHAREHOLDER REPORT OF REGISTERED MANAGEMENT INVESTMENT COMPANIES
Investment Company Act file number 811-22575
J.P. Morgan Access Multi-Strategy Fund II
(Exact name of registrant as specified in charter)
383 Madison Avenue
New York, NY 10179
(Address of principal executive offices) (Zip code)
Abby L. Ingber, Esq
J.P. Morgan Private Investments Inc.
4 New York Plaza
New York, NY 10004
(Name and address of agent for service)
Copy to:
Stephen Cohen, Esq.
Dechert LLP
1900 K Street, NW
Washington, DC 20006
Registrant’s telephone number, including area code: (800) 480-4111
Date of fiscal year end: March 31
Date of reporting period: September 30, 2024
Form N-CSR is to be used by management investment companies to file reports with the Commission not later than 10 days after the transmission to stockholders of any report that is required to be transmitted to stockholders under Rule 30e-1 under the Investment Company Act of 1940 (17 CFR 270.30e-1). The Commission may use the information provided on Form N-CSR in its regulatory, disclosure review, inspection, and policymaking roles.
A registrant is required to disclose the information specified by Form N-CSR, and the Commission will make this information public. A registrant is not required to respond to the collection of information contained in Form N-CSR unless the Form displays a currently valid Office of Management and Budget (“OMB”) control number. Please direct comments concerning the accuracy of the information collection burden estimate and any suggestions for reducing the burden to Secretary, Securities and Exchange Commission, 450 Fifth Street, NW, Washington, DC 20549-0609. The OMB has reviewed this collection of information under the clearance requirements of 44 U.S.C. § 3507.
Item 1. Reports to Stockholders.
| | (a) | Include a copy of the report transmitted to stockholders pursuant to Rule 30e-1 under the Act (17 CFR 270.30e-1). |
The Report to Shareholders is attached herewith.
J.P. Morgan Access Multi-Strategy Fund II
Financial Statements
For the six months ended September 30, 2024
(Unaudited)
This report is open and authorized for distribution only to qualified and accredited investors or financial intermediaries who have received a copy of the Fund’s Private Placement Memorandum. This document, although required to be filed with the Securities and Exchange Commission (“SEC”), may not be copied, faxed or otherwise distributed to the general public.
J.P. Morgan Access Multi-Strategy Fund II
Financial Statements
For the six months ended September 30, 2024
(Unaudited)
Contents
Past performance is no guarantee of future results. Market volatility can significantly impact short-term performance. Results of an investment made today may differ substantially from the Fund’s historical performance. Investment return and principal value will fluctuate so that an investor’s interests, when redeemed, may be worth more or less than original cost.
J.P. Morgan Access Multi-Strategy Fund II
Market Overview (Unaudited)
As of September 30, 2024
The economy remained resilient throughout the period from April 1, 2024 to September 30, 2024 (the “Reporting Period”), and the U.S. has so far avoided a recession. The MSCI USA Index, the MSCI World ex-USA Index and the MSCI Emerging Markets gained 10.5%, 7.9%, and 14.3%, respectively, during the Reporting Period.
We do not believe equity valuations are discounted at the broad index level. Bond yields have declined from cycle highs but remain elevated compared to pre-COVID levels. The Bloomberg U.S. 1-3 Month Treasury Bills Index returned 2.7%, the Bloomberg Global-Aggregate Total Return Hedged USD Index returned 4.8%, and the MSCI World Index returned 9.6% during the Reporting Period.
In order to curb high inflation, the Federal Open Market Committee of the U.S. Federal Reserve (the “Fed”) increased interest rates by 5.25-5.50% since the start of 2022. As inflation decelerated back towards the Fed’s 2% annual target, the Fed has cut interest rates to 4.75-5.00%. Despite the gradual economic slowdown, earnings have remained resilient, and we believe positive earnings growth may continue into 2025.
1
J.P. Morgan Access Multi-Strategy Fund II
Fund Commentary (Unaudited)
Period of April 1, 2024 through September 30, 2024
| | | | |
| Reporting Period Return | | | |
| |
J.P. Morgan Access Multi-Strategy Fund II | | | 1.85% | * |
Hedge Fund Research, Inc. (HFRI) Fund of Funds Diversified Index | | | 2.06% | |
| |
Net Assets as of 9/30/2024 (In Thousands) | | $ | 66,822 | |
INVESTMENT OBJECTIVES AND STRATEGY **
J.P. Morgan Access Multi-Strategy Fund II (the “Fund”) is an actively managed registered “fund of hedge funds” with a target portfolio of 20-25 single strategy and diversified hedge funds. The Fund seeks to fully complement an existing traditional stock and bond portfolio with a focus on generating consistent capital appreciation over the long-term, with relatively low volatility and a low correlation with traditional equity and fixed income markets.
INVESTMENT APPROACH
J.P. Morgan Private Investments Inc., the Fund’s investment adviser (“JPMPI” or the “Adviser”), actively allocates the Fund’s assets primarily among professionally selected investment funds (commonly referred to as hedge funds) (“Investment Funds”) that are managed by experienced third-party investment advisers (“Portfolio Managers”) who invest in a variety of markets and employ, as a group, a range of investment techniques and strategies. Investment Funds generally pursue “absolute return” in that they seek to achieve positive returns, by, for example, taking long and short positions and by engaging in various hedging strategies, regardless of the performance of the traditional equity and fixed income markets. There can be no assurance that the Fund will achieve its investment objective.
WHAT WERE THE MAIN DRIVERS OF THE FUND’S PERFORMANCE?
During the Reporting Period, the Fund posted a 1.85% return, net of fees, on an absolute basis, and underperformed relative to the HFRI Fund of Funds Diversified Index (the “Index”). References to the Index are for informational purposes. The use of the Index does not imply the Fund is being managed to the Index, but rather is disclosed to allow for comparison of the Fund’s performance to that of a well-known and widely-recognized index.
Opportunistic/Macro and Relative Value strategies comprised approximately 61% of the Fund’s strategy exposure at the end of the Reporting Period which was overweight relative to the broader hedge fund industry, as measured by the Hedge Fund Research (“HFR”) Industry Report. During the Reporting Period, Opportunistic/Macro and Relative Value strategies contributed positively to the Fund’s performance on an absolute basis, with Opportunistic/Macro being the primary driver of relative performance. Opportunistic/Macro generated returns from Discretionary Macro exposures, which benefited from long exposures to US short-term interest rates and medium-term equity arbitrage. Relative Value exposures to Securitized Fixed Income, Convertible Arbitrage, and Multi-Strategy exposures profited from elevated credit yields, fixed-income arbitrage spreads, and medium-term alpha signals.
* The return shown is based on the net assets calculated for shareholder transactions. Certain adjustments were made in accordance with United States generally accepted accounting principles to the net assets of the Fund at September 30, 2024 for financial reporting purposes, and as a result, the net assets for shareholder transactions and the total return based on that net assets may differ from the adjusted net assets and the total return for financial reporting.
** The Adviser seeks to achieve the Fund’s objective. There can be no guarantee it will be achieved.
2
J.P. Morgan Access Multi-Strategy Fund II
Fund Commentary (Unaudited) (continued)
The Long/Short Equities and Event Driven strategies comprised approximately 36% of the Fund’s exposure at the end of the Reporting Period which was underweight relative to the broader hedge fund industry. During the Reporting Period, Long/Short Equities and Event Driven strategies contributed to the Fund’s performance on an absolute basis but underperformed on a relative basis. Long/Short Equities experienced broad-based gains across most developed market regions and equity sectors, which helped offset losses from a bio-tech equity specialist and a diversified Emerging Market manager. Within the Event Driven strategy, gains attributed to a rally in equities and credit was offset by losses from one manager, who has been liquidating less liquid special situations holdings.
HOW WAS THE FUND POSITIONED?
As of the end of the Reporting Period, the Fund was allocated to four main hedge fund strategies, Long/Short Equities, Opportunistic/Macro, Relative Value and Event Driven with exposures to 29 managers that encompass multiple sub-strategies.
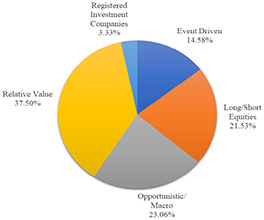
The percentages on this graph are based on Total Investments. The percentages on the Schedule of Investments differ as they are based on the net assets.
Management agreements of the general partners/managers of the investment funds (excluding registered investment companies) provide for compensation to such general partners/managers in the form of management fees ranging from 0.50% to 3% annually of net assets and performance fees of 10% to 35% of net profits earned.
In the last few months of the Fund’s Reporting Period, three new managers were added to Event Driven strategies to help reduce the strategy’s underweight, balance individual manager risk exposures, and reintroduce allocations to merger arbitrage and activism. In addition to increased allocations to Event Driven strategies, the Fund decreased weights to Opportunistic/Macro strategies to maintain an estimated tracking error in line with recent history versus the Index, and temporarily decreased Relative Value to rotate into new managers within the strategy over the next few months. At the end of the third calendar quarter of 2024, the Fund’s 3 year estimated tracking error was 1.7% and its betas to global equities and credit were below the Fund’s historical averages but relatively consistent with estimates for the Fund’s Index at 0.10 and 0.15, respectively.
AVERAGE ANNUAL TOTAL RETURNS AS OF SEPTEMBER 30, 2024
| | | | | | | | | | | | |
| | | Inception Date of
Fund | | 1 Year | | 5 Year | | 10 Year | | Since
Inception | | |
J.P. Morgan Access Multi-Strategy Fund II | | June 16, 2011 | | 8.18% | | 4.37% | | 2.23% | | 3.29% |
3
J.P. Morgan Access Multi-Strategy Fund II
Fund Commentary (Unaudited) (continued)
The allocation of the various strategies employed by the Fund may change and therefore, the performance shown may not be a true indication of how the Fund may perform going forward. Performance quoted is past performance and is no guarantee of future results. Investment returns and principal value will fluctuate, so shares, when sold, may be worth more or less than original cost. Current performance may be higher or lower than returns shown. As of the latest Confidential Private Placement Memorandum, dated July 26, 2024, the gross and net expense ratios for the Fund were 10.65% and 10.64% for the fiscal year ended March 31, 2024, respectively. Contact your J.P. Morgan representative or call 1-212-464-2070 for the most recent month-end performance.
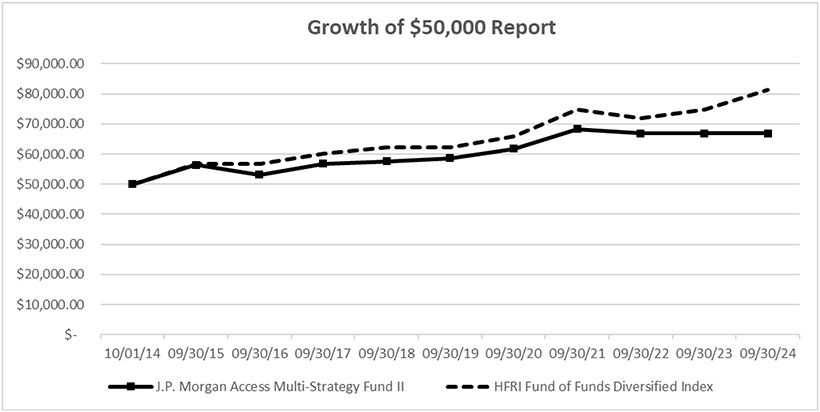
The graph illustrates comparative performance for $50,000 invested in the J.P. Morgan Access Multi-strategy Fund II and the Hedge Fund Research, Inc. Funds of Funds Diversified Index from October 1, 2014 to September 30, 2024.
The performance of the Fund reflects the deduction of Fund expenses and assumes reinvestment of all dividends and capital gain distributions, if any. The performance of the HFRI Funds of Funds Diversified Index is provided for illustrative purposes only. The securities comprising the Index may have substantially different characteristics than investments held by the Fund and the Index does not represent the strategy of the Fund. Comparisons to the Index have limitations because the Index has volatility, asset composition and other material characteristics that may differ from the Fund. Although the performance of the Index reflects the returns of constituent hedge funds, net of expenses, the Index itself is unmanaged and no expenses are deducted at the Index level. The performance of the Index has been adjusted to reflect reinvestment of all dividends and capital gain distributions of the securities included in the Index, if applicable. Index performance information is as of September 30, 2024 unless otherwise indicated. Index returns may be estimates and subject to change without notice. The HFRI Funds of Funds Diversified Index may reflect estimated returns for up to four months. Because of these estimates, the performance of the Index should not be relied upon as an accurate measure of comparison and should not be relied upon in making an investment decision with respect to the Fund.
4
J.P. Morgan Access Multi-Strategy Fund II
Fund Commentary (Unaudited) (continued)
HFRI Funds of Funds Diversified Index is a widely used hedge fund benchmark. Fund of Funds classified as ‘Diversified’ within the Index exhibit one or more of the following characteristics: invests in a variety of strategies among multiple managers; historical annual return and/or a standard deviation generally similar to the HFRI Fund of Fund Composite Index; demonstrates generally close performance and returns distribution correlation to the HFRI Fund of Fund Composite Index. A fund in the HFRI Fund of Funds Diversified Index tends to show minimal loss in down markets while achieving superior returns in up markets. The Index definition can be found at www.hedgefundresearch.com.
Fund performance may reflect the waiver of the Fund’s fees and/or reimbursement of expenses for certain periods since the inception date. Without these waivers and reimbursements, performance would have been lower. Also, performance shown in this section does not reflect the deduction of taxes that a shareholder may pay on Fund distributions, redemptions or sales of Fund shares.
5
J.P. Morgan Access Multi-Strategy Fund II
Schedule of Investments
September 30, 2024
(Unaudited)
| | | | | | | | | | | | | | | | |
Investment Funds (a) | | Cost ($) | | | Value ($) | | | % of Net Assets | | Liquidity (b) | |
Event Driven | | | | | | | | | | | | | | | | |
Antara Capital Offshore Fund, Ltd. (c) | | | 1,566,230 | | | | 821,712 | | | | 1.23 | | | | Side Pocket* | |
HG Vora Special Opportunities Fund, Ltd. (c) | | | 1,809,062 | | | | 1,966,625 | | | | 2.94 | | | | Quarterly | |
KL Special Opportunities Fund Ltd (c) | | | 670,000 | | | | 670,376 | | | | 1.00 | | | | Quarterly | |
Sculptor Overseas Fund II, Ltd. (c) | | | 2,043,239 | | | | 2,364,039 | | | | 3.54 | | | | Quarterly | |
Silver Point Capital Offshore Fund, Ltd. (c) | | | 670,000 | | | | 691,530 | | | | 1.03 | | | | Annual | |
Starboard Value & Opportunity Fund Ltd (c) | | | 670,000 | | | | 700,072 | | | | 1.05 | | | | Quarterly | |
Third Point Offshore Fund, Ltd. (c) | | | 966,275 | | | | 1,407,825 | | | | 2.11 | | | | Quarterly | |
Varde Credit Partners (Offshore), Ltd. (c) | | | 643,847 | | | | 789,362 | | | | 1.18 | | | | Quarterly | |
| | | | | | | | | | | | | | | | |
Total | | | 9,038,653 | | | | 9,411,541 | | | | 14.08 | | | | | |
| | | | | | | | | | | | | | | | |
| | | | |
Long/Short Equities | | | | | | | | | | | | | | | | |
BlackRock Emerging Frontiers Fund, Ltd. (c) | | | 1,485,095 | | | | 1,957,654 | | | | 2.93 | | | | Monthly | |
Coatue Offshore Fund, Ltd. (c) | | | 1,174,371 | | | | 2,022,240 | | | | 3.03 | | | | Quarterly | |
Echo Street Capital SPV 4, LLC | | | 18,834 | | | | 18,902 | | | | 0.03 | | | | Side Pocket* | |
Lakewood Capital Offshore Fund, Ltd. (c) | | | 1,680,635 | | | | 2,267,267 | | | | 3.39 | | | | Quarterly | |
Naya Fund (c) | | | 1,337,122 | | | | 1,659,104 | | | | 2.48 | | | | Quarterly | |
North Rock Fund, Ltd (c) | | | 1,276,206 | | | | 1,454,131 | | | | 2.18 | | | | Monthly | |
Redmile Capital Offshore Fund, Ltd. (c) | | | 97,495 | | | | 59,615 | | | | 0.09 | | | | Quarterly | |
RTW Offshore Fund One, Ltd. (c) | | | 1,400,000 | | | | 1,052,596 | | | | 1.58 | | | | Quarterly | |
Viking Global Equities III Ltd. (c) | | | 3,000,000 | | | | 3,395,399 | | | | 5.08 | | | | Annual | |
| | | | | | | | | | | | | | | | |
Total | | | 11,469,758 | | | | 13,886,908 | | | | 20.79 | | | | | |
| | | | | | | | | | | | | | | | |
| | | | |
Opportunistic/Macro | | | | | | | | | | | | | | | | |
BH-DG Systematic Trading Fund Ltd (c) | | | 700,000 | | | | 670,564 | | | | 1.00 | | | | Daily | |
Brevan Howard Alpha Strategies Fund Ltd (c) | | | 1,200,000 | | | | 1,240,969 | | | | 1.86 | | | | Monthly | |
Brevan Howard Fund Ltd (c) | | | 1,291,664 | | | | 1,809,526 | | | | 2.71 | | | | Monthly | |
D.E. Shaw Oculus International Fund | | | 2,994,506 | | | | 7,679,820 | | | | 11.49 | | | | Quarterly | |
GreshamQuant - ACAR Fund, Ltd. (c) | | | 1,750,000 | | | | 1,587,749 | | | | 2.38 | | | | Quarterly | |
Kirkoswald Global Macro Fund Ltd (c) | | | 1,563,750 | | | | 1,886,742 | | | | 2.82 | | | | Quarterly | |
| | | | | | | | | | | | | | | | |
Total | | | 9,499,920 | | | | 14,875,370 | | | | 22.26 | | | | | |
| | | | | | | | | | | | | | | | |
| | | | |
Relative Value | | | | | | | | | | | | | | | | |
Bright Meadow Agency MBS Offshore Fund, Ltd. (c) | | | 1,108,381 | | | | 1,361,851 | | | | 2.04 | | | | Monthly | |
D.E. Shaw Composite International Fund | | | 3,685,229 | | | | 10,404,354 | | | | 15.57 | | | | Quarterly | |
King Street Capital, Ltd. (c) | | | 35,248 | | | | 47,985 | | | | 0.07 | | | | Side Pocket* | |
Linden International Ltd (c) | | | 1,450,000 | | | | 1,672,431 | | | | 2.50 | | | | Quarterly | |
Mariner Atlantic Multi-Strategy Fund, Ltd. (c) | | | 1,183,784 | | | | 1,365,461 | | | | 2.04 | | | | Quarterly | |
SPF Securitized Products Fund Ltd. (c) | | | 1,464,522 | | | | 1,961,573 | | | | 2.94 | | | | Quarterly | |
Two Sigma Spectrum Cayman Fund, Ltd. (c) | | | 3,608,549 | | | | 5,888,142 | | | | 8.81 | | | | Quarterly | |
Verition International Multi-Strategy Fund Ltd. (c) | | | 1,450,000 | | | | 1,489,997 | | | | 2.23 | | | | Quarterly | |
| | | | | | | | | | | | | | | | |
Total | | | 13,985,713 | | | | 24,191,794 | | | | 36.20 | | | | | |
| | | | | | | | | | | | | | | | |
Total Investments in Investment Funds | | | 43,994,044 | | | | 62,365,613 | | | | 93.33 | | | | | |
| | | | | | | | | | | | | | | | |
The accompanying notes are an integral part of these financial statements.
6
J.P. Morgan Access Multi-Strategy Fund II
Schedule of Investments (continued)
September 30, 2024
(Unaudited)
| | | | | | | | | | | | | | | | |
Registered Investment Companies | | Cost ($) | | | Value ($) | | | % of Net Assets | | Liquidity | |
| | | | | | | | | | | | |
Fidelity 500 Index Fund (8,702 shares) | | | 1,470,224 | | | | 1,746,800 | | | | 2.61 | | | | Daily | |
iShares Russell 1000 Growth ETF (10 shares) | | | 3,301 | | | | 3,754 | | | | 0.01 | | | | Daily | |
| JPMorgan U.S. Government Money Market Fund, Institutional Class Shares, 4.78% (d),(e) | | | 395,306 | | | | 395,306 | | | | 0.59 | | | | Daily | |
| | | | | | | | | | | | | | | | |
| Total Investments in Registered Investment Companies | | | 1,868,831 | | | | 2,145,860 | | | | 3.21 | | | | | |
| | | | | | | | | | | | | | | | |
| | | | |
Total Investments | | | 45,862,875 | | | | 64,511,473 | | | | 96.54 | | | | | |
| | | | |
Other Assets, less Liabilities | | | | | | | 2,310,945 | | | | 3.46 | | | | | |
| | | | | | | | | | | | | | | | |
| | | | |
Net Assets | | | | | | | 66,822,418 | | | | 100.00 | | | | | |
| | | | | | | | | | | | | | | | |
| | (a) | Non-income producing investments. |
| | (b) | Certain funds (except registered investment companies) may be subject to an initial lock-up period, as described in Note 2 of the financial statements. |
| | (c) | Partially or wholly held in a pledged account by the Custodian as collateral for existing line of credit. The aggregate value of collateral pledged for the line of credit was $44,262,537 as of September 30, 2024. |
| | (d) | Investment in affiliate. As of September 30, 2024, the Fund held 395,306 shares in the JPMorgan U.S. Government Money Market Fund, which is registered under the Investment Company Act of 1940, as amended, and advised by J.P. Morgan Investment Management Inc. (“JPMIM”). The Adviser has contractually agreed to waive fees and/or reimburse expenses in an amount sufficient to offset the respective net fees JPMIM collects from the affiliated money market funds on the Fund’s investment in such money market funds. |
| | (e) | The rate shown is the current yield as of September 30, 2024. |
| | * | A side pocket is an account within the Investment Fund that has additional restrictions on liquidity. |
The accompanying notes are an integral part of these financial statements.
7
J.P. Morgan Access Multi-Strategy Fund II
Statement of Assets and Liabilities
September 30, 2024
(Unaudited)
| | | | |
Assets | | | | |
| |
Investments in non-affiliates, at value (cost $45,467,569) | | $ | 64,116,167 | |
Investments in affiliates, at value (cost $395,306) | | | 395,306 | |
Receivable for Investment Funds sold** | | | 5,846,644 | |
Investments paid in advance (see Note 2c) | | | 1,250,000 | |
Prepaid expenses | | | 35,709 | |
Dividend receivable from affiliates | | | 1,711 | |
| | | | |
Total assets | | | 71,645,537 | |
| | | | |
| |
Liabilities | | | | |
Tender offer proceeds payable | | | 2,997,748 | |
Loan payable (see Note 4) | | | 1,550,000 | |
Management Fee payable | | | 115,378 | |
Professional fees payable | | | 85,234 | |
Administration Fee payable | | | 15,061 | |
Credit facility fees payable | | | 4,992 | |
Interest payable | | | 2,975 | |
Other accrued expenses | | | 51,731 | |
| | | | |
Total liabilities | | | 4,823,119 | |
| | | | |
| |
Net Assets attributable to 4,489,829 shares issued and outstanding ($0.001 par value; unlimited number of shares authorized) | | $ | 66,822,418 | |
| | | | |
| |
Net Assets | | | | |
Paid in capital | | $ | 110,632,210 | |
Total distributable earnings (loss) | | | (43,809,792 | ) |
| | | | |
Net Assets | | $ | 66,822,418 | |
| | | | |
| |
Net asset value per share* | | $ | 14.88 | |
| | | | |
| | * | The net asset value shown in the statement of assets and liabilities and in the financial highlights, reflects adjustments made to the net asset values in accordance with accounting principles generally accepted in the United States of America, may differ from the net asset value calculated for shareholder transactions. |
| | ** | $284,710 of this total receivable, which is related to Antara Capital Offshore Fund, Ltd., which was sold as of December 31, 2023, has not been received as of November 27, 2024. |
The accompanying notes are an integral part of these financial statements.
8
J.P. Morgan Access Multi-Strategy Fund II
Statement of Operations
For the six months ended September 30, 2024
(Unaudited)
| | | | |
Investment income | | | | |
Dividend income from affiliates | | $ | 53,187 | |
Dividend income from non-affiliates | | | 15,021 | |
| | | | |
Total investment income | | | 68,208 | |
| | | | |
| |
Expenses | | | | |
Management Fee (see Note 3) | | | 353,770 | |
Fund accounting and custodian fees | | | 104,192 | |
Professional fees | | | 109,521 | |
Administration Fee (see Note 3) | | | 45,990 | |
Credit facility fees (see Note 4) | | | 30,652 | |
Trustees’ fees | | | 10,590 | |
Insurance | | | 19,172 | |
Interest (see Note 4) | | | 6,081 | |
Investor servicing fees | | | 9,938 | |
Other | | | 14,989 | |
| | | | |
Total expenses | | | 704,895 | |
| | | | |
| |
Less: Waivers and/or expense reimbursements (see Note 3) | | | (2,114 | ) |
| | | | |
Net expenses | | | 702,781 | |
| | | | |
| |
Net investment income (loss) | | | (634,573 | ) |
| | | | |
| |
Realized and unrealized gain (loss) | | | | |
Net realized gain (loss) from investments in non-affiliates | | | 1,971,340 | |
Net change in unrealized appreciation (depreciation) on investments in non-affiliates | | | (52,293 | ) |
| | | | |
| |
Net realized and unrealized gain (loss) | | | 1,919,047 | |
| | | | |
| |
Net increase (decrease) in Net Assets resulting from operations | | $ | 1,284,474 | |
| | | | |
The accompanying notes are an integral part of these financial statements.
9
J.P. Morgan Access Multi-Strategy Fund II
Statements of Changes in Net Assets
| | | | | | | | |
| | | For the six months | | |
| | | ended September 30, | | |
| | | 2024 | | For the Year Ended |
| | | (Unaudited) | | March 31, 2024 |
Change in Net Assets Resulting from Operations: | | | | | | | | |
| | |
Net investment income (loss) | | $ | (634,573 | ) | | $ | (1,361,173 | ) |
Net realized gain (loss) from investments in non-affiliates | | | 1,971,340 | | | | 3,910,470 | |
Net change in unrealized appreciation (depreciation) on investments in non-affiliates | | | (52,293 | ) | | | 3,825,393 | |
Distributions of capital gains received from investment companies non-affiliates | | | – | | | | – | |
| | | | | | | | |
Net increase (decrease) in Net Assets resulting from operations | | | 1,284,474 | | | | 6,374,690 | |
| | | | | | | | |
| | |
Distributions to Shareholders: | | | | | | | | |
| | |
From net investment income | | | – | | | | (3,111,454 | ) |
| | | | | | | | |
| | |
Capital Transactions: | | | | | | | | |
| | |
Change in Net Assets from capital transactions | | | (6,391,681 | ) | | | (6,902,572 | ) |
| | | | | | | | |
| | |
Net Assets: | | | | | | | | |
| | |
Change in Net Assets | | | (5,107,207 | ) | | | (3,639,336 | ) |
Beginning of period | | | 71,929,625 | | | | 75,568,961 | |
| | | | | | | | |
End of period | | $ | 66,822,418 | | | $ | 71,929,625 | |
| | | | | | | | |
| | |
Capital Transactions: | | | | | | | | |
| | |
Proceeds from shares issued | | $ | 742,000 | | | $ | 480,000 | |
Dividends and distributions reinvested | | | – | | | | 2,548,979 | |
Cost of shares repurchased | | | (7,133,681 | ) | | | (9,931,551 | ) |
Repurchase fees | | | – | | | | – | |
| | | | | | | | |
Change in Net Assets from capital transactions | | $ | (6,391,681 | ) | | $ | (6,902,572 | ) |
| | | | | | | | |
| | | | | | | | | | |
| | | |
Share Transactions: | | | | | | | | | | |
| | | |
Issued | | | 50,873 | | | | | | 33,384 | |
Reinvested | | | – | | | | | | 180,563 | |
Repurchased | | | (482,722 | ) | | | | | (689,154 | ) |
| | | | | | | | | | |
Change in Shares | | | (431,849 | ) | | | | | (475,207 | ) |
| | | | | | | | | | |
The accompanying notes are an integral part of these financial statements.
10
J.P. Morgan Access Multi-Strategy Fund II
Statement of Cash Flows
For the six months ended September 30, 2024
(Unaudited)
| | | | |
Cash flows from operating activities | | | | |
| |
Net increase (decrease) in Net Assets resulting from operations | | $ | 1,284,474 | |
| Adjustments to reconcile net increase in Net Assets resulting from operations to net cash provided by operating activities: | | | | |
Purchases of non-affiliated Investment Funds and registered investment companies | | | (3,302,056 | ) |
Sales of non-affiliated Investment Funds and registered investment companies | | | 10,276,944 | |
Sales of short-term investments in affiliates, net | | | 415,830 | |
Net realized (gain) loss from investments in non-affiliates | | | (1,971,340 | ) |
Net change in unrealized (appreciation) depreciation on investments in non-affiliates | | | 52,293 | |
Increase in prepaid expenses | | | (20,553 | ) |
Decrease in dividend receivable from affiliates | | | 6,942 | |
Decrease in Management Fee payable | | | (10,749 | ) |
Decrease in professional fees payable | | | (38,191 | ) |
Decrease in Administration Fee payable | | | (1,427 | ) |
Increase in credit facility fees payable | | | 118 | |
Increase in interest payable | | | 2,975 | |
Increase in other accrued expenses | | | 8,830 | |
| | | | |
| |
Net cash provided by operating activities | | | 6,704,090 | |
| | | | |
| |
Cash flows from financing activities | | | | |
| |
Capital subscriptions, including change in subscriptions received in advance | | | 717,000 | |
Capital redemptions, including change in tender offer proceeds payable and repurchase fees | | | (8,971,090 | ) |
Proceeds from loan payable | | | 2,050,000 | |
Repayments of loan payable | | | (500,000 | ) |
| | | | |
| |
Net cash used in financing activities | | | (6,704,090 | ) |
| | | | |
| |
Net change in cash and cash equivalents | | | – | |
| |
Cash at beginning of period | | | – | |
| | | | |
Cash at end of period | | $ | – | |
| | | | |
| |
Supplemental disclosure of cash flow information | | | | |
| |
Cash paid during the period for interest | | $ | 3,106 | |
| | | | |
The accompanying notes are an integral part of these financial statements.
11
J.P. Morgan Access Multi-Strategy Fund II
Financial Highlights
Ratios and other Financial Highlights
Total return includes adjustments made in accordance with United States generally accepted accounting principles and as such, the Net Asset Values for financial reporting purposes and the returns based upon those Net Asset Values may differ from the Net Asset Values and returns for Shareholders’ transactions.
| | | | | | | | | | | | | | | | | | | | | | | | |
| | | For the six | | | | | | | | | | |
| | | months ended | | | | | | | | | | |
| | | September 30, | | | | | | | | | | |
| | | 2024 | | Years Ended March 31, |
| | | (Unaudited) | | 2024 | | 2023 | | 2022 | | 2021 | | 2020 |
| | | | | | |
Net asset value, beginning of period | | | $14.61 | | | | $14.00 | | | | $14.29 | | | | $15.81 | | | | $14.21 | | | | $15.15 | |
| | | | | | | | | | | | | | | | | | | | | | | | |
Net investment income (loss) (a) | | | (0.13 | ) | | | (0.26 | ) | | | (0.25 | ) | | | (0.27 | ) | | | (0.26 | ) | | | (0.23 | ) |
Net realized and unrealized gain (loss) from investments | | | 0.40 | | | | 1.48 | | | | (0.04 | ) | | | 0.50 | | | | 2.90 | | | | (0.24 | ) |
Repurchase fees | | | – | | | | – | | | | – | | | | – | | | | – | | | | 0.00 | (b) |
| | | | | | | | | | | | | | | | | | | | | | | | |
Net increase (decrease) in Net Assets resulting from operations | | | 0.27 | | | | 1.22 | | | | (0.29 | ) | | | 0.23 | | | | 2.64 | | | | (0.47 | ) |
| | | | | | | | | | | | | | | | | | | | | | | | |
Total distributions | | | – | | | | (0.61 | ) | | | – | | | | (1.75 | ) | | | (1.04 | ) | | | (0.47 | ) |
| | | | | | | | | | | | | | | | | | | | | | | | |
Net asset value, end of period | | | $14.88 | | | | $14.61 | | | | $14.00 | | | | $14.29 | | | | $15.81 | | | | $14.21 | |
| | | | | | | | | | | | | | | | | | | | | | | | |
| | | | | | |
Total return | | | 1.85 | % (c) | | | 8.87 | % | | | (2.05 | %) (d) | | | 1.23 | % | | | 18.59 | % | | | (3.27 | %) |
| | | | | | |
Ratios to average Net Assets: | | | | | | | | | | | | | | | | | | | | | | | | |
| | | | | | |
Expenses, before waivers | | | 2.01 | % (e) | | | 2.00 | % | | | 1.88 | % | | | 1.78 | % | | | 1.79 | % | | | 1.81 | % |
Expenses, net of waivers | | | 2.00 | % (e) | | | 1.99 | % | | | 1.87 | % | | | 1.77 | % | | | 1.78 | % | | | 1.80 | % |
| | | | | | |
Net investment income (loss), before waivers | | | (1.82 | %) (e) | | | (1.85 | %) | | | (1.79 | %) | | | (1.76 | %) | | | (1.68 | %) | | | (1.53 | %) |
Net investment income (loss), net of waivers | | | (1.81 | %) (e) | | | (1.84 | %) | | | (1.78 | %) | | | (1.75 | %) | | | (1.67 | %) | | | (1.52 | %) |
| | | | | | |
Portfolio turnover rate | | | 5.03 | % (c) | | | 17.07 | % | | | 15.09 | % | | | 18.50 | % | | | 23.49 | % | | | 27.77 | % |
| | | | | | | | | | | | | | | | | | | | | | | | |
| | | | | | |
Net Assets | | | $66,822,418 | | | | $71,929,625 | | | | $75,568,961 | | | | $87,788,704 | | | | $86,518,827 | | | | $67,906,228 | |
Total return is calculated as the percentage change in value of a theoretical shareholder investment made at the beginning of the period, net of all fees and expenses. A shareholder’s total return may vary based on the timing of capital subscriptions.
The above expense ratios do not include the expenses from the investment funds and affiliated money market fund. However, total returns take into account all expenses.
| (a) | Based on average shares outstanding. |
| (b) | Amount rounds to less than $0.005 per share. |
| (d) | The total return would have been (2.17%) had the Investment Manager not made a payment of $103,427 to the Fund related to an operational error. |
The accompanying notes are an integral part of these financial statements.
12
J.P. Morgan Access Multi-Strategy Fund II
Notes to Financial Statements September 30, 2024 (Unaudited)
1. Organization
J.P. Morgan Access Multi-Strategy Fund II (the “Fund”) was organized as a Delaware statutory trust on June 16, 2011 under the laws of the State of Delaware and is registered under the Investment Company Act of 1940, as amended (the “1940 Act”), as a closed-end, non-diversified, management investment company. The Fund’s investment objective is to generate consistent capital appreciation over the long term, with relatively low volatility and a low correlation with traditional equity and fixed-income markets. The Fund will seek to accomplish this objective by allocating its assets primarily among professionally selected investment funds (collectively, “Investment Funds” and each individually, “Investment Fund”) that are managed by experienced third-party investment advisers (“Portfolio Managers”) who invest in a variety of markets and employ, as a group, a range of investment techniques and strategies. There can be no assurance that the Fund will achieve its investment objective.
The following is a description of strategies used by third-party investment advisers:
Event Driven – Invests in securities of companies in financial difficulty, reorganization or bankruptcy, involved in mergers, acquisitions, restructurings, liquidations, spin-offs, or other special situations that alter a company’s financial structure or operating strategy, nonperforming and sub-performing bank loans, and emerging market debt. Investment Funds within this strategy are generally subject to 30-90 day redemption notice periods.
Long/Short Equities – Makes long and short investments in equity securities that are deemed by the Portfolio Managers to be under or overvalued. Investment Funds within this strategy are generally subject to 45-90 day redemption notice periods.
Opportunistic/Macro – Invests in a wide variety of instruments using a broad range of strategies, often assuming an aggressive risk posture, typically with low correlations to other strategies. This strategy uses a combination of macro-economic models and fundamental research to invest across countries, markets, sectors and companies, and has the flexibility to invest in numerous financial instruments. Investment Funds within this strategy are generally subject to 1-90 day redemption notice periods.
Relative Value – Makes simultaneous purchases and sales of similar securities to exploit pricing differentials or have long exposure in non-equity oriented beta opportunities (such as credit). Different relative value strategies include convertible bond arbitrage, statistical arbitrage, pairs trading, yield curve arbitrage and basis trading. Investment Funds within this strategy are generally subject to 30-75 day redemption notice periods.
J.P. Morgan Private Investments Inc. (“JPMPI”), a corporation formed under the laws of the State of Delaware and an indirect, wholly-owned subsidiary of J.P. Morgan Chase & Co. (“J.P. Morgan Chase”), acts as Investment Manager (the “Investment Manager”) and Administrator (the “Administrator”), and is responsible for the day-to-day management of the Fund, subject to policies adopted by the Board of Trustees (the “Board”).
The Investment Manager is registered as an investment adviser under the Investment Advisers Act of 1940, as amended (the “Advisers Act”).
The Fund is offered to certain tax-exempt and tax-deferred investors. The Fund is neither designed nor intended for U.S. taxable investors and/or non-U.S. persons.
13
J.P. Morgan Access Multi-Strategy Fund II
Notes to Financial Statements September 30, 2024 (Unaudited) (continued)
2. Significant Accounting Policies
a. Use of Estimates
The following is a summary of significant accounting policies followed by the Fund in the preparation of its financial statements. The Fund is an investment company and, accordingly, follows the investment company accounting and reporting guidance of the Financial Accounting Standards Board (“FASB”) Accounting Standards Codification Topic 946 - Investment Companies, which is part of U.S. generally accepted accounting principles (“GAAP”). The preparation of financial statements in conformity with GAAP requires management to make estimates and assumptions that affect the reported amounts of assets and liabilities and disclosure of contingent assets and liabilities at the date of the financial statements and the reported amounts of increases and decreases in net assets (“Net Assets”) from operations during the Reporting Period. Actual results could differ from those estimates.
b. Valuation of Investments
The valuation of the investments is in accordance with GAAP and the Fund’s valuation policies set forth by and under the supervision and responsibility of the Board, which established the following approach to valuation, as described more fully below. The Fund values its investments in Investment Funds at fair value. Fair value as of each month-end ordinarily is the net asset value (“NAV”) determined as of such month-end for each Investment Fund in accordance with the Investment Fund’s valuation policies and reported at the time of the Fund’s valuation.
The Board has designated the Administrator as the Valuation Designee, and the Administrator uses the J.P. Morgan Access Multi-Strategy Funds’ Valuation Committee (“VC”), comprised of officers of the Fund and other personnel of the Administrator to assist the Board with the oversight and monitoring of the valuation of the Fund’s investments with respect to Rule 2a-5 under the 1940 Act. The VC oversees and carries out the policies for the valuation of investments held in the Fund as described in detail below. The Administrator is responsible for discussing and assessing the potential impacts to the fair values on an ongoing basis, and at least on a quarterly basis with the VC and the Board.
On a monthly basis, the NAV is used to determine the fair value of all underlying investments which (a) do not have readily determinable fair values and (b) either have the attributes of an investment company or prepare their financial statements consistent with measurement principles of an investment company. As a general matter, the fair value of the Fund’s interest in an Investment Fund will represent the amount that the Fund could reasonably expect to receive from an Investment Fund if the Fund’s interest were redeemed at the time of the valuation, based on information reasonably available at the time the valuation is made and that the Administrator believes to be reliable. In the unlikely event that an Investment Fund does not report a month-end NAV to the Fund on a timely basis, the Administrator would determine the fair value of such Investment Fund based on the most recent value reported by the Investment Fund, as well as any other relevant information available at such time. Considerable judgment is required to interpret the factors used to develop estimates at fair value. These factors include, but are not limited to, a review of the underlying securities of the Investment Fund when available, ongoing due diligence of the style, strategy and valuation methodology employed by each
14
J.P. Morgan Access Multi-Strategy Fund II
Notes to Financial Statements September 30, 2024 (Unaudited) (continued)
2. Significant Accounting Policies (continued)
b. Valuation of Investments (continued)
Investment Fund, and a review of market inputs that may be expected to impact the performance of a particular Investment Fund. The use of different factors and estimation methodologies could have a significant effect on the estimated fair value and could be material to the financial statements.
The Fund’s ability to liquidate an interest and withdraw from an Investment Fund will likely be limited, and certain Investment Funds may impose lock-up periods, during which time no redemptions or withdrawals may be made.
Some of the Investment Funds may invest all or a portion of their assets in investments which may be illiquid. Some of these investments are held in “side pockets,” sub funds within the Investment Funds, which provide for their separate liquidation potentially over a much longer period than the liquidity an investment in the Investment Funds may provide. Should the Fund seek to liquidate its investment in an Investment Fund which maintains investments in a side pocket arrangement or which holds substantially all of its assets in illiquid investments, the Fund might not be able to fully liquidate its investment without considerable delay. In such cases, the value of its investment could fluctuate during the period until the Fund is permitted to fully liquidate its interest in the Investment Funds.
Investments in affiliated and non-affiliated registered investment companies are valued at such fund’s NAV per share as of the valuation date.
Valuations reflected in this report are as of the report date. As a result, changes in valuation due to market events and/or issuer related events after the report date and prior to issuance of the report are not reflected herein.
The various inputs that are used in determining the fair value of the Fund’s investments are summarized into the three broad levels listed below.
Level 1 – Unadjusted inputs using quoted prices in active markets for identical investments.
Level 2 – Other significant observable inputs including, but not limited to, quoted prices for similar investments or other significant observable inputs.
Level 3 – Significant inputs based on the best information available in the circumstances, to the extent observable inputs are not available (including the Fund’s assumptions in determining the fair value of investments).
A financial instrument’s level within the fair value hierarchy is based on the lowest level of any input both individually and in aggregate, that is significant to the fair value measurement. The inputs or methodology used for valuing instruments are not necessarily an indication of the risk associated with investing in those instruments.
15
J.P. Morgan Access Multi-Strategy Fund II
Notes to Financial Statements September 30, 2024 (Unaudited) (continued)
2. Significant Accounting Policies (continued)
b. Valuation of Investments (continued)
The Fund’s investments in affiliated and non-affiliated registered investment companies, as disclosed on the Schedule of Investments, are designated as Level 1.
As of September 30, 2024, Investment Funds with a fair value of $62,365,613 have not been categorized in the fair value hierarchy as the Investment Funds were measured using the NAV per share as a practical expedient.
c. Investments Paid in Advance
Investments paid in advance represent cash which has been sent to Investment Funds prior to September 30, 2024, but the investment is not effective until October 1, 2024. At September 30, 2024, the Fund made the following commitment to purchase Investment Funds:
| | | | |
| Investment Funds | | Amount | |
KL Special Opportunities Fund Ltd* | | $ | 650,000 | |
Silver Point Capital Offshore Fund, Ltd.** | | | 300,000 | |
Starboard Value & Opportunity Fund Ltd* | | | 300,000 | |
Total | | $ | 1,250,000 | |
* The Investment Fund utilizes the Event Driven strategy subject to 90 day redemption notice period and has quarterly liquidity.
** The Investment Fund utilizes the Event Driven strategy subject to 90 day redemption notice period and has annual liquidity.
d. Distributions from Investments
Distributions received from Investment Funds or affiliated and non-affiliated investment companies whether in the form of cash or securities, are applied as a reduction of the investment’s cost when identified as a return of capital. Once the investment’s cost is received, any further distributions are recognized as realized gains.
e. Investment Transactions with Affiliates
The Fund invested in affiliated investment companies which are advised by J.P. Morgan Investment Management Inc. (“JPMIM”) or its affiliates. An issuer which is under common control with the Fund may be considered an affiliate. For the purposes of the financial statements, the Fund assumes the issuer listed in the table below to be an affiliated issuer. Affiliated investment companies’ distributions may be reinvested into the affiliated investment companies. Reinvestment amounts are included in the purchase cost amounts in the table below.
16
J.P. Morgan Access Multi-Strategy Fund II
Notes to Financial Statements September 30, 2024 (Unaudited) (continued)
2. Significant Accounting Policies (continued)
e. Investment Transactions with Affiliates (continued)
| | | | | | | | | | | | | | | | | | |
| | | | | | | | | | | Change in | | | | | | | | |
| | | Value at | | | | | | | | Unrealized | | Value at | | Shares at | | | | |
| Security | | March 31, | | Purchases at | | Proceeds from | | Net Realized | | Appreciation/ | | September 30, | | September 30, | | Dividend | | Capital Gain |
| Description | | 2024 | | Cost | | Sales | | Gain (Loss) | | (Depreciation) | | 2024 | | 2024 | | Income | | Distributions |
| | | | | | | | | |
JPMorgan U.S. Government Money Market Fund, Institutional Class Shares, 4.78% (a) | | $811,136 | | $12,647,627 | | $(13,063,457) | | $ - | | $ - | | $395,306 | | 395,306 | | $53,187 | | $ - |
(a) The rate shown is the current yield as of September 30, 2024.
f. Income Recognition and Security Transactions
Distributions of net investment income and realized capital gains from Investment Funds or affiliated and non-affiliated investment companies, if any, are recorded on the ex-dividend date. Interest income is recorded on an accrual basis. Realized gains and losses from Investment Fund transactions are calculated on the identified cost basis. Investments are recorded on the effective date of the subscription in the Investment Fund. All changes in the value of the Investment Funds and non-affiliated investment companies are included in Net change in unrealized appreciation (depreciation) on investments in non-affiliates on the Statement of Operations.
g. Fund Expenses
The Fund bears all expenses incurred in its business other than those that the Investment Manager assumes. The expenses of the Fund include, but are not limited to, the following: all costs and expenses related to investment transactions and positions for the Fund’s account; legal fees; accounting and auditing fees; custodial fees; costs of computing the Fund’s net asset value; costs of insurance; registration expenses; expenses of meetings of the Board; all costs with respect to communications to shareholders; and other types of expenses as may be approved from time to time by the Board.
The Fund invests in Investment Funds and affiliated and non-affiliated investment companies, and, as a result, bears a portion of the expenses incurred by these investments. These expenses are not reflected in the expenses shown on the Statement of Operations and are not included in the ratios to average Net Assets shown in the Financial Highlights. Certain expenses incurred indirectly through investment in an affiliated money market fund are waived by JPMPI as the Fund’s adviser and/or administrator as described in Note 3.
17
J.P. Morgan Access Multi-Strategy Fund II
Notes to Financial Statements September 30, 2024 (Unaudited) (continued)
2. Significant Accounting Policies (continued)
h. Income Taxes
The Fund generally invests its assets in foreign corporations that would be classified as passive foreign investment companies (“PFICs”). The Fund has elected to have a tax year end of October 31. The Fund’s policy is to comply with the provisions of the Internal Revenue Code of 1986, as amended (the “Code”), applicable to regulated investment companies and to distribute to its shareholders all of its distributable net investment income and net realized capital gains on investments. In addition, the Fund intends to make distributions as required to avoid excise taxes. Accordingly, no provision for Federal income or excise tax has been recorded in these financial statements.
Management is not aware of any tax positions for which it is reasonably possible that the total amounts of unrecognized tax benefits or losses will significantly change in the next twelve months. However, management’s conclusions may be subject to future review based on changes in, or the interpretation of, the accounting standards or tax laws and regulations.
Management has reviewed the Fund’s tax positions for all open tax years and has determined that as of September 30, 2024, no liability for income tax is required in the Fund’s financial statements for net unrecognized tax benefits. However, management’s conclusions may be subject to future review based on changes in, or the interpretation of, the accounting standards or tax laws and regulations. The Fund’s Federal tax returns for the prior three fiscal years remain subject to examination by the Internal Revenue Service.
i. Dividends and Distributions
Dividends from net investment income and distributions from net realized capital gains are generally declared and paid annually.
The amounts of dividends from net investment income and distributions from net realized capital gains are determined in accordance with Federal income tax regulations, which may differ from GAAP. These “book/tax” differences are either considered temporary or permanent in nature. To the extent these differences are permanent in nature, (e.g., gains/losses from the sale of PFICs, and certain distributions), such amounts are reclassified within the components of Net Assets based on their Federal tax-basis treatment; temporary differences do not require reclassifications.
All of the distributions, if any, to shareholders were from net investment income and were ordinary income for tax purposes.
Pursuant to the automatic dividend reinvestment plan (“DRIP”), shareholders are presumed to have elected to have all net investment income dividends and net realized capital gains distributions, if any, automatically reinvested in shares. Shareholders who affirmatively choose not to participate in the DRIP will receive distributions in cash.
18
J.P. Morgan Access Multi-Strategy Fund II
Notes to Financial Statements September 30, 2024 (Unaudited) (continued)
2. Significant Accounting Policies (continued)
j. Recent Accounting Pronouncement
In June 2022, the FASB issued Accounting Standards Update (“ASU”) No. 2022-03, Fair Value Measurement (Topic 820) - Fair Value Measurement of Equity Securities Subject to Contractual Sale Restrictions. The amendments in the ASU clarify that a contractual restriction on the sale of an equity security is not considered part of the unit of account of the equity security and, therefore, should not be considered in measuring fair value. The ASU is effective for interim and annual Reporting Periods beginning after December 15, 2023, with the option of early adoption. Management is currently evaluating the impact, if any, of applying this ASU.
In March 2020, the FASB issued ASU No. 2020-04, “Reference Rate Reform (Topic 848) - Facilitation of the Effects of Reference Rate Reform on Financial Reporting.” This ASU provides optional exceptions for applying GAAP to contract modifications, hedging relationships and other transactions affected reference rate reform if certain criteria are met. ASU 2020-04 is elective and is effective on March 12, 2020 through December 31, 2024. Management expects that the adoption of this guidance will not have a material impact on the Fund’s financial statements.
3. Management Fee, Related Party Transactions and Other
The Fund has entered into an investment management agreement with the Investment Manager. In consideration of the advisory services provided by the Investment Manager to the Fund, the Fund pays the Investment Manager a management fee at an annual rate of 1.00% (the “Management Fee”), payable monthly at the rate of 1/12 of 1.00% of the month-end net asset value of the Fund, before giving effect to repurchases or Repurchase Fees (if any, as defined in Note 6), but after giving effect to the Fund’s other expenses. The Management Fee is an expense paid out of the Fund’s assets. The Management Fee is paid monthly in arrears within 30 days of the calculation of the Fund’s net asset value each month. For the six months ended September 30, 2024, the Management Fee earned by JPMPI totaled $353,770.
Pursuant to an Administration Agreement, the Administrator provides certain administration services to the Fund. In consideration of these services, the Administrator receives a fee (the “Administration Fee”) paid monthly at the annual rate of 0.13% of the Fund’s month-end net asset value, before giving effect to repurchases or Repurchase Fees (if any, as defined in Note 6), but after giving effect to the Fund’s other expenses. For the six months ended September 30, 2024, the Administration Fee earned by JPMPI totaled $45,990.
The Investment Manager and the Administrator have contractually agreed to waive fees and/or reimburse the Fund to the extent that total annual operating expenses (excluding acquired fund fees and expenses other than certain money market fund fees as described below, dividend and interest expenses on securities sold short, interest, brokerage commissions, taxes, expenses related to litigation and potential litigation, expenses related to trustee election and extraordinary expenses not incurred in the ordinary course of the Fund’s business) exceed 2.00% on an annualized basis of the Fund’s Net Assets as of the end of each month. This expense limitation agreement is in effect until August 1, 2025. Under this agreement, none of these parties expect the Fund to repay any such waived fees and reimbursed expenses in future years. There were no fees waived pursuant to this agreement during the six months ended September 30, 2024.
19
J.P. Morgan Access Multi-Strategy Fund II
Notes to Financial Statements September 30, 2024 (Unaudited) (continued)
3. Management Fee, Related Party Transactions and Other (continued)
The Fund may invest in one or more money market funds advised by JPMIM or its affiliates (affiliated money market funds). JPMPI as the Fund’s adviser and/or administrator has contractually agreed to waive fees and/or reimburse expenses in an amount sufficient to offset the net fees JPMIM collects from the affiliated money market funds on the Fund’s investment in such money market funds. The amount of waivers resulting from investments in the affiliated money market funds for the six months ended September 30, 2024 was $2,114 paid by JPMPI. None of these parties expect the Fund to repay any such waived fees and reimbursed expenses in future years.
Entities may be retained by the Fund to assist in the placement of shares. These entities (“Placement Agents”), which may include the Investment Manager and its affiliates, will generally be entitled to receive a placement fee of up to 2.0% of the invested amount from each investor purchasing shares through a Placement Agent. The placement fee will be added to a prospective investor’s purchase amount; it will not constitute an investment made by the investor in the Fund, nor will it be included as part of the assets of the Fund. The placement fee may be adjusted or waived at the sole discretion of the Placement Agent.
Certain officers of the Fund are affiliated with the Investment Manager and the Administrator. Such officers receive no compensation from the Fund for serving in their respective roles.
4. Line of Credit
The Fund has a committed line of credit with Bank of America, N.A. in the amount of $12.1 million and from time to time may borrow cash under the credit agreement. Interest charged on borrowings, which is calculated on any outstanding loan balance, and based on a Secured Overnight Financing Rate (“SOFR”), is payable on a monthly basis. The Fund also pays a monthly facility fee at an annual rate of 0.50% on the daily unused amount of the line of credit. The Fund had an outstanding loan balance in the amount of $1,550,000 on this line of credit as of September 30, 2024. This agreement terminates on March 25, 2025.
During the six months ended September 30, 2024, the Fund had borrowings under the credit agreement as follows:
| | | | | | | | |
Average Daily Loan Balance* | | Weighted Average Interest Rate | | Interest Expense** | | Number of Days Borrowings Were Outstanding | | Credit Facility Fee** |
| $463,235 | | 6.95% | | $6,081 § | | 68 | | $30,652 § |
| | * | For the days borrowings were outstanding. |
| | ** | For the six months ended September 30, 2024. |
| | § | Interest expense and credit facility fees incurred for the six months ended September 30, 2024 are included in the Statement of Operations. | |
The Fund is required to pledge cash or securities as collateral to Bank of America, N.A. in an amount at least equal to a certain percentage of the available line of credit. Securities segregated as collateral are denoted on the Schedule of Investments.
20
J.P. Morgan Access Multi-Strategy Fund II
Notes to Financial Statements September 30, 2024 (Unaudited) (continued)
5. Security Transactions
During the six months ended September 30, 2024, purchases and sales of investments (excluding short-term investments) amounted to $3,502,056 and $13,097,598 respectively.
6. Subscriptions and Redemptions to Shareholders
Generally, initial and additional subscriptions for shares of beneficial interest (“Shares”) by eligible investors may be accepted at such times as the Fund may determine. The Fund reserves the right to reject any subscriptions for Shares in the Fund. The initial acceptance for subscriptions for Shares was September 30, 2011 (the “Initial Closing Date”). After the Initial Closing Date, the Fund generally accepts subscriptions for Shares as of the first day of each month at the Fund’s then current NAV per share. At September 30, 2024, the Fund did not receive subscription proceeds in advance of the October 1, 2024 subscription date.
The Fund from time to time may offer to repurchase Shares pursuant to written tenders by shareholders. These repurchases will be made at such times, and in such amounts, and on such terms as may be determined by the Board, in its sole discretion. The Investment Manager expects to typically recommend to the Board that the Fund offer to repurchase Shares from shareholders of up to 35% of the Fund’s Net Assets quarterly, effective as of the last day of March, June, September, and December, although such recommendation may be less than or greater than 35%. A 1.5% repurchase fee (the “Repurchase Fee”) payable to the Fund will be charged for repurchases of shareholders’ Shares at any time prior to the day immediately preceding the one-year anniversary of a shareholder’s purchase of its Shares. For the six months ended September 30, 2024, the Fund did not earn any Repurchase Fees.
7. Federal Income Tax Matters
The Fund has a tax year end of October 31. The cost of investment securities and components of Net Assets on a tax basis presented below have been estimated as of September 30, 2024. The actual cost of investment securities and components of Net Assets on a tax basis will be different as of October 31, 2024, the Fund’s tax year end. The Fund’s required distributions will be determined by the net investment income or loss and net realized gain or loss for the entire tax year (November 1, 2023 through October 31, 2024).
For Federal income tax purposes, the estimated cost and unrealized appreciation (depreciation) in value of the investment securities at September 30, 2024 were as follows:
| | | | | | | | | | | | | | |
Aggregate Cost | | | Gross Unrealized Appreciation | | | Gross Unrealized (Depreciation) | | | Net Unrealized Appreciation (Depreciation) | |
| | | |
| | $ 65,585,839 | | | $ | 247,123 | | | $ | (1,321,489 | ) | | $ | (1,074,366) | |
The difference between book and tax basis appreciation (depreciation) on investments is primarily attributed to PFIC mark-to-market adjustments.
During the year ended March 31, 2024, the Fund distributed $3,111,454 of ordinary income. During the six months ended September 30, 2024, the Fund did not make any distributions.
21
J.P. Morgan Access Multi-Strategy Fund II
Notes to Financial Statements September 30, 2024 (Unaudited) (continued)
7. Federal Income Tax Matters (continued)
At September 30, 2024, the estimated components of Net Assets (excluding paid in capital) on a tax basis were as follows:
| | | | | | | | | | | | |
Current Distributable Ordinary Income* | | Current Distributable Long Term Capital Gain or (Tax Basis Capital Loss Carryover)* | | Unrealized Appreciation (Depreciation) | | | | |
| | | |
$ 4,841,908 | | $ | (46,584,918 | ) | | $ | (1,074,366) | | | | | |
*Subject to change based on the Fund’s results through its tax year end of October 31, 2024.
The cumulative timing differences primarily consist of PFIC mark-to-market adjustments and late year ordinary deferrals.
As of September 30, 2024 the Fund had estimated net short-term capital loss carryforwards of $3,789,644 and estimated net long-term capital loss carryforwards of $42,795,274. Capital loss carryforwards are carried forward indefinitely, and retain their character as short-term and/or long-term losses.
Late year ordinary losses incurred after December 31 within the taxable year are deemed to arise on the first business day of the Fund’s next taxable year. For the period ended September 30, 2024, the Fund is estimating to defer $992,416 of late year ordinary losses to November 1, 2024. This amount is subject to change based on the Fund’s results through its tax year end of October 31, 2024.
The following amounts were reclassified within the capital accounts:
| | | | | | | | |
| Paid in Capital | | Accumulated undistributed (distributed in excess of) net investment income | | Accumulated net realized loss on Investments |
| | |
| $ - | | $ | 2,575,110 | | | $ | (2,575,110 | ) |
The reclassifications for the Fund relate primarily to investments in PFICs.
8. Risk Exposure
In the normal course of business, the Investment Funds trade various financial instruments and enter into various investment activities with off-balance sheet risk. These include, but are not limited to, short-selling activities, writing option contracts, contracts for differences, and interest rate, credit default and total return equity swaps contracts. The Fund’s risk of loss in these Investment Funds is limited to the value of the Fund’s investments in the Investment Funds.
22
J.P. Morgan Access Multi-Strategy Fund II
Notes to Financial Statements September 30, 2024 (Unaudited) (continued)
8. Risk Exposure (continued)
In pursuing its investment objectives, the Fund invests primarily in Investment Funds that are not registered under the 1940 Act. These Investment Funds may utilize diverse investment strategies, which are not generally managed against traditional investment indices. The Investment Funds selected by the Fund will invest in actively traded securities and other financial instruments using a variety of strategies and investment techniques that may involve significant risks. Such risks arise from the volatility of the equity, fixed income, commodity and currency markets, leverage both on and off balance sheet associated with borrowings, short sales and derivative instruments, the potential illiquidity of certain instruments including emerging markets, private transactions, derivatives, and counterparty and broker defaults. Various risks are also associated with an investment in the Fund, including risks relating to compensation arrangements and risks related to limited liquidity of the Investment Funds. The Investment Funds provide for periodic redemptions generally ranging from monthly to semi-annually, and may be subject to various lock-up provisions and early withdrawal fees.
Because of the Fund’s investment in the Investment Funds, the Fund indirectly pays a portion of the expenses incurred by the Investment Funds. As a result, a cost of investing in the Fund may be higher than the cost of investing in a fund that invests directly in individual securities and financial instruments.
The investments of the Investment Funds are subject to normal market fluctuations and other risks inherent in investing in securities and there can be no assurance that any appreciation in value will occur. The value of investments can fall as well as rise and investors may not realize the amount that they invest.
Although the Investment Manager will seek to select Investment Funds that offer the opportunity to have their shares or units redeemed within a reasonable timeframe, there can be no assurance that the liquidity of the investments of such Investment Funds will always be sufficient to meet redemption requests as, and when, made.
The Investment Manager may invest the Fund’s assets in Investment Funds that invest in illiquid securities and do not permit frequent withdrawals. Illiquid securities owned by Investment Funds are generally riskier than liquid securities because the Investment Funds may not be able to dispose of the illiquid securities if their investment performance deteriorates, or may be able to dispose of the illiquid securities only at a greatly reduced price. Similarly, the illiquidity of the Investment Funds may cause shareholders to incur losses because of an inability to withdraw their investments from the Fund during or following periods of negative performance.
The Investment Funds may invest in the securities of foreign companies that involve special risks and considerations not typically associated with investing in U.S. companies. These risks include devaluation of currencies, less reliable information about issuers, different securities transaction clearance and settlement practices, and future adverse political and economic developments. Moreover, securities of many foreign companies and their markets may be less liquid and their prices more volatile than those securities of comparable U.S. companies.
Because of the Fund’s investments in registered investment companies, the Fund indirectly pays a portion of the expenses incurred by these registered investment companies. As a result, the cost of investing in the Fund may be higher than the cost of investing in a mutual fund that invests directly in individual securities and financial instruments. The Fund is also subject to certain risks related to the registered investment companies’ investments in
23
J.P. Morgan Access Multi-Strategy Fund II
Notes to Financial Statements September 30, 2024 (Unaudited) (continued)
8. Risk Exposure (continued)
securities and financial instruments such as fixed income securities, including high yield, asset-backed and mortgage-related securities, equity securities, foreign and emerging markets securities, commodities and real estate securities. These securities are subject to risks specific to their structure, sector or market.
In addition, the registered investment companies may use derivative instruments in connection with their individual investment strategies including futures, forward foreign currency exchange contracts, options, swaps and other derivatives, which are also subject to specific risks related to their structure, sector or market and may be riskier than investments in other types of securities. Specific risks and concentrations present in the registered investment companies are disclosed within their individual financial statements and registration statements, as appropriate since the Fund is non-diversified, it may invest a greater percentage of its assets in a particular issuer or group of issuers than a diversified fund would. This increased investment in fewer issuers may result in the Fund being more sensitive to economic results of those issuing the securities.
Economies and financial markets throughout the world are becoming increasingly interconnected, which increases the likelihood that events or conditions in one country or region will adversely impact markets or issuers in other countries or regions. Securities in the Fund’s or Investment Fund’s portfolio may underperform in comparison to securities in general financial markets, a particular financial market or other asset classes due to a number of factors, including inflation (or expectations for inflation), deflation (or expectations for deflation), interest rates, global demand for particular products or resources, market instability, financial system instability, debt crises and downgrades, embargoes, tariffs, sanctions and other trade barriers, regulatory events, other governmental trade or market control programs and related geopolitical events. In addition, the value of the Fund’s investments may be negatively affected by the occurrence of global events such as war, terrorism, environmental disasters, natural disasters or events, country instability, and infectious disease epidemics, pandemics or endemics.
9. Indemnifications
In the normal course of business, the Fund enters into contracts that contain a variety of representations that provide general indemnifications. The Fund’s maximum exposure under these arrangements is unknown, as this would involve future claims that may be made against the Fund that have not yet occurred. However, the Fund expects the risk of loss to be remote.
10. Concentrations
As of September 30, 2024, all shareholders of the Fund are clients of an affiliate of the Investment Manager, whose holdings collectively represented all of the Fund’s Net Assets. Significant shareholder transactions, if any, may impact the Fund’s performance.
11. Subsequent Events
The Fund has evaluated subsequent events through the date of issuance of this report and has determined that there are no material events that require disclosure.
24
J.P. Morgan Access Multi-Strategy Fund, L.L.C.
Board Approval of Investment Advisory Agreements (Unaudited)
Materials Requested Prior to Meeting. Prior to the Meeting held on May 21, 2024, Ropes & Gray LLP (“Ropes & Gray” or “Independent Legal Counsel”), counsel to the Independent Directors/Trustees, had prepared a letter on behalf of the Independent Directors/Trustees requesting information from J.P. Morgan Private Investments Inc. (“JPMPI” or the “Adviser”) in connection with the proposed continuance of the Investment Management Agreements (the “Management Agreements”) between each of J.P. Morgan Access Multi-Strategy Fund, L.L.C. (“RIC I”) and J.P. Morgan Access Multi-Strategy Fund II (“RIC II,” and together with RIC I, the “Funds” and, each a “Fund”), and JPMPI. The request was designed to address the requirement under Section 15(c) of the 1940 Act that the Directors/Trustees request and evaluate, and that the Adviser furnish, such information as may be reasonably necessary to evaluate the terms of the Management Agreements. JPMPI responded to the information requests, provided memoranda, and related materials and exhibits for consideration by the Directors/Trustees (each a “Board” and, collectively, the “Board”), which were provided to the Directors/Trustees in advance of the Meeting and included in the Meeting Materials (together, the “15(c) Materials”).
Set forth below is a summary of the material factors evaluated by the Directors/Trustees that formed the basis for the Board’s approval of the continuation of the Management Agreements. The Directors’/Trustees’ conclusions as to the approval of the continuation of the Management Agreements were based on a comprehensive consideration of all information provided to the Directors/Trustees. In deciding whether to approve the continuation of the Management Agreements, the Board did not identify any single factor or particular information that, in isolation, was controlling. Some of the factors that figured particularly in the Directors’/Trustees’ deliberations are described below, although individual Directors/Trustees may have evaluated the information presented differently from one another, attributing different weights to various factors.
Materials Reviewed. In considering the approval of the continuation of the Management Agreements, the Directors/Trustees reviewed the 15(c) Materials and related exhibits and other information which included, among other items, (i) the terms of the Management Agreements, (ii) comparative fee and expense information and comparative performance information of 1940 Act funds of hedge funds developed by Broadridge Financial Solutions/Lipper (“Broadridge”) and of any comparable funds or accounts managed by the Adviser, (iii) performance of the Funds compared to applicable benchmarks/indices, (iv) comparisons of Broadridge information with respect to the acquired fund fees of underlying hedge funds in which the Funds and comparable 1940 Act funds of hedge funds invest, (v) descriptions of various services and functions performed by the Adviser for the Funds, such as portfolio management, compliance monitoring, risk management, valuation and administrative, accounting, legal and other services, (v) the estimated costs to the Adviser of providing such services, (vi) information regarding the Adviser’s compliance policies and procedures applicable to the Funds, (vii) the Adviser’s balance sheet and other financial information, (viii) information regarding the Adviser’s corporate organizational structure and biographical information of key personnel of the Adviser and its affiliates who provide services to the Funds, (ix) information regarding estimated profitability to the Adviser from its relationship with the Funds, (x) information regarding potential economies of scale, (xi) information regarding potential ancillary or “fall out” benefits to the Adviser and its affiliates from the Adviser’s relationship with the Funds and (xii) information regarding the Funds’ historical tender offers and asset levels. The Directors/Trustees also reviewed a memorandum prepared by Independent Legal Counsel regarding the responsibilities of the Directors/Trustees in considering the approval of the continuation of the Management Agreements under applicable law.
Review Process. Following their receipt and review of the 15(c) Materials, the Independent Directors/Trustees held an initial meeting via video conference on May 21, 2024 during which representatives from the Adviser (sometimes referred to herein as “management”) presented to the Independent Directors/Trustees regarding the 15(c) Materials and the related proposed continuance of the Management Agreements, as well as the Funds’
25
J.P. Morgan Access Multi-Strategy Fund II
Board Approval of Investment Advisory Agreements (Unaudited) (continued)
administration and distribution-related (placement agency) contracts and responded to various questions from May 24, 2024 with Ropes & Gray to consider the 15(c) Materials and management’s presentations and related deliberations during the initial meeting held on May 21, 2024 during which the Independent Directors/Trustees formulated a number of questions and requests for follow-up information from management, which Ropes & Gray subsequently communicated to the Adviser in writing. The Adviser responded to each of the various follow-up questions and requests either in writing or orally at the June 18, 2024 Board Meeting. The Independent Directors/Trustees and Ropes & Gray held additional executive sessions in connection with the 15(c) Materials, one of which included the interested Chair of the Board and other representatives of the Adviser. The Directors/Trustees also received written and oral presentations during the Board’s regular meetings throughout the year on matters related to the Agreements. As indicated, at several points during the review process, Independent Directors/Trustees discussed the proposed continuation of the Management Agreements during executive sessions held with Independent Legal Counsel at which no representatives of management were present.
Nature, Extent and Quality of Services. The Directors/Trustees considered the depth and quality of the investment management process of JPMPI, including with respect to its selection and ongoing review and monitoring of underlying hedge funds in which the Funds invest and their managers. They also considered experience and capabilities of the Adviser’s senior management, investment and other personnel and the overall financial strength and stability of JPMPI and the broader JPMorgan organization. The Directors/Trustees also considered the nature, extent and quality of the various services that JPMPI provides under the Management Agreements and other agreements, including the separate administration agreements between JPMPI and the Funds. In this regard, the Directors/Trustees noted JPMPI’s continuing investments in technology and other resources to support its investment management, compliance, accounting, risk management and other services on behalf of the Funds, as well as JPMPI’s continuing efforts to attract and retain qualified personnel and to provide services to the Funds and maintain and enhance its related resources and systems. The Directors/Trustees also considered JPMPI’s policies, procedures and systems designed to promote the Funds’ compliance with applicable laws and regulations and its processes to keep the Directors/Trustees informed about matters relevant to the Funds and their shareholders. Among other information, the Directors/Trustees also took into account certifications received from JPMPI confirming the adequacy of the Adviser’s compliance program and code of ethics.
Investment Performance. As part of their review of the services provided by the Adviser, the Directors/Trustees reviewed the performance of each of the Funds, including in reference to the Broadridge report which contained, among other information, comparisons of each Fund’s performance for 1-, 3-, 5-year and since inception periods ended December 31, 2023 to a performance universe of peers funds selected by Broadridge and to the Funds’ benchmark index. In reviewing the comparative information, Broadridge and JPMPI discussed with the Directors/Trustees various limitations with respect to the comparability of the performance of the Funds to the identified peer funds and benchmarks, including that the Funds are diversified, multi-strategy funds, while many peer funds and the benchmark represent strategy-specific and non-diversified investment mandates, noting managed futures funds as an example. They also noted the limited universe of 1940 Act funds that invest principally in private hedge funds that was available for comparative purposes, and that the Broadridge report did not include a smaller performance peer group for this reason.
The Directors/Trustees considered information provided with the 15(c) Materials and throughout the year by the Adviser with respect to its diligence, selection process and monitoring of the performance of the hedge funds in which the Funds invest and their managers. They also considered the role of each Fund within the managed account portfolios for JPMorgan clients to provide a diversification benefit from traditional stocks and bonds
26
J.P. Morgan Access Multi-Strategy Fund II
Board Approval of Investment Advisory Agreements (Unaudited) (continued)
and downside protection across different market environments as well as exposure to a diversified portfolio of private hedge funds to which the clients may not otherwise have access due to the high barriers to entry.
The Directors/Trustees noted that, as indicated in the Broadridge report, RIC I had total return performance in the 4th, 3rd and 3rd quintiles, and RIC II in the 3rd, 4th and 4th quintiles, versus its performance universe of peer funds for the 1-, 3- and 5-year periods ended December 31, 2023, respectively. They noted that both Funds had total return performance in the 5th quintile for their since inception periods through December 31, 2023. The Directors/Trustees also took into account that both Funds outperformed their benchmark index for the 1-year period ended December 31, 2023 but underperformed the benchmark for the 3-year, 5-year and since inception periods. The Directors/Trustees took into account the Adviser’s efforts aimed at improving performance and related reporting and monitoring to be done in the coming year.
Fees and Total Expenses. In considering the fees and expenses of each Fund, the Directors/Trustees took into account a number of factors, including the type and complexity of the services provided to the Funds under the Management Agreements and other agreements, the estimated cost of providing such services, the risks assumed by JPMPI in serving as investment managers to the Funds and providing such services, the impact on potential returns from different levels of fees, the fees and expenses charged by the underlying hedge funds in which the Funds invest, the competitive marketplace for financial products, and the attractiveness of potential returns to investors in the Funds. The Directors/Trustees noted that the management fee rate payable under the Management Agreements is the same for both Funds and took into account JPMPI’s explanation that each Fund receives substantially similar investment management services from JPMPI, including asset allocation, investment oversight and other management services.
The Directors/Trustees also took into account that the Adviser had agreed to contractually reimburse expenses for the Funds to the extent the total expense ratio for each Fund exceeds a specified limit and was proposing to continue those arrangements for another year. The Directors/Trustees reviewed the management fee and total expenses of each Fund (each as a percentage of average net assets) in comparison to the average and median fees and expense levels of peer funds within the peer group and expense universe identified by Broadridge. Among other information, the Directors/Trustees noted that both Funds fees and expenses were in the 3rd quintile for contractual management fees and in the 2nd quintile for actual management fees and total expenses in comparison to the Broadridge expense group. The Directors/Trustees took into account that management fees for these purposes were comprised of both fees paid under the Management Agreements and administration fees paid by the Funds to JPMPI under its separate administration agreements with the Funds, and that JPMPI pays a portion of such administration fees to the Funds’ sub-administrator.
The Directors/Trustees also noted that the total expense comparisons in the Broadridge report did not include the fees and expenses attributable to underlying hedge funds in which the Funds or the peer funds invest (“Acquired Fund Fees and Expenses”). The Directors/Trustees considered separate information provided by Broadridge comparing Acquired Fund Fees and Expenses of the Funds to various funds in the Broadridge peer group. They took into account the Adviser’s explanation that the Acquired Fund Fees and Expenses comparisons do not represent particularly meaningful comparative information because they represent a particular point in time and can vary significantly from period to period, including due to the impact of any performance or incentive fees charged by some peer funds, the structure of the Funds in the peer group, which included funds with a master feeder structure, and can be difficult to discern from available underlying hedge fund disclosure documents (which in certain cases predated 2023), among other factors.
Adviser Costs, Level of Profits and Economies of Scale. The Directors/Trustees considered the estimated profits realized by the Adviser from the Management Agreements and in connection with the operation of the Funds based on profitability information included in the 15(c) Materials. Among other information, the
27
J.P. Morgan Access Multi-Strategy Fund II
Board Approval of Investment Advisory Agreements (Unaudited) (continued)
Directors/Trustees considered the Funds’ operating expenses and estimated costs to the Adviser of providing services to the Funds. They also considered and the impact of the expense limitation agreement and fee waiver agreement observed by JPMPI on the Adviser’s estimated profitability. In addition, they considered the methodologies used by the Adviser to estimate profitability, including reviewing the Funds’ combined profitability as well as at the individual Fund level.
In addition to Fund-specific profitability estimates, the Directors/Trustees took into account that J.P. Morgan and its affiliates may be profitable with respect to the managed accounts that invest in the Funds and/or with respect to any services they may provide to underlying funds in which the Funds invest. It was noted that the fees and expenses charged to the Funds for Advisory, Administration and other third-party operating expenses are not duplicative with the fees, expenses and operating expenses of the underlying funds.
The Directors/Trustees further noted that the management fee rates to be paid to JPMPI do not have break points, but the Adviser was proposing to continue its expense limitation arrangements for the Funds for another year, which may allow the Funds to benefit from economies of scale.
Ancillary Benefits. The Directors/Trustees considered whether the Adviser or any of their affiliates may receive other ancillary or “fall out” benefits as a result of their relationship with the Funds. The Directors/Trustees considered that the Funds benefit the Adviser and its affiliates by enhancing the current discretionary product offering to clients of J.P. Morgan Private Bank and J.P. Morgan Securities LLC (“JPMS”). The Directors/Trustees considered that the Funds are offered to J.P. Morgan Private Bank discretionary clients as part of a multi-asset separately managed portfolio and that J.P. Morgan Chase Bank (“JPMCB”) earns a portfolio management fee (“PMF”) on assets invested in such managed accounts, but that JPMCB does not earn a PMF on the portion of any managed account which is invested in the Funds. The Board also considered that J.P. Morgan may provide brokerage services to underlying hedge funds in which the Funds invest in compliance with applicable law and that JPMS earns a placement agent fee on initial investments from clients that purchase the Funds through an applicable brokerage account, but that most clients purchase and hold the Funds through managed accounts for which no placement agent fee is charged. Additionally, the Directors/Trustees noted that JPMS or other affiliates of the Adviser may enter into placement agent agreements with an adviser of an underlying fund pursuant to which such adviser may compensate affiliates of the Adviser.
Conclusions. After reviewing and considering these and other factors described herein, the Directors/Trustees concluded, in their reasonable business judgment, within the context of their overall conclusions regarding the Management Agreements and based on information provided and related representations made by the Adviser, that they were satisfied that fees payable under the Management Agreements represent reasonable compensation in light of the nature, extent and quality of services provided by the Adviser, and that based on the information provided by the Adviser and taking into account the various assumptions made, the estimated profitability (if any) of the Adviser did not appear to be excessive. Based on their evaluation of factors that they deemed to be material, including, but not limited to, those factors described above, the Directors/Trustees, including the Independent Directors/Trustees, unanimously concluded that the terms of the Management Agreements are fair and reasonable to each Fund, and approved the continuance of the Management Agreements for an additional one-year term.
28
J.P. Morgan Access Multi-Strategy Fund II
The Fund files a complete schedule of its fund holdings for the first and third quarters of its fiscal year with the SEC as an exhibit to its report on Form N-PORT. The Fund’s Form N-PORT reports are available on the SEC’s website at http://www.sec.gov.
A description of the policies and procedures that the Fund uses to determine how to vote proxies relating to portfolio securities, as well as information relating to how the Fund voted proxies relating to portfolio securities during the most recent 12-month period ended June 30, is available without charge, upon request, by calling 1-212-464-2070, and (ii) on the Commission’s website at http://www.sec.gov.
Automatic Dividend Reinvestment Plan (“DRIP”)
Pursuant to the DRIP, each Shareholder will automatically be a participant under the DRIP and have all income dividends and/or capital gains distributions automatically reinvested in additional Shares unless such Shareholder specifically notifies the Fund of its election to receive income dividends and/or capital gain distributions in cash at least 121 days before the last business day of the calendar year, or if the ex dividend date differs from the last business day, such other day that is the ex dividend date of such distribution. An election in writing to receive income dividends and/or capital gain distributions in cash received by the Fund 120 days or less before the ex dividend date of any dividend and/or distribution will apply to subsequent dividends and/or distributions that are paid at least 121 days after receipt of such election.
Generally, for U.S. federal income tax purposes, Shareholders receiving Shares under the DRIP will be treated as having received a distribution equal to the amount payable to them in cash as a distribution had the Shareholder not participated in the DRIP.
Shares will be issued pursuant to the DRIP at their net asset value determined on the next valuation date following the ex-dividend date (the last date of a dividend period on which an investor can purchase Shares and still be entitled to receive the dividend). There is no sales load or other charge for reinvestment. The Fund may terminate the DRIP at any time. Any expenses of the DRIP will be borne by the Fund.
29
| | (b) | Not Applicable. Notices do not incorporate disclosures from the shareholder reports. |
Item 2. Code of Ethics.
Not applicable.
Item 3. Audit Committee Financial Expert.
Not applicable.
Item 4. Principal Accountant Fees and Services.
Not applicable.
Item 5. Audit Committee of Listed Registrants.
Not applicable.
Item 6. Investments.
| (a) | Schedule of Investments in securities of unaffiliated issuers as of the close of the reporting period is included as part of the report to shareholders filed under Item 1 of this form. |
Item 7. Financial Statements and Financial Highlights for Open-End Management Investment Companies.
Item 8. Changes in and Disagreements with Accountants for Open-End Management Investment Companies.
Not applicable.
Item 9. Proxy Disclosures for Open-End Management Investment Companies.
Not applicable.
Item 10. Remuneration Paid to Directors, Officers, and Others of Open-End Management Investment Companies.
Not applicable.
Item 11. Statement Regarding Basis for Approval of Investment Advisory Contract.
Included as part of the report to shareholders filed under Item 1 of this form.
Item 12. Disclosure of Proxy Voting Policies and Procedures for Closed-End Management Investment Companies.
Not applicable.
Item 13. Portfolio Managers of Closed-End Management Investment Companies.
There has been no change, as of the date of this filing, in any of the portfolio managers identified in response to paragraph (a)(1) of this Item in the registrant’s most recently filed annual report on Form N-CSR.
| Item 14. | Purchases of Equity Securities by Closed-End Management Investment Company and Affiliated Purchasers. |
Not applicable.
Item 15. Submission of Matters to a Vote of Security Holders.
There have been no material changes to the procedures by which the shareholders may recommend nominees to the registrant’s board of directors, where those changes were implemented after the registrant last provided disclosure in response to the requirements of Item 407(c)(2)(iv) of Regulation S-K (17 CFR 229.407) (as required by Item 22(b)(15) of Schedule 14A (17 CFR 240.14a-101)), or this Item.
Item 16. Controls and Procedures.
| | (a) | The registrant’s principal executive and principal financial officers, or persons performing similar functions, have concluded that the registrant’s disclosure controls and procedures (as defined in Rule 30a-3(c) under the Investment Company Act of 1940, as amended (the “1940 Act”) (17 CFR 270.30a-3(c))) are effective, as of a date within 90 days of the filing date of the report that includes the disclosure required by this paragraph, based on their evaluation of these controls and procedures required by Rule 30a-3(b) under the 1940 Act (17 CFR 270.30a-3(b)) and Rules 13a-15(b) or 15d-15(b) under the Securities Exchange Act of 1934, as amended (17 CFR 240.13a-15(b) or 240.15d-15(b)). |
| | (b) | There were no changes in the registrant’s internal control over financial reporting (as defined in Rule 30a-3(d) under the 1940 Act (17 CFR 270.30a-3(d)) that occurred during the period covered by this report that has materially affected, or is reasonably likely to materially affect, the registrant’s internal control over financial reporting. |
Item 17. Disclosure of Securities Lending Activities for Closed-End Management Investment Companies.
Not applicable.
Item 18. Recovery of Erroneously Awarded Compensation.
Not applicable.
Item 19. Exhibits.
| | (a)(3)(1) | There were no written solicitations to purchase securities under Rule 23c-1 under the Act sent or given during the period covered by the report by or on behalf of the Registrant to 10 or more persons. |
| | (a)(3)(2) | There was no change in the Registrant’s independent public accountant during the period covered by the report. |
SIGNATURES
Pursuant to the requirements of the Securities Exchange Act of 1934 and the Investment Company Act of 1940, the registrant has duly caused this report to be signed on its behalf by the undersigned, thereunto duly authorized.
| | |
| (Registrant) | | J.P. Morgan Access Multi-Strategy Fund II |
| | |
| By (Signature and Title)* | | /s/ Mary E. Savino |
| | Mary E. Savino |
| | Principal Executive Officer |
Pursuant to the requirements of the Securities Exchange Act of 1934 and the Investment Company Act of 1940, this report has been signed below by the following persons on behalf of the registrant and in the capacities and on the dates indicated.
| | |
| By (Signature and Title)* | | /s/ Mary E. Savino |
| | Mary E. Savino |
| | Principal Executive Officer |
| | |
| By (Signature and Title)* | | /s/ Gregory R. McNeil |
| | Gregory R. McNeil |
| | Principal Financial Officer |
* Print the name and title of each signing officer under his or her signature.