UNITED STATES
SECURITIES AND EXCHANGE COMMISSION
WASHINGTON, D.C. 20549
FORM N-CSR
CERTIFIED SHAREHOLDER REPORT OF REGISTERED MANAGEMENT
INVESTMENT COMPANIES
Investment Company Act file number: 811-22576
Ranger Funds Investment Trust
(Exact Name of Registrant as Specified in Charter)
1845 Woodall Rodgers
Suite 1000
Dallas, TX 75201
(Address of Principal Executive Offices)(Zip Code)
National Corporate Research, Ltd.
615 South DuPont Highway
Dover, Delaware 19901
(Name and Address of Agent for Service)
With copy to:
JoAnn M. Strasser, Thompson Hine LLP
41 South High Street, Suite 1700
Columbus, Ohio 43215
Registrant’s Telephone Number, including Area Code: (214) 871-5200
Date of fiscal year end: July 31st
Date of reporting period: July 31, 2024
Form N-CSR is to be used by management investment companies to file reports with the Commission not later than 10 days after the transmission to stockholders of any report that is required to be transmitted to stockholders under Rule 30e-1 under the Investment Company Act of 1940 (17 CFR 270.30e-1). The Commission may use the information provided on Form N-CSR in its regulatory, disclosure review, inspection and policymaking roles.
A registrant is required to disclose the information specified by Form N-CSR, and the Commission will make this information public. A registrant is not required to respond to the collection of information contained in Form N-CSR unless the Form displays a currently valid Office of Management and Budget ("OMB") control number. Please direct comments concerning the accuracy of the information collection burden estimate and any suggestions for reducing the burden to Secretary, Securities and Exchange Commission, 450 Fifth Street, NW, Washington, DC 20549-0609. The OMB has reviewed this collection of information under the clearance requirements of 44 U.S.C. § 3507.
Item 1. Reports to Stockholders.

ANNUAL SHAREHOLDER REPORT
July 31, 2024
RANGER SMALL CAP FUND – INSTITUTIONAL CLASS
RFISX
ADDITIONAL INFORMATION
This annual shareholder report contains important information about the Ranger Small Cap Fund – RFISX (the “Fund”) for the period August 1, 2023 to July 31, 2024. You can find additional information about the Fund at https://www.rangerfunds.com/. You can also request this information by contacting us at 1-866-458-4744.
expense Information
What were the Fund costs for the past year?
(based on a hypothetical $10,000 investment)
| Fund Name | Costs of a $10,000 investment | Costs paid as a percentage of a $10,000 investment* |
| | | |
| Ranger Small Cap Fund | $120.00 | 1.16% |
*Annualized
managment’s discussion of fund performance
The Small Cap Fund’s fiscal year faced challenges due to the Federal Reserve’s ongoing monetary tightening and “higher for longer” stance. The Fed Funds rate remained at 5.33%, with the last 25 basis point hike in July 2023. Despite no policy changes, economic releases caused volatile shifts in rate expectations. The Fund returned 7.7% for the fiscal year, underperforming the Russell 2000 Growth index’s 12.8% due to brief periods of low-quality stock leadership.
Rate expectation volatility drove market reactions, swinging between optimism and concern. By the end of Q3 2023, the Fund had a 10.1% year-to-date return, compared to the Russell 2000 Growth index’s 5.2%. Economic resilience and persistent core inflation pushed 10-year Treasury yields to 4.99% in mid-October. Sentiment shifted as the Fed reduced inflation, with core CPI dropping to 3.9% in December 2023 from 5.7% a year earlier. A rally began on October 27th, fueled by the Fed’s December signal of accommodation.
In Q4 2023, the Fund returned 9.2%, underperforming the Russell 2000 Growth index by 3.5%. Low-quality stocks led the late-quarter rally, with non-earning companies and the biotech sector performing strongly. December’s accommodative policy indication for 2024 suggested a potential soft landing, with the Fed hinting at three rate cuts. Q4 2023 GDP grew by 3.4%, marking six consecutive quarters of better-than-expected growth. By Q1 2024, GDP revisions continued to rise, and the Fed projected only one rate cut for the year.
In May, economic data weakened, and the Russell 2000 Growth index fell by 2.9% in Q2 2024. Over 30 central banks cut rates, and the Fed’s stance wavered as unemployment rose. For H1 2024, the Fund returned 1.8%, underperforming the Russell 2000 Growth index’s 4.4%. Quality stocks outperformed, while high-leverage and high-beta stocks also did well. Market capitalization disparities were significant, with the highest quintile returning 46.4% and the lowest quintiles underperforming.
Super Micro Computer (SMCI) was a standout, returning 188% in H1 2024 and significantly impacting the Russell 2000 Growth index. Mega Cap stocks dominated, with the top seven S&P 500 stocks generating 115% of Q2 returns. Micro and small-cap stocks traded at a discount to large caps. In July, as economic conditions supported monetary accommodation, small-cap stocks rallied. The Russell 2000 Growth index returned 8.2%, while the Fund returned 4.8%, led by low-quality stocks.
Short-term underperformance in a concentrated portfolio can create opportunities, especially in a normalized interest rate environment where quality growth stocks may excel.
Performance graph
AVERAGE ANNUAL RETURNS
| | 1 Year | 5 Years | 10 Years | Ending Value |
| Ranger Small Cap Fund | 7.73% | 7.06% | 9.72% | $ 632,254 |
| Russell 2000® Growth Index | 12.80% | 7.64% | 8.92% | $ 587,360 |
Cumulative Performance Comparison of $250,000 Investment
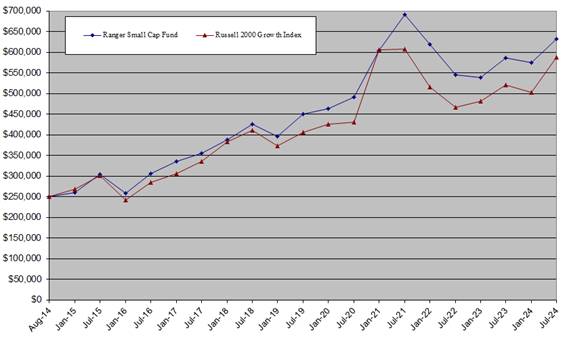
Past performance is not a good predictor of future performance. The returns shown do not reflect taxes that a shareholder would pay on Fund distributions or on the redemption of Fund shares. Updated performance data current to the most recent month-end can be obtained by calling 1-866-458-4744.
Fund statistics
NET ASSETS: $36,198,191 | PORTFOLIO HOLDINGS: 50 | PORTFOLIO TURNOVER: 35.55% | ADVISORY FEES PAID BY FUND: $168,319 |
SECTOR WEIGHTINGS
The following chart gives a visual breakdown of the Fund by the sectors the underlying securities represent as a percentage of the portfolio of investments.
top ten holdings (% Of Net Assets
| 1. | LeMaitre Vascular, Inc. | 3.99% |
| 2. | Texas Roadhouse, Inc. | 3.95% |
| 3. | Permian Resources Corp. Class A | 3.82% |
| 4. | Pegasystems, Inc. | 3.43% |
| 5. | Medpace Holdings, Inc. | 3.42% |
| 6. | Casella Waste Systems, Inc. Class A | 2.93% |
| 7. | Guidewire Software, Inc. | 2.91% |
| 8. | Repligen Corp. | 2.80% |
| 9. | TopBuild Corp. | 2.72% |
| 10. | WNS Holdings, Ltd. ADR | 2.62% |
| | Total % of Net Assets | 32.57% |
How has the fund changed
The Fund has not had any material changes during the year ended July 31, 2024.
Householding
To reduce Fund expenses, only one copy of most shareholder documents may be mailed to shareholders with multiple accounts at the same address (Householding). If you would prefer that your Ranger Small Cap Fund documents not be householded, please contact Ranger Funds at 1-866-458-4744, or contact your financial intermediary. Your instructions will typically be effective within 30 days of receipt by Ranger Funds or your financial intermediary.
For additional information about the Fund; including its prospectus, financial information, holdings and proxy information, visit https://www.rangerfunds.com/ or contact us at 1-866-458-4744.
| Ranger SmallCap Pie Chart | |
| | |
| Basic Materials | 1.23% |
| Consumer Discretionary | 16.06% |
| Consumer Staples | 3.87% |
| Energy | 7.42% |
| Financials | 5.86% |
| Healthcare | 18.26% |
| Industrials | 20.53% |
| Money Market Fund | 4.08% |
| Technology | 15.91% |
| Utilities | 6.78% |
| Ranger SmallCap Line Graph | |
| | Ranger SmallCap | Russell 2000 Growth |
| 8/1/2014 | 10000 | 10000 |
| 1/31/2015 | 10425 | 10746 |
| 7/31/2015 | 12140 | 12007 |
| 1/31/2016 | 10341 | 9670 |
| 7/31/2016 | 12245 | 11369 |
| 1/31/2017 | 13397 | 12267 |
| 7/31/2017 | 14206 | 13386 |
| 1/31/2018 | 15527 | 15321 |
| 7/31/2018 | 17014 | 16455 |
| 1/31/2019 | 15820 | 14921 |
| 7/31/2019 | 17983 | 16259 |
| 1/31/2020 | 18555 | 16999 |
| 7/31/2020 | 19649 | 17235 |
| 1/31/2021 | 24170 | 24256 |
| 7/31/2021 | 27668 | 24300 |
| 1/31/2022 | 24735 | 20606 |
| 7/31/2022 | 21779 | 18667 |
| 1/31/2023 | 21517 | 19267 |
| 7/31/2023 | 23476 | 20829 |
| 1/31/2024 | 23000 | 20127 |
| 7/31/2024 | 25290 | 23494 |
ANNUAL SHAREHOLDER REPORT
July 31, 2024
RANGER MICRO CAP FUND – INSTITUTIONAL CLASS
RFIMX
ADDITIONAL INFORMATION
This annual shareholder report contains important information about the Ranger Micro Cap Fund – RFIMX (the “Fund”) for the period August 1, 2023 to July 31, 2024. This report describes changes to the Fund that occurred during the reporting period. You can find additional information about the Fund at https://www.rangerfunds.com/. You can also request this information by contacting us at 1-866-458-4744.
expense Information
What were the Fund costs for the past year?
(based on a hypothetical $10,000 investment)
| Fund Name | Costs of a $10,000 investment | Costs paid as a percentage of a $10,000 investment* |
| | | |
| Ranger Micro Cap Fund | $144.00 | 1.43% |
*Annualized
managment’s discussion of fund performance
The Micro Cap Fund’s fiscal year faced challenges due to the Federal Reserve’s ongoing monetary tightening and “higher for longer” stance. The Fed Funds rate remained at 5.33%, with the last 25 basis point hike in July 2023. Despite no policy changes, economic releases caused volatile shifts in rate expectations. The Fund returned 1.8% for the fiscal year, underperforming the Russell Microcap Growth index’s 11.1% due to brief periods of low-quality stock leadership.
Rate expectation volatility drove market reactions, swinging between optimism and concern. By the end of Q3 2023, the Fund had a 5.3% year-to-date return, compared to the Russell Microcap Growth index’s -5.6%. Economic resilience and persistent core inflation pushed 10-year Treasury yields to 4.99% in mid-October. Sentiment shifted as the Fed reduced inflation, with core CPI dropping to 3.9% in December 2023 from 5.7% a year earlier. A rally began on October 27th, fueled by the Fed’s December signal of accommodation.
In Q4 2023, the Fund underperformed the Russell Microcap Growth index by 12.0%. Low-quality stocks led the late-quarter rally, with non-earning companies and the biotech sector performing strongly. December’s accommodative policy indication for 2024 suggested a potential soft landing, with the Fed hinting at three rate cuts. Q4 2023 GDP grew by 3.4%, marking six consecutive quarters of better-than-expected growth. By Q1 2024, GDP revisions continued to rise, and the Fed projected only one rate cut for the year.
In May, economic data weakened, and the Russell Microcap Growth index fell by 5.6% in Q2 2024. Over 30 central banks cut rates, and the Fed’s stance wavered as unemployment rose. For H1 2024, the Fund returned 7.7%, outperforming the Russell Microcap Growth index’s 0.7%. Quality stocks outperformed, while high-leverage and high-beta stocks also did well. Market capitalization disparities were significant, with the highest quintile returning 13.2% and the lowest quintiles underperforming.
Mega Cap stocks dominated, with the top seven S&P 500 stocks generating 115% of Q2 returns. Micro and small-cap stocks traded at a discount to large caps. In July, as economic conditions supported monetary accommodation, small-cap stocks rallied. The Russell Microcap Growth index returned 10.2%, while the Fund returned 6.7%, led by low-quality stocks.
Short-term underperformance in a concentrated portfolio can create opportunities, especially in a normalized interest rate environment where quality growth stocks may excel. Long-term Fund performance demonstrates the durability of quality growth, particularly during periods of lower speculation.
Performance graph
AVERAGE ANNUAL RETURNS
| | 1 Year | 5 Years | Since Inception | Ending Value |
| Ranger Micro Cap Fund | 1.84% | 13.05% | 11.34% | $484,136 |
| Russell Microcap® Growth Index | 11.06% | 5.45% | 1.96% | $281,714 |
Cumulative Performance Comparison of $250,000 Investment
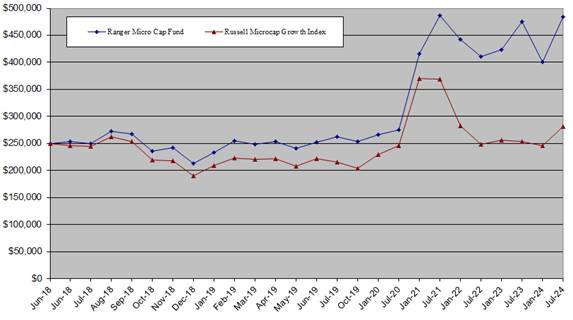
Past performance is not a good predictor of future performance. The returns shown do not reflect taxes that a shareholder would pay on Fund distributions or on the redemption of Fund shares. Updated performance data current to the most recent month-end can be obtained by calling 1-866-458-4744.
Fund statistics
NET ASSETS: $10,771,514 | PORTFOLIO HOLDINGS: 33 | PORTFOLIO TURNOVER: 36.75% | ADVISORY FEES PAID BY FUND: $15,690 |
SECTOR WEIGHTINGS
The following chart gives a visual breakdown of the Fund by the sectors the underlying securities represent as a percentage of the portfolio of investments.
top ten holdings (% of Net Assets)
| 1. | UFP Technologies, Inc. | 6.61% |
| 2. | LeMaitre Vascular, Inc. | 6.24% |
| 3. | PDF Solutions, Inc. | 4.36% |
| 4. | OneSpaWorld Holdings Ltd. | 4.33% |
| 5. | i3 Verticals, Inc. Class A | 4.17% |
| 6. | Aris Water Solutions, Inc. Class A | 4.15% |
| 7. | iRadimed Corp. | 4.00% |
| 8. | ANI Pharmaceuticals, Inc. | 3.83% |
| 9. | Mitek Systems, Inc. | 3.46% |
| 10. | BioLife Solutions, Inc. | 3.33% |
| | Total % of Net Assets | 44.49% |
How has the fund changed
This is a summary of certain changes to the Fund since April 1, 2024. For more information you may review the Fund’s next prospectus, which we expect to be available by November 28, 2024 at https://www.rangerfunds.com/documents/ or upon request at 1-866-458-4744.
Effective April 1, 2024, the investment advisory fees for the Fund changed from 1.25% to 1.00% per annum of the Fund’s average daily net assets. Additionally, effective April 1, 2024, the expense limitation for the Fund pursuant to the expense limitation agreement changed from 1.50% to 1.25% of the Fund’s average daily net assets until at least November 28, 2024.
Householding
To reduce Fund expenses, only one copy of most shareholder documents may be mailed to shareholders with multiple accounts at the same address (Householding). If you would prefer that your Ranger Micro Cap Fund documents not be householded, please contact Ranger Funds at 1-866-458-4744, or contact your financial intermediary. Your instructions will typically be effective within 30 days of receipt by Ranger Funds or your financial intermediary.
For additional information about the Fund; including its prospectus, financial information, holdings and proxy information, visit https://www.rangerfunds.com/ or contact us at 1-866-458-4744.
| Ranger Microcap Pie Chart | |
| | |
| Consumer Discretionary | 14.14% |
| Consumer Staples | 3.49% |
| Energy | 2.10% |
| Financials | 9.13% |
| Healthcare | 30.55% |
| Industrials | 14.41% |
| Money Market Fund | 5.71% |
| Technology | 14.77% |
| Utilities | 5.70% |
| Ranger MicroCap Line Graph | |
| | Ranger Microcap | Russell Microcap Growth |
| 6/6/2018 | 10000 | 10000 |
| 6/30/2018 | 10160 | 9819 |
| 7/31/2018 | 9990 | 9814 |
| 8/31/2018 | 10890 | 10502 |
| 9/30/2018 | 10720 | 10128 |
| 10/31/2018 | 9450 | 8759 |
| 11/30/2018 | 9690 | 8716 |
| 12/31/2018 | 8531 | 7603 |
| 1/31/2019 | 9334 | 8394 |
| 2/28/2019 | 10188 | 8951 |
| 3/31/2019 | 9927 | 8819 |
| 4/30/2019 | 10127 | 8898 |
| 5/31/2019 | 9646 | 8328 |
| 6/30/2019 | 10107 | 8857 |
| 7/31/2019 | 10489 | 8640 |
| 10/31/2019 | 10157 | 8161 |
| 1/31/2020 | 10649 | 9192 |
| 7/31/2020 | 11011 | 9854 |
| 1/31/2021 | 16641 | 14829 |
| 7/31/2021 | 19492 | 14751 |
| 1/31/2022 | 17694 | 11332 |
| 7/31/2022 | 16403 | 9919 |
| 1/31/2023 | 16935 | 10247 |
| 7/31/2023 | 19016 | 10146 |
| 1/31/2024 | 16026 | 9828 |
| 7/31/2024 | 19365 | 11269 |
Item 2. Code of Ethics.
(a) As of the end of the period covered by this report, the registrant has adopted a code of ethics that applies to the registrant's principal executive officer, principal financial officer, principal accounting officer or controller, or persons performing similar functions, regardless of whether these individuals are employed by the registrant or a third party.
(b) For purposes of this item, “code of ethics” means written standards that are reasonably designed to deter wrongdoing and to promote:
(1) Honest and ethical conduct, including the ethical handling of actual or apparent conflicts of interest between personal and professional relationships;
(2) Full, fair, accurate, timely, and understandable disclosure in reports and documents that a registrant files with, or submits to, the Commission and in other public communications made by the registrant;
(3) Compliance with applicable governmental laws, rules, and regulations;
(4) The prompt internal reporting of violations of the code to an appropriate person or persons identified in the code; and
(5) Accountability for adherence to the code.
(c) Amendments: During the period covered by the report, there have not been any amendments to the provisions of the code of ethics.
(d) Waivers: During the period covered by the report, the registrant has not granted any express or implicit waivers from the provisions of the code of ethics.
(e) The Code of Ethics is not posted on registrant’s website.
(f) A copy of the Code of Ethics is attached as an exhibit.
Item 3. Audit Committee Financial Expert.
(a) The registrant’s Board of Trustees has determined that it does not have an audit committee financial expert serving on its audit committee. At this time, the registrant believes that the experience provided by each member of the audit committee together offers the registrant adequate oversight for the registrant’s level of financial complexity.
Item 4. Principal Accountant Fees and Services.
FY 2024 $ 31,000
FY 2023 $ 30,000
Registrant
FY 2024 $ 1,107
FY 2023 $ 0
Nature of the fees: Semi-annual review fee.
Registrant
FY 2024 $ 9,000
FY 2023 $ 9,000
Nature of the fees: Tax preparation and filing.
Registrant
FY 2024 $ 0
FY 2023 $ 0
Nature of the fees: Not applicable.
| (e) | (1) Audit Committee’s Pre-Approval Policies |
The audit committee approves all audit and non-audit related services and, therefore, has not adopted pre-approval policies and procedures described in paragraph (c)(7) of Rule 2-01 of Regulation S-X.
| (2) | Percentages of Services Approved by the Audit Committee |
None of the services described in paragraph (b) through (d) of this Item were approved by the audit committee pursuant to paragraph (c)(7)(i)(C) of Rule 2-01 of Regulation S-X.
(f) During audit of registrant's financial statements for the most recent fiscal year, less than 50 percent of the hours expended on the principal accountant's engagement were attributed to work performed by persons other than the principal accountant's full-time, permanent employees.
(g) The aggregate non-audit fees billed by the registrant's accountant for services rendered to the registrant, and rendered to the registrant's investment adviser (not including any sub-adviser whose role is primarily portfolio management and is subcontracted with or overseen by another investment adviser), and any entity controlling, controlled by, or under common control with the adviser that provides ongoing services to the registrant:
Registrant
FY 2024 $ 9,000
FY 2023 $ 9,000
(h) The registrant's audit committee has not considered whether the provision of non-audit services to the registrant's investment adviser (not including any sub-adviser whose role is primarily portfolio management and is subcontracted with or overseen by another investment adviser), and any entity controlling, controlled by, or under common control with the investment adviser that provides ongoing services to the registrant, that were not pre-approved pursuant to paragraph (c)(7)(ii) of Rule 2-01 of Regulation S-X, is compatible with maintaining the principal accountant's independence.
(i) Not applicable.
(j) Not applicable.
Item 5. Audit Committee of Listed Companies. Not applicable.
Item 6. Schedule of Investments. Not applicable – Schedule filed with Item 7.
Item 7. Financial Statements and Financial Highlights for Open-End Management Companies.

Ranger Funds Investment Trust
Ranger Small Cap Fund
Institutional Class (RFISX)
Ranger Micro Cap Fund
Institutional Class (RFIMX)
ANNUAL FINANCIAL STATEMENTS
JULY 31, 2024
| | | | | |
| | | | RANGER FUNDS INVESTMENT TRUST | |
| | | | RANGER SMALL CAP FUND | |
| | | | SCHEDULE OF INVESTMENTS | |
| | | | JULY 31, 2024 | |
| | | | | |
| | Shares | | | Value |
| | | | | |
| COMMON STOCKS - 96.05% | |
| | | | | |
| | Aerospace - 0.79% | |
| | 42,585 | | Aersale Corp. | $ 287,023 |
| | | | | |
| | Apparel Retailers - 2.41% | |
| | 6,535 | | Boot Barn Holdings, Inc. * | 872,292 |
| | | | | |
| | Banks - 5.87% | |
| | 32,027 | | Home Bancshares, Inc. | 907,325 |
| | 7,761 | | Triumph Financial, Inc. * | 704,156 |
| | 15,604 | | Cadence Bank | 512,903 |
| | | | | 2,124,384 |
| | Biotechnology - 3.42% | |
| | 3,233 | | Medpace Holdings, Inc. * | 1,236,687 |
| | | | | |
| | Building: Climate Control - 0.99% | |
| | 4,050 | | AAON, Inc. | 358,546 |
| | | | | |
| | Building Materials: Other - 5.27% | |
| | 2,055 | | TopBuild Corp. * | 983,400 |
| | 20,637 | | The AZEK Co., Inc. Class A * | 926,395 |
| | | | | 1,909,795 |
| | Commercial Vehicle - Equipment Leasing - 1.70% | |
| | 15,040 | | WillScot Holdings Corp. Class A * | 616,640 |
| | | | | |
| | Commercial Vehicles and Parts - 1.80% | |
| | 6,505 | | Federal Signal Corp. | 650,305 |
| | | | | |
| | Computer Services - 3.57% | |
| | 5,105 | | Qualys, Inc. * | 761,360 |
| | 7,225 | | Workiva, Inc. Class A * | 532,988 |
| | | | | 1,294,348 |
| | Cosmetics - 1.99% | |
| | 4,175 | | e.l.f. Beauty, Inc. * | 720,521 |
| | | | | |
| | Electronic Equipment: Control and Filter - 1.43% | |
| | 2,750 | | MSA Safety, Inc. | 518,788 |
| | | | | |
| | Electronic Equipment: Gauges and Meters - 1.41% | |
| | 4,449 | | Mesa Laboratories, Inc. | 509,499 |
| | | | | |
| | Food Products - 1.20% | |
| | 2,570 | | J&J Snack Foods Corp. | 433,559 |
| | | | | |
| | Food Retailers and Wholesalers - 2.68% | |
| | 6,320 | | Sprouts Farmers Market, Inc. * | 631,305 |
| | 17,361 | | Grocery Outlet Holding Corp. * | 339,581 |
| | | | | 970,886 |
| | Footwear - 1.64% | |
| | 13,065 | | Steven Madden, Ltd. | 592,367 |
| | | | | |
| | Gas Distribution - 2.09% | |
| | 37,565 | | Excelerate Energy, Inc. Class A | 756,183 |
| | | | | |
| | Health Care Management Services - 3.61% | |
| | 25,920 | | Option Care Health, Inc. * | 769,565 |
| | 6,860 | | HealthEquity, Inc. * | 538,373 |
| | | | | 1,307,938 |
| | Health Care Services - 2.25% | |
| | 1,427 | | Chemed Corp. | 813,618 |
| | | | | |
| | Home Construction - 1.90% | |
| | 8,436 | | Champion Homes, Inc. * | 687,618 |
| | | | | |
| | Household Furnishings - 1.14% | |
| | 27,260 | | Arhaus, Inc. Class A | 414,079 |
| | | | | |
| | Medical Equipment - 6.79% | |
| | 16,626 | | LeMaitre Vascular, Inc. | 1,444,633 |
| | 6,060 | | Repligen Corp. * | 1,014,141 |
| | | | | 2,458,774 |
| | Medical Supplies - 1.02% | |
| | 5,375 | | Conmed Corp. | $ 371,090 |
| | | | | |
| | Oil: Crude Producers - 5.90% | |
| | 90,040 | | Permian Resources Corp. Class A | 1,381,214 |
| | 27,640 | | Magnolia Oil & Gas Corp. Class A | 752,914 |
| | | | | 2,134,128 |
| | Oil Equipment & Services - 1.53% | |
| | 18,460 | | Oceaneering International, Inc. * | 554,169 |
| | | | | |
| | Pharmaceuticals - 1.19% | |
| | 6,565 | | ANI Pharmaceuticals, Inc. * | 431,452 |
| | | | | |
| | Professional Business Support Services - 3.51% | |
| | 15,908 | | WNS Holdings, Ltd. ADR (India) * | 947,799 |
| | 2,140 | | Paylocity Holdings Corp. * | 321,150 |
| | | | | 1,268,949 |
| | Recreational Services - 2.28% | |
| | 51,210 | | OneSpaWorld Holdings Ltd. (Bahamas) * | 823,969 |
| | | | | |
| | Restaurants and Bars - 3.95% | |
| | 8,185 | | Texas Roadhouse, Inc. | 1,429,183 |
| | | | | |
| | Software - 12.36% | |
| | 17,810 | | Pegasystems, Inc. | 1,241,713 |
| | 7,015 | | Guidewire Software, Inc. * | 1,052,741 |
| | 17,693 | | Simulations Plus, Inc. | 722,582 |
| | 16,364 | | PDF Solutions, Inc. * | 574,213 |
| | 2,345 | | AppFolio, Inc. Class A * | 519,371 |
| | 17,132 | | DoubleVerify Holdings, Inc. * | 361,828 |
| | | | | 4,472,448 |
| | Specialty Chemicals - 1.23% | |
| | 2,445 | | Quaker Chemical Corp. | 443,939 |
| | | | | |
| | Specialty Retailers - 0.78% | |
| | 4,070 | | America's Car-Mart, Inc. * | 281,847 |
| | | | | |
| | Transaction Processing Services - 2.69% | |
| | 55,300 | | Repay Holdings Corp. Class A * | 531,986 |
| | 18,016 | | i3 Verticals, Inc. Class A * | 441,572 |
| | | | | 973,558 |
| | Trucking - 0.96% | |
| | 830 | | SAIA, Inc. * | 346,815 |
| | | | | |
| | Waste and Disposal Services - 2.93% | |
| | 10,235 | | Casella Waste Systems, Inc. Class A * | 1,059,937 |
| | | | | |
| | Water - 1.77% | |
| | 36,197 | | Aris Water Solutions, Inc. Class A | 641,049 |
| | | | | |
| | TOTAL FOR COMMON STOCKS (Cost $29,332,729) - 96.05% | $ 34,766,383 |
| | | | | |
| SHORT-TERM INVESTMENT - 4.08% | |
| | 1,478,409 | | Fidelity Investments Money Market Treasury Portfolio - Class III 4.95% ** (Cost $1,478,409) | $ 1,478,409 |
| | | | | |
| TOTAL INVESTMENTS (Cost $30,811,138) - 100.13% | $ 36,244,792 |
| | | | | |
| LIABILITIES LESS OTHER ASSETS - (0.13)% | (46,601) |
| | | | | |
| NET ASSETS - 100.00% | $ 36,198,191 |
| | | | | |
| | ADR - American Depositary Receipts. | |
| | * Non-income producing securities during the period. | |
| | ** The rate shown represents the yield at July 31, 2024. | |
| | The accompanying notes are an integral part of these financial statements. | |
| | | | | |
| | | | RANGER FUNDS INVESTMENT TRUST | |
| | | | RANGER MICRO CAP FUND | |
| | | | SCHEDULE OF INVESTMENTS | |
| | | | JULY 31, 2024 | |
| | | | | |
| | | | | |
| | Shares | | | Value |
| | | | | |
| COMMON STOCKS - 94.46% | |
| | | | | |
| | Aerospace - 1.18% | |
| | 18,916 | | AerSale Corp. * | $ 127,494 |
| | | | | |
| | Apparel Retailers - 2.53% | |
| | 2,040 | | Boot Barn Holdings, Inc. * | 272,299 |
| | | | | |
| | Auto Parts - 2.42% | |
| | 15,485 | | Stoneridge, Inc. * | 260,303 |
| | | | | |
| | Banks - 9.15% | |
| | 13,855 | | Business First Bancshares, Inc. | 352,194 |
| | 6,100 | | Metropolitan Bank Holding Corp. * | 321,653 |
| | 3,432 | | Triumph Financial, Inc. * | 311,385 |
| | | | | 985,232 |
| | Biotechnology - 2.69% | |
| | 2,656 | | Ligand Pharmaceuticals, Inc. Class B * | 289,477 |
| | | | | |
| | Electronic Equipment: Control and Filter - 2.13% | |
| | 4,107 | | NAPCO Security Technologies, Inc. | 229,212 |
| | | | | |
| | Electronic Equipment: Gauges and Meters -2.71% | |
| | 2,546 | | Mesa Laboratories, Inc. | 291,568 |
| | | | | |
| | Electronic Equipment: Other - 2.10% | |
| | 7,808 | | Allient, Inc. | 225,964 |
| | | | | |
| | Farming, Fishing, Ranching & Plantations - 2.05% | |
| | 6,055 | | Vital Farms, Inc. * | 220,947 |
| | | | | |
| | Gas Distribution - 1.56% | |
| | 8,330 | | Excelerate Energy, Inc. Class A | 167,683 |
| | | | | |
| | Home Construction - 1.39% | |
| | 2,050 | | Green Brick Partners, Inc. * | 149,957 |
| | | | | |
| | Medical Equipment - 15.40% | |
| | 7,735 | | LeMaitre Vascular, Inc. | $ 672,094 |
| | 9,235 | | iRadimed Corp. | 431,367 |
| | 14,953 | | BioLife Solutions, Inc. * | 359,171 |
| | 28,476 | | InfuSystem Holdings, Inc. * | 196,484 |
| | | | | 1,659,116 |
| | Medical Supplies - 8.68% | |
| | 2,215 | | UFP Technologies, Inc. * | 712,322 |
| | 3,200 | | Utah Medical Products, Inc. | 222,720 |
| | | | | 935,042 |
| | Oil: Crude Producers - 2.11% | |
| | 40,390 | | Evolution Petroleum Corp., Inc. Class A | 226,992 |
| | | | | |
| | Pharmaceuticals - 3.83% | |
| | 6,276 | | ANI Pharmaceuticals, Inc. * | 412,459 |
| | | | | |
| | Recreational Services - 4.33% | |
| | 29,005 | | OneSpaWorld Holdings Ltd. (Bahamas) * | 466,690 |
| | | | | |
| | Restaurants and Bars - 1.61% | |
| | 3,020 | | Kura Sushi USA, Inc. Class A * | 173,620 |
| | | | | |
| | Semiconductors - 2.60% | |
| | 3,135 | | NVE Corp. | 279,955 |
| | | | | |
| | Soft Drinks - 1.44% | |
| | 6,010 | | Vita Coco Co., Inc. * | 155,298 |
| | | | | |
| | Software - 12.20% | |
| | 13,380 | | PDF Solutions, Inc. * | 469,504 |
| | 28,015 | | Mitek Systems, Inc. * | 372,880 |
| | 8,515 | | Simulations Plus, Inc. | 347,753 |
| | 5,150 | | PROS Holdings, Inc. * | 124,115 |
| | | | | 1,314,252 |
| | Specialty Retailers - 1.88% | |
| | 2,922 | | America's Car-Mart, Inc. * | 202,349 |
| | | | | |
| | Transaction Processing Services - 6.32% | |
| | 18,326 | | I3 Verticals, Inc. Class A * | $ 449,170 |
| | 24,080 | | Repay Holdings Corp. Class A * | 231,650 |
| | | | | 680,820 |
| | Water - 4.15% | |
| | 25,279 | | Aris Water Solutions, Inc. Class A | 447,691 |
| | | | | |
| | TOTAL FOR COMMON STOCKS (Cost $8,907,346) - 94.46% | $ 10,174,420 |
| | | | | |
| SHORT-TERM INVESTMENT - 5.71% | |
| | 615,747 | | Fidelity Investments Money Market Treasury Portfolio - Class III 4.95% ** (Cost $615,747) | $ 615,747 |
| | | | | |
| TOTAL INVESTMENTS (Cost $9,523,093) - 100.17% | $ 10,790,167 |
| | | | | |
| LIABILITIES LESS OTHER ASSETS - (0.17)% | (18,653) |
| | | | | |
| NET ASSETS - 100.00% | $ 10,771,514 |
| | | | | |
| | * Non-income producing securities during the period. | |
| | ** The rate shown represents the yield at July 31, 2024. | |
| | The accompanying notes are an integral part of these financial statements. | |
| | | | | | |
| RANGER FUNDS INVESTMENT TRUST |
| STATEMENTS OF ASSETS AND LIABILITIES |
| JULY 31, 2024 |
| | | | | | |
| Assets: | | Small Cap Fund | | Micro Cap Fund | |
| Investments In Securities, At Value (Cost $30,811,138, and $9,523,093, respectively) | $ 36,244,792 | | $ 10,790,167 | |
| Cash | | 1,000 | | - | |
| Receivables: | | | | |
| Dividends | 7,899 | | 5,941 | |
| Shareholder Subscriptions | - | | 5,545 | |
| Prepaid Expenses | 5,221 | | 3,629 | |
| Total Assets | 36,258,912 | | 10,805,282 | |
| Liabilities: | | | | | |
| Payables: | | | | |
| Investments Purchased | - | | 8,299 | |
| Shareholder Redemptions | 19,241 | | - | |
| Advisory Fees | 10,331 | | 533 | |
| Administrative Fees | 1,476 | | 432 | |
| Audit Fees | 21,000 | | 21,000 | |
| Transfer Agent Fees | 3,455 | | 2,137 | |
| Other Expenses | 5,218 | | 1,367 | |
| Total Liabilities | 60,721 | | 33,768 | |
| Net Assets | | $ 36,198,191 | | $ 10,771,514 | |
| | | | | | |
| Net Assets Consist Of: | | | | |
| Paid In Capital | $ 31,864,635 | | $ 9,921,480 | |
| Distributable Earnings | 4,333,556 | | 850,034 | |
| Net Assets | | $ 36,198,191 | | $ 10,771,514 | |
| | | | | | |
| Institutional Class: | | | | | |
| | | | | | |
| Net Assets | | $ 36,198,191 | | $ 10,771,514 | |
| Shares Outstanding (unlimited number of shares authorized with no par value) | 1,987,040 | | 1,440,968 | |
| Net Asset Value, Redemption Price And Offering Price Per Share | $ 18.22 | | $ 7.48 | |
| | | | | | |
| | | | | | |
| The accompanying notes are an integral part of these financial statements. | | | | |
| | | | | |
| RANGER FUNDS INVESTMENT TRUST |
| STATEMENTS OF OPERATIONS |
| FOR THE YEAR ENDED JULY 31, 2024 |
| | | | | |
| | | | | |
| Investment Income: | Small Cap Fund | | Micro Cap Fund |
| Dividends | $ 256,576 | | $ 64,386 |
| Total Investment Income | 256,576 | | 64,386 |
| | | | | |
| Expenses: | | | | |
| Advisory Fees (Note 5) | 321,133 | | 78,510 |
| Administrative and Operating Servicing Fees (Note 5) | 20,987 | | 8,410 |
| Audit Fees | 23,054 | | 23,054 |
| Transfer Agent & Accounting Fees | 41,505 | | 18,355 |
| Registration Fees | 4,416 | | 3,012 |
| Custody Fees | 8,872 | | 3,282 |
| Insurance Fees | 11,266 | | 1,356 |
| Trustee Fees | 2,500 | | 2,397 |
| Printing Fees | 432 | | 132 |
| NASDAQ Fees | 779 | | 769 |
| Shareholder Servicing Fees | 17,970 | | 1,828 |
| Miscellaneous Fees | 4,731 | | 4,395 |
| Legal Fees | 64,953 | | 14,710 |
| Total Expenses | 522,598 | | 160,210 |
| Advisory Fees Waived (Note 5) | (152,814) | | (62,820) |
| Net Expenses | 369,784 | | 97,390 |
| | | | | |
| Net Investment Loss | (113,208) | | (33,004) |
| | | | | |
| Realized And Unrealized Gain (Loss) On Investments: | | | |
| Realized Loss On Investments | (588,421) | | (144,463) |
| Net Change In Unrealized Appreciation On Investments | 3,080,435 | | 568,538 |
| Net Realized And Unrealized Gain On Investments | 2,492,014 | | 424,075 |
| | | | | |
| Net Increase In Net Assets Resulting From Operations | $ 2,378,806 | | $ 391,071 |
| | | | | |
| | | | | |
| The accompanying notes are an integral part of these financial statements. | | | |
| | | | | |
| RANGER FUNDS INVESTMENT TRUST |
| RANGER SMALL CAP FUND |
| STATEMENTS OF CHANGES IN NET ASSETS |
| | | | | |
| | | | | |
| | | | | |
| | | Year Ended | | Year Ended |
| | | July 31, 2024 | | July 31, 2023 |
| Increase (Decrease) In Net Assets From Operations: | | | |
| Net Investment Loss | $ (113,208) | | $ (152,229) |
| Net Realized Gain (Loss) On Investments | (588,421) | | 2,101,050 |
| Net Change In Unrealized Appreciation On Investments | 3,080,435 | | 1,023,811 |
| Net Increase In Net Assets Resulting From Operations | 2,378,806 | | 2,972,632 |
| | | | | |
| Distributions Paid To Shareholders | (1,946,692) | | (1,202,235) |
| | | | | |
| Capital Share Transactions (Note 7) | 4,141,779 | | (3,250,586) |
| | | | | |
| Total Increase (Decrease) In Net Assets | 4,573,893 | | (1,480,189) |
| | | | | |
| Net Assets: | | | | |
| Beginning Of Year | 31,624,298 | | 33,104,487 |
| | | | | |
| End Of Year | $ 36,198,191 | | $ 31,624,298 |
| | | | | |
| The accompanying notes are an integral part of these financial statements. | | | |
| | | | | |
| RANGER FUNDS INVESTMENT TRUST |
| RANGER MICRO CAP FUND |
| STATEMENTS OF CHANGES IN NET ASSETS |
| | | | | |
| | | | | |
| | | | | |
| | | Year Ended | | Year Ended |
| | | July 31, 2024 | | July 31, 2023 |
| Increase (Decrease) In Net Assets From Operations: | | | |
| Net Investment Loss | $ (33,004) | | $ (34,559) |
| Net Realized Gain (Loss) On Investments | (144,463) | | 1,803,271 |
| Net Change In Unrealized Appreciation (Depreciation) On Investments | 568,538 | | (874,051) |
| Net Increase In Net Assets Resulting From Operations | 391,071 | | 894,661 |
| | | | | |
| Distributions Paid To Shareholders | (47,144) | | (1,968,499) |
| | | | | |
| Capital Share Transactions (Note 7) | 3,453,810 | | (5,580,328) |
| | | | | |
| Total Increase (Decrease) In Net Assets | 3,797,737 | | (6,654,166) |
| | | | | |
| Net Assets: | | | | |
| Beginning Of Year | 6,973,777 | | 13,627,943 |
| | | | | |
| End Of Year | $ 10,771,514 | | $ 6,973,777 |
| | | | | |
| | | | | |
| The accompanying notes are an integral part of these financial statements. | | | |
| | | | | | | | | | | | |
| RANGER FUNDS INVESTMENT TRUST | |
| RANGER SMALL CAP FUND | |
| INSTITUTIONAL CLASS | |
| FINANCIAL HIGHLIGHTS | |
| SELECTED DATA FOR AN INSTITUTIONAL CLASS SHARE OUTSTANDING THROUGHOUT THE YEAR. | |
| | | | | | | | | | | | |
| | | | | | | | | | | | |
| | | | | | | | | | | | |
| | | | | | | | | | | | |
| | | Years Ended | |
| | | 7/31/2024 | | 7/31/2023 | | 7/31/2022 | | 7/31/2021 | | 7/31/2020 | |
| | | | | | | | | | | | |
| Net Asset Value, At Beginning of Year | $ 17.97 | | $ 17.31 | | $ 24.20 | | $ 18.33 | | $ 17.87 | |
| | | | | | | | | | | | |
| Income (Loss) From Investment Operations: | | | | | | | | | | |
| Net Investment Loss * | (0.06) | | (0.07) | | (0.12) | | (0.17) | | (0.11) | |
| Net Gain (Loss) On Securities (Realized And Unrealized) | 1.39 | | 1.30 | | (4.49) | | 7.47 | | 1.68 | |
| Total From Investment Operations | 1.33 | | 1.23 | | (4.61) | | 7.30 | | 1.57 | |
| | | | | | | | | | | | |
| Distributions: | | | | | | | | | | | |
| Realized Gains | (1.08) | | (0.57) | | (2.28) | | (1.43) | | (1.11) | |
| Total From Distributions | (1.08) | | (0.57) | | (2.28) | | (1.43) | | (1.11) | |
| | | | | | | | | | | | |
| Net Asset Value, At End Of Year | $ 18.22 | | $ 17.97 | | $ 17.31 | | $ 24.20 | | $ 18.33 | |
| | | | | | | | | | | | |
| Total Return ** | 7.73% | | 7.80% | | (21.29)% | | 40.81% | | 9.26% | |
| | | | | | | | | | | | |
| Ratios/Supplemental Data: | | | | | | | | | | |
| Net Assets At End Of Year (Thousands) | $ 36,198 | | $ 31,624 | | $ 33,104 | | $ 41,688 | | $ 25,375 | |
| Before Waivers | | | | | | | | | | |
| Ratio Of Expenses To Average Net Assets | 1.63% | (a) | 1.49% | (a) | 1.40% | (a) | 1.40% | (a) | 1.42% | |
| After Waivers | | | | | | | | | | |
| Ratio Of Expenses To Average Net Assets | 1.16% | (b) | 1.15% | (b) | 1.14% | (b) | 1.11% | (b) | 1.10% | |
| Ratio Of Net Investment Loss To Average Net Assets | (0.35)% | | (0.43)% | | (0.57)% | | (0.80)% | | (0.66)% | |
| Portfolio Turnover | 35.55% | | 59.26% | | 31.38% | | 42.49% | | 58.92% | |
| | | | | | | | | | | | |
| * Per share net investment income (loss) has been determined on the basis of average shares outstanding during the period. | | | |
| ** Assumes reinvestment of dividends. | | | | | | | | | | |
| (a) Expenses before waivers (excluding shareholder servicing fees of 0.06%, 0.06%, 0.04% and 0.01%) was 1.57%, 1.44%, 1.36% and 1.39%, for the years ended |
| July 31, 2024, 2023, 2022 and 2021, respectively. | | | | | | | | | | |
| (b) Expenses after waivers (excluding shareholder servicing fees of 0.06%, 0.06%, 0.04% and 0.01%) was 1.10%, 1.10%, 1.10% and 1.10%, for the years ended |
| July 31, 2024, 2023, 2022 and 2021, respectively. | | | | | | | | | | |
| The accompanying notes are an integral part of these financial statements. | | | | | | | | | |
| | | | | | | | | | | |
| RANGER FUNDS INVESTMENT TRUST |
| RANGER MICRO CAP FUND |
| INSTITUTIONAL CLASS |
| FINANCIAL HIGHLIGHTS |
| SELECTED DATA FOR AN INSTITUTIONAL CLASS SHARE OUTSTANDING THROUGHOUT THE YEAR. |
| | | | | | | | | | | |
| | | | | | | | | | | |
| | | | | | | | | | | |
| | | | | | | | | | | |
| | | Years Ended |
| | | 7/31/2024 | | 7/31/2023 | | 7/31/2022 | | 7/31/2021 | | 7/31/2020 |
| | | | | | | | | | | |
| Net Asset Value, At Beginning of Year | $ 7.40 | | $ 9.53 | | $ 19.42 | | $ 10.97 | | $ 10.45 |
| | | | | | | | | | | |
| Income (Loss) From Investment Operations: | | | | | | | | | |
| Net Investment Loss * | (0.03) | | (0.04) | | (0.09) | | (0.15) | | (0.09) |
| Net Gain (Loss) On Securities (Realized And Unrealized) | 0.16 | | 0.78 | | (1.35) | | 8.60 | | 0.61 |
| Total From Investment Operations | 0.13 | | 0.74 | | (1.44) | | 8.45 | | 0.52 |
| | | | | | | | | | | |
| Distributions: | | | | | | | | | | |
| Realized Gains | (0.05) | | (2.87) | | (8.45) | | - | | - |
| Total From Distributions | (0.05) | | (2.87) | | (8.45) | | - | | - |
| | | | | | | | | | | |
| Net Asset Value, At End Of Year | $ 7.48 | | $ 7.40 | | $ 9.53 | | $ 19.42 | | $ 10.97 |
| | | | | | | | | | | |
| Total Return ** | 1.84% | | 15.93% | | (15.84)% | | 77.03% | | 4.98% |
| | | | | | | | | | | |
| Ratios/Supplemental Data: | | | | | | | | | |
| Net Assets At End Of Year (Thousands) | $ 10,772 | | $ 6,974 | | $ 13,628 | | $ 15,635 | | $ 17,821 |
| Before Waivers | | | | | | | | | |
| Ratio Of Expenses To Average Net Assets | 2.35% | (a) | 2.30% | (a) | 1.88% | (a) | 1.81% | (a) | 1.74% |
| After Waivers | | | | | | | | | |
| Ratio Of Expenses To Average Net Assets | 1.43% | (b) | 1.53% | (b) | 1.51% | (b) | 1.50% | (b) | 1.50% |
| Ratio Of Net Investment Loss To Average Net Assets | (0.48)% | | (0.50)% | | (0.77)% | | (1.01)% | | (0.89)% |
| Portfolio Turnover | 36.75% | | 35.70% | | 26.88% | | 56.25% | | 45.96% |
| | | | | | | | | | | |
| * Per share net investment income (loss) has been determined on the basis of average shares outstanding during the period. | | | | |
| ** Assumes reinvestment of dividends. | | | | | | | | | |
| (a) Expenses before waivers (excluding shareholder servicing fees of 0.03%, 0.03%, 0.01% and less than 0.01%) was 2.32%, 2.27%, 1.87% and 1.80%, for the years |
| ended July 31, 2024, 2023, 2022 and 2021, respectively. | | | | | | | | | |
| (b) Expenses after waivers (excluding shareholder servicing fees of 0.03%, 0.03%, 0.01% and less than 0.01%) was 1.40%, 1.50%, 1.50% and 1.50%, for the years |
| ended July 31, 2024, 2023, 2022 and 2021, respectively. | | | | | | | | | |
| The accompanying notes are an integral part of these financial statements. | | | | | | | | |
Ranger Funds Investment Trust
Notes to Financial Statements
July 31, 2024
Note 1. Organization
Ranger Funds Investment Trust (the “Trust”), is an open-end investment company registered under the Investment Company Act of 1940, as amended (the “1940 Act”). The affairs of the Trust are managed by the Trust’s Board of Trustees (the “Board” or “Trustees”). The Trust was organized on June 21, 2011, as a Delaware Statutory Trust. The Trust currently offers shares of beneficial interest (“shares”) of two series: Ranger Small Cap Fund and Ranger Micro Cap Fund (each a “Fund” and collectively the “Funds”). Ranger Small Cap Fund (“Small Cap Fund”) is a diversified portfolio with an investment objective to seek long-term capital appreciation. Ranger Micro Cap Fund (“Micro Cap Fund”) is a diversified portfolio with an investment objective to seek long-term capital appreciation. Each Fund has Institutional Class Shares and Investor Class Shares; however, the Funds do not currently offer their Investor Class shares for sale. The Declaration of Trust permits the Board to create additional funds and share classes.
Ranger Investment Management, L.P. (“Ranger Investment”) serves as investment adviser to the Funds. Ranger Investment is referred to as the “Adviser.”
Note 2. Significant Accounting Policies
The following is a summary of the significant accounting policies followed by the Funds in the preparation of their financial statements. The Funds are investment companies and accordingly follow the investment company accounting and reporting guidance of the Financial Accounting Standards Board (“FASB”) Accounting Standards Codification Topic 946 “Financial Services – Investment Companies,” including Accounting Standards Updated 2013-08.
Trust expenses for the Funds are allocated based on their relative net assets within the Trust or allocated based on the number of Funds within the Trust.
Security Valuations: All investments in securities are recorded at their estimated fair value, as described in Note 4.
Federal Income Taxes: The Funds make no provision for federal income or excise tax. The Funds intend to qualify each year as “regulated investment companies” (“RICs”) under subchapter M of the Internal Revenue Code of 1986, as amended, by complying with the requirements applicable to RICs and by distributing substantially all of their taxable income. The Funds also intend to distribute sufficient net investment income and net capital gains, if any, so that they will not be subject to excise tax on undistributed income and gains. If the required amount of net investment income or gains is not distributed, the Funds could incur a tax expense. Therefore, no federal income tax or excise provision is required.
The Funds recognize the tax benefits of uncertain tax positions only when the position is more likely than not to be sustained, assuming examination by tax authorities. Management has analyzed the Funds’ tax positions and concluded that no liability for unrecognized tax benefits should be recorded related to uncertain tax positions taken on returns filed for open tax years (2021-2023) or expected to be taken in the Funds’ 2024 tax returns. The Funds identify their major tax jurisdiction as U.S. Federal, however the Funds are not aware of any tax positions for which it is reasonably possible that the total amounts of unrecognized tax benefits will change materially in the next 12 months.
The Funds recognize interest and penalties, if any, related to unrecognized tax benefits as income tax expense in the Statements of Operations. During the year ended July 31, 2024, the Funds did not incur any interest or penalties.
Distributions to Shareholders: Distributions to shareholders, which are determined in accordance with income tax regulations, are recorded on the ex-dividend date. For financial reporting purposes the treatment of distributions made to shareholders during the year from net investment income, net realized capital, or return of capital gains may differ from their ultimate treatment for federal income tax purposes. These differences are caused primarily by differences in the timing of the recognition of certain components of income, expense or realized capital gains for federal income tax purposes. Where such differences are permanent in nature, they are reclassified in the components of the net assets based on their ultimate characterization for federal income tax purposes. Any such reclassifications will have no effect on net assets, results of operations or net asset value per share of the Funds.
Use of Estimates: The preparation of financial statements in conformity with accounting principles generally accepted in the United States (“GAAP”) requires management to make estimates and assumptions that affect the reported amounts of assets and liabilities and disclosure of contingent assets and liabilities at the date of the financial statements and the reported amounts of increases and decreases in net assets from operations during the reporting period. Actual results could differ from those estimates.
Investment transactions and related investment income: The Funds record security transactions on the trade date. The specific identification method is used for determining gains or losses for financial statement and income tax purposes. Dividend income is recognized on the ex-dividend date. Interest income is recognized on an accrual basis. Withholding taxes on foreign dividends have been provided for in accordance with the Funds’ understanding of the applicable country’s tax rules and rates. Distributions received from certain investments held by the Funds may be comprised of dividends, realized gains and returns of capital. The amounts may subsequently be reclassified upon receipt of information from the issuer.
Share Valuation: The net asset value per share of each class of shares for the Funds are calculated daily by dividing the total value of each Fund’s assets attributable to that class, less liabilities attributable to that class, by the number of shares of that class outstanding. The offering price and redemption price per share of each class of the Funds is equal to the net asset value per share.
Share Class Accounting: Investment income, common expenses and realized/unrealized gains (losses) on investments are allocated to each respective share class of the respective Fund on the basis of the daily net assets of each class. Fees relating to a specific class are charged directly to that share class.
Each class of shares has proportionate rights as to assets of the respective Funds, and the classes are identical except for ongoing distribution fees. Investor Class shares are subject to distribution fees, whereas Institutional Class shares are not. All classes have equal voting privileges, except where otherwise required by law or when the Trustees determine that the matter to be voted on affects only the interests of the shareholders of a particular class.
Guarantees and Indemnifications: In the normal course of business, the Funds enter into contracts with service providers that contain general indemnification clauses. The Funds’ maximum exposure under these arrangements is unknown and would involve future claims against the Funds that have not yet occurred. Based on experience, the Funds would expect the risk of loss to be remote.
Note 3. Risks
An investment in the Funds is subject to a variety of risk, including the possible loss of investment capital. Additional risks associated with the Funds include, but are not limited to:
Micro and Small Capitalization Risk: Micro or small capitalization companies may be more at risk than large capitalization companies because, among other things, they may have limited product lines, operating history, market or financial resources, or because they may depend on a limited management group. The prices of securities of micro and small capitalization companies generally are more volatile than those of large capitalization companies and are more likely to be adversely affected by changes in earnings results and investor expectations or poor economic or market conditions than large capitalization companies. Securities of small capitalization companies may underperform large capitalization companies, may be harder to sell at times and at prices the portfolio managers believe appropriate, and may offer greater potential for losses.
Equity Market Risk: Equity markets can be volatile and the prices of common stocks can fluctuate significantly. In addition, the Small Cap Fund portfolio and Micro Cap Fund portfolio invests in small capitalization companies and micro capitalization companies, respectively, which may be subject to more abrupt or erratic market movements than those of larger, more established companies.
Liquidity Risk: Some small cap and micro cap securities may have few market-makers and low trading volume, which can increase transaction costs and may make it difficult or impossible for the Funds to dispose of a security position at all or at a price which represents current or fair market value.
A number of other risks are associated with an investment in the Fund, including: issuer specific risks, liquidity risks, and risks associated with the Adviser’s judgment. Greater detail on each of the above stated risks may be found in the Funds’ prospectuses.
Note 4. Security Valuations
In computing net asset value, portfolio securities of the Funds are generally valued at their current market values determined on the basis of readily available market quotations, when available. If market quotations are not readily available, securities are valued at fair value as determined in good faith by the Adviser, in its capacity as the Board’s valuation designee, pursuant to Rule 2a-5 under the 1940 Act. As a general matter, fair value represents the amount that a Fund could reasonably expect to receive if such Fund’s investment in the security were sold at the time of valuation. The Adviser may utilize third parties to assist the Adviser in its capacity as valuation designee available at the time the valuation is made and that the Adviser believes to be reliable. The Funds utilize various methods to measure the fair value of their investments on a recurring basis. GAAP establishes a hierarchy that prioritizes inputs to valuation methods. The three levels of inputs are:
Level 1 - Unadjusted quoted prices in active markets for identical assets or liabilities that the Funds have the ability to access.
Level 2 - Observable inputs other than quoted prices included in Level 1 that are observable for the asset or liability, either directly or indirectly. These inputs may include quoted prices for the identical instrument in an inactive market, prices for similar instruments, interest rates, prepayment speeds, credit risk, yield curves, default rates and similar data.
Level 3 - Unobservable inputs for the asset or liability, to the extent relevant observable inputs are not available, representing the Funds’ own assumptions about the assumptions a market participant would use in valuing the asset or liability, and would be based on the best information available.
The availability of observable inputs can vary from security to security and is affected by a wide variety of factors, including, for example, the type of security, whether the security is new and not yet established in the marketplace, the liquidity of markets, and other characteristics particular to the security. To the extent that valuation is based on models or inputs that are less observable or unobservable in the market, the determination of fair value requires more judgment. Accordingly, the degree of judgment exercised in determining fair value is greatest for instruments categorized in Level 3.
The inputs used to measure fair value may fall into different levels of the fair value hierarchy. In such cases, for disclosure purposes, the level in the fair value hierarchy within which the fair value measurement falls in its entirety, is determined based on the lowest level input that is significant to the fair value measurement in its entirety.
Fair Value Measurements: A description of the valuation techniques applied to the Funds’ major categories of assets and liabilities measured at fair value on a recurring basis follows.
Equity securities (common stock including ADRs) - Equity securities are valued by using market quotations furnished by a pricing service when the valuation designee believes such prices accurately reflect the fair value of such securities. Securities that are traded on any stock exchange are valued by the pricing service at the last quoted sale price. Securities traded in the NASDAQ over-the-counter market are valued by the pricing service at the NASDAQ Official Closing Price. Generally, if the security is traded in an active market and is valued at the last sale price, the security is categorized as a Level 1 security. When the security position is not considered to be part of an active market or when the security is valued at the bid price, the position is generally categorized as a Level 2 security. When market quotations are not readily available, when the valuation designee determines that the market quotation or the price provided by the pricing service does not accurately reflect the current market value or when illiquid securities are being valued, such securities are valued at fair value as determined by the valuation designee in good faith, in accordance with guidelines adopted by and subject to review of the Board and are categorized as Level 3.
Money market funds are generally priced at the ending net asset value (“NAV”) provided by the service agent of the Funds. These securities will be classified as Level 1 of the value hierarchy.
The following table presents information about the Small Cap Fund’s investments measured at fair value as of July 31, 2024:
| Assets | Level 1 | Level 2 | Level 3 | Total |
| Common Stocks | $34,766,383 | $ - | $ - | $34,766,383 |
| Short-Term Investment | 1,478,409 | - | - | 1,478,409 |
| Total | $36,244,792 | $ - | $ - | $36,244,792 |
The following table presents information about the Micro Cap Fund’s investments measured at fair value as of July 31, 2024:
| Assets | Level 1 | Level 2 | Level 3 | Total |
| Common Stocks | $10,174,420 | $ - | $ - | $10,174,420 |
| Short-Term Investment | 615,747 | - | - | 615,747 |
| Total | $10,790,167 | $ - | $ - | $10,790,167 |
The Funds did not hold any Level 2 or Level 3 assets as of July 31, 2024. Therefore a reconciliation of assets in which significant unobservable inputs were used in determining fair value is not applicable. For more detail on the investments, please refer to the Schedules of Investments. The Funds also did not have transfers into or out of Level 1, Level 2 or Level 3 during the year ended July 31, 2024.
Note 5. Investment Advisory Fee and Other Transactions with Affiliates
Pursuant to the Management Agreement (“Management Agreement”) between the Adviser and the Trust, Ranger Investment is entitled to investment advisory fees, computed daily and payable monthly, of 1.00% per annum of the average daily net assets of Small Cap Fund and 1.25% per annum of the average daily net assets of Micro Cap Fund. Effective April 1, 2024, the Micro Cap Fund reduced its investment advisory fees to 1.00% per annum of the average daily net assets. For the year ended July 31, 2024, the Adviser earned $321,133 from the Small Cap Fund. For the year ended July 31, 2024 the Adviser earned $78,510 from the Micro Cap Fund. For the year ended July 31, 2024, the Adviser waived $152,814 and $62,820 in fees from the Small Cap Fund and Micro Cap Fund, respectively. At July 31, 2024, the Adviser was owed $10,331 and $533 from the Small Cap Fund and Micro Cap Fund, respectively.
Ranger Investment has entered into an Expense Limitation Agreement with the Trust (the “Expense Limitation Agreement”), whereby the Adviser has agreed to reduce its fees and reimburse expenses so that the net annual operating expenses (exclusive of any Rule 12b-1 distribution or shareholder service fees, front-end or contingent deferred loads, brokerage fees and commissions, acquired fund fees and expenses, borrowing costs (such as interest and dividend expenses on securities sold short) taxes, or extraordinary expenses such as litigation) of Small Cap Fund and Micro Cap Fund will not exceed 1.10% and 1.50%, respectively, of average daily net assets until November 30, 2024. Effective April 1, 2024, the Adviser reduced the Micro Cap Fund’s expense limitation fee reduction to 1.25% of average daily net assets until April 12, 2025. The Adviser may recoup any waived or reimbursed amount from each respective Fund pursuant to the Expense Limitation Agreement if such reimbursement does not cause the respective Fund to exceed existing expense Fund limitations at the time of the original waiver/reimbursement and the reimbursement is made within three years after the respective adviser incurred the expenses. As of July 31, 2024, Ranger Investment is entitled to recapture $370,114 in expenses pursuant to the Expense Limitation Agreement from the Small Cap Fund and $168,652 in expenses pursuant to the Expense Limitation Agreement from the Micro Cap Fund.
| Fiscal Year Ended | | Recoverable Through | | Small Cap Fund | | Micro Cap Fund |
| July 31, 2022 | | July 31, 2025 | | $ 98,094 | | $ 52,962 |
| July 31, 2023 | | July 31, 2026 | | 119,206 | | 52,870 |
| July 31, 2024 | | July 31, 2027 | | 152,814 | | 62,820 |
| | | | | $ 370,114 | | $ 168,652 |
Effective January 1, 2022, pursuant to the Management Services Agreement between Ranger Shared Services, LLC and the Trust, Ranger Shared Services, LLC is entitled to administrative fees, computed daily and payable monthly, of 0.10% per annum of the average daily net assets of Small Cap Fund and Micro Cap Fund. Effective January 1, 2023, the rate was changed to 0.05% per annum. Ranger Shared Services, LLC is also entitled to operation service fees of $5,000 annually per Fund. Effective October 5, 2023, the Management Services Agreement with Ranger Shared Services, LLC terminated, and the Trust entered into a substantially similar (with the same fees) Management Services Agreement with Ranger Asset Management Company, LLC. For the period August 1, 2023 through October 4, 2023, Ranger Shared Services, LLC earned fees of $3,570 for the Small Cap Fund and $1,429 for the Micro Cap Fund. For the period October 5, 2023 through July 31, 2024, Ranger Asset Management Company, LLC earned fees of $17,417 for the Small Cap Fund and $6,981 for the Micro Cap Fund.
Each Trustee who is not affiliated with the Trust and/or the Adviser will receive an annual fee of $2,500, as well as reimbursement for any reasonable expenses incurred attending the meetings. The “interested person” who serves as Trustee of the Trust receives no compensation for his services as a Trustee. None of the executive officers receive compensation from the Trust.
Note 6. Agreements
Transfer Agent Agreement and Accounting Services Agreement: Mutual Shareholder Services, LLC (“MSS”) serves as Transfer Agent to each Fund, pursuant to a Transfer Agent Agreement with the Trust. Under the Transfer Agent Agreement, MSS provides all of the customary services of a transfer agent and dividend disbursing agent.
In addition, MSS provides accounting services to the Funds pursuant to an Accounting Services Agreement with the Trust. As such, MSS provides all necessary administration, bookkeeping and pricing services to each Fund.
12b-1 Plan and Distribution Agreement: The Trust, on behalf of the Funds, has adopted a plan pursuant to Rule 12b-1 under the 1940 Act (the “Plan”). The Plan permits Investor Class shares of each Fund to pay for certain distribution and promotion expenses related to marketing shares of the Fund. The amount payable annually by each Fund’s Investor Class is 0.25% of its respective average daily net assets. Institutional Class shares of the Funds are not subject to a 12b-1 fee and do not have a Rule 12b-1 plan. Under the Plan, the Trust may engage in any activities related to the distribution of Fund shares.
Arbor Court Capital, LLC (the "Distributor") serves as the principal underwriter and national distributor for the shares of the Trust pursuant to a distribution agreement with the Trust (the "Distribution Agreement"). The Trust and the Adviser are not affiliated with the Distributor.
Shareholder Servicing Fees: In March 2021, The Board, on behalf of the Funds, has approved that each Fund could annually pay up to 0.15% of the Fund assets for shareholder servicing expenses.
Custodian Services: As of April 26, 2024, the Funds changed their custodian from U.S. Bank N.A. to Huntington National Bank to perform all custodian services for the Funds.
Note 7. Capital Share Transactions
At July 31, 2024, there were unlimited shares authorized at no par value for the Trust (which includes the Small Cap Fund and Micro Cap Fund). The following table summarizes transactions in capital for each respective period or year:
| Small Cap Fund – Institutional Class | Year Ended July 31, 2024 | Year Ended July 31, 2023 |
| | Shares | Amount | Shares | Amount |
| Shares Sold | 330,511 | $ 5,722,581 | 758,168 | $12,098,414 |
| Shares Reinvested | 75,801 | 1,315,901 | 59,013 | 872,215 |
| Shares Redeemed | (179,203) | (2,896,703) | (969,210) | (16,221,215) |
| Net Increase (Decrease) | 227,109 | $ 4,141,779 | (152,029) | $(3,250,586) |
| Micro Cap Fund – Institutional Class | Year Ended July 31, 2024 | Year Ended July 31, 2023 |
| | Shares | Amount | Shares | Amount |
| Shares Sold | 532,125 | $ 3,662,401 | 82,719 | $ 693,207 |
| Shares Reinvested | 7,111 | 47,144 | 337,650 | 1,968,499 |
| Shares Redeemed | (40,877) | (255,735) | (907,276) | (8,242,034) |
| Net Increase (Decrease) | 498,359 | $ 3,453,810 | (486,907) | $ (5,580,328) |
The Small Cap Fund and Micro Cap Fund have not issued Investor Class shares.
Note 8. Investments
Small Cap Fund
For the year ended July 31, 2024, the cost of purchases and the proceeds from sales, other than U.S. Government securities and short-term securities, aggregated $12,698,164 and $11,024,944, respectively.
Micro Cap Fund
For the year ended July 31, 2024, the cost of purchases and the proceeds from sales, other than U.S. Government securities and short-term securities, aggregated $5,525,136 and $2,459,788, respectively.
Note 9. Federal Income Taxes
Small Cap Fund
During the year ended July 31, 2024, a long-term capital gain distribution of $ 1.084743 per share was paid on December 27, 2023, for shareholders on record as of December 26, 2023, for a total distribution of $1,946,692.
The tax character of distributions paid during the year ended July 31, 2024, was as follows:
Capital Gain $ 1,946,692
During the year ended July 31, 2023, a long-term capital gain distribution of $0.566958 per share was paid on December 28, 2022, for shareholders on record as of December 27, 2022, for a total distribution of $1,202,235.
The tax character of distributions paid during the year ended July 31, 2023, was as follows:
Capital Gain $ 1,202,235
As of July 31, 2024, for federal tax purposes the total investment aggregate cost is $31,219,844, the gross unrealized appreciation is $8,079,606 and the gross unrealized depreciation is $3,054,658 resulting in net unrealized appreciation of $5,024,948. The difference between book basis and tax basis unrealized appreciation/ (depreciation) from investments is primarily attributable to the tax deferral of losses on wash sales. As of July 31, 2024, for tax purposes the Small Cap Fund’s other accumulated capital losses is $611,974. Additionally, the Small Cap Fund has elected to defer late year ordinary losses of $79,419. These losses are deemed to arise on the first day of the following fiscal year. Small Cap Fund adjusts certain components of capital to reflect permanent differences between financial statement amounts and net income and realized gains/losses determined in accordance with income tax rules. Accordingly, during the year ended July 31, 2024, amounts have been reclassified to reflect a decrease in paid in capital of $138,391, and a corresponding increase in distributable earnings of $138,391, which primarily resulted from net operating losses. The total distributable earnings for the Small Cap Fund are $4,333,556. As of July 31, 2024, the Small Cap Fund has capital loss carryforwards available to offset future capital gains, if any, subject to the limitations imposed by the Internal Revenue Code. These consist of short-term capital loss carryforwards of $422,161 and long-term capital loss carryforwards of $189,813.
Micro Cap Fund
During the year ended July 31, 2024, a long-term capital gain distribution of $0.049498 per share was paid on December 27, 2023, for shareholders on record as of December 26, 2023, for a total distribution of $47,144.
The tax character of distributions paid during the year ended July 31, 2024, was as follows:
Ordinary Income $ 14,733
Capital Gain $ 32,411
During the year ended July 31, 2023, a long-term capital gain distribution of $2.874062 per share was paid on December 28, 2022, for shareholders on record as of December 27, 2022, for a total distribution of $1,968,499.
The tax character of distributions paid during the year ended July 31, 2023, was as follows:
Capital Gain $ 1,968,499
As of July 31, 2024, for federal tax purposes the total investment aggregate cost is $9,697,244, the gross unrealized appreciation is $2,062,747 and the gross unrealized depreciation is $969,824 resulting in net unrealized appreciation of $1,092,923. The difference between book basis and tax basis unrealized appreciation/ (depreciation) from investments is primarily attributable to the tax deferral of losses on wash sales. As of July 31, 2024, for tax purposes the Micro Cap Fund’s undistributed ordinary income is $31,543 and its other temporary losses is $2,596. Additionally, the Micro Cap Fund has elected to defer post-October capital losses of $249,934 and late year ordinary losses of $21,903. These losses are deemed to arise on the first day of the following fiscal year. The total distributable earnings for the Micro Cap Fund are $850,034.
Note 10. Control Ownership
The beneficial ownership, either directly or indirectly, of more than 25% of the voting securities of a fund creates a presumption of control of the fund, under Section 2(a)(9) of the 1940 Act. As of July 31, 2024, Charles Schwab & Co., Inc. held in omnibus accounts for the benefit of others, approximately 49.89% of the voting securities of the Small Cap Fund and may be deemed to control the Small Cap Fund. As of July 31, 2024, Charles Schwab & Co., Inc. held in omnibus accounts for the benefit of others, approximately 45.00% of the voting securities of the Micro Cap Fund and may be deemed to control the Micro Cap Fund. As of July 31, 2024, R. E. Smith Sub S Trust held approximately 28.71% of the voting securities of the Small Cap Fund and may be deemed to control the Small Cap Fund. However, the above ownership does not constitute control with respect to the Securities and Exchange Commission’s (“SEC's”) auditor independence rules as they are not beneficial owners with significant influence over the Funds.
Note 11. Market Risk
The increasing interconnectivity between global economies and financial markets increases the likelihood that events or conditions in one region or financial market may adversely impact issuers in a different country, region or financial market. Securities in the Funds may underperform due to inflation (or expectations for inflation), interest rates, global demand for particular products or resources, natural disasters, climate change and climate-related events, pandemics, epidemics, terrorism, international conflicts, regulatory events and governmental or quasi-governmental actions. The occurrence of global events similar to those in recent years, such as terrorist attacks around the world, natural disasters, social and political discord or debt crises and downgrades, among others, may result in market volatility and may have long term effects on both the U.S. and global financial markets. It is difficult to predict when similar events affecting the U.S. or global financial markets may occur, the effects that such events may have and the duration of those effects. Any such event(s) could have a significant adverse impact on the value and risk profile of the Funds. Changes in market conditions and interest rates can have the same impact on all types of securities and instruments. In times of severe market disruptions, you could lose your entire investment.
Note 12. Subsequent Events
Management has evaluated the impact of all subsequent events on the Funds through the date the financial statements were issued and has noted no such events required adjustment or disclosure.
REPORT OF INDEPENDENT REGISTERED PUBLIC ACCOUNTING FIRM
To the Shareholders and Board of Trustees of
Ranger Funds Investment Trust
Opinion on the Financial Statements
We have audited the accompanying statements of assets and liabilities, including the schedules of investments, of Ranger Funds Investment Trust comprising Ranger Small Cap Fund and Ranger Micro Cap Fund (the “Funds”) as of July 31, 2024, the related statements of operations for the year then ended, the statements of changes in net assets for each of the two years in the period then ended, the financial highlights for each of the three years in the period then ended, and the related notes (collectively referred to as the “financial statements”). In our opinion, the financial statements present fairly, in all material respects, the financial position of each of the Funds as of July 31, 2024, the results of their operations for the year then ended, the changes in net assets for each of the two years in the period then ended, and the financial highlights for each of the three years in the period then ended, in conformity with accounting principles generally accepted in the United States of America.
The Funds’ financial highlights for the years ended July 31, 2021, and prior, were audited by other auditors whose report dated September 29, 2021, expressed an unqualified opinion on those financial highlights.
Basis for Opinion
These financial statements are the responsibility of the Funds’ management. Our responsibility is to express an opinion on the Funds’ financial statements based on our audits. We are a public accounting firm registered with the Public Company Accounting Oversight Board (United States) (“PCAOB”) and are required to be independent with respect to the Funds in accordance with the U.S. federal securities laws and the applicable rules and regulations of the Securities and Exchange Commission and the PCAOB.
We conducted our audits in accordance with the standards of the PCAOB. Those standards require that we plan and perform the audit to obtain reasonable assurance about whether the financial statements are free of material misstatement whether due to error or fraud.
Our audits included performing procedures to assess the risks of material misstatement of the financial statements, whether due to error or fraud, and performing procedures that respond to those risks. Such procedures included examining, on a test basis, evidence regarding the amounts and disclosures in the financial statements. Our procedures included confirmation of securities owned as of July 31, 2024, by correspondence with the custodian and brokers. Our audits also included evaluating the accounting principles used and significant estimates made by management, as well as evaluating the overall presentation of the financial statements. We believe that our audits provide a reasonable basis for our opinion.
We have served as the Funds’ auditor since 2021.

COHEN & COMPANY, LTD.
Milwaukee, Wisconsin
September 30, 2024
Ranger Funds Investment Trust
Additional Information
July 31, 2024 (Unaudited)
Information Regarding Proxy Voting
A description of the policies and procedures that the Funds use to determine how to vote proxies relating to portfolio securities and information regarding how the Funds voted proxies during the most recent 12-month period ended June 30, are available without charge upon request by (1) calling the Funds at (866) 458-4744 (2) from Fund documents filed with the Securities and Exchange Commission ("SEC") on the SEC's website at www.sec.gov and (3) from the Funds’ website at www.rangerfunds.com.

Item 8. Changes in and Disagreements with Accountants for Open-End Management Investment Companies. Not applicable.
Item 9. Proxy Disclosures for Open-End Management Investment Companies. Not applicable.
Item 10. Remuneration Paid to Directors, Officers, and Others of Open-End Management Investment Companies. The information is included as part of the material filed under Item 7 of this Form.
Item 11. Statement Regarding Basis for Approval of Investment Advisory Contract. The information is included as part of the material filed under Item 7 of this Form.
Item 12. Disclosure of Proxy Voting Policies and Procedures for Closed-End Funds. Not applicable.
Item 13. Portfolio Managers of Closed-End Management Investment Companies. Not applicable.
Item 14. Purchases of Equity Securities by Closed-End Management Investment Company and Affiliated Purchasers. Not applicable.
Item 15. Submission of Matters to a Vote of Security Holders.
The registrant has not adopted procedures by which shareholders may recommend nominees to the registrant’s board of trustees.
Item 16. Controls and Procedures.
(a) The registrant’s president and chief financial officer concluded that the disclosure controls and procedures (as defined in Rule 30a-3(c) under the Investment Company Act of 1940 (the “Act”)) were effective as of a date within 90 days of the filing date of this report, based on the evaluation of these controls and procedures required by Rule 30a-3(b) under the Act.
(b) There were no changes in the registrant’s internal control over financial reporting (as defined in Rule 30a-3(d) under the Act) that occurred during the period covered by this report that have materially affected, or are reasonably likely to materially affect, the registrant’s internal control over financial reporting.
Item 17. Disclosure of Securities Lending Activities for Closed-End Management Investment Companies. Not applicable.
Item 18. Recovery of Erroneously Awarded Compensation.
(a) Not applicable.
(b) Not applicable.
Item 19. Exhibits.
(a)(1) Code of Ethics. Filed herewith.
(a)(2) Certifications pursuant to Section 302 of the Sarbanes-Oxley Act of 2002. Filed herewith.
(b) Certification pursuant to Section 906 Certification of the Sarbanes-Oxley Act of 2002. Filed herewith.
SIGNATURES
Pursuant to the requirements of the Securities Exchange Act of 1934 and the Investment Company Act of 1940, the registrant has duly caused this report to be signed on its behalf by the undersigned, thereunto duly authorized.
Ranger Funds Investment Trust
By /s/ Kenneth Scott Canon
Kenneth Scott Canon
President (Principal Executive Officer)
Date: October 8, 2024
Pursuant to the requirements of the Securities Exchange Act of 1934 and the Investment Company Act of 1940, this report has been signed below by the following persons on behalf of the registrant and in the capacities and on the dates indicated.
By /s/ Kenneth Scott Canon
Kenneth Scott Canon
President (Principal Executive Officer)
Date: October 8, 2024
By /s/ Jay Thompson
Jay Thompson
Treasurer and Chief Financial Officer (Principal Financial Officer)
Date: October 8, 2024