 KeyBanc Capital Markets Industrial, Automotive, & Transportation Conference May 30, 2012 Exhibit 99.1 |
 Forward Looking Statements 2 This document contains information that may constitute “forward-looking statements.” Forward-looking statements by their nature address matters that are, to different degrees, uncertain. Generally, the words “anticipate,” “estimate,” “expect,” “project,” “intend,” “plan,” “believe,” “target” and similar expressions identify forward-looking statements, which generally are not historical in nature. However, the absence of these words or similar expressions does not mean that a statement is not forward-looking. These forward-looking statements include, but are not limited to, statements about the separation of Xylem Inc. (the “Company”) from ITT Corporation, the terms and the effect of the separation, the nature and impact of the separation, capitalization of the Company, future strategic plans and other statements that describe the Company’s business strategy, outlook, objectives, plans, intentions or goals, and any discussion of future operating or financial performance. All statements that address operating performance, events or developments that we expect or anticipate will occur in the future — including statements relating to orders, revenues, operating margins and earnings per share growth, and statements expressing general views about future operating results — are forward-looking statements. Caution should be taken not to place undue reliance on any such forward-looking statements because they involve risks, uncertainties and other factors that could cause actual results to differ materially from those expressed or implied in, or reasonably inferred from, such statements. The Company undertakes no obligation to publicly update or revise any forward-looking statements, whether as a result of new information, future events or otherwise, except as required by law. In addition, forward-looking statements are subject to certain risks and uncertainties that could cause actual results to differ materially from the Company’s historical experience and our present expectations or projections. These risks and uncertainties include, but are not limited to, those set forth in Item 1A of our Annual Report on Form 10-K, and those described from time to time in subsequent reports filed with the Securities and Exchange Commission. |
 • Design, Manufacture, & Service Highly Engineered Technologies • A True Water Pure Play • Diverse End Market & Geographic Mix • Leading Brands & Large Installed Base • Unrivaled Global Reach … Serving 150+ Countries Global Leader in Water Application Solutions 3 $3.8B Company Uniquely Positioned in the Attractive Water Industry $3.8B Company Uniquely Positioned in the Attractive Water Industry |
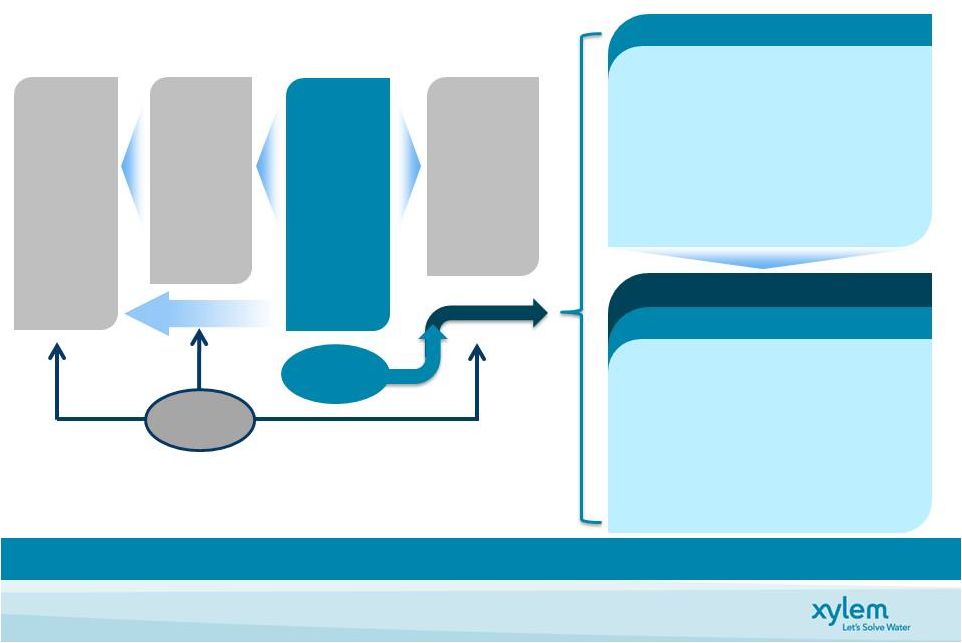 Where do we play in the $500B Global Water Industry? Public Utility ~250,000 Utilities Globally Water Infrastructure ~5%-10% EBIT Margin Design & Build ~8,000 EPC Firms Globally ~2%-5% EBIT Margin Equipment & Equipment & Services Services ~20,000 ~20,000 Companies Companies Globally Globally ~5%-20+% EBIT Margin $280B $280B End Use Applications Farms, Power Plants, Homes Applied Water $220B Source: GWI, Company Estimates $250B $250B Predominately Commodity-like Equipment & Service • Pipes, valves, fittings and low value pumps • Low-value services • Low or no differentiation • Generally either capital or labor intensive • Generally single-digit margins… some pockets of higher profitability $30B $30B Xylem Focus Xylem Focus 4 Xylem Focused on Attractive End-Markets in Equipment & Services Xylem Focused on Attractive End-Markets in Equipment & Services Technology Intensive • Higher value equipment - Energy efficiency, perform in harsh conditions, high reliability • Knowledge-based services - Analytics, energy audits • Differentiated solutions • ~10-20%+ margins |
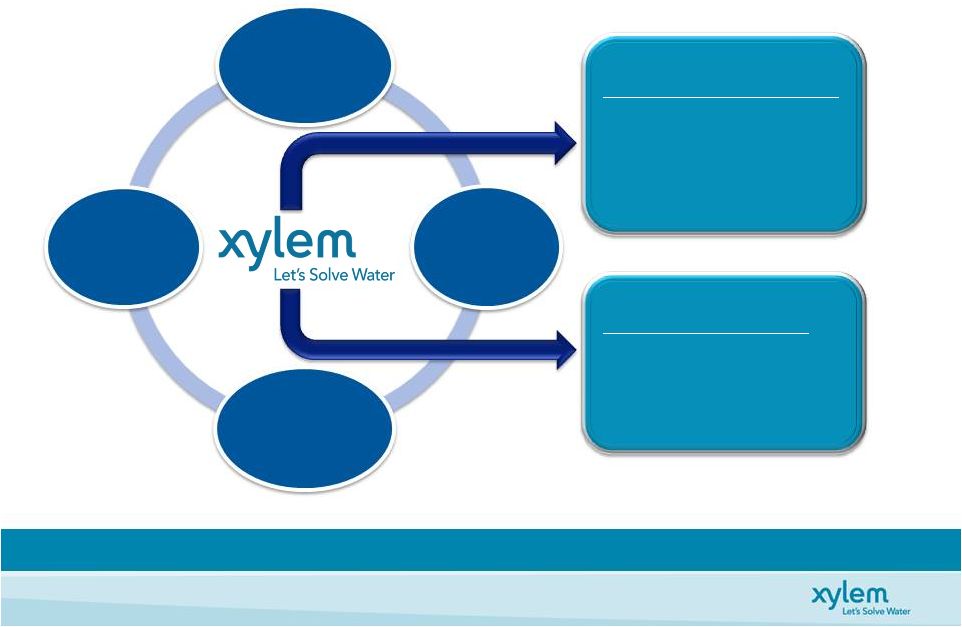 How Does Xylem Create Value? 5 By Partnering with Our Customers to Solve Water Challenges By Partnering with Our Customers to Solve Water Challenges • • Depleting Water Supply Depleting Water Supply • • Tightening Regulation Tightening Regulation • • Aging Infrastructure Aging Infrastructure • • Population Growth Population Growth • • Urbanization Urbanization • • Sustainability / Energy Efficiency Sustainability / Energy Efficiency • • Fragmented Industry Fragmented Industry • • Geographically Diverse Geographically Diverse • • Attractive End Markets Attractive End Markets • • Installed Base Importance Installed Base Importance • • Customer Reliance on Expertise Customer Reliance on Expertise Understanding Global Water Challenges Leading Within the Global Water Industry Unique Assets Key Partners Industry Relations Innovative Solutions |
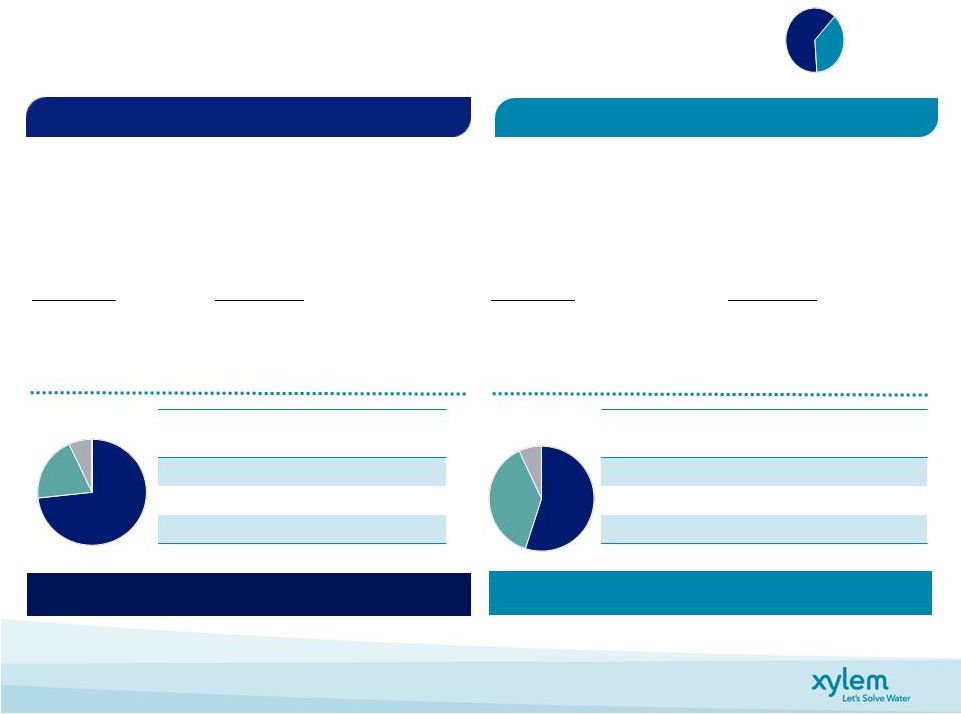
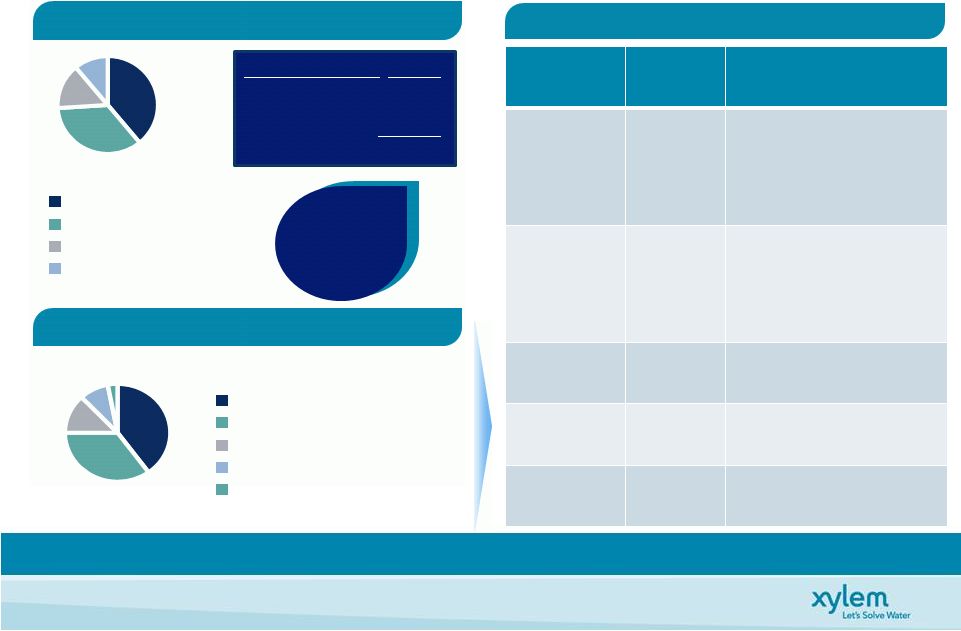 6 … … With Attractive Growth Rates and Strong Fundamentals With Attractive Growth Rates and Strong Fundamentals Balanced Portfolio … Diversified Market Exposure Europe 37% U.S. 36% Asia Pac 11% Other 16% End Market Mix* End Market Mix* Geographical Mix* Geographical Mix* Industrial 40% Public Utility 36% Commercial 12% Residential 9% Agricultural 3% Xylem Xylem Emerging Emerging Market Revenue Market Revenue = 19% in 2011 = 19% in 2011 *2011 Revenues End Market End Market Cycle Cycle Fundamentals Fundamentals Industrial Less Cyclical/ Late Cycle • Critical products • Strong aftermarket & replacement Public Utility Non- Cyclical • Tariffs protected & growing • ~70% for O&M activity • Strong aftermarket & replacement Commercial Late Cycle • Strong replacement • Green regulation Residential Early Cycle • Strong replacement • Energy efficiency Agriculture Mid Cycle • Growing demand Balanced End Market Balanced End Market Mkt Growth Rates ’10 -’15 Developed 1 - 3% Emerging 8 - 10+% Global 3 - 5% |
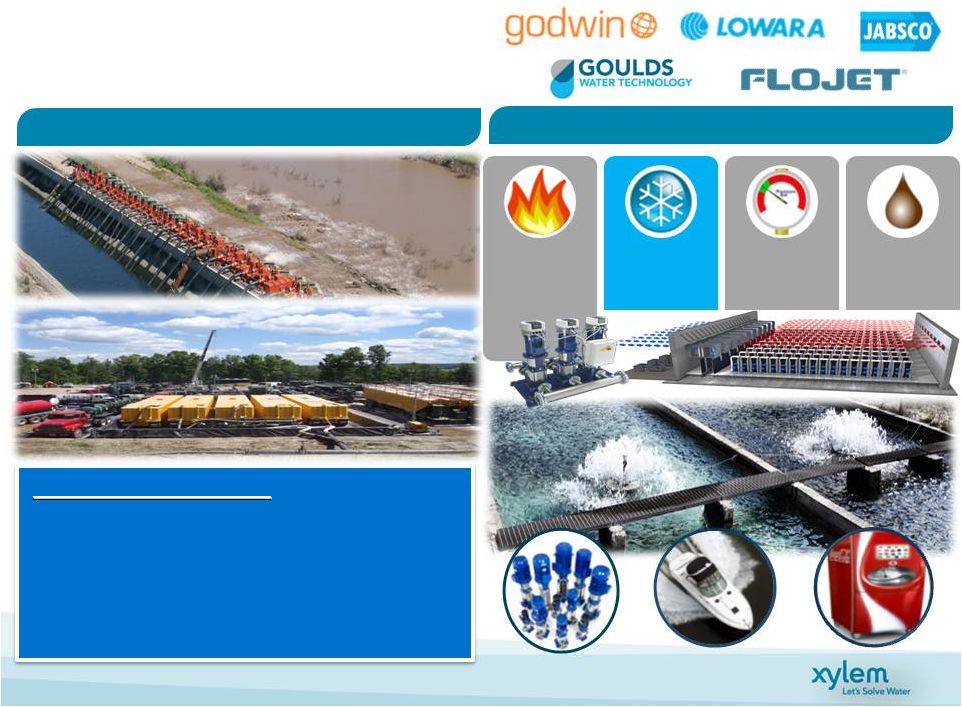 Dewatering and Industrial Water Applications 7 Dewatering Applications Dewatering Applications Industrial Water Applications Industrial Water Applications Diverse Applications • Construction • Disaster Recovery • Environmental • Heavy Industry Diverse Applications Diverse Applications • • Construction Construction • • Disaster Recovery Disaster Recovery • • Environmental Environmental • • Heavy Industry Heavy Industry • Mining • Oil, Gas & Chemical • Water & Waste Water • Marine • • Mining Mining • • Oil, Gas & Chemical Oil, Gas & Chemical • • Water Water & & Waste Waste Water Water • • Marine Marine Heating Cooling Pressure Boosting Waste Water Removal |
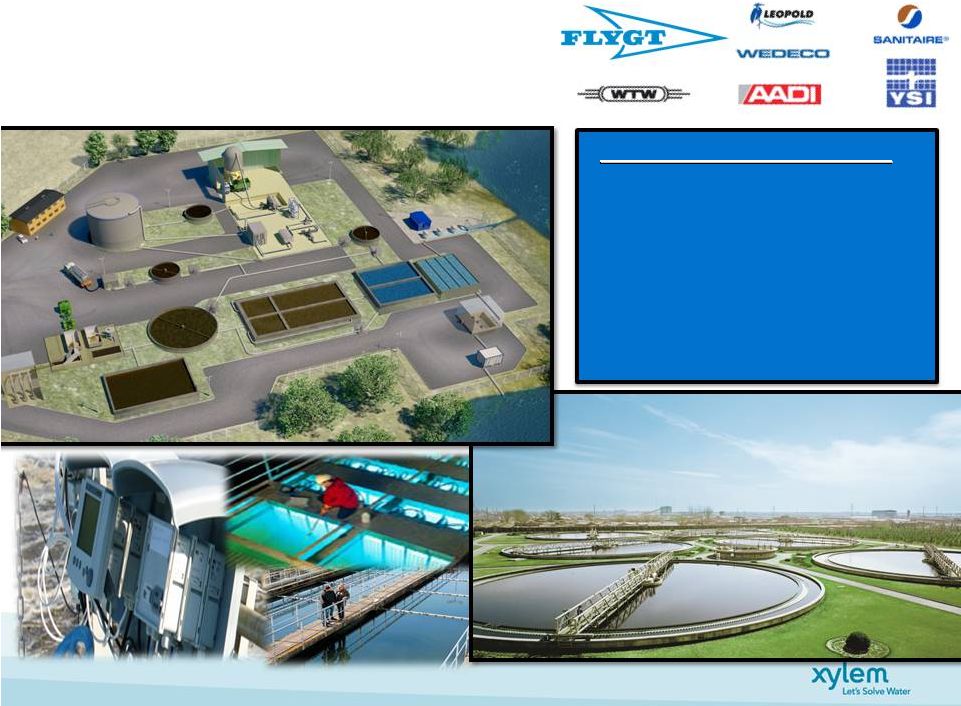 Public Utility & Industrial Transport, Treatment & Test 8 Application Technologies • Waste Water Transport • Filtration • Biological Treatment • UV & Ozone Disinfection • Analytical Instrumentation Application Technologies Application Technologies • • Waste Water Transport Waste Water Transport • • Filtration Filtration • • Biological Treatment Biological Treatment • • UV & Ozone Disinfection UV & Ozone Disinfection • • Analytical Instrumentation Analytical Instrumentation |
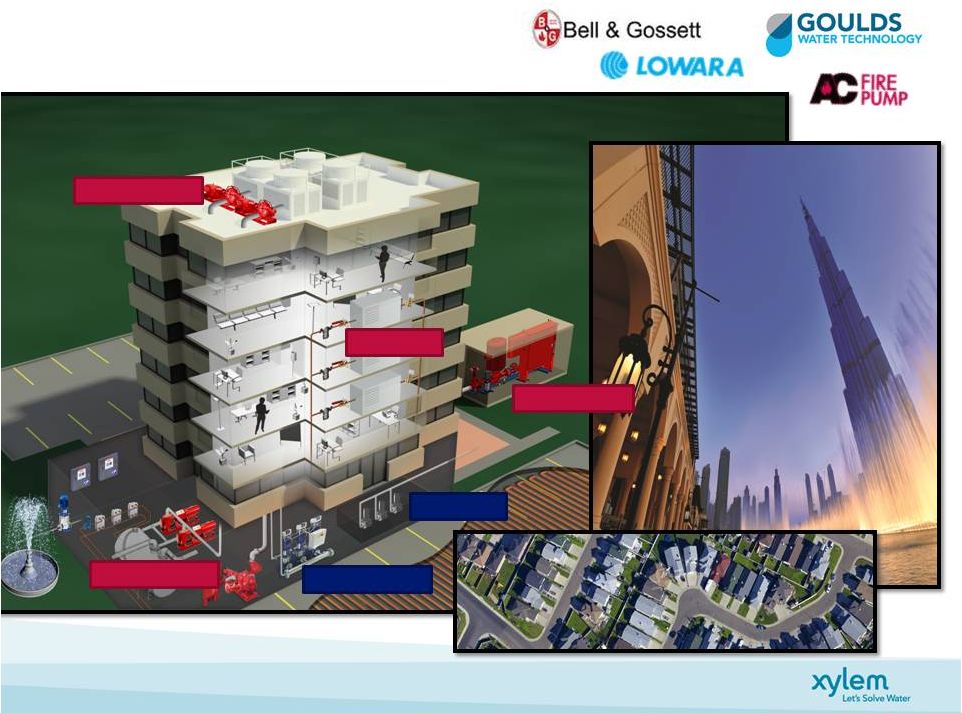 Commercial & Residential 9 Customers • Developers • Building Operators • Building Designers • HVAC Specialists • Contractors • Plumbers HVAC - Heating Pressure boosters Fire protection HVAC - Cooling Wastewater Zone Control |
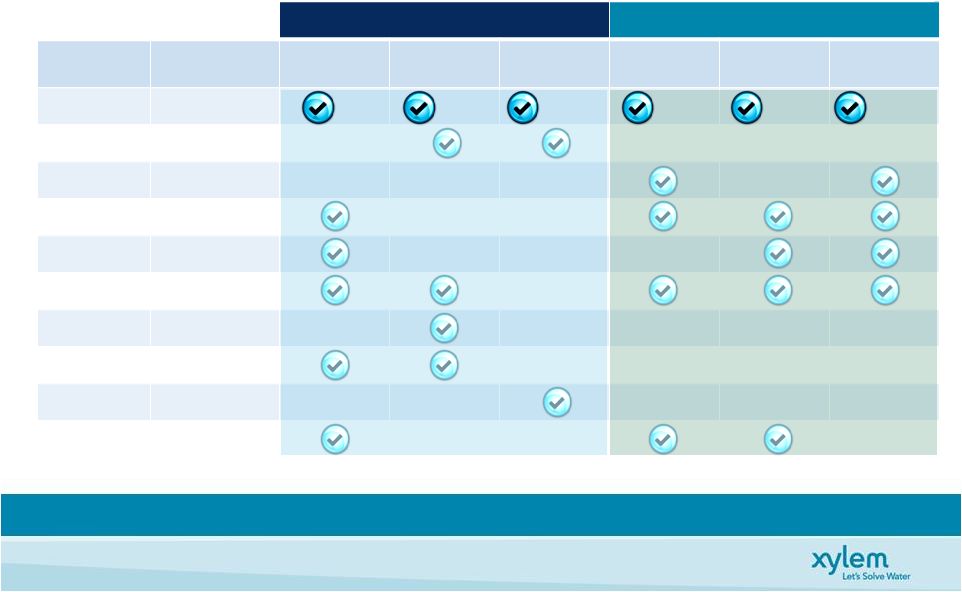 A Unique Spectrum of Applications Expertise 10 Source: Citi Investment Research and Xylem Company Estimates A Genuine Water Company With the Broadest Portfolio * 2011 Revenues 46* 11%* 6%* 19%* 15%* 3%* Water Infrastructure Applied Water Water as % of Total Revs Transport Treatment Test Building Services Industrial Water Irrigation Xylem >90% Danaher ~15% Franklin ~85% Grundfos ~85% KSB ~25% Pentair ~50% Siemens ~5% Sulzer (ABS) ~50% Thermo ~5% Wilo ~30% |
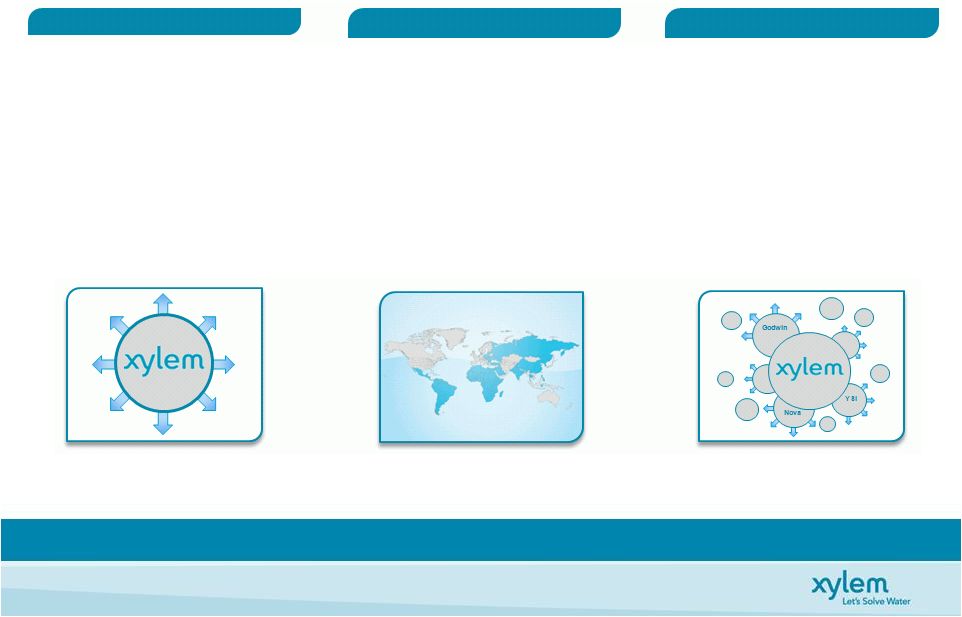 Xylem Has a Focused Growth Strategy • Replicate leadership positions • Leverage brands with global partners • Strong aftermarket opportunities • Innovative application solutions • Sustainable infrastructure initiatives Xylem Target Organic Growth ~ 2 points Faster Than Market • Established footprint • Localized innovation centers • Partnerships with leading, global water companies • Focused BRIC & ROW Strategy • Disciplined approach • Build upon Dewatering and Analytics acquisition platforms • Dewatering & Analytics • History of successful integration • Bolt-on, niche go-forward strategy 11 Organic Growth Organic Growth Emerging Markets Emerging Markets Acquisition Strategy Acquisition Strategy |
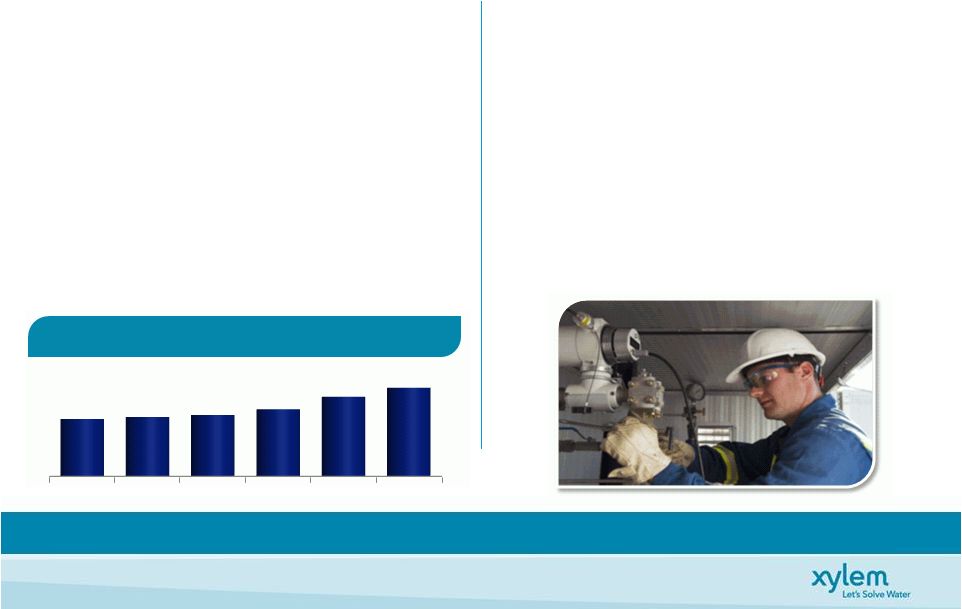 12 Highly Attractive Recurring Revenue Profile • Approximately 22% of Xylem revenue • Installed base drives replacement sales • Brand loyalty drives like-for-like replacement • Installed base provides opportunity for upgrades, next generation and services Parts & Service Replacement Equipment (1) $M Note: (1) Based on company estimates. Aftermarket Provides Stability and Drives Strong Profitable Growth Aftermarket Parts & Services Revenues 2006 2007 2008 2009 2010 2011 $370 $382 $396 $433 $512 $570 • 15% of Xylem revenue • Strong global presence • 120+ owned service centers • 600+ service employees • Extensive channel partner network • 9% Revenue CAGR ‘06-’11 despite economic downturn • ~11% revenue growth 2010-2011 |
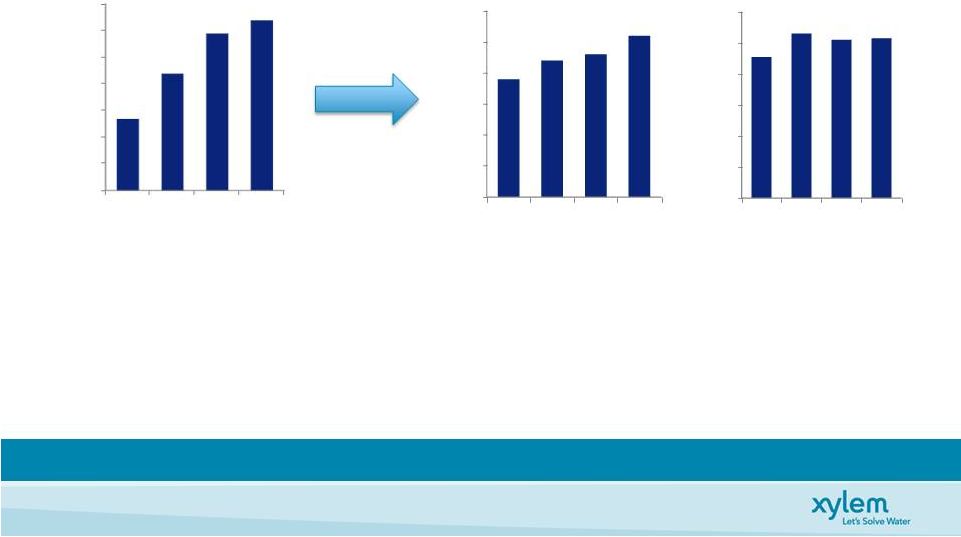
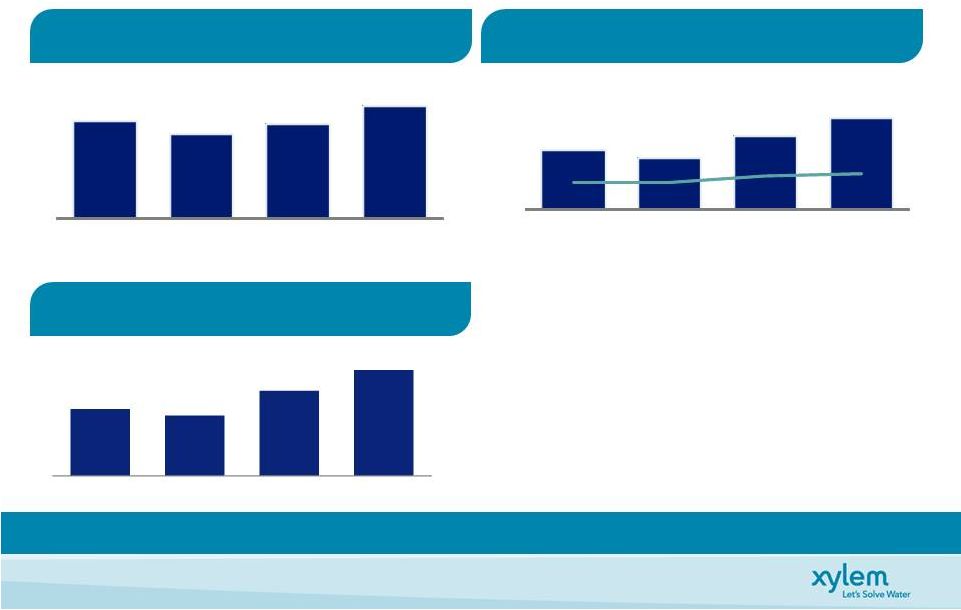 Strong Growth in Revenue and Profitability 13 Revenues ($M) Revenues ($M) Operating Operating Income Income & & Margin* Margin* ($M) ($M) Op Margin expands 310 bps • Operational & Commercial Excellence Initiatives • Price & Productivity more than offset inflation • Includes restructuring costs $41M, $31M, and $15M (’08 - ‘10) Demonstrated Record of Growing Revenue and Profitability Demonstrated Record of Growing Revenue and Profitability EBITDA* $384 $356 $489 $637 EBITDA %* 11.7% 12.5% 15.3% 16.7% Earnings Per Share* Earnings Per Share* Organic -8.8% 3.4% 7.1% Growth* * See non-GAAP reconciliations. $315 $276 $388 $482 9.6% 9.7% 12.1% 12.7% 2008 2009 2010 2011 $3,291 $2,849 $3,202 $3,803 2008 2009 2010 2011 2008 2009 2010 2011 $1.22 $1.10 $1.55 $1.93 EPS CAGR of 16.5% (’08 – ’11) |
 Xylem Segment Overview Market Size: $16B 2011 Revenues: $2.4B 2011 Op Margin*: 14.9% Water Infrastructure 63% Water Infrastructure Overview Water Infrastructure Overview Applied Water 37% Market Size: $14B 2011 Revenues: $1.4B 2011 Op Margin*: 12.0% Customers Residential & Commercial, Industrial Facilities, Agriculture Applied Water Overview Applied Water Overview Customers Public Utilities Industrial Facilities Distribution World-Class Global Direct (~70%) & Indirect Channels Note: (1) Global market share based on company estimates. Distribution Primarily through World-Class Indirect (+70%) Channels 14 *Excluding separation costs of $16M *Excluding separation costs of $13M Revenue by Application Market Share (1) Treatment 18% #1 Test 9% #2 Transport 73% #1 Revenue by Application Market Share (1) Bldg. Services 53% #2 Industrial Water 18% #2 Irrigation 9% #3 Unique Position - Only Provider of All Three “T’s” Large Installed Base, Growth Despite Slow New Construction |
 Gross Margin Improvement Funds Future Growth Xylem Continues to Invest While Increasing Profitability Xylem Continues to Invest While Increasing Profitability 15 • Operational and Commercial excellence • Growth in higher margin Analytics and Dewatering applications • Xylem’s Water Infrastructure direct sales force a key competitive advantage 32.0% 33.0% 34.0% 35.0% 36.0% 37.0% 38.0% 39.0% 2008 2009 2010 2011 34.7% 36.4% 37.9% 38.4% 0.0% 0.5% 1.0% 1.5% 2.0% 2.5% 3.0% 2008 2009 2010 2011 1.9% 2.2% 2.3% 2.6% R&D 12.8% 14.8% 16.8% 18.8% 20.8% 22.8% 24.8% 2008 2009 2010 2011 21.9% 23.4% 23.0% 23.1% SG&A Gross Margin |
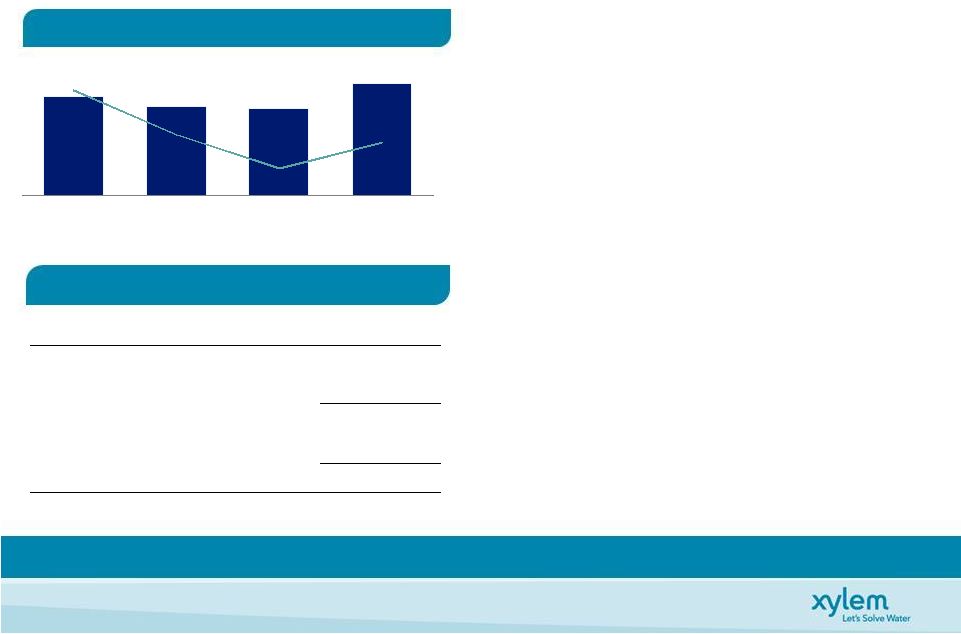 Free Cash Flow Free Cash Flow 1* 1* and Conversion ($M) and Conversion ($M) Focused on Free Cash Flow 16 1 Free Cash Flow = Net cash from operating activities - Capital expenditures Strong Free Cash Flow & Solid Balance Sheet to Fund Growth Initiatives Capital Structure & Liquidity Position Capital Structure & Liquidity Position March 31, 2012 Cash 347 Debt 1,206 Net Debt 859 Shareholders’ Equity 1,949 Net Capital 2,808 Net Debt to Net Capital 31% • Strong Cash Position • No Significant Debt Maturities Until 2016 • 31% Net Debt to Net Capital • 1.3x Net Debt/Adj. TTM EBITDA • $600M Revolving Credit Facility Undrawn • Access to Commercial Paper * See non-GAAP reconciliations. $341 $308 $301 $388 152% 117% 91% 111% 2008 2009 2010 2011 |
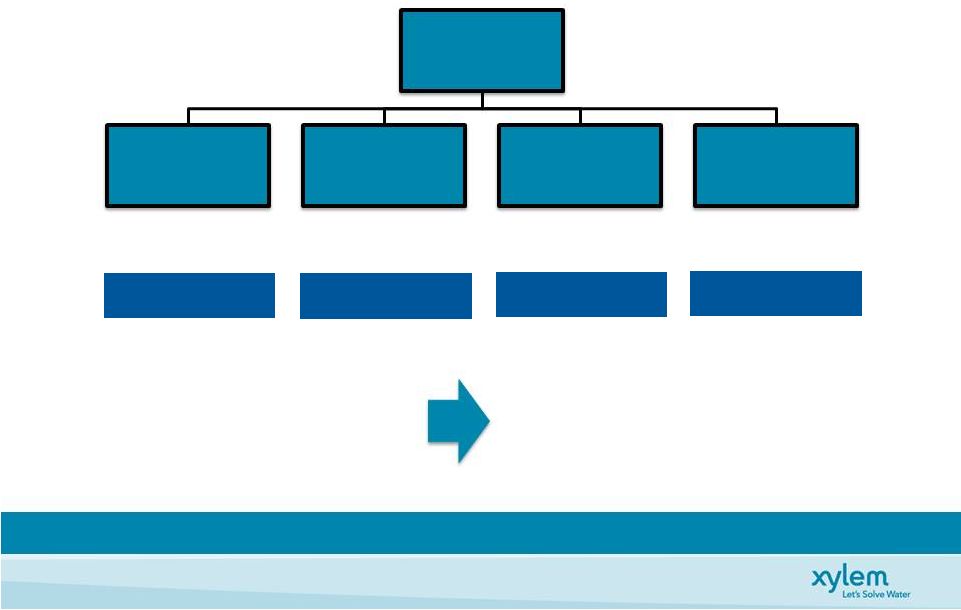 Disciplined Capital Deployment 17 • 2.5% – 3.5% of sales • ~$0.10/share • In-line with peers • Up to $300M / year Capital Deployment Strategy • Balance of organic & inorganic investment • Return value to shareholders • Maintain solid investment grade metrics • Debt & pension Organic Growth World Class Facilities Cash return to shareholders Cash to meet key obligations Inorganic investment to fuel growth Capital Deployment Evaluation • Fold targeted performance into Operating plans • Quarterly / Annual investment review • Ensure targeted returns achieved Focused on LT Shareholder Returns Cash from Operations Capex Return to Shareholders Financial Obligations Acquisition Strategy |
 Financial Projections 18 • Market growth of 3-5%...4-6% Xylem targeted growth • Acquisition strategy adds 1-2 % points of growth • Emerging markets > 20% of revenues Xylem is poised to achieve our long-term financial objectives • Operational & Commercial excellence expand segment margins 50-75 bps per year – Gross margin > 40% • Continued cash management discipline to achieve cash conversion of ~100% • Capital deployment strategy to drive ROIC 2012 Guidance 2015 Target Revenues $3.9B to $4.0B $4.5B to $5.0B Operating Margin* 12.7% to 13.3% 14.5% to 15.5% Free Cash Flow Conversion 95% 100% EPS Growth* +8% to +17% * See non-GAAP reconciliations. Long-Term Targets |
 19 Q&A Q&A |
 Investment Highlights 20 • Uniquely Positioned … Global leader in Attractive Water Industry • Balanced Portfolio … Diversified End & Geographic Market Mix • Large Installed Base … Stability, Profitable Aftermarket Growth • Attractive Growth Opportunities … Organic & Inorganic • Increasing Profitability … Proven Track Record, Continued Focus • Solid Cash Flow Generation … Funds Growth and Shareholder Returns Ability to Deliver Strong & Consistent Financial Performance Ability to Deliver Strong & Consistent Financial Performance |
 21 Thank you for your interest ! Thank you for your interest ! NYSE: XYL http://investors.xyleminc.com Phil De Sousa, Investor Relations Officer (914) 323-5930 (914) 323-5931 Janice Tedesco, Investor Relations Coordinator |
 Appendix |
 Non-GAAP Reconciliation: Organic Revenue 23 (A) (B) (C) (D) (E) (F) = B+C+D+E (G) = F/A Change % Change Change % Change Revenue Revenue 2011 v. 2010 2011 v. 2010 FX Contribution Eliminations Adj. 2011 v. 2010 Adj. 2011 v. 2010 2011 2010 Year Ended December 31, 2011 Xylem Inc. 3,803 3,202 601 18.8% (264) (111) - 226 7.1% Water infrastructure 2,416 1,930 486 25.2% (264) (87) 2 137 7.1% Applied Water 1,444 1,327 117 8.8% - (28) (1) 88 6.6% Change % Change Change % Change Revenue Revenue 2010 v. 2009 2010 v. 2009 FX Contribution Eliminations Adj. 2010 v. 2009 Adj. 2010 v. 2009 2010 2009 Year Ended December 31, 2010 Xylem Inc. 3,202 2,849 353 12.4% (263) 6 - 96 3.4% Water Infrastructure 1,930 1,651 279 16.9% (247) (8) - 24 1.5% Applied Water 1,327 1,254 73 5.8% (16) 16 - 73 5.8% Change % Change Change % Change Revenue Revenue 2009 v. 2008 2009 v. 2008 FX Contribution Eliminations Adj. 2009 v. 2008 Adj. 2009 v. 2008 2009 2008 Year Ended December 31, 2009 Xylem Inc. 2,849 3,291 (442) -13.4% (7) 158 - (291) -8.8% Water infrastructure 1,651 1,824 (173) -9.5% - 108 - (65) -3.6% Applied Water 1,254 1,527 (273) -17.9% (7) 53 - (227) -14.9% Acquisitions / Divestitures Acquisitions / Divestitures Xylem Inc. Non-GAAP Reconciliation Reported vs. Organic Revenue ($ Millions) (As Reported - GAAP) (As Adjusted - Organic) Acquisitions / Divestitures |
  Non-GAAP Reconciliation: EBITDA 24 Xylem Inc. Non-GAAP Reconciliation Net Cash - Operating Activities vs. Free Cash Flow Years ended 2011, 2010, 2009, & 2008 ($ Millions) Year Ended 2011 2010 2009 2008 Net Cash - Operating Activities 449 395 370 408 Capital Expenditures (126) (94) (62) (67) Free Cash Flow, including separation costs 323 301 308 341 Separation Costs (Cash Paid incl. Capex) 65 - - - Free Cash Flow, excluding separation costs 388 301 308 341 Net Income 279 329 263 224 Separation Costs, net of tax 72 - - - Adjusted Net Income 351 329 263 224 Free Cash Flow Conversion 111% 91% 117% 152% |
 Non-GAAP Reconciliation: Earnings Per Share 25 FY 2009 FY 2010 FY 2011 Net Income 263 329 279 Separation costs, net of tax - - 72 Adjusted Net Income before Special Tax Items 263 329 351 Special Tax Items (61) (43) 7 Adjusted Net Income 202 286 358 Diluted Earnings per Share $1.42 $1.78 $1.50 Separation costs per Share - - $0.39 Adjusted diluted EPS before Special Tax Items $1.42 $1.78 $1.89 Special Tax Items per Share ($0.32) ($0.23) $0.04 Adjusted diluted EPS $1.10 $1.55 $1.93 Xylem Inc. Non-GAAP Reconciliation Adjusted Diluted EPS 2009, 2010, & 2011 ($ Millions, except per share amounts) |
 Non-GAAP Reconciliation: Free Cash Flow 26 Xylem Inc. Non-GAAP Reconciliation Net Cash - Operating Activities vs. Free Cash Flow Years ended 2011, 2010, 2009, & 2008 ($ Millions) Year Ended 2011 2010 2009 2008 Net Cash - Operating Activities 449 395 370 408 Capital Expenditures (126) (94) (62) (67) Free Cash Flow, including separation costs 323 301 308 341 Separation Costs (Cash Paid incl. Capex) 65 - - - Free Cash Flow, excluding separation costs 388 301 308 341 Net Income 279 329 263 224 Separation Costs, net of tax 72 - - - Adjusted Net Income 351 329 263 224 Free Cash Flow Conversion 111% 91% 117% 152% |
 Non-GAAP Reconciliation: Guidance 27 Illustration of Mid Point Guidance 2012 Guidance FY '11 FY '12 As Reported Adjustments Adjusted Adjustments Normalized As Reported Adjustments Adjusted Total Revenue 3,803 3,803 3,803 3,950 3,950 Segment Operating Income 503 29 a 532 (8) d 524 577 8 h 585 Segment Operating Margin 13.2% 14.0% 13.8% 14.6% 14.8% Corporate Expense 108 (58) b 50 20 e 70 81 (10) h 71 Operating Income 395 87 482 (28) 454 496 18 514 Operating Margin 10.4% 12.7% 11.9% 12.6% 13.0% Interest Expense (17) (17) (39) f (56) (51) (51) Other Non-Operating Income (Expense) 5 5 5 - - Income before Taxes 383 87 470 (67) 403 445 18 463 Provision for Income Taxes (104) (7) c (111) 16 g (95) (111) (5) i (116) Net Income 279 80 359 (51) 308 334 13 347 Diluted Shares (j) 185.3 185.3 185.9 185.9 Diluted EPS 1.50 $ 0.43 $ 1.93 $ (0.27) $ 1.66 1.80 0.07 1.87 a One time separation costs incurred at the segment level b One time separation costs incurred at the corporate level c Net tax impact of above items, plus the addition of 2011 special tax items d Incremental stand alone costs to be incurred in 2012 at the segment level ($8M) e Incremental stand alone costs to be incurred in 2012 at the corporate level ($20M) f Incremental interest expense on long-term debt to be incurred in 2012 g Tax impact of incremental interest expense and stand alone costs to be incurred in 2012 h Expected one time separation costs of $8M and $10M to be incurred at the segments and headquarters, respectively. i Tax impact of one time separation costs expected to be incurred in 2012. j Full year 2012 diluted shares outstanding are based on diluted shares outstanding for quarter ended March 31, 2012 ($ Millions, except per share amounts) Guidance Xylem Inc. Non-GAAP Reconciliation |