 Robert W. Baird's 42 Annual Industrial Conference November 7, 2012 nd Exhibit 99.1 |
 Forward Looking Statements 2 This document contains information that may constitute “forward-looking statements.” Forward-looking statements by their nature address matters that are, to different degrees, uncertain. Generally, the words “anticipate,” “estimate,” “expect,” “project,” “intend,” “plan,” “believe,” “target” and similar expressions identify forward-looking statements, which generally are not historical in nature. However, the absence of these words or similar expressions does not mean that a statement is not forward-looking. These forward-looking statements include, but are not limited to, statements about the separation of Xylem Inc. (the “Company”) from ITT Corporation, the terms and the effect of the separation, the nature and impact of the separation, capitalization of the Company, future strategic plans and other statements that describe the Company’s business strategy, outlook, objectives, plans, intentions or goals, and any discussion of future operating or financial performance. All statements that address operating performance, events or developments that we expect or anticipate will occur in the future — including statements relating to orders, revenues, operating margins and earnings per share growth, and statements expressing general views about future operating results — are forward-looking statements. Caution should be taken not to place undue reliance on any such forward-looking statements because they involve risks, uncertainties and other factors that could cause actual results to differ materially from those expressed or implied in, or reasonably inferred from, such statements. The Company undertakes no obligation to publicly update or revise any forward- looking statements, whether as a result of new information, future events or otherwise, except as required by law. In addition, forward-looking statements are subject to certain risks and uncertainties that could cause actual results to differ materially from the Company’s historical experience and our present expectations or projections. These risks and uncertainties include, but are not limited to, those set forth in Item 1A of our Annual Report on Form 10-K, and those described from time to time in subsequent reports filed with the Securities and Exchange Commission. |
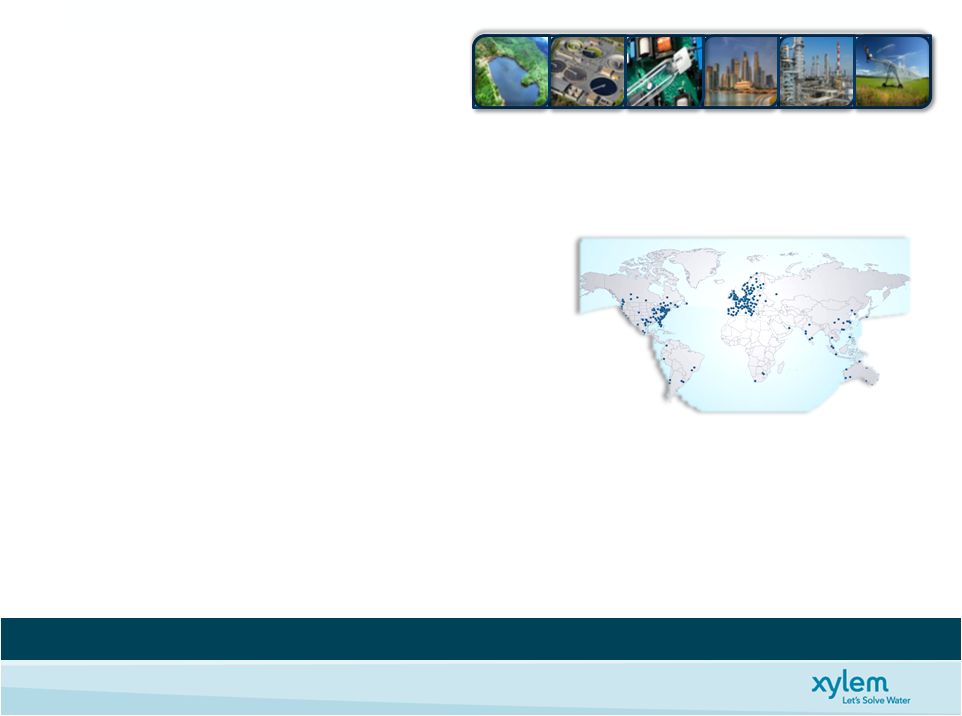 • Design, Manufacture, & Service Highly Engineered Technologies • A True Water Pure Play • Diverse End Market & Geographic Mix • Leading Brands & Application Expertise • Resilient Portfolio & Large Installed Base • Unrivaled Global Reach … Serving 150+ Countries Global Leader in Water Application Solutions 3 $3.8B Company Uniquely Positioned in the Attractive Water Industry |
 Region Highlights Europe • Large Installed Base • So. Europe ~8% Tot Revenue • 2011 Flat Organically U.S. • Large Installed Base • 2011 Up Low Single Digits Emerging Markets • Evenly Spread Across Latin America, Middle East & Africa, Eastern Europe, Asia Pac Diversified Geographic Market Mix 4 Europe 37% U.S. 36% Asia Pac 11% Other 16% Geographical Mix* Geographical Mix* Xylem Xylem Emerging Emerging Market Revenue Market Revenue ~19% in 2011 ~19% in 2011 *2011 Revenues … … With Large Installed Base & Growing Emerging Market Exposure With Large Installed Base & Growing Emerging Market Exposure Emerging Markets Emerging Markets • BRIC & ROW Focused Growth Strategy • 40+ Sales Units Spread Globally • 2 Localized R&D Centers • 14 Production Facilities • ’09 -’11 Revenue CAGR +20% • Proj. Long-Term Revenue Growth 8-10+% |
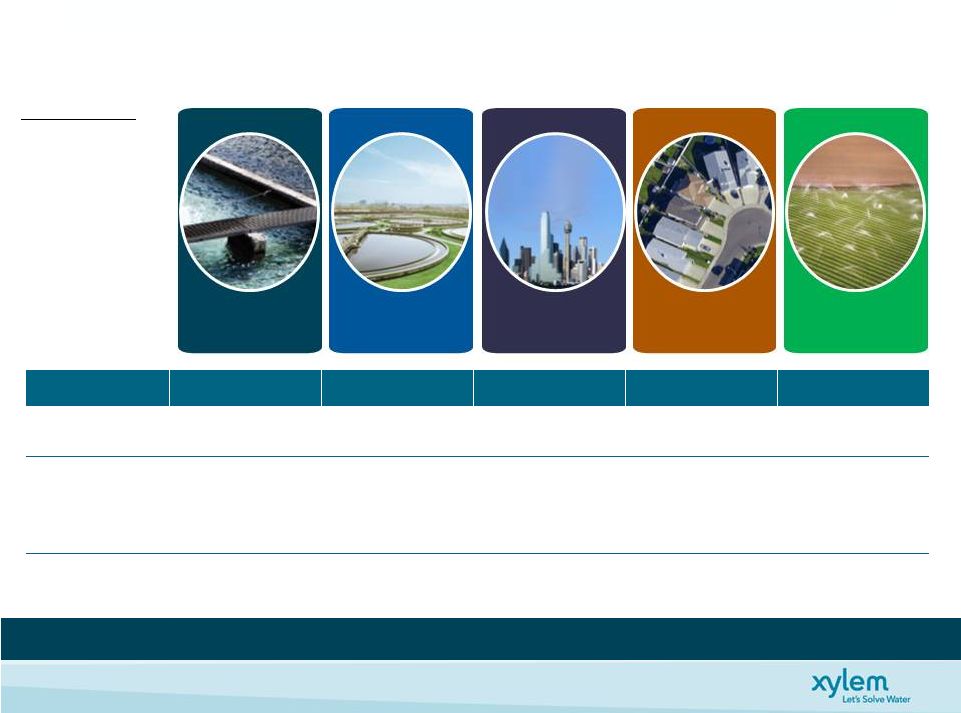 Diversified End Market Mix 5 … … With Strong Long Term Fundamentals & Growth Drivers With Strong Long Term Fundamentals & Growth Drivers % of XYL Revenue 40% 36% 13% 9% 3% Cycle • Late/Less Cyclical • Non-Cyclical • Late Cycle • Early Cycle • Mid Cycle Fundamentals • Operation Critical • Growing Tariffs • Green Regulation • Energy Efficiency • Growing Demand • Aftermarket & Replacement • Aftermarket & Replacement • Strong Replacement • Strong Replacement XYL ‘12 Organic Growth • Flat to Up Low Single Digits • Flat to Up Low Single Digits • Flat to Down Low Single Digits • Flat to Down Low Single Digits • Up Low Single Digits • Depleting Water Supply • Tightening Regulation • Aging Infrastructure • Population Growth • Urbanization • Sustainability • Energy Efficiency Public Utility Commercial Residential Agriculture Industrial LT Growth Drivers |
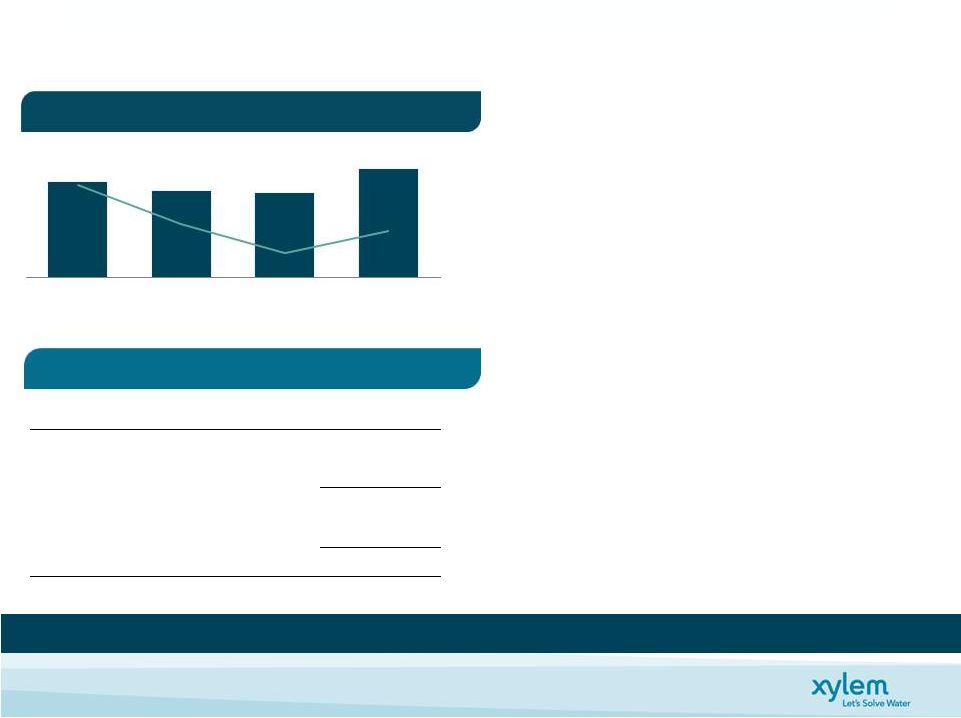
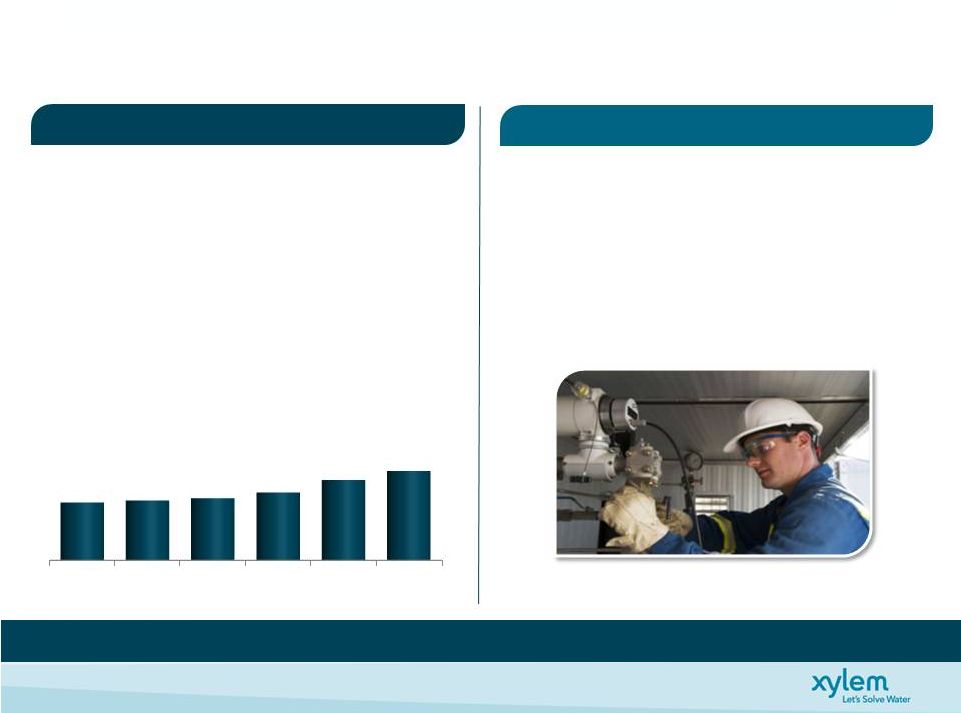 6 Highly Attractive Recurring Revenue Profile • 15% of Xylem revenue • Strong global presence • 120+ owned service centers • 600+ service employees • Extensive channel partner network • 9% Revenue CAGR ‘06-’11 despite economic downturn • Approximately 22% of Xylem revenue • Installed base drives replacement sales • Brand loyalty drives like-for-like replacement • Installed base provides opportunity for upgrades, next generation and services $M Note: (1) Based on company estimates. Aftermarket Provides Stability and Drives Strong Profitable Growth Aftermarket Parts & Services Revenues Replacement Equipment (1) 2006 2007 2008 2009 2010 2011 $370 $382 $396 $433 $512 $570 • ~11% revenue growth 2010-2011 |
 Resilient Portfolio & Increasing Profitability … … Proven Track Record, Continued Focus Proven Track Record, Continued Focus 7 • Resilient Portfolio … Despite Challenging End Market Conditions • Management Discipline …Proactive Actions (~$100M of Restructuring & Realignment ‘08-’12) • Operational Excellence … Driving Productivity Initiatives • Continued Investment Driving Growth in Core Business • Key Acquisitions … Transitioning Portfolio to Higher Profitability Levels (2012E At Mid-Point Guidance) Incl. Stand- Alone Costs 12.7% 12.8% $M, unless otherwise indicated Operating Margin * Revenue 2008 2009 2010 2011 2012E 10.8% 10.8% 12.6% 12.8% 13.6% 2008 2009 2010 2011 2012E 3,291 2,849 3,202 3,803 ~3.8B Expansion +290 Bps On Comp Basis Op Income Up ~$160M … ~45% Incremental Margin ~31% Revenue Up ~$510M … +15% * Excludes the impact of restructuring and stand alone costs for all periods. See Appendix for Non-GAAP Reconciliations |
 Focused on Free Cash Flow 8 1 Free Cash Flow = Net cash from operating activities - Capital expenditures Free Cash Flow and Conversion ($M) Strong Free Cash Flow & Solid Balance Sheet to Fund Growth Initiatives Strong Free Cash Flow & Solid Balance Sheet to Fund Growth Initiatives Capital Structure & Liquidity Position September 30, 2012 Cash 424 Debt 1,212 Net Debt 788 Shareholders’ Equity 2,054 Net Capital 2,842 Net Debt to Net Capital 28% • Strong Cash Flow Conversion • Balance Sheet Flexibility • No Significant Debt Maturities Until 2016 • 28% Net Debt to Net Capital • 1.2x Net Debt/Adj. TTM EBITDA • $600M Revolving Credit Facility - Unutilized • Access to Commercial Paper - Unutilized * See non-GAAP reconciliations. $341 $308 $301 $388 152% 117% 91% 111% 2008 2009 2010 2011 1 * |
 Disciplined Capital Deployment 9 • 2.5% – 3.5% of sales • ~$0.10/share • In-line with peers • Up to $300M / year Capital Deployment Strategy • Balance of organic & inorganic investment • Return value to shareholders • Maintain solid investment grade metrics • Debt & pension Organic Growth World Class Facilities Cash Return to Shareholders Cash to Meet Key Obligations Inorganic Investment to Fuel Growth Capital Deployment Evaluation • Fold targeted performance into Operating plans • Quarterly / Annual investment review • Ensure targeted returns achieved Focused on Long Term Shareholder Return Focused on Long Term Shareholder Return Cash from Operations Capex Return to Shareholders Financial Obligations Acquisition Strategy |
 Financial Projections 10 • Market growth of 3-5%...4-6% Xylem targeted growth • Acquisition strategy adds 1-2 % points of growth • Emerging markets > 20% of revenues Xylem is Poised to Achieve its Long-Term Financial Objectives Xylem is Poised to Achieve its Long-Term Financial Objectives • Operational & Commercial excellence expand segment margins 50-75 bps per year – Gross margin > 40% • Continued cash management discipline to achieve cash conversion of ~100% • Capital deployment strategy to drive ROIC 2012 FY Guidance As of Nov. 1, 2012 2015 Target ** Revenues ~$3.8B $4.5B to $5.0B Operating Margin* 12.7% to 12.9% 14.5% to 15.5% Free Cash Flow Conversion 95% 100% Normalized EPS Growth* +4% to +8% Long-Term Targets * See non-GAAP reconciliations. ** See Xylem October 13, 2011 Investor Day Presentation for further details |
 Investment Highlights 11 • $3.8B Company Uniquely Positioned in the Attractive Water Industry • Resilient Portfolio & Proven Track Record of Increasing Profitability • Leading Brands & World-Class Distribution Channels • Diversified End & Geographic Markets Mix • Attractive Growth Opportunities & Large Installed Base • Solid Cash Flow Generation & Disciplined Capital Deployment Strategy Ability to Deliver Strong & Consistent Financial Performance Ability to Deliver Strong & Consistent Financial Performance |
 12 NYSE: XYL http://investors.xyleminc.com Thank you for your interest ! Thank you for your interest ! Phil De Sousa, Investor Relations Officer (914) 323-5930 Janice Tedesco, Investor Relations Coordinator (914) 323-5931 |
 Appendix |
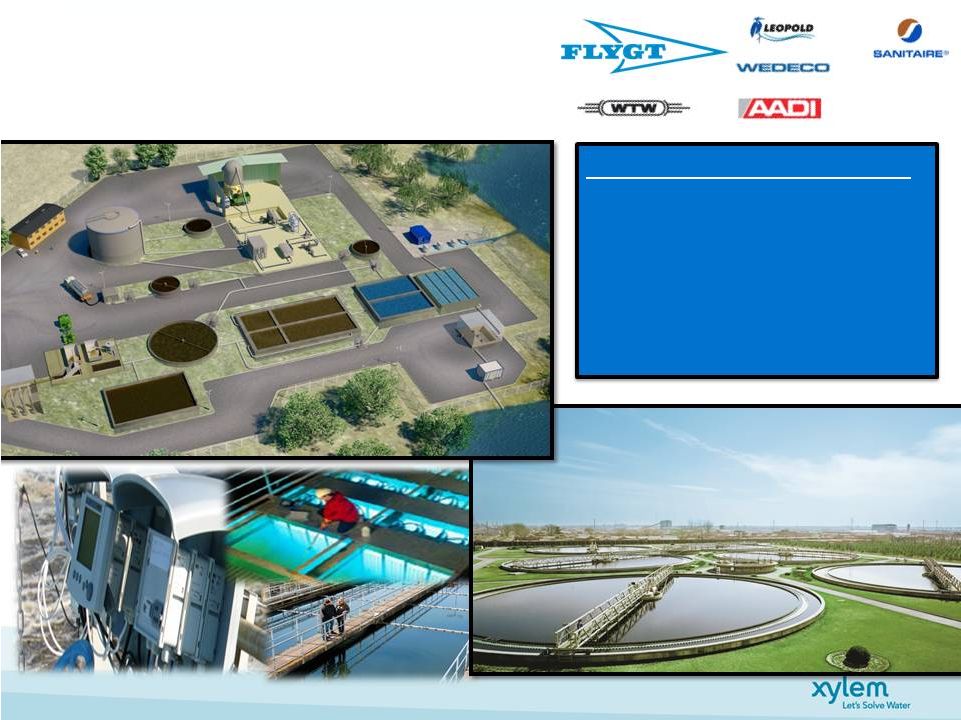
 Water Infrastructure Equipment & Services End Users Uniquely Positioned … 14 … … Global Leader in Attractive Water Industry Global Leader in Attractive Water Industry Growth Drivers • Depleting Water Supply • Tightening Regulation • Aging Infrastructure • Population Growth • Urbanization • Sustainability • Energy Efficiency $500B Global Water Industry Technology Intensive $30B • Highly Engineered • Premium Value • High Performance • Knowledge-Based Services • Differentiated Solutions • Higher Profitability |
 Segment Overview Market Size: $16B 2011 Revenues: $2.4B 2011 Op Margin*: 14.9% Water Infrastructure 63% Water Infrastructure Overview Applied Water 37% Market Size: $14B 2011 Revenues: $1.4B 2011 Op Margin*: 12.0% Customers Residential & Commercial, Industrial Facilities, Agriculture Applied Water Overview Customers Public Utilities Industrial Facilities Distribution World-Class Global Direct Note: (1) Global market share based on company estimates. Distribution Primarily through World-Class Indirect (+70%) Channels 15 *Excluding separation costs of $16M *Excluding separation costs of $13M Revenue by Application Market Share (1) Transport 73% #1 Treatment 18% #1 Test 9% #2 Revenue by Application Market Share (1) Bldg. Services 51% #2 Industrial Water 42% #2 Irrigation 7% #3 Unique Position - Only Provider of All Three “T’s” Large Installed Base Growth Despite Slow New Construction (~70%) & Indirect Channels |
 Xylem Has a Focused Growth Strategy Organic Growth Organic Growth Emerging Markets Emerging Markets Acquisition Strategy Acquisition Strategy • Replicate leadership positions • Strong aftermarket opportunities • Innovative application solutions Organic & Inorganic Growth Expertise Organic & Inorganic Growth Expertise • Established footprint • Localized innovation centers • Focused BRIC & ROW Strategy • Disciplined approach • History of successful integration • Bolt-on, niche go-forward strategy 16 Long Term Growth Rates (1) $4.5B - $5.0B Market Growth Rates ~8% CAGR (1) Revenue growth rates based on 2011 revenue of $3,803. See Xylem October 13, 2011 Investor Day Presentation for further details. $M, unless otherwise indicated 2010 2011 2012E 2015E 3,202 3,803 ~3.8B • Developed • Emerging • Global 1 - 3% 8 - 10+% 3 - 5% Organic 4 - 6% 1 - 2% M&A |
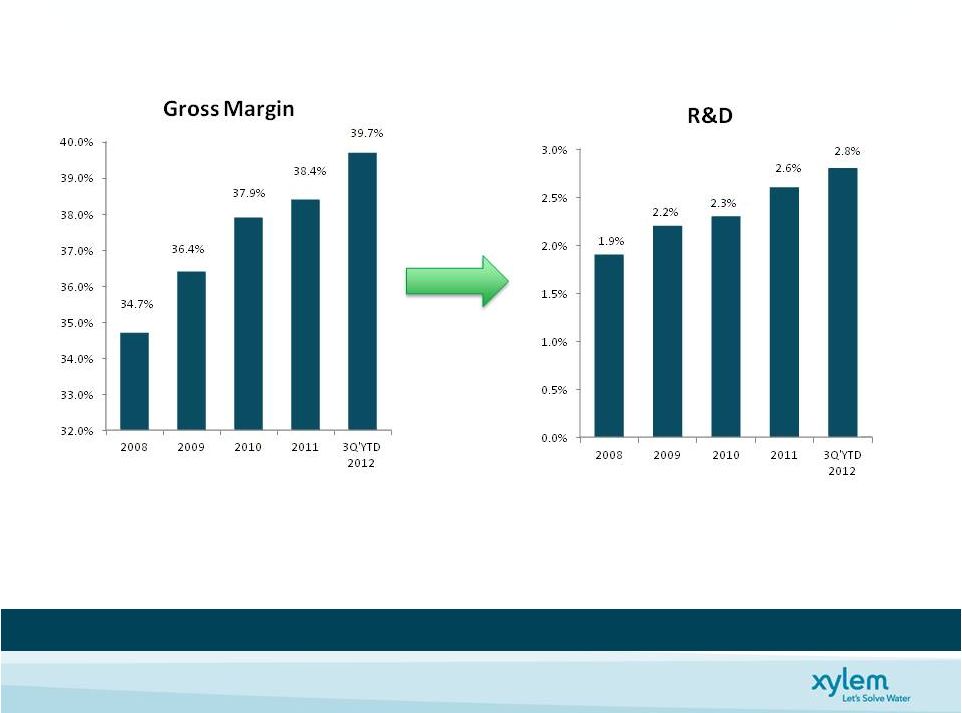 Gross Margin Improvement Funds Future Growth Xylem Continues to Invest While Increasing Profitability Xylem Continues to Invest While Increasing Profitability 17 • Operational and Commercial Excellence • Growth in Higher Margin Analytics and Dewatering applications • Xylem’s Water Infrastructure Direct Sales Force a Key Competitive Advantage |
 Public Utility & Industrial Transport & Treatment 18 Application Technologies • Waste Water Transport • Filtration • Biological Treatment • UV & Ozone Disinfection |
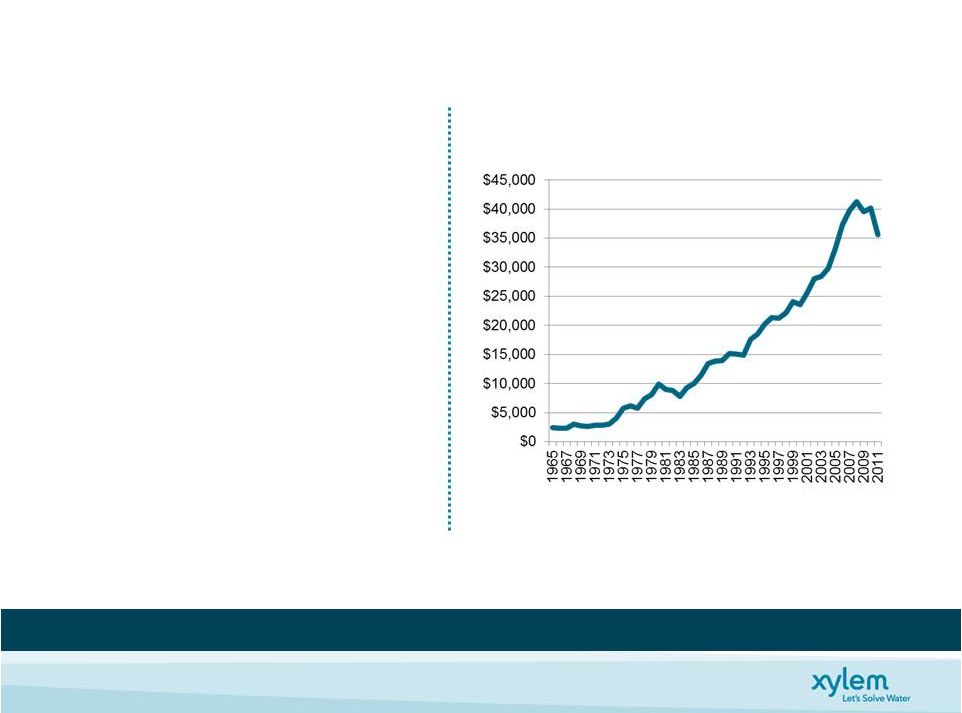 19 • 36% of Xylem Revenues related to Public Utility spending – in 2011: • ~$1B for Maintenance Activities • Public Utility spending grows long term • U.S.: ~6% CAGR 1965 – 2011 • Europe similar to U.S. • Asia Pacific growing faster • Funding of expenditures secure • ~80% funded by tariffs • Tariffs growing 8%/yr in U.S. • European Tariffs typically higher than U.S. • Funds typically can not be used for other purposes Strong Long-term Fundamentals…Xylem Provides Mission Critical Solutions Source: U.S. Census Bureau The Public Utility End Market • ~6% CAGR 1965 – 2011 • Only 3 years (‘69, ’83 and ‘11) saw >10% drop • 10% drop reduces Total XYL Revs. by ~(1-2) ppts U.S. Water and Sewer Construction Spending - $M |
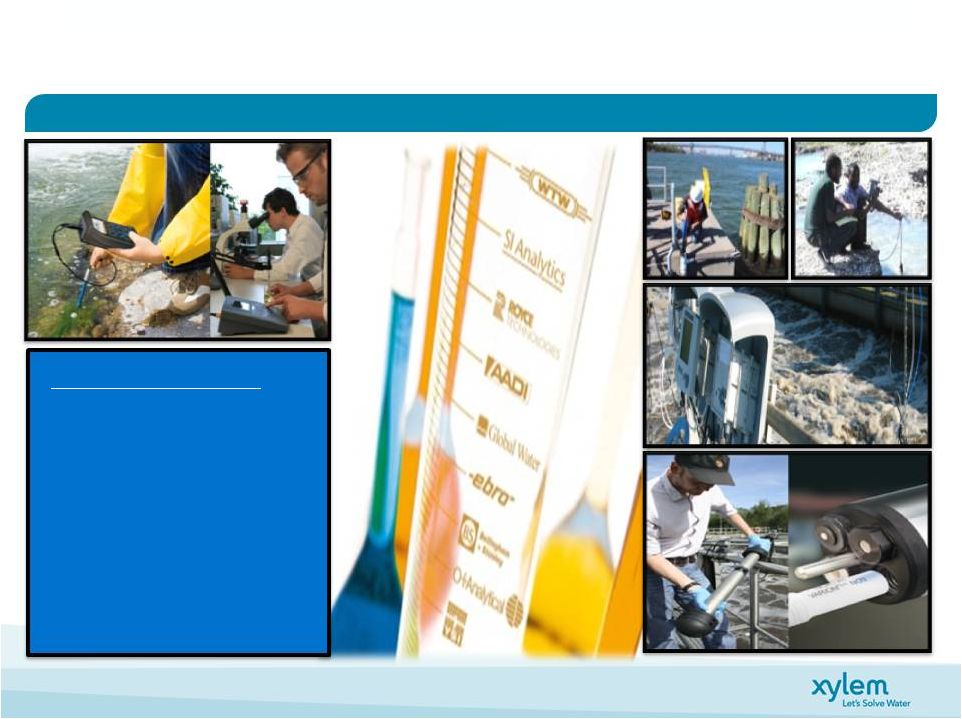 Test Applications 20 Diverse Applications • Environmental • Water & Waste Water • Food & Beverage • Chemical • Pharmaceutical • Ocean/Coastal Analytical Instrumentation Analytical Instrumentation |
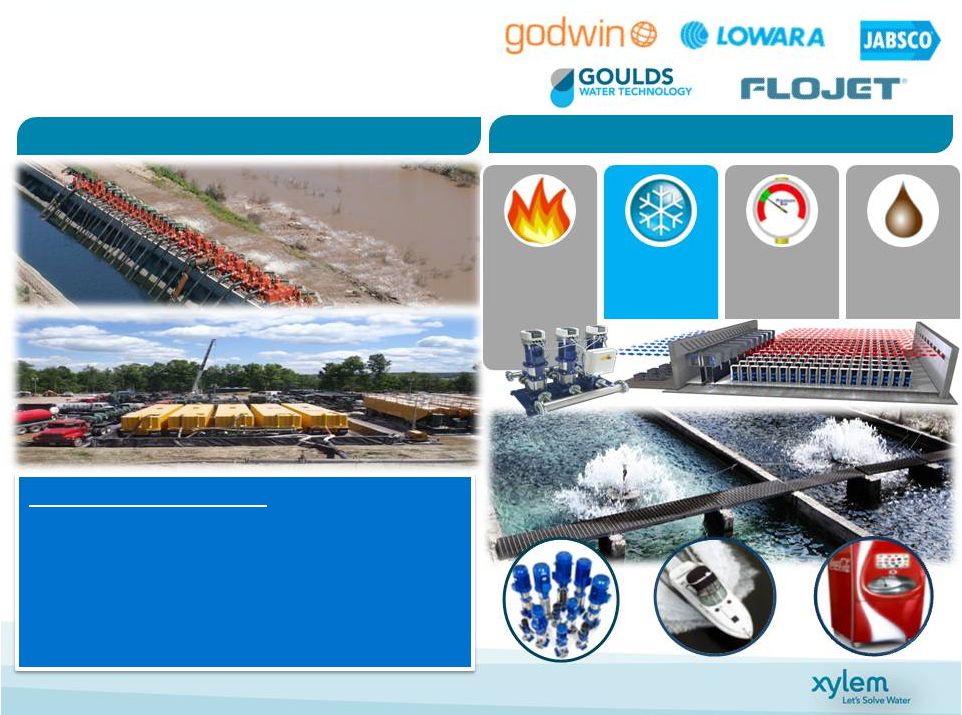 Dewatering and Industrial Water Applications 21 Diverse Applications • Construction • Disaster Recovery • Environmental • Heavy Industry • Mining • Oil, Gas & Chemical • Water & Waste Water • Marine Dewatering Applications Industrial Water Applications Heating Cooling Pressure Boosting Waste Water Removal |
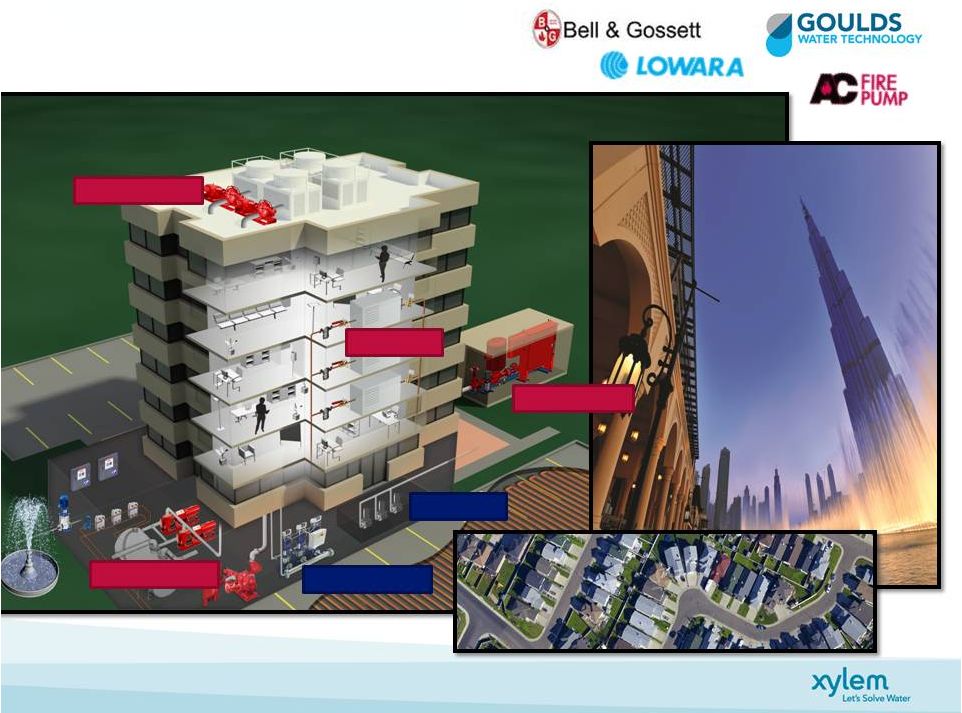 Commercial & Residential 22 Customers • Developers • Building Operators • Building Designers • HVAC Specialists • Contractors • Plumbers HVAC - Heating Pressure boosters Fire protection HVAC - Cooling Wastewater Zone Control |
 2012 Financial Guidance Summary 23 * See Appendix for Non-GAAP Reconciliations 2012 FY Guidance As of Nov. 1, 2012 Growth 2012E vs. 2011 Revenue Constant Currency Organic Acquisition Xylem Consolidated ~$3.8B ~3% 2% Water Infrastructure ~$2.4B ~5% 4% Applied Water ~$1.4B ~1% 0% Segment Margin * 14.1% - 14.3% +10 to +30 bps Operating Margin * 12.7% - 12.9% +0 to +20 bps EPS * $1.72 - $1.79 $1.76 Mid Point incl. Heartland Pump Acq. impact -$0.01 Free Cash Flow Conversion 95% Excluding one-time separation costs Guidance Assumptions: Stand-Alone Costs ~$28M Included in EPS Guidance; In Line with Expectations Operating Tax Rate ~25% Excludes Special Tax Items Share Count ~186.2M Items Excluded from Guidance: (1) Separation Costs ~$20M In Line with Expectations (2) Restructuring & Realignment Costs ~$20M Additional Actions Identified in 3Q’12 ~$11MTotal Run Rate Savings Beginning 2013 ~1% ~1% ~1% |
 Non-GAAP Measures 24 “Constant currency” defined as financial results adjusted for currency translation impacts by translating current period and prior period activity using the “EBITDA” defined as earnings before interest, taxes, depreciation, amortization expense, and share-based compensation. “Adjusted EBITDA” reflects "Adjusted Operating Income", "Adjusted Segment Operating Income", and “Adjusted EPS” defined as operating income and earnings per share, “Normalized EPS” defined as adjusted earnings per share, as well as adjustments to reflect the incremental current period amount of interest expense “Free Cash Flow” defined as net cash from operating activities, as reported in the Statement of Cash Flow, less capital expenditures as well as Management views key performance indicators including revenue, gross margins, segment operating income and margins, orders growth, free cash flow, working capital, and backlog, among others. In addition, we consider certain measures to be useful to management and investors evaluating our operating performance for the periods presented, and provide a tool for evaluating our ongoing operations, liquidity and management of assets. This information can assist investors in assessing our financial performance and measures our ability to generate capital for deployment among competing strategic alternatives and initiatives. These metrics, however, are not measures of financial performance under GAAP and should not be considered a substitute for revenue, operating income, net income, earnings per share (basic and diluted) or net cash from operations as determined in accordance with GAAP. We consider the following non-GAAP measures, which may not be comparable to similarly titled measures reported by other companies, to be key performance indicators: intercompany transactions, and contributions from acquisitions and divestitures. Divestitures include sales of portions of our business that did not meet the criteria for classification as a discontinued operation or insignificant portions of our business that we did not classify as a discontinued operation. The period-over-period change resulting from foreign currency fluctuations assumes no change in exchange rates from the prior period. same currency conversion rate. This approach is used for countries whose functional currency is not the U.S. dollar. the adjustment to EBITDA to exclude for one-time separation costs associated with the Xylem spin-off from ITT Corporation as well as one-time restructuring and realignment costs. adjusted to exclude one-time separation costs associated with the Xylem spin-off from ITT Corporation, one-time restructuring and realignment costs and tax-related special items. and stand alone costs in the prior comparable period. adjustments for other significant items that impact current results which management believes are not related to our ongoing operations and performance. Our definition of free cash flows does not consider non-discretionary cash payments, such as debt. “Organic revenue" and "Organic orders” defined as revenue and orders, respectively, excluding the impact of foreign currency fluctuations, |
 Non-GAAP Reconciliation: Earnings Per Share 25 FY 2009 FY 2010 FY 2011 Net Income 263 329 279 Separation costs, net of tax - - 72 Adjusted Net Income before Special Tax Items 263 329 351 Special Tax Items (61) (43) 7 Adjusted Net Income 202 286 358 Diluted Earnings per Share $1.42 $1.78 $1.50 Separation costs per Share - - $0.39 Adjusted diluted EPS before Special Tax Items $1.42 $1.78 $1.89 Special Tax Items per Share ($0.32) ($0.23) $0.04 Adjusted diluted EPS $1.10 $1.55 $1.93 Xylem Inc. Non-GAAP Reconciliation Adjusted Diluted EPS 2009, 2010, & 2011 ($ Millions, except per share amounts) |
 Non-GAAP Reconciliation: Guidance 26 Illustration of Mid Point Guidance 2012 Guidance FY '11 FY '12 As Reported Adjustments Adjusted Adjustments Normalized As Projected Adjustments Adjusted Total Revenue 3,803 3,803 3,803 3,800 3,800 Segment Operating Income 503 29 a 532 (10) d 522 516 25 h,i 541 Segment Operating Margin 13.2% 14.0% 13.7% 13.6% 14.2% Corporate Expense 108 (58) b 50 18 e 68 68 (15) h 53 Operating Income 395 87 482 (28) 454 448 40 488 Operating Margin 10.4% 12.7% 11.9% 11.8% 12.8% Interest Expense (17) (17) (39) f (56) (54) (54) Other Non-Operating Income (Expense) 5 5 5 (1) (1) Income before Taxes 383 87 470 (67) 403 393 40 433 Provision for Income Taxes (104) (8) c (112) 16 g (96) (99) (7) j (106) Net Income 279 79 358 (51) 307 294 33 327 Diluted Shares 185.3 185.3 186.2 186.2 Diluted EPS 1.50 $ 0.43 $ 1.93 $ (0.27) $ 1.66 1.58 0.18 1.76 a One time separation costs incurred at the segment level b One time separation costs incurred at the corporate level c Net tax impact of above items, plus the addition of 2011 special tax items d Incremental stand alone costs to be incurred in 2012 at the segment level ($10M) e Incremental stand alone costs to be incurred in 2012 at the corporate level ($18M) f Incremental interest expense on long-term debt to be incurred in 2012 g Tax impact of incremental interest expense and stand alone costs to be incurred in 2012 h Expected one time separation costs of $5M and $15M to be incurred at the segments and headquarters, respectively. i Restructuring & realignment costs of $20M to be incurred at the segments. j Tax impact of one time separation, restructuring & realignment costs expected to be incurred in 2012 and tax special items realized through Q3 2012. |
  Non-GAAP Reconciliation: Free Cash Flow 27 Xylem Inc. Non-GAAP Reconciliation Net Cash - Operating Activities vs. Free Cash Flow Years ended 2011, 2010, 2009, & 2008 ($ Millions) Year Ended 2011 2010 2009 2008 Net Cash - Operating Activities 449 395 370 408 Capital Expenditures (126) (94) (62) (67) Free Cash Flow, including separation costs 323 301 308 341 Separation Costs (Cash Paid incl. Capex) 65 - - - Free Cash Flow, excluding separation costs 388 301 308 341 Net Income 279 329 263 224 Separation Costs, net of tax 72 - - - Adjusted Net Income 351 329 263 224 Free Cash Flow Conversion 111% 91% 117% 152% |
 Non-GAAP Reconciliation: Adj. Operating Income & Margin 28 Mid Point Guidance 2008 2009 2010 2011 2012E Revenue 3,291 2,849 3,202 3,803 3,800 Operating Income 315 276 388 395 448 Operating Margin 9.6% 9.7% 12.1% 10.4% 11.8% Restructuring & Realignment 41 31 15 - 20 Separation Costs - - - 87 20 Adjusted Operating Income 356 307 403 482 488 Adjusted Operating Margin 10.8% 10.8% 12.6% 12.7% 12.8% Standalone Costs - - - 5 28 Adj. Operating Income, excl. Standalone Costs 356 307 403 487 516 Adjusted Operating Margin, excl. Standalone Costs 10.8% 10.8% 12.6% 12.8% 13.6% Xylem Inc. Non-GAAP Reconciliation Adjusted Operating Income ($ Millions) |
  29 Non-GAAP Reconciliation: 2012 Xylem EBITDA & Adj. EBITDA Q1 Q2 Q3 YTD Income Before Taxes 84 115 100 299 Interest, net 13 13 12 38 Depreciation 23 21 24 68 Amortization 11 12 12 35 Stock Compensation 5 5 6 16 EBITDA 136 166 154 456 Separation Costs 5 6 4 15 Restructuring & Realignment Costs - - 5 5 Adjusted EBITDA 141 172 163 476 Revenue 925 966 931 2,822 Adjusted EBITDA Margin 15.2% 17.8% 17.5% 16.9% Xylem Inc. Non-GAAP Reconciliation EBITDA and Adjusted EBITDA by Quarter Total Xylem ($ Millions) 2012 |
  30 Non-GAAP Reconciliation: 2011 Xylem EBITDA & Adj. EBITDA Q1 Q2 Q3 Q4 Total Pre-Tax Net Income 101 115 82 85 383 Interest, net - - 1 16 17 Depreciation 22 25 25 21 93 Amortization 11 10 11 12 44 Stock Compensation 3 2 2 6 13 EBITDA 137 152 121 140 550 Separation Costs 3 18 46 20 87 Adjusted EBITDA 140 170 167 160 637 Revenues 890 971 939 1,003 3,803 Adjusted EBITDA Margin 15.7% 17.5% 17.8% 16.0% 16.7% Xylem Inc. Non-GAAP Reconciliation EBITDA and Adjusted EBITDA by Quarter ($ Millions) 2011 Total Xylem |