Item 1. Reports to Stockholders.
The following is a copy of the report transmitted to shareholders pursuant to Rule 30e-1 under the Investment Company Act of 1940 (17 CFR 270.30e-1).
Vericimetry U.S. Small Cap Value Fund
Annual Report
September 30, 2013
Vericimetry Funds
| Letter to Shareholders | 1 |
| Manager’s Discussion and Analysis | 2 |
| Performance Summary | 3 |
| Schedule of Investments | 4 |
| Financial Statements | 17 |
| Financial Highlights | 20 |
| Notes to Financial Statements | 21 |
| Report of Independent Registered Public Accounting Firm | 26 |
| Expense Example | 27 |
| Proxy Voting | 28 |
| Quarterly Holdings | 28 |
| Risk Disclosures | 28 |
| Trustees and Officers | 29 |
This report has been prepared for shareholders and may be distributed to others only if preceded or accompanied by a current prospectus.
Except for historical information, the matters discussed in this report may constitute forward-looking statements. These include any predictions, assessments, analyses or outlooks for individual securities, industries, market sectors and/or markets. These statements involve risks and uncertainties. In addition to the general risks described for the Fund in the current prospectus, other factors bearing on these statements include the accuracy of the Adviser’s forecasts and predictions, and the appropriateness of the investment programs designed by the Adviser to implement its strategies efficiently and effectively. Any one or more of these factors, as well as other risks affecting the securities markets and investment instruments generally, could cause the actual results of the Fund to differ materially as compared to applicable benchmarks.
Vericimetry Funds
LETTER TO SHAREHOLDERS
September 30, 2013 (Unaudited)
Dear Shareholders,
We are pleased to present the enclosed annual report for the Vericimetry U.S. Small Cap Value Fund (the “Fund”) for the fiscal year ended September 30, 2013.
Vericimetry Advisors, LLC (the “Adviser”) is an academically based, quantitatively structured investment adviser providing capacity-constrained asset class strategies to an exclusive group of elite financial advisors.
The Fund invests in a wide and diverse universe of U.S. small cap value stocks using a structured quantitative investment approach based on a set of well defined, fundamental characteristics to identify value stocks. We identify value stocks by considering multiple factors such as book-to-market, price-to-earnings, price-to-sales or price-to-operating cash flow. (1)
The Fund is managed with the intent of maintaining a reasonably priced management fee and low transactions costs, expenses and turnover in an effort to enhance net returns to the investor. We are committed to limit the growth of its assets under management once optimal capacity for the Fund is achieved.
Our capacity planned approach, working with an exclusive set of financial advisors, seeks to provide exposure to the small and value equity risk premiums. The portfolio pursues a purer value by using a multifactor screening approach and focuses on a set of smaller capitalized stocks by its thoughtful academically based quantitatively structured methodology.
We thank you for your investment in the Vericimetry U.S. Small Cap Value Fund and the confidence and trust you place in Vericimetry.
Sincerely
Dr. Glenn S. Freed
Chief Executive Officer
Economic, political, and issuer specific events will cause the value of securities to rise or fall. Because the value of your investment in the Fund will fluctuate, there is the risk that you will lose money. Securities of small and microcap companies are often less liquid, more volatile and they may have more limited resources. Value stocks may perform differently from the market as a whole and may underperform equity funds that use other investment strategies. The investment strategies, practices and risk analysis used by the Adviser may not produce the desired results.
| (1) | Book-to-market is the value ratio of a company’s book value to its market value. Price-to-earnings, price-to-sales and price-to-operating cash flow ratios are the value of a company’s share price compared to its previous twelve months earnings per share, sales per share or operating cash flow per share, respectively. |
Vericimetry Funds
Manager’s Discussion and Analysis
September 30, 2013 (Unaudited)
The Fund started the fiscal year, on October 1, 2012, with $38.8 million in assets under management (“AUM”) and closed the fiscal year, on September 30, 2013, with $103.8 million in AUM – an increase of more than 160% in AUM.
The fiscal year under review provides an excellent business cycle in which to view the Fund’s investment style and purpose. The results of this fiscal year show that the Fund closely follows its stated investment style and purpose: to deliver size and value risk premiums using a wide and well-diversified portfolio of publically traded securities. The securities in the Fund’s portfolio are smaller in size and deeper in value than the securities in its benchmark – the Russell 2000 Value Index (the “Benchmark”). In the analysis that follows, returns quoted for both the Fund and the Benchmark include both price appreciation/depreciation and reinvestment of dividends.
The Fund had positive return performance for all four quarters of the fiscal year ending September 30, 2013. The Fund’s return outperformed the Benchmark for each quarterly fiscal period. For the fiscal year overall, the Fund’s annual return was strong on both an absolute and a relative basis, gaining 34.88% versus 27.04% for the Benchmark. The Fund was almost fully invested, well-diversified with over 1,000 holdings, and each of its equity positions was under 0.46% in portfolio weight at fiscal year-end.
Examining the returns of different segments of the U.S. equity markets over this fiscal year provides additional information (see below). The broad market had strong positive returns, as illustrated by the Russell 3000 Index. Large cap stocks, represented by the Russell 1000 Index, had substantially lower returns while small cap stocks, represented by the Russell 2000 Indices, were stronger. This positively impacted relative returns of the Fund, which had greater exposure to the small cap segment of the market. Furthermore, the smaller company investment design contributed to the Fund’s returns given that microcap stocks, as represented by the Russell Microcap Index, had the highest returns over this fiscal period.
Within the Russell small cap universe, value indices had lower returns than growth indices, but this only resulted in a modest drag on the Fund’s performance. Similarly, within the Russell microcap universe, value indices had lower returns than growth indices. However, the Fund’s deeper and purer multi-factor approach to value was rewarded during the fiscal period, counterbalancing growth indices’ returns.
Two other notable factors affecting the Fund’s performance were real estate investment trusts (“REITs”) and utility stocks. The Fund does not hold REITs by design, so investors can consider REITs as a separate asset class. The Fund also does not invest in utility stocks because the regulated nature of the industry diminishes the risk and return profile of utilities. By contrast, the Russell indices do hold REITs and utility stocks, with the Russell 2000 Value Index having a REIT weight above 10% and a Utility stock weight above 5%. Both REITs and utilities had weak returns this fiscal year, enhancing the Fund’s performance compared to the Benchmark.
Overall, the fiscal year was strong in terms of absolute and relative returns, while providing shareholders well-diversified exposure to the small size and value risk premiums.
Returns for the Fiscal Year Ended September 30, 2013
Russell 3000® Index (broad market) | 21.60% |
Russell 1000® Index (large cap) | 20.91% |
Russell 2000® Index (small cap) | 30.06% |
Russell Microcap® Index (microcap) | 32.12% |
Russell 2000® Value Index | 27.04% |
Russell 2000® Growth Index | 33.07% |
Russell Microcap® Value Index | 30.29% |
Russell Microcap® Growth Index | 34.99% |
Source: Russell Investment Group
Vericimetry Funds
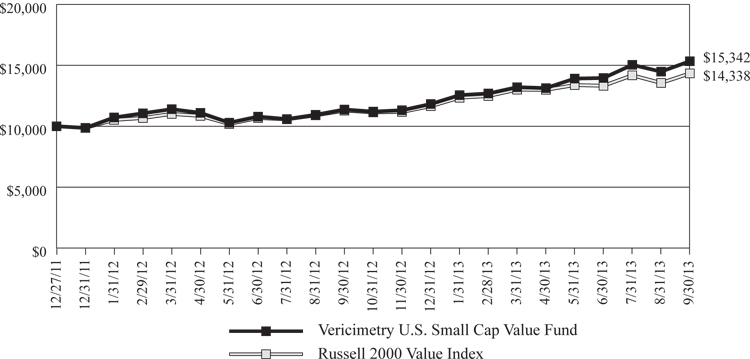
PERFORMANCE SUMMARY (Unaudited)
For the Period from December 27, 2011** to September 30, 2013
| Comparison of a Hypothetical $10,000 Investment |
| in the Vericimetry U.S. Small Cap Value Fund and the Russell 2000 Value Index* |
Total Returns For the periods ended September 30, 2013 |
| | | Average Annual Since Inception ** | |
| Vericimetry U.S. Small Cap Value Fund | 34.88% | 27.50% | |
| Russell 2000 Value Index | 27.04% | 22.70% | |
| | | | |
| * | The Russell 2000 Value Index measures the performance of small-cap value segment of the U.S. equity universe. It includes those Russell 2000 Index companies with lower price-to-book ratios and lower forecasted growth values. |
| ** | Commencement of operations for the Vericimetry U.S. Small Cap Value Fund was December 27, 2011. |
The Fund’s net expense ratio of 0.60% and gross expense ratio of 2.80% are reflective of the information disclosed in the Fund’s prospectus dated February 1, 2013 and may differ from the expense ratios disclosed in this report. The Adviser has contractually agreed to waive all or a portion of its management fees and/or reimburse expenses at least through January 31, 2015 in order to keep the Fund’s net annual operating expenses from exceeding 0.60% of its average daily net assets. Performance data quoted represents past performance which is not predictive of future performance. The investment return and principal value of Fund shares will fluctuate and when redeemed, may be worth more or less than their original cost. Current performance may be lower or higher than the performance information quoted. To receive current performance to the most recent month end, please call 1-855-755-7550. Please read prospectus carefully before investing.
The line graph and table do not reflect the deduction of taxes that a shareholder would pay on Fund distributions or the redemption of Fund shares.
The Fund’s results as shown are net of fees.
Vericimetry U.S. Small Cap Value Fund
SCHEDULE OF INVESTMENTS
As of September 30, 2013
| | | | | | | |
| COMMON STOCKS – 99.7% | | | | | | |
| BASIC MATERIALS – 5.2% | | | | | | |
| A Schulman, Inc. | | | 7,200 | | | $ | 212,112 | |
| Aceto Corp. | | | 4,065 | | | | 63,495 | |
| Allied Nevada Gold Corp.* | | | 29,000 | | | | 121,220 | |
| Boise, Inc. | | | 22,400 | | | | 282,240 | |
Century Aluminum Co.*, 1 | | | 18,866 | | | | 151,871 | |
| Charles & Colvard Ltd.* | | | 4,000 | | | | 28,040 | |
Codexis, Inc.*, 1 | | | 24,300 | | | | 42,768 | |
| Coeur Mining, Inc.* | | | 24,000 | | | | 289,200 | |
Commercial Metals Co.1 | | | 25,500 | | | | 432,225 | |
| Friedman Industries, Inc. | | | 3,500 | | | | 35,000 | |
Horsehead Holding Corp.*, 1 | | | 10,400 | | | | 129,584 | |
Intrepid Potash, Inc.1 | | | 8,400 | | | | 131,712 | |
Kaiser Aluminum Corp.1 | | | 4,400 | | | | 313,500 | |
| Kraton Performance Polymers, Inc.* | | | 8,400 | | | | 164,556 | |
Kronos Worldwide, Inc.1 | | | 21,500 | | | | 333,035 | |
| Landec Corp.* | | | 5,600 | | | | 68,320 | |
| Material Sciences Corp.* | | | 4,600 | | | | 43,148 | |
| Materion Corp. | | | 4,800 | | | | 153,888 | |
Minerals Technologies, Inc.1 | | | 4,000 | | | | 197,480 | |
Molycorp, Inc.*, 1 | | | 22,000 | | | | 144,320 | |
| Noranda Aluminum Holding Corp. | | | 20,710 | | | | 50,947 | |
Northern Technologies International Corp.*, 1 | | | 2,300 | | | | 38,686 | |
| Olin Corp. | | | 14,500 | | | | 334,515 | |
| OM Group, Inc.* | | | 7,100 | | | | 239,838 | |
| Penford Corp.* | | | 3,600 | | | | 51,552 | |
| PH Glatfelter Co. | | | 5,200 | | | | 140,764 | |
Schnitzer Steel Industries, Inc. - Class A1 | | | 5,900 | | | | 162,486 | |
| Sensient Technologies Corp. | | | 9,700 | | | | 464,533 | |
| Shiloh Industries, Inc. | | | 3,320 | | | | 43,492 | |
Stillwater Mining Co.*, 1 | | | 19,400 | | | | 213,594 | |
| Universal Stainless & Alloy Products, Inc.* | | | 2,600 | | | | 84,578 | |
| Zep, Inc. | | | 6,000 | | | | 97,560 | |
Zoltek Cos., Inc.*, 1 | | | 6,700 | | | | 111,823 | |
| | | | | | | | 5,372,082 | |
| COMMUNICATIONS – 6.6% | | | | | | | | |
| 1-800-Flowers.com, Inc. - Class A* | | | 2,570 | | | | 12,670 | |
| Active Network, Inc.* | | | 13,400 | | | | 191,754 | |
| AH Belo Corp. - Class A | | | 4,235 | | | | 33,245 | |
| Anaren, Inc.* | | | 2,762 | | | | 70,431 | |
| ARRIS Group, Inc.* | | | 26,800 | | | | 457,208 | |
Aviat Networks, Inc.*, 1 | | | 10,600 | | | | 27,348 | |
| Aware, Inc. | | | 6,300 | | | | 34,398 | |
| Beasley Broadcasting Group, Inc. - Class A | | | 2,900 | | | | 25,201 | |
| Black Box Corp. | | | 2,900 | | | | 88,856 | |
| Blucora, Inc.* | | | 5,700 | | | | 130,986 | |
CafePress, Inc.*, 1 | | | 4,100 | | | | 25,092 | |
| Calix, Inc.* | | | 5,600 | | | | 71,288 | |
| | | Number of Shares | | | Value | |
| COMMON STOCKS (Continued) | | | | | | |
| COMMUNICATIONS (Continued) | | | | | | |
| Cbeyond, Inc.* | | | 5,500 | | | $ | 35,255 | |
| Central European Media Enterprises Ltd. - Class A* | | | 8,400 | | | | 44,268 | |
ClearOne, Inc.*, 1 | | | 3,000 | | | | 24,330 | |
| Communications Systems, Inc. | | | 1,900 | | | | 21,489 | |
| Comtech Telecommunications Corp. | | | 3,826 | | | | 93,048 | |
Courier Corp.1 | | | 1,800 | | | | 28,476 | |
Demand Media, Inc.*, 1 | | | 22,150 | | | | 139,988 | |
Dex Media, Inc.*, 1 | | | 1,946 | | | | 15,819 | |
Digital Generation, Inc.*, 1 | | | 8,800 | | | | 113,784 | |
Dolan Co.*, 1 | | | 11,200 | | | | 25,312 | |
EarthLink, Inc.1 | | | 17,000 | | | | 84,150 | |
Entercom Communications Corp. - Class A*, 1 | | | 8,600 | | | | 75,508 | |
Envivio, Inc.*, 1 | | | 5,000 | | | | 15,700 | |
| ePlus, Inc. | | | 1,424 | | | | 73,592 | |
| EW Scripps Co. - Class A* | | | 11,300 | | | | 207,355 | |
| Extreme Networks, Inc.* | | | 10,000 | | | | 52,200 | |
FAB Universal Corp.*, 1 | | | 8,400 | | | | 61,908 | |
| Finisar Corp.* | | | 14,400 | | | | 325,872 | |
| Global Sources Ltd.* | | | 6,300 | | | | 46,746 | |
| Globecomm Systems, Inc.* | | | 3,400 | | | | 47,702 | |
| Gray Television, Inc. - Class A* | | | 4,881 | | | | 35,363 | |
| Harmonic, Inc.* | | | 18,200 | | | | 139,958 | |
| Harte-Hanks, Inc. | | | 12,968 | | | | 114,508 | |
Hawaiian Telcom Holdco, Inc.*, 1 | | | 2,300 | | | | 61,180 | |
ICG Group, Inc.*, 1 | | | 4,800 | | | | 68,112 | |
ID Systems, Inc.*, 1 | | | 1,600 | | | | 9,856 | |
| Inteliquent, Inc. | | | 5,000 | | | | 48,300 | |
| IntraLinks Holdings, Inc.* | | | 11,800 | | | | 103,840 | |
Iridium Communications, Inc.*, 1 | | | 18,000 | | | | 123,840 | |
| Journal Communications, Inc. - Class A* | | | 11,500 | | | | 98,325 | |
| KVH Industries, Inc.* | | | 2,600 | | | | 35,880 | |
| Leap Wireless International, Inc.* | | | 10,600 | | | | 167,374 | |
Limelight Networks, Inc.*, 1 | | | 26,200 | | | | 50,566 | |
Local Corp.*, 1 | | | 5,000 | | | | 9,700 | |
Marchex, Inc. - Class B1 | | | 4,800 | | | | 34,944 | |
| Martha Stewart Living Omnimedia, Inc. - Class A* | | | 10,000 | | | | 23,000 | |
MeetMe, Inc.*, 1 | | | 15,000 | | | | 27,150 | |
Meredith Corp.1 | | | 2,200 | | | | 104,764 | |
| ModusLink Global Solutions, Inc.* | | | 14,200 | | | | 38,908 | |
| NeoPhotonics Corp.* | | | 7,700 | | | | 56,903 | |
| NETGEAR, Inc.* | | | 8,900 | | | | 274,654 | |
NII Holdings, Inc.*, 1 | | | 35,400 | | | | 214,878 | |
| Novatel Wireless, Inc.* | | | 8,700 | | | | 22,707 | |
Oclaro, Inc.*, 1 | | | 36,950 | | | | 65,402 | |
See accompanying Notes to Financial Statements.
Vericimetry U.S. Small Cap Value Fund
SCHEDULE OF INVESTMENTS (Continued)
As of September 30, 2013
| | | | | | | |
| COMMON STOCKS (Continued) | | | | | | |
| COMMUNICATIONS (Continued) | | | | | | |
| PC-Tel, Inc. | | | 3,100 | | | $ | 27,435 | |
| Perficient, Inc.* | | | 5,500 | | | | 100,980 | |
Polycom, Inc.*, 1 | | | 30,300 | | | | 330,876 | |
| Preformed Line Products Co. | | | 490 | | | | 35,246 | |
| Premiere Global Services, Inc.* | | | 12,811 | | | | 127,598 | |
| Primus Telecommunications Group, Inc. | | | 6,000 | | | | 20,340 | |
QuinStreet, Inc.*, 1 | | | 10,800 | | | | 102,060 | |
| Radio One, Inc. - Class A* | | | 5,841 | | | | 15,303 | |
Radio One, Inc. - Class D*, 1 | | | 12,878 | | | | 34,642 | |
| RealNetworks, Inc.* | | | 9,500 | | | | 81,320 | |
RLJ Entertainment, Inc.*, 1 | | | 6,000 | | | | 31,200 | |
| Salem Communications Corp. - Class A | | | 3,300 | | | | 27,324 | |
Scholastic Corp.1 | | | 5,900 | | | | 169,035 | |
| Shenandoah Telecommunications Co. | | | 3,700 | | | | 89,170 | |
| ShoreTel, Inc.* | | | 15,000 | | | | 90,600 | |
| Symmetricom, Inc.* | | | 11,800 | | | | 56,876 | |
Synacor, Inc.*, 1 | | | 10,000 | | | | 25,800 | |
TeleCommunication Systems, Inc. - Class A*, 1 | | | 22,103 | | | | 54,373 | |
| Telenav, Inc.* | | | 9,111 | | | | 53,208 | |
| Tellabs, Inc. | | | 66,300 | | | | 150,501 | |
Tessco Technologies, Inc.1 | | | 1,600 | | | | 53,920 | |
| TheStreet, Inc.* | | | 5,300 | | | | 11,077 | |
| U.S. Auto Parts Network, Inc.* | | | 7,400 | | | | 9,768 | |
| United Online, Inc. | | | 19,730 | | | | 157,445 | |
UniTek Global Services, Inc.*, 1 | | | 3,930 | | | | 4,677 | |
| USA Mobility, Inc. | | | 5,300 | | | | 75,048 | |
Voltari Corp.*, 1 | | | 668 | | | | 3,560 | |
Vonage Holdings Corp.*, 1 | | | 26,300 | | | | 82,582 | |
Zynga, Inc. - Class A*, 1 | | | 48,800 | | | | 179,584 | |
| | | | | | | | 6,832,639 | |
| CONSUMER, CYCLICAL – 14.0% | | | | | | | | |
| Ambassadors Group, Inc. | | | 3,400 | | | | 11,730 | |
| America's Car-Mart, Inc.* | | | 1,700 | | | | 76,687 | |
AMREP Corp.*, 1 | | | 2,595 | | | | 22,551 | |
| Ark Restaurants Corp. | | | 900 | | | | 19,278 | |
Barnes & Noble, Inc.*, 1 | | | 7,400 | | | | 95,756 | |
| Bassett Furniture Industries, Inc. | | | 2,850 | | | | 46,141 | |
Beazer Homes USA, Inc.*, 1 | | | 3,700 | | | | 66,600 | |
bebe stores, Inc.1 | | | 19,000 | | | | 115,710 | |
| Biglari Holdings, Inc.* | | | 159 | | | | 65,615 | |
Black Diamond, Inc.*, 1 | | | 8,600 | | | | 104,576 | |
| Bob Evans Farms, Inc. | | | 3,000 | | | | 171,810 | |
| Body Central Corp.* | | | 2,900 | | | | 17,690 | |
| Bravo Brio Restaurant Group, Inc.* | | | 500 | | | | 7,550 | |
Brown Shoe Co., Inc.1 | | | 6,700 | | | | 157,249 | |
| Build-A-Bear Workshop, Inc.* | | | 6,171 | | | | 43,074 | |
| | | | | | | |
| COMMON STOCKS (Continued) | | | | | | |
| CONSUMER, CYCLICAL (Continued) | | | | | | |
Callaway Golf Co.1 | | | 17,000 | | | $ | 121,040 | |
| Carrols Restaurant Group, Inc.* | | | 8,276 | | | | 50,484 | |
Cash America International, Inc.1 | | | 5,600 | | | | 253,568 | |
Cato Corp. - Class A1 | | | 4,500 | | | | 125,910 | |
| Century Casinos, Inc.* | | | 11,000 | | | | 62,920 | |
| Children's Place Retail Stores, Inc.* | | | 400 | | | | 23,144 | |
| Churchill Downs, Inc. | | | 1,160 | | | | 100,363 | |
Citi Trends, Inc.*, 1 | | | 4,100 | | | | 71,668 | |
| Columbia Sportswear Co. | | | 6,300 | | | | 379,449 | |
| Compx International, Inc. | | | 1,794 | | | | 23,286 | |
| Core-Mark Holding Co., Inc. | | | 2,500 | | | | 166,100 | |
| Crocs, Inc.* | | | 16,500 | | | | 224,565 | |
| Crown Crafts, Inc. | | | 2,560 | | | | 18,432 | |
dELiA*s, Inc.*, 1 | | | 18,000 | | | | 21,780 | |
| Delta Apparel, Inc.* | | | 3,000 | | | | 49,680 | |
| Destination XL Group, Inc.* | | | 7,700 | | | | 49,819 | |
| Dixie Group, Inc.* | | | 2,751 | | | | 30,646 | |
| Dover Downs Gaming & Entertainment, Inc. | | | 5,900 | | | | 8,024 | |
Dover Motorsports, Inc.1 | | | 8,000 | | | | 19,280 | |
DreamWorks Animation SKG, Inc. - Class A*, 1 | | | 3,800 | | | | 108,148 | |
| Emerson Radio Corp.* | | | 19,000 | | | | 35,720 | |
| Escalade, Inc. | | | 4,700 | | | | 40,467 | |
| Ezcorp, Inc. - Class A* | | | 10,500 | | | | 177,240 | |
Federal-Mogul Corp.*, 1 | | | 16,686 | | | | 280,158 | |
Finish Line, Inc. - Class A1 | | | 8,000 | | | | 198,960 | |
| Flexsteel Industries, Inc. | | | 1,872 | | | | 46,744 | |
Fred's, Inc. - Class A1 | | | 5,700 | | | | 89,205 | |
| Frisch's Restaurants, Inc. | | | 1,600 | | | | 38,608 | |
| Fuel Systems Solutions, Inc.* | | | 5,400 | | | | 106,164 | |
Full House Resorts, Inc.*, 1 | | | 7,900 | | | | 21,962 | |
| G&K Services, Inc. - Class A | | | 1,700 | | | | 102,663 | |
| G-III Apparel Group Ltd.* | | | 2,400 | | | | 131,016 | |
| Gaiam, Inc. - Class A* | | | 4,600 | | | | 23,046 | |
| Gaming Partners International Corp. | | | 1,516 | | | | 12,295 | |
| Genesco, Inc.* | | | 2,800 | | | | 183,624 | |
| Group 1 Automotive, Inc. | | | 4,300 | | | | 334,024 | |
Haverty Furniture Cos., Inc.1 | | | 2,600 | | | | 63,778 | |
Hawaiian Holdings, Inc.*, 1 | | | 13,400 | | | | 99,696 | |
hhgregg, Inc.*, 1 | | | 7,500 | | | | 134,325 | |
| Hooker Furniture Corp. | | | 3,600 | | | | 53,820 | |
Iconix Brand Group, Inc.*, 1 | | | 9,000 | | | | 298,980 | |
| International Speedway Corp. - Class A | | | 2,600 | | | | 83,980 | |
| Isle of Capri Casinos, Inc.* | | | 4,570 | | | | 34,549 | |
JAKKS Pacific, Inc.1 | | | 7,500 | | | | 33,675 | |
JetBlue Airways Corp.*, 1 | | | 56,500 | | | | 376,290 | |
See accompanying Notes to Financial Statements.
Vericimetry U.S. Small Cap Value Fund
SCHEDULE OF INVESTMENTS (Continued)
As of September 30, 2013
| | | | | | | |
| COMMON STOCKS (Continued) | | | | | | |
| CONSUMER, CYCLICAL (Continued) | | | | | | |
Joe's Jeans, Inc.*, 1 | | | 31,722 | | | $ | 33,943 | |
| Johnson Outdoors, Inc. - Class A* | | | 2,600 | | | | 69,732 | |
Jones Group, Inc.1 | | | 17,900 | | | | 268,679 | |
Jos A Bank Clothiers, Inc.*, 1 | | | 6,900 | | | | 303,324 | |
| Kimball International, Inc. - Class B | | | 7,000 | | | | 77,630 | |
| Kirkland's, Inc.* | | | 3,500 | | | | 64,540 | |
| La-Z-Boy, Inc. | | | 6,500 | | | | 147,615 | |
LeapFrog Enterprises, Inc.*, 1 | | | 10,100 | | | | 95,142 | |
Life Time Fitness, Inc.*, 1 | | | 5,900 | | | | 303,673 | |
| Lifetime Brands, Inc. | | | 3,700 | | | | 56,573 | |
| Luby's, Inc.* | | | 5,100 | | | | 36,618 | |
M/I Homes, Inc.*, 1 | | | 6,000 | | | | 123,720 | |
| Marcus Corp. | | | 3,500 | | | | 50,855 | |
| MarineMax, Inc.* | | | 7,500 | | | | 91,500 | |
| Marriott Vacations Worldwide Corp.* | | | 7,900 | | | | 347,600 | |
| MDC Holdings, Inc. | | | 9,000 | | | | 270,090 | |
| Men's Wearhouse, Inc. | | | 9,300 | | | | 316,665 | |
| Miller Industries, Inc. | | | 2,400 | | | | 40,752 | |
| Modine Manufacturing Co.* | | | 6,300 | | | | 92,169 | |
| Monarch Casino & Resort, Inc.* | | | 1,800 | | | | 34,164 | |
Office Depot, Inc.*, 1 | | | 33,300 | | | | 160,839 | |
OfficeMax, Inc.1 | | | 10,500 | | | | 134,295 | |
| Pantry, Inc.* | | | 7,801 | | | | 86,435 | |
PC Connection, Inc.1 | | | 6,600 | | | | 99,594 | |
| PCM, Inc.* | | | 3,600 | | | | 33,480 | |
Pep Boys-Manny Moe & Jack*, 1 | | | 9,800 | | | | 122,206 | |
Perfumania Holdings, Inc.*, 1 | | | 3,800 | | | | 18,316 | |
| Perry Ellis International, Inc. | | | 3,200 | | | | 60,288 | |
| Quiksilver, Inc.* | | | 29,800 | | | | 209,494 | |
RadioShack Corp.*, 1 | | | 20,000 | | | | 68,200 | |
| Reading International, Inc. - Class A* | | | 4,200 | | | | 27,594 | |
Red Lion Hotels Corp.*, 1 | | | 3,800 | | | | 20,026 | |
Regis Corp.1 | | | 8,860 | | | | 130,065 | |
Remy International, Inc.1 | | | 6,300 | | | | 127,512 | |
| Republic Airways Holdings, Inc.* | | | 11,900 | | | | 141,610 | |
| RG Barry Corp. | | | 3,000 | | | | 56,730 | |
| Rick's Cabaret International, Inc.* | | | 1,642 | | | | 19,359 | |
| Rocky Brands, Inc. | | | 2,800 | | | | 48,748 | |
| Roundy's, Inc. | | | 7,800 | | | | 67,080 | |
| Ruby Tuesday, Inc.* | | | 15,000 | | | | 112,500 | |
| Rush Enterprises, Inc. - Class A* | | | 5,395 | | | | 143,021 | |
Rush Enterprises, Inc. - Class B*, 1 | | | 2,580 | | | | 58,747 | |
Saks, Inc.*, 1 | | | 18,700 | | | | 298,078 | |
| ScanSource, Inc.* | | | 5,187 | | | | 179,470 | |
| Scientific Games Corp. - Class A* | | | 2,000 | | | | 32,340 | |
Sears Hometown and Outlet Stores, Inc.*, 1 | | | 4,600 | | | | 146,050 | |
| Shoe Carnival, Inc. | | | 3,400 | | | | 91,834 | |
| | | | | | | |
| COMMON STOCKS (Continued) | | | | | | |
| CONSUMER, CYCLICAL (Continued) | | | | | | |
| Skechers U.S.A., Inc. - Class A* | | | 6,200 | | | $ | 192,882 | |
Skullcandy, Inc.*, 1 | | | 6,500 | | | | 40,170 | |
| Skyline Corp.* | | | 140 | | | | 696 | |
| SkyWest, Inc. | | | 13,000 | | | | 188,760 | |
Spartan Motors, Inc.1 | | | 6,600 | | | | 40,062 | |
| Speed Commerce, Inc.* | | | 7,800 | | | | 25,584 | |
| Speedway Motorsports, Inc. | | | 9,419 | | | | 168,600 | |
Stage Stores, Inc.1 | | | 7,500 | | | | 144,000 | |
Standard Motor Products, Inc.1 | | | 700 | | | | 22,512 | |
Stanley Furniture Co., Inc.*, 1 | | | 10,355 | | | | 38,417 | |
Stein Mart, Inc.1 | | | 5,900 | | | | 80,948 | |
| Strattec Security Corp. | | | 700 | | | | 26,845 | |
| Superior Industries International, Inc. | | | 5,300 | | | | 94,499 | |
| Superior Uniform Group, Inc. | | | 1,120 | | | | 14,022 | |
| Supreme Industries, Inc. - Class A* | | | 4,500 | | | | 28,710 | |
| Systemax, Inc. | | | 6,723 | | | | 62,322 | |
| Tandy Leather Factory, Inc.* | | | 2,176 | | | | 17,125 | |
| Tilly's, Inc.* | | | 1,697 | | | | 24,623 | |
Titan International, Inc.1 | | | 12,200 | | | | 178,608 | |
Titan Machinery, Inc.*, 1 | | | 4,900 | | | | 78,743 | |
| Trans World Entertainment Corp. | | | 9,000 | | | | 41,670 | |
Tuesday Morning Corp.*, 1 | | | 5,300 | | | | 80,931 | |
| Unifi, Inc.* | | | 3,600 | | | | 84,096 | |
| UniFirst Corp. | | | 2,300 | | | | 240,166 | |
| United Stationers, Inc. | | | 3,700 | | | | 160,950 | |
| Universal Electronics, Inc.* | | | 3,087 | | | | 111,225 | |
| VOXX International Corp.* | | | 4,500 | | | | 61,650 | |
Wendy's Co.1 | | | 37,900 | | | | 321,392 | |
| Wesco Aircraft Holdings, Inc.* | | | 11,800 | | | | 246,974 | |
| West Marine, Inc.* | | | 7,200 | | | | 87,840 | |
| Weyco Group, Inc. | | | 1,600 | | | | 45,312 | |
Zale Corp.*, 1 | | | 5,200 | | | | 79,040 | |
| | | | | | | | 14,479,581 | |
| CONSUMER, NON-CYCLICAL – 14.7% | | | | | | | | |
| Aaron's, Inc. | | | 13,260 | | | | 367,302 | |
| ABM Industries, Inc. | | | 9,600 | | | | 255,552 | |
| ACCO Brands Corp.* | | | 24,500 | | | | 162,680 | |
| Addus HomeCare Corp.* | | | 1,500 | | | | 43,455 | |
Affymetrix, Inc.*, 1 | | | 17,000 | | | | 105,400 | |
| Albany Molecular Research, Inc.* | | | 5,800 | | | | 74,762 | |
| Alere, Inc.* | | | 10,000 | | | | 305,700 | |
Alliance One International, Inc.*, 1 | | | 26,000 | | | | 75,660 | |
| Almost Family, Inc. | | | 3,200 | | | | 62,176 | |
| Alphatec Holdings, Inc.* | | | 22,900 | | | | 45,113 | |
Amedisys, Inc.*, 1 | | | 6,900 | | | | 118,818 | |
Amsurg Corp.*, 1 | | | 6,100 | | | | 242,170 | |
Andersons, Inc.1 | | | 3,200 | | | | 223,680 | |
See accompanying Notes to Financial Statements.
Vericimetry U.S. Small Cap Value Fund
SCHEDULE OF INVESTMENTS (Continued)
As of September 30, 2013
| | | | | | | |
| COMMON STOCKS (Continued) | | | | | | |
| CONSUMER, NON-CYCLICAL (Continued) | | | | |
| AngioDynamics, Inc.* | | | 7,900 | | | $ | 104,280 | |
| Anika Therapeutics, Inc.* | | | 2,500 | | | | 59,900 | |
Apollo Group, Inc. - Class A*, 1 | | | 20,300 | | | | 422,443 | |
| ARC Document Solutions, Inc.* | | | 9,600 | | | | 44,064 | |
BioTelemetry, Inc.*, 1 | | | 6,700 | | | | 66,397 | |
Boulder Brands, Inc.*, 1 | | | 10,500 | | | | 168,420 | |
Bridgepoint Education, Inc.*, 1 | | | 12,800 | | | | 230,912 | |
| Career Education Corp.* | | | 17,000 | | | | 46,920 | |
CBIZ, Inc.*, 1 | | | 12,200 | | | | 90,768 | |
| CDI Corp. | | | 3,757 | | | | 57,520 | |
Central Garden and Pet Co.*, 1 | | | 6,162 | | | | 43,381 | |
| Central Garden and Pet Co. - Class A* | | | 11,800 | | | | 80,830 | |
| Chindex International, Inc.* | | | 1,280 | | | | 21,824 | |
| Chiquita Brands International, Inc.* | | | 11,200 | | | | 141,792 | |
| CONMED Corp. | | | 6,700 | | | | 227,733 | |
| Consolidated Graphics, Inc.* | | | 1,700 | | | | 95,302 | |
Convergys Corp.1 | | | 19,100 | | | | 358,125 | |
Corinthian Colleges, Inc.*, 1 | | | 18,900 | | | | 41,391 | |
| Costa, Inc.* | | | 1,500 | | | | 28,530 | |
| CRA International, Inc.* | | | 2,800 | | | | 52,136 | |
| Craft Brew Alliance, Inc.* | | | 3,400 | | | | 45,696 | |
| Cross Country Healthcare, Inc.* | | | 10,700 | | | | 64,842 | |
| CryoLife, Inc. | | | 8,000 | | | | 56,000 | |
| CSS Industries, Inc. | | | 2,300 | | | | 55,223 | |
| Cumberland Pharmaceuticals, Inc.* | | | 5,000 | | | | 22,650 | |
DeVry, Inc.1 | | | 11,700 | | | | 357,552 | |
Diamond Foods, Inc.*, 1 | | | 4,800 | | | | 113,184 | |
Digirad Corp.*, 1 | | | 10,000 | | | | 25,200 | |
Dole Food Co., Inc.*, 1 | | | 12,200 | | | | 166,164 | |
| Edgewater Technology, Inc.* | | | 5,000 | | | | 26,350 | |
| Electro Rent Corp. | | | 2,500 | | | | 45,350 | |
| Ennis, Inc. | | | 5,200 | | | | 93,808 | |
| Essex Rental Corp.* | | | 5,200 | | | | 17,888 | |
| Exactech, Inc.* | | | 3,100 | | | | 62,465 | |
| Five Star Quality Care, Inc.* | | | 15,200 | | | | 78,584 | |
| Fresh Del Monte Produce, Inc. | | | 12,000 | | | | 356,160 | |
FTI Consulting, Inc.*, 1 | | | 8,900 | | | | 336,420 | |
| Great Lakes Dredge & Dock Corp. | | | 11,400 | | | | 84,588 | |
| Greatbatch, Inc.* | | | 5,600 | | | | 190,568 | |
| Green Dot Corp. - Class A* | | | 5,400 | | | | 142,182 | |
| Hackett Group, Inc. | | | 5,000 | | | | 35,650 | |
| Harvard Bioscience, Inc.* | | | 5,400 | | | | 28,404 | |
| Health Net, Inc.* | | | 1,500 | | | | 47,550 | |
Healthways, Inc.*, 1 | | | 4,400 | | | | 81,444 | |
| Heidrick & Struggles International, Inc. | | | 4,000 | | | | 76,240 | |
| Helen of Troy Ltd.* | | | 6,400 | | | | 282,880 | |
| Heska Corp. | | | 600 | | | | 3,594 | |
| | | | | | | |
| COMMON STOCKS (Continued) | | | | | | |
| CONSUMER, NON-CYCLICAL (Continued) | | | | |
| Hill International, Inc.* | | | 10,100 | | | $ | 33,330 | |
| Hudson Global, Inc.* | | | 10,964 | | | | 35,523 | |
| ICF International, Inc.* | | | 4,898 | | | | 173,438 | |
| Impax Laboratories, Inc.* | | | 13,800 | | | | 283,038 | |
| Information Services Group, Inc.* | | | 14,500 | | | | 60,030 | |
| Ingles Markets, Inc. - Class A | | | 4,000 | | | | 114,920 | |
| Intersections, Inc. | | | 5,490 | | | | 48,147 | |
| Invacare Corp. | | | 7,400 | | | | 127,798 | |
| John B Sanfilippo & Son, Inc. | | | 3,168 | | | | 73,466 | |
| Kelly Services, Inc. - Class A | | | 6,787 | | | | 132,143 | |
| Kindred Healthcare, Inc. | | | 11,800 | | | | 158,474 | |
| Korn/Ferry International* | | | 9,500 | | | | 203,300 | |
| LHC Group, Inc.* | | | 5,100 | | | | 119,646 | |
| LifePoint Hospitals, Inc.* | | | 8,700 | | | | 405,681 | |
| Lincoln Educational Services Corp. | | | 4,400 | | | | 20,284 | |
| Mac-Gray Corp. | | | 2,890 | | | | 42,078 | |
| Magellan Health Services, Inc.* | | | 5,893 | | | | 353,344 | |
Matthews International Corp. - Class A1 | | | 2,600 | | | | 99,008 | |
| Medical Action Industries, Inc.* | | | 8,900 | | | | 59,096 | |
| Merit Medical Systems, Inc.* | | | 11,500 | | | | 139,495 | |
| MGP Ingredients, Inc. | | | 5,046 | | | | 26,441 | |
| Molina Healthcare, Inc.* | | | 8,500 | | | | 302,600 | |
| Monster Worldwide, Inc.* | | | 24,900 | | | | 110,058 | |
Multi-Color Corp.1 | | | 2,000 | | | | 67,860 | |
| Nash Finch Co. | | | 1,900 | | | | 50,179 | |
| National American University Holdings, Inc. | | | 10,000 | | | | 34,300 | |
| National Healthcare Corp. | | | 2,806 | | | | 132,640 | |
| Natural Alternatives International, Inc.* | | | 389 | | | | 2,237 | |
| Natus Medical, Inc.* | | | 7,900 | | | | 112,022 | |
| Navigant Consulting, Inc.* | | | 12,700 | | | | 196,342 | |
| Newtek Business Services, Inc.* | | | 13,713 | | | | 40,591 | |
| Nutraceutical International Corp. | | | 2,410 | | | | 57,213 | |
| NuVasive, Inc.* | | | 5,500 | | | | 134,695 | |
| Omega Protein Corp.* | | | 5,500 | | | | 55,935 | |
| PDI, Inc.* | | | 1,264 | | | | 6,092 | |
Pendrell Corp.*, 1 | | | 28,700 | | | | 55,678 | |
| Perceptron, Inc. | | | 2,700 | | | | 28,836 | |
Pernix Therapeutics Holdings*, 1 | | | 7,617 | | | | 20,794 | |
| PharMerica Corp.* | | | 7,300 | | | | 96,871 | |
PHH Corp.*, 1 | | | 11,400 | | | | 270,636 | |
| PhotoMedex, Inc.* | | | 2,700 | | | | 42,930 | |
| Post Holdings, Inc.* | | | 7,200 | | | | 290,664 | |
Primo Water Corp.*, 1 | | | 5,421 | | | | 12,902 | |
QC Holdings, Inc.1 | | | 3,900 | | | | 9,204 | |
Quad/Graphics, Inc.1 | | | 4,900 | | | | 148,764 | |
| RCM Technologies, Inc. | | | 4,100 | | | | 24,723 | |
Rent-A-Center, Inc.1 | | | 10,700 | | | | 407,670 | |
See accompanying Notes to Financial Statements.
Vericimetry U.S. Small Cap Value Fund
SCHEDULE OF INVESTMENTS (Continued)
As of September 30, 2013
| | | | | | | |
| COMMON STOCKS (Continued) | | | | | | |
| CONSUMER, NON-CYCLICAL (Continued) | | | | |
| Resources Connection, Inc. | | | 7,900 | | | $ | 107,203 | |
| RPX Corp.* | | | 6,000 | | | | 105,180 | |
| RTI Surgical, Inc.* | | | 13,300 | | | | 49,742 | |
| Select Medical Holdings Corp. | | | 31,749 | | | | 256,214 | |
Seneca Foods Corp. - Class A*, 1 | | | 3,400 | | | | 102,306 | |
Skilled Healthcare Group, Inc. - Class A*, 1 | | | 4,400 | | | | 19,184 | |
| Solta Medical, Inc.* | | | 22,700 | | | | 47,216 | |
| Spartan Stores, Inc. | | | 6,300 | | | | 138,978 | |
Spectrum Pharmaceuticals, Inc.1 | | | 8,000 | | | | 67,120 | |
StarTek, Inc.*, 1 | | | 5,710 | | | | 36,772 | |
| Stewart Enterprises, Inc. - Class A | | | 9,500 | | | | 124,830 | |
| Summer Infant, Inc.* | | | 8,726 | | | | 24,171 | |
Swisher Hygiene, Inc.*, 1 | | | 35,000 | | | | 21,228 | |
| Symmetry Medical, Inc.* | | | 8,800 | | | | 71,808 | |
| Synergetics USA, Inc.* | | | 6,691 | | | | 30,444 | |
| Theragenics Corp.* | | | 7,200 | | | | 15,696 | |
| TMS International Corp. - Class A | | | 2,800 | | | | 48,832 | |
| Triple-S Management Corp. - Class B* | | | 5,927 | | | | 108,998 | |
Universal American Corp.1 | | | 18,900 | | | | 144,018 | |
Universal Corp.1 | | | 4,400 | | | | 224,092 | |
| Universal Technical Institute, Inc. | | | 1,650 | | | | 20,015 | |
| VCA Antech, Inc.* | | | 8,556 | | | | 234,948 | |
| Viad Corp. | | | 3,500 | | | | 87,325 | |
| Village Super Market, Inc. - Class A | | | 1,800 | | | | 68,436 | |
| Weis Markets, Inc. | | | 5,993 | | | | 293,297 | |
| | | | | | | | 15,230,941 | |
| DIVERSIFIED – 0.4% | | | | | | | | |
| Harbinger Group, Inc.* | | | 32,600 | | | | 338,062 | |
| Resource America, Inc. - Class A | | | 3,400 | | | | 27,302 | |
| | | | | | | | 365,364 | |
| ENERGY – 6.8% | | | | | | | | |
| Adams Resources & Energy, Inc. | | | 1,000 | | | | 55,510 | |
Alon USA Energy, Inc.1 | | | 16,400 | | | | 167,444 | |
Alpha Natural Resources, Inc.*, 1 | | | 20,500 | | | | 122,180 | |
| Apco Oil and Gas International, Inc.* | | | 1,700 | | | | 24,242 | |
Arch Coal, Inc.1 | | | 24,600 | | | | 101,106 | |
| Basic Energy Services, Inc.* | | | 10,766 | | | | 136,082 | |
Bill Barrett Corp.*, 1 | | | 11,100 | | | | 278,721 | |
BioFuel Energy Corp.*, 1 | | | 1,000 | | | | 3,650 | |
C&J Energy Services, Inc.*, 1 | | | 12,600 | | | | 253,008 | |
Cal Dive International, Inc.*, 1 | | | 26,000 | | | | 53,300 | |
| Callon Petroleum Co.* | | | 13,500 | | | | 73,845 | |
Carrizo Oil & Gas, Inc.*, 1 | | | 6,000 | | | | 223,860 | |
Clayton Williams Energy, Inc.*, 1 | | | 2,700 | | | | 141,669 | |
| Cloud Peak Energy, Inc.* | | | 5,900 | | | | 86,553 | |
Comstock Resources, Inc.1 | | | 11,900 | | | | 189,329 | |
| Crimson Exploration, Inc.* | | | 7,400 | | | | 22,274 | |
| | | | | | | |
| COMMON STOCKS (Continued) | | | | | | |
| ENERGY (Continued) | | | | | | |
| Dawson Geophysical Co.* | | | 1,800 | | | $ | 58,446 | |
| Delek U.S. Holdings, Inc. | | | 12,700 | | | | 267,843 | |
| Double Eagle Petroleum Co.* | | | 990 | | | | 2,970 | |
Endeavour International Corp.*, 1 | | | 15,000 | | | | 80,250 | |
| EPL Oil & Gas, Inc.* | | | 3,000 | | | | 111,330 | |
| Exterran Holdings, Inc.* | | | 13,400 | | | | 369,438 | |
| Forbes Energy Services Ltd.* | | | 6,808 | | | | 31,725 | |
| FutureFuel Corp. | | | 6,600 | | | | 118,536 | |
| Global Geophysical Services, Inc.* | | | 15,000 | | | | 40,650 | |
| Green Plains Renewable Energy, Inc. | | | 6,400 | | | | 102,720 | |
| Gulf Island Fabrication, Inc. | | | 3,600 | | | | 88,236 | |
| Hallador Energy Co. | | | 8,656 | | | | 63,189 | |
Harvest Natural Resources, Inc.*, 1 | | | 6,700 | | | | 35,845 | |
Hercules Offshore, Inc.*, 1 | | | 38,200 | | | | 281,534 | |
| ION Geophysical Corp.* | | | 38,000 | | | | 197,600 | |
James River Coal Co.*, 1 | | | 6,000 | | | | 11,880 | |
| Key Energy Services, Inc.* | | | 36,500 | | | | 266,085 | |
| Magellan Petroleum Corp.* | | | 15,000 | | | | 15,450 | |
| Matrix Service Co.* | | | 7,800 | | | | 153,036 | |
Midstates Petroleum Co., Inc.*, 1 | | | 17,300 | | | | 88,749 | |
| Mitcham Industries, Inc.* | | | 3,100 | | | | 47,399 | |
| Natural Gas Services Group, Inc.* | | | 3,441 | | | | 92,288 | |
Newpark Resources, Inc.*, 1 | | | 20,100 | | | | 254,466 | |
Northern Oil and Gas, Inc.*, 1 | | | 14,600 | | | | 210,678 | |
| Parker Drilling Co.* | | | 30,000 | | | | 171,000 | |
Penn Virginia Corp.*, 1 | | | 19,600 | | | | 130,340 | |
| Pioneer Energy Services Corp.* | | | 13,400 | | | | 100,634 | |
| Renewable Energy Group, Inc.* | | | 7,000 | | | | 106,050 | |
Resolute Energy Corp.*, 1 | | | 5,300 | | | | 44,308 | |
| REX American Resources Corp.* | | | 2,818 | | | | 86,625 | |
| Rex Energy Corp.* | | | 4,800 | | | | 107,040 | |
Saratoga Resources, Inc.*, 1 | | | 13,725 | | | | 32,666 | |
SEACOR Holdings, Inc.1 | | | 2,300 | | | | 208,012 | |
Stone Energy Corp.*, 1 | | | 11,600 | | | | 376,188 | |
Swift Energy Co.*, 1 | | | 10,400 | | | | 118,768 | |
| TETRA Technologies, Inc.* | | | 17,900 | | | | 224,287 | |
U.S. Energy Corp. Wyoming*, 1 | | | 7,000 | | | | 14,770 | |
Vantage Drilling Co.*, 1 | | | 60,760 | | | | 105,115 | |
W&T Offshore, Inc.1 | | | 3,300 | | | | 58,476 | |
Walter Energy, Inc.1 | | | 12,300 | | | | 172,569 | |
Warren Resources, Inc.*, 1 | | | 13,400 | | | | 39,262 | |
| Willbros Group, Inc.* | | | 8,500 | | | | 78,030 | |
| | | | | | | | 7,097,256 | |
| FINANCIAL – 28.2% | | | | | | | | |
1st Century Bancshares, Inc.*, 1 | | | 1,200 | | | | 9,252 | |
| 1st Constitution Bancorp* | | | 100 | | | | 1,049 | |
| 1st Source Corp. | | | 5,200 | | | | 139,984 | |
See accompanying Notes to Financial Statements.
Vericimetry U.S. Small Cap Value Fund
SCHEDULE OF INVESTMENTS (Continued)
As of September 30, 2013
| | | | | | | |
| COMMON STOCKS (Continued) | | | | | | |
| FINANCIAL (Continued) | | | | | | |
| Access National Corp. | | | 771 | | | $ | 10,994 | |
ACNB Corp.1 | | | 1,200 | | | | 20,352 | |
American Equity Investment Life Holding Co.1 | | | 13,100 | | | | 277,982 | |
| American Independence Corp.* | | | 676 | | | | 6,726 | |
| American National Bankshares, Inc. | | | 980 | | | | 22,736 | |
| American National Insurance Co. | | | 3,100 | | | | 303,924 | |
| American Realty Investors, Inc.* | | | 5,028 | | | | 23,028 | |
| American River Bankshares* | | | 1,300 | | | | 11,245 | |
| Ameris Bancorp* | | | 2,000 | | | | 36,760 | |
| AMERISAFE, Inc. | | | 3,688 | | | | 130,961 | |
| AmeriServ Financial, Inc. | | | 6,200 | | | | 19,530 | |
Ames National Corp.1 | | | 500 | | | | 11,385 | |
Amtrust Financial Services, Inc.1 | | | 2,176 | | | | 84,995 | |
| Argo Group International Holdings Ltd. | | | 5,200 | | | | 222,976 | |
Arrow Financial Corp.1 | | | 1,428 | | | | 36,428 | |
| Asta Funding, Inc. | | | 5,000 | | | | 44,450 | |
Astoria Financial Corp.1 | | | 14,800 | | | | 184,112 | |
Atlantic American Corp.1 | | | 3,400 | | | | 13,702 | |
| AV Homes, Inc.* | | | 600 | | | | 10,476 | |
| Baldwin & Lyons, Inc. - Class B | | | 3,500 | | | | 85,330 | |
| Banc of California, Inc. | | | 2,602 | | | | 35,986 | |
| Bancfirst Corp. | | | 1,192 | | | | 64,451 | |
| Bancorp of New Jersey, Inc. | | | 1,100 | | | | 15,675 | |
| Bancorp, Inc.* | | | 6,500 | | | | 115,180 | |
| BancorpSouth, Inc. | | | 17,600 | | | | 350,944 | |
Bank of Commerce Holdings1 | | | 4,000 | | | | 22,960 | |
| Bank of Kentucky Financial Corp. | | | 380 | | | | 10,378 | |
| Bank of Marin Bancorp | | | 250 | | | | 10,388 | |
| Banner Corp. | | | 4,164 | | | | 158,898 | |
Bar Harbor Bankshares1 | | | 200 | | | | 7,358 | |
| BBCN Bancorp, Inc. | | | 16,900 | | | | 232,544 | |
| BCB Bancorp, Inc. | | | 1,100 | | | | 11,792 | |
| Berkshire Bancorp, Inc. | | | 1,100 | | | | 8,822 | |
Berkshire Hills Bancorp, Inc.1 | | | 5,216 | | | | 130,974 | |
| BGC Partners, Inc. - Class A | | | 15,400 | | | | 87,010 | |
BNC Bancorp1 | | | 2,700 | | | | 36,018 | |
Boston Private Financial Holdings, Inc.1 | | | 17,300 | | | | 192,030 | |
| Bridge Bancorp, Inc. | | | 1,000 | | | | 21,500 | |
| Bridge Capital Holdings* | | | 1,535 | | | | 26,064 | |
Brookline Bancorp, Inc.1 | | | 14,400 | | | | 135,504 | |
| Bryn Mawr Bank Corp. | | | 1,077 | | | | 29,047 | |
C&F Financial Corp.1 | | | 500 | | | | 24,200 | |
Calamos Asset Management, Inc. - Class A1 | | | 6,000 | | | | 59,940 | |
| California First National Bancorp | | | 1,600 | | | | 27,312 | |
| Camco Financial Corp.* | | | 2,900 | | | | 11,687 | |
| Camden National Corp. | | | 681 | | | | 27,853 | |
| | | | | | | |
| COMMON STOCKS (Continued) | | | | | | |
| FINANCIAL (Continued) | | | | | | |
Cape Bancorp, Inc.1 | | | 2,500 | | | $ | 22,900 | |
| Capital Bank Financial Corp. - Class A* | | | 6,722 | | | | 147,548 | |
Capital City Bank Group, Inc.*, 1 | | | 2,900 | | | | 34,162 | |
| Cardinal Financial Corp. | | | 8,000 | | | | 132,240 | |
| Cascade Bancorp* | | | 100 | | | | 583 | |
Cathay General Bancorp1 | | | 14,300 | | | | 334,191 | |
| Center Bancorp, Inc. | | | 3,000 | | | | 42,720 | |
| Centerstate Banks, Inc. | | | 3,800 | | | | 36,784 | |
Central Pacific Financial Corp.1 | | | 10,400 | | | | 184,080 | |
| Central Valley Community Bancorp | | | 1,060 | | | | 10,759 | |
| Century Bancorp, Inc. - Class A | | | 415 | | | | 13,832 | |
CFS Bancorp, Inc.1 | | | 1,000 | | | | 11,080 | |
| Chemical Financial Corp. | | | 5,800 | | | | 161,936 | |
| Chemung Financial Corp. | | | 134 | | | | 4,640 | |
Cheviot Financial Corp.1 | | | 3,900 | | | | 42,393 | |
| Citizens & Northern Corp. | | | 1,200 | | | | 23,928 | |
Citizens, Inc.*, 1 | | | 11,870 | | | | 102,557 | |
| City Holding Co. | | | 1,300 | | | | 56,212 | |
| CNB Financial Corp. | | | 930 | | | | 15,856 | |
CoBiz Financial, Inc.1 | | | 12,000 | | | | 115,920 | |
| Codorus Valley Bancorp, Inc. | | | 510 | | | | 9,328 | |
| Colony Bankcorp, Inc.* | | | 1,500 | | | | 8,775 | |
| Columbia Banking System, Inc. | | | 6,569 | | | | 162,254 | |
| Commercial National Financial Corp. | | | 190 | | | | 4,009 | |
| Community Bank Shares of Indiana, Inc. | | | 571 | | | | 10,455 | |
Community Bank System, Inc.1 | | | 4,700 | | | | 160,364 | |
Community Bankers Trust Corp.*, 1 | | | 2,100 | | | | 7,728 | |
Community Trust Bancorp, Inc.1 | | | 1,800 | | | | 73,062 | |
Consumer Portfolio Services, Inc.*, 1 | | | 3,600 | | | | 21,348 | |
| Cowen Group, Inc. - Class A* | | | 33,000 | | | | 113,850 | |
Crawford & Co. - Class A1 | | | 2,800 | | | | 20,552 | |
Customers Bancorp, Inc.*, 1 | | | 4,400 | | | | 70,840 | |
| CVB Financial Corp. | | | 12,600 | | | | 170,352 | |
DFC Global Corp.*, 1 | | | 5,000 | | | | 54,950 | |
| Dime Community Bancshares, Inc. | | | 9,500 | | | | 158,175 | |
| Donegal Group, Inc. - Class A | | | 5,331 | | | | 74,581 | |
| Doral Financial Corp.* | | | 2,300 | | | | 43,884 | |
| Eagle Bancorp, Inc.* | | | 2,337 | | | | 66,114 | |
| Eastern Insurance Holdings, Inc. | | | 1,500 | | | | 36,615 | |
| Eastern Virginia Bankshares, Inc.* | | | 6,900 | | | | 42,090 | |
| EMC Insurance Group, Inc. | | | 2,716 | | | | 81,969 | |
| Employers Holdings, Inc. | | | 7,400 | | | | 220,076 | |
Encore Capital Group, Inc.*, 1 | | | 3,900 | | | | 178,854 | |
| Endurance Specialty Holdings Ltd. | | | 8,100 | | | | 435,132 | |
| Enstar Group Ltd.* | | | 1,600 | | | | 218,560 | |
| Enterprise Bancorp, Inc. | | | 1,000 | | | | 18,910 | |
| Enterprise Financial Services Corp. | | | 1,400 | | | | 23,492 | |
See accompanying Notes to Financial Statements.
Vericimetry U.S. Small Cap Value Fund
SCHEDULE OF INVESTMENTS (Continued)
As of September 30, 2013
| | | | | | | |
| COMMON STOCKS (Continued) | | | | | | |
| FINANCIAL (Continued) | | | | | | |
| ESB Financial Corp. | | | 1,308 | | | $ | 16,677 | |
Evans Bancorp, Inc.1 | | | 200 | | | | 3,925 | |
| EverBank Financial Corp. | | | 21,480 | | | | 321,770 | |
| Farmers Capital Bank Corp.* | | | 1,800 | | | | 39,348 | |
Farmers National Banc Corp.1 | | | 3,500 | | | | 22,085 | |
| FBL Financial Group, Inc. - Class A | | | 4,534 | | | | 203,577 | |
| FBR & Co.* | | | 3,200 | | | | 85,792 | |
| Federal Agricultural Mortgage Corp. - Class C | | | 2,648 | | | | 88,390 | |
| Federated National Holding Co. | | | 2,050 | | | | 19,516 | |
Fidelity Southern Corp.1 | | | 1,811 | | | | 27,781 | |
| Financial Institutions, Inc. | | | 2,430 | | | | 49,718 | |
| First Acceptance Corp.* | | | 6,879 | | | | 12,038 | |
| First Bancorp, Inc. | | | 870 | | | | 14,599 | |
| First BanCorp/Puerto Rico* | | | 22,200 | | | | 126,096 | |
| First Bancorp/Troy NC | | | 2,400 | | | | 34,680 | |
| First Bancshares, Inc. | | | 236 | | | | 3,304 | |
| First Busey Corp. | | | 20,896 | | | | 108,868 | |
| First Business Financial Services, Inc. | | | 606 | | | | 19,780 | |
| First Citizens Banc Corp. | | | 2,340 | | | | 15,912 | |
| First Citizens BancShares, Inc. - Class A | | | 1,300 | | | | 267,280 | |
| First Clover Leaf Financial Corp. | | | 2,500 | | | | 21,575 | |
| First Commonwealth Financial Corp. | | | 18,320 | | | | 139,049 | |
| First Community Bancshares, Inc. | | | 5,202 | | | | 85,053 | |
| First Community Corp. | | | 400 | | | | 4,172 | |
| First Defiance Financial Corp. | | | 1,700 | | | | 39,763 | |
| First Financial Bancorp | | | 14,000 | | | | 212,380 | |
| First Financial Corp. | | | 1,100 | | | | 34,727 | |
First Financial Holdings, Inc.1 | | | 3,755 | | | | 207,126 | |
| First Financial Northwest, Inc. | | | 5,000 | | | | 52,150 | |
First Internet Bancorp1 | | | 1,478 | | | | 39,536 | |
| First Interstate Bancsystem, Inc. | | | 1,500 | | | | 36,225 | |
First Merchants Corp.1 | | | 3,699 | | | | 64,104 | |
First of Long Island Corp.1 | | | 900 | | | | 34,965 | |
First South Bancorp, Inc./Washington NC*, 1 | | | 500 | | | | 3,140 | |
| First United Corp.* | | | 2,495 | | | | 20,484 | |
| Firstbank Corp./Alma MI | | | 730 | | | | 14,213 | |
| Flagstar Bancorp, Inc.* | | | 11,700 | | | | 172,692 | |
Flushing Financial Corp.1 | | | 7,100 | | | | 130,995 | |
FNB Corp.1 | | | 26,800 | | | | 325,084 | |
| Fortegra Financial Corp.* | | | 1,969 | | | | 16,756 | |
| Franklin Financial Corp. | | | 600 | | | | 11,376 | |
| FS Bancorp, Inc. | | | 100 | | | | 1,700 | |
Gain Capital Holdings, Inc.1 | | | 10,000 | | | | 125,900 | |
| German American Bancorp, Inc. | | | 710 | | | | 17,906 | |
| GFI Group, Inc. | | | 21,100 | | | | 83,345 | |
| | | | | | | |
| COMMON STOCKS (Continued) | | | | | | |
| FINANCIAL (Continued) | | | | | | |
| Gleacher & Co., Inc.* | | | 2,352 | | | $ | 32,340 | |
| Great Southern Bancorp, Inc. | | | 1,300 | | | | 36,699 | |
| Greenlight Capital Re Ltd. - Class A* | | | 6,700 | | | | 190,548 | |
Guaranty Bancorp1 | | | 3,000 | | | | 41,070 | |
| Hallmark Financial Services, Inc.* | | | 4,500 | | | | 39,915 | |
| Hanmi Financial Corp. | | | 7,400 | | | | 122,618 | |
| Hanover Insurance Group, Inc. | | | 7,000 | | | | 387,240 | |
Heartland Financial USA, Inc.1 | | | 1,700 | | | | 47,362 | |
| Heritage Commerce Corp. | | | 2,639 | | | | 20,188 | |
| Heritage Financial Corp. | | | 4,700 | | | | 72,944 | |
| Heritage Financial Group, Inc. | | | 1,700 | | | | 29,614 | |
| Heritage Oaks Bancorp* | | | 2,870 | | | | 18,368 | |
HF Financial Corp.1 | | | 650 | | | | 8,346 | |
| Hilltop Holdings, Inc.* | | | 14,600 | | | | 270,100 | |
Hingham Institution for Savings1 | | | 371 | | | | 25,937 | |
Home Bancorp, Inc.*, 1 | | | 1,220 | | | | 22,033 | |
| HomeStreet, Inc. | | | 4,300 | | | | 82,990 | |
| HopFed Bancorp, Inc. | | | 2,574 | | | | 28,803 | |
| Horace Mann Educators Corp. | | | 6,900 | | | | 195,822 | |
| Horizon Bancorp | | | 1,500 | | | | 35,025 | |
| Hudson Valley Holding Corp. | | | 1,288 | | | | 24,189 | |
| Iberiabank Corp. | | | 2,900 | | | | 150,423 | |
IF Bancorp, Inc.1 | | | 200 | | | | 3,220 | |
| Imperial Holdings, Inc.* | | | 1,322 | | | | 8,368 | |
Independence Holding Co.1 | | | 4,150 | | | | 59,262 | |
| Independent Bank Corp.* | | | 4,389 | | | | 43,890 | |
Independent Bank Corp./Rockland MA1 | | | 2,700 | | | | 96,390 | |
| Infinity Property & Casualty Corp. | | | 2,800 | | | | 180,880 | |
| Interactive Brokers Group, Inc. - Class A | | | 10,000 | | | | 187,700 | |
| International Bancshares Corp. | | | 13,500 | | | | 292,005 | |
Intervest Bancshares Corp.*, 1 | | | 7,000 | | | | 55,510 | |
| INTL. FCStone, Inc.* | | | 2,395 | | | | 48,978 | |
| Investment Technology Group, Inc.* | | | 5,057 | | | | 79,496 | |
Investors Bancorp, Inc.1 | | | 7,000 | | | | 153,160 | |
| Investors Title Co. | | | 200 | | | | 15,020 | |
Janus Capital Group, Inc.1 | | | 42,800 | | | | 364,228 | |
| JMP Group, Inc. | | | 2,700 | | | | 16,713 | |
| Kansas City Life Insurance Co. | | | 2,530 | | | | 111,877 | |
| Kemper Corp. | | | 10,300 | | | | 346,080 | |
Lakeland Bancorp, Inc.1 | | | 9,100 | | | | 102,375 | |
| Lakeland Financial Corp. | | | 1,400 | | | | 45,710 | |
| Laporte Bancorp, Inc. | | | 815 | | | | 8,525 | |
LCNB Corp.1 | | | 800 | | | | 15,672 | |
| LNB Bancorp, Inc. | | | 1,600 | | | | 14,960 | |
Macatawa Bank Corp.*, 1 | | | 4,200 | | | | 22,596 | |
| Maiden Holdings Ltd. | | | 12,300 | | | | 145,263 | |
| MainSource Financial Group, Inc. | | | 2,250 | | | | 34,177 | |
See accompanying Notes to Financial Statements.
Vericimetry U.S. Small Cap Value Fund
SCHEDULE OF INVESTMENTS (Continued)
As of September 30, 2013
| | | | | | | |
| COMMON STOCKS (Continued) | | | | | | |
| FINANCIAL (Continued) | | | | | | |
| Manning & Napier, Inc. | | | 3,800 | | | $ | 63,384 | |
| Marlin Business Services Corp. | | | 3,500 | | | | 87,360 | |
| MB Financial, Inc. | | | 11,000 | | | | 310,640 | |
| MBIA, Inc.* | | | 30,400 | | | | 310,992 | |
| MBT Financial Corp.* | | | 7,000 | | | | 26,810 | |
Meadowbrook Insurance Group, Inc.1 | | | 15,300 | | | | 99,450 | |
Mercantile Bank Corp.1 | | | 900 | | | | 19,602 | |
| Merchants Bancshares, Inc. | | | 310 | | | | 8,975 | |
| Meta Financial Group, Inc. | | | 1,600 | | | | 60,800 | |
| Metro Bancorp, Inc.* | | | 1,460 | | | | 30,675 | |
| MetroCorp Bancshares, Inc. | | | 3,305 | | | | 45,477 | |
MGIC Investment Corp.*, 1 | | | 33,400 | | | | 243,152 | |
| MicroFinancial, Inc. | | | 2,411 | | | | 18,999 | |
| Middleburg Financial Corp. | | | 1,700 | | | | 32,776 | |
| MidSouth Bancorp, Inc. | | | 406 | | | | 6,293 | |
| MidWestOne Financial Group, Inc. | | | 1,000 | | | | 25,710 | |
Monarch Financial Holdings, Inc.1 | | | 1,800 | | | | 21,150 | |
Montpelier Re Holdings Ltd.1 | | | 9,409 | | | | 245,104 | |
| MutualFirst Financial, Inc. | | | 820 | | | | 12,579 | |
NASB Financial, Inc.*, 1 | | | 520 | | | | 14,264 | |
| National Bankshares, Inc. | | | 800 | | | | 28,712 | |
| National Interstate Corp. | | | 3,033 | | | | 84,348 | |
National Penn Bancshares, Inc.1 | | | 17,150 | | | | 172,357 | |
| National Western Life Insurance Co. - Class A | | | 500 | | | | 100,885 | |
| Naugatuck Valley Financial Corp. | | | 300 | | | | 2,259 | |
| Navigators Group, Inc.* | | | 3,000 | | | | 173,310 | |
| NBT Bancorp, Inc. | | | 10,600 | | | | 243,588 | |
| Nelnet, Inc. - Class A | | | 7,100 | | | | 272,995 | |
| New Hampshire Thrift Bancshares, Inc. | | | 1,286 | | | | 17,400 | |
| NewBridge Bancorp* | | | 2,100 | | | | 15,309 | |
| North Valley Bancorp* | | | 1,300 | | | | 24,570 | |
| Northeast Bancorp | | | 594 | | | | 5,993 | |
| Northrim BanCorp, Inc. | | | 800 | | | | 19,280 | |
| Northwest Bancshares, Inc. | | | 22,100 | | | | 292,162 | |
| Norwood Financial Corp. | | | 66 | | | | 1,914 | |
| Oak Valley Bancorp* | | | 400 | | | | 3,192 | |
Ocean Shore Holding Co.1 | | | 310 | | | | 4,538 | |
| OceanFirst Financial Corp. | | | 2,400 | | | | 40,584 | |
Old Line Bancshares, Inc.1 | | | 1,300 | | | | 17,316 | |
Old National Bancorp1 | | | 19,800 | | | | 281,160 | |
| Old Point Financial Corp. | | | 861 | | | | 11,107 | |
| OneBeacon Insurance Group Ltd. - Class A | | | 6,100 | | | | 90,036 | |
| Oneida Financial Corp. | | | 1,030 | | | | 13,647 | |
| Oppenheimer Holdings, Inc. - Class A | | | 3,623 | | | | 64,381 | |
| Oritani Financial Corp. | | | 4,400 | | | | 72,424 | |
Orrstown Financial Services, Inc.*, 1 | | | 533 | | | | 9,301 | |
| | | | | | | |
| COMMON STOCKS (Continued) | | | | | | |
| FINANCIAL (Continued) | | | | | | |
| Pacific Continental Corp. | | | 2,900 | | | $ | 38,019 | |
| Pacific Mercantile Bancorp* | | | 1,800 | | | | 11,178 | |
Pacific Premier Bancorp, Inc.*, 1 | | | 1,930 | | | | 25,939 | |
PacWest Bancorp1 | | | 3,700 | | | | 127,132 | |
| Palmetto Bancshares, Inc.* | | | 400 | | | | 5,216 | |
Park National Corp.1 | | | 1,800 | | | | 142,344 | |
Parke Bancorp, Inc.*, 1 | | | 2,400 | | | | 21,216 | |
| Peapack Gladstone Financial Corp. | | | 540 | | | | 10,017 | |
| Penns Woods Bancorp, Inc. | | | 400 | | | | 19,928 | |
| Peoples Bancorp of North Carolina, Inc. | | | 300 | | | | 3,705 | |
| Peoples Bancorp, Inc. | | | 790 | | | | 16,495 | |
| Phoenix Cos., Inc.* | | | 900 | | | | 34,803 | |
| PICO Holdings, Inc.* | | | 4,000 | | | | 86,640 | |
| Pinnacle Financial Partners, Inc.* | | | 3,900 | | | | 116,259 | |
Piper Jaffray Cos.*, 1 | | | 3,800 | | | | 130,302 | |
| Platinum Underwriters Holdings Ltd. | | | 5,400 | | | | 322,542 | |
| Preferred Bank/Los Angeles CA* | | | 1,500 | | | | 26,685 | |
| Premier Financial Bancorp, Inc. | | | 2,300 | | | | 26,772 | |
| Primerica, Inc. | | | 10,200 | | | | 411,468 | |
| PrivateBancorp, Inc. | | | 15,547 | | | | 332,706 | |
Provident Financial Holdings, Inc.1 | | | 3,200 | | | | 53,152 | |
| Provident Financial Services, Inc. | | | 12,000 | | | | 194,520 | |
Provident New York Bancorp1 | | | 5,300 | | | | 57,717 | |
| Pulaski Financial Corp. | | | 1,490 | | | | 15,362 | |
PVF Capital Corp.*, 1 | | | 3,100 | | | | 12,772 | |
| QCR Holdings, Inc. | | | 500 | | | | 7,945 | |
Radian Group, Inc.1 | | | 6,000 | | | | 83,580 | |
| Regional Management Corp.* | | | 407 | | | | 12,943 | |
| Renasant Corp. | | | 4,299 | | | | 116,804 | |
| Republic Bancorp, Inc. - Class A | | | 2,400 | | | | 66,120 | |
Republic First Bancorp, Inc.*, 1 | | | 3,400 | | | | 10,846 | |
Riverview Bancorp, Inc.*, 1 | | | 3,648 | | | | 9,594 | |
RLI Corp.1 | | | 2,200 | | | | 192,324 | |
| Rockville Financial, Inc. | | | 5,000 | | | | 65,000 | |
| S&T Bancorp, Inc. | | | 3,800 | | | | 92,036 | |
| Safety Insurance Group, Inc. | | | 2,800 | | | | 148,316 | |
| Sandy Spring Bancorp, Inc. | | | 3,000 | | | | 69,780 | |
Security National Financial Corp. - Class A*, 1 | | | 5,300 | | | | 32,118 | |
| Selective Insurance Group, Inc. | | | 11,100 | | | | 271,950 | |
| Severn Bancorp, Inc.* | | | 4,200 | | | | 21,504 | |
| Shore Bancshares, Inc.* | | | 3,600 | | | | 31,680 | |
| Sierra Bancorp | | | 1,700 | | | | 26,741 | |
| Simmons First National Corp. - Class A | | | 2,002 | | | | 62,242 | |
| Simplicity Bancorp, Inc. | | | 1,400 | | | | 21,770 | |
| Southern First Bancshares, Inc.* | | | 2,000 | | | | 26,760 | |
Southern National Bancorp of Virginia, Inc.1 | | | 1,800 | | | | 17,262 | |
See accompanying Notes to Financial Statements.
Vericimetry U.S. Small Cap Value Fund
SCHEDULE OF INVESTMENTS (Continued)
As of September 30, 2013
| | | | | | | |
| COMMON STOCKS (Continued) | | | | | | |
| FINANCIAL (Continued) | | | | | | |
Southside Bancshares, Inc.1 | | | 1,575 | | | $ | 42,241 | |
| Southwest Bancorp, Inc./Stillwater OK* | | | 5,000 | | | | 74,050 | |
StanCorp Financial Group, Inc.1 | | | 6,000 | | | | 330,120 | |
| State Auto Financial Corp. | | | 4,300 | | | | 90,042 | |
| State Bank Financial Corp. | | | 7,600 | | | | 120,612 | |
| StellarOne Corp. | | | 2,700 | | | | 60,750 | |
Sterling Bancorp1 | | | 2,900 | | | | 39,817 | |
| Sterling Financial Corp. | | | 12,600 | | | | 360,990 | |
| Stewart Information Services Corp. | | | 4,600 | | | | 147,154 | |
Stifel Financial Corp.*, 1 | | | 5,050 | | | | 208,161 | |
| Stratus Properties, Inc.* | | | 3,300 | | | | 43,923 | |
| Suffolk Bancorp* | | | 1,200 | | | | 21,264 | |
| Summit Financial Group, Inc.* | | | 1,501 | | | | 12,984 | |
| SWS Group, Inc.* | | | 9,200 | | | | 51,336 | |
| SY Bancorp, Inc. | | | 1,300 | | | | 36,829 | |
| Symetra Financial Corp. | | | 23,900 | | | | 425,898 | |
| Synovus Financial Corp. | | | 61,800 | | | | 203,940 | |
Taylor Capital Group, Inc.*, 1 | | | 2,400 | | | | 53,160 | |
| TCF Financial Corp. | | | 8,400 | | | | 119,952 | |
| Teche Holding Co. | | | 836 | | | | 38,188 | |
| Territorial Bancorp, Inc. | | | 1,100 | | | | 24,167 | |
| Timberland Bancorp, Inc. | | | 1,378 | | | | 12,402 | |
| Tompkins Financial Corp. | | | 3,029 | | | | 140,000 | |
| Tower Financial Corp. | | | 300 | | | | 6,969 | |
TowneBank/Portsmouth VA1 | | | 3,000 | | | | 43,260 | |
Transcontinental Realty Investors, Inc.*, 1 | | | 1,100 | | | | 9,823 | |
| Trico Bancshares | | | 1,900 | | | | 43,282 | |
TrustCo Bank Corp. NY1 | | | 12,000 | | | | 71,520 | |
Trustmark Corp.1 | | | 12,100 | | | | 309,760 | |
| Two River Bancorp | | | 1,700 | | | | 12,716 | |
Umpqua Holdings Corp.1 | | | 20,800 | | | | 337,376 | |
Union First Market Bankshares Corp.1 | | | 5,900 | | | | 137,883 | |
United Bankshares, Inc.1 | | | 5,000 | | | | 144,900 | |
United Community Banks, Inc.*, 1 | | | 5,600 | | | | 84,000 | |
| United Community Financial Corp.* | | | 5,417 | | | | 21,072 | |
| United Financial Bancorp, Inc. | | | 1,700 | | | | 27,489 | |
| United Fire Group, Inc. | | | 5,800 | | | | 176,726 | |
United Insurance Holdings Corp.1 | | | 4,506 | | | | 39,788 | |
| United Security Bancshares/Fresno CA* | | | 4,309 | | | | 18,183 | |
| United Security Bancshares/ Thomasville AL* | | | 500 | | | | 4,375 | |
| Unity Bancorp, Inc. | | | 650 | | | | 4,849 | |
| Universal Insurance Holdings, Inc. | | | 6,300 | | | | 44,415 | |
| Univest Corp. of Pennsylvania | | | 1,800 | | | | 33,930 | |
Valley National Bancorp1 | | | 36,000 | | | | 358,200 | |
ViewPoint Financial Group, Inc.1 | | | 4,700 | | | | 97,149 | |
| Virginia Commerce Bancorp, Inc.* | | | 2,500 | | | | 38,825 | |
| | | | | | | |
| COMMON STOCKS (Continued) | | | | | | |
| FINANCIAL (Continued) | | | | | | |
| Walker & Dunlop, Inc.* | | | 4,900 | | | $ | 77,959 | |
| Walter Investment Management Corp.* | | | 6,800 | | | | 268,872 | |
| Washington Banking Co. | | | 3,000 | | | | 42,180 | |
| Washington Federal, Inc. | | | 12,500 | | | | 258,500 | |
| Washington Trust Bancorp, Inc. | | | 1,600 | | | | 50,288 | |
| WashingtonFirst Bankshare, Inc.* | | | 200 | | | | 2,600 | |
| Waterstone Financial, Inc.* | | | 2,930 | | | | 29,739 | |
| Webster Financial Corp. | | | 9,400 | | | | 239,982 | |
| WesBanco, Inc. | | | 5,900 | | | | 175,407 | |
| West Bancorporation, Inc. | | | 4,020 | | | | 55,476 | |
| Western Alliance Bancorp* | | | 9,000 | | | | 170,370 | |
| Westfield Financial, Inc. | | | 6,000 | | | | 42,360 | |
| Wilshire Bancorp, Inc. | | | 12,200 | | | | 99,796 | |
| Wintrust Financial Corp. | | | 7,500 | | | | 308,025 | |
| WSFS Financial Corp. | | | 800 | | | | 48,200 | |
| Xenith Bankshares, Inc.* | | | 5,700 | | | | 34,599 | |
| Yadkin Financial Corp.* | | | 2,445 | | | | 42,127 | |
| | | | | | | | 29,301,827 | |
| INDUSTRIAL – 17.0% | | | | | | | | |
AAR Corp.1 | | | 7,955 | | | | 217,410 | |
| Advanced Energy Industries, Inc.* | | | 3,600 | | | | 63,072 | |
Aegion Corp.*, 1 | | | 7,853 | | | | 186,352 | |
Air Transport Services Group, Inc.*, 1 | | | 12,200 | | | | 91,378 | |
Alamo Group, Inc.1 | | | 2,800 | | | | 136,948 | |
| Albany International Corp. - Class A | | | 2,500 | | | | 89,675 | |
Allied Motion Technologies, Inc.1 | | | 2,606 | | | | 21,083 | |
AM Castle & Co.*, 1 | | | 7,100 | | | | 114,310 | |
| Ameresco, Inc. - Class A* | | | 6,622 | | | | 66,352 | |
| Ampco-Pittsburgh Corp. | | | 3,700 | | | | 66,304 | |
API Technologies Corp.*, 1 | | | 7,502 | | | | 21,981 | |
Arkansas Best Corp.1 | | | 5,200 | | | | 133,484 | |
| Astec Industries, Inc. | | | 4,100 | | | | 147,436 | |
| Atlas Air Worldwide Holdings, Inc.* | | | 4,700 | | | | 216,717 | |
| AVX Corp. | | | 30,600 | | | | 401,778 | |
| Ballantyne Strong, Inc.* | | | 7,865 | | | | 33,505 | |
Barnes Group, Inc.1 | | | 9,900 | | | | 345,708 | |
| Bel Fuse, Inc. - Class B | | | 2,480 | | | | 43,251 | |
| Benchmark Electronics, Inc.* | | | 11,400 | | | | 260,946 | |
Brady Corp. - Class A1 | | | 8,900 | | | | 271,450 | |
Briggs & Stratton Corp.1 | | | 10,900 | | | | 219,308 | |
Bristow Group, Inc.1 | | | 2,700 | | | | 196,452 | |
| Broadwind Energy, Inc.* | | | 5,701 | | | | 44,639 | |
| CAI International, Inc.* | | | 5,500 | | | | 127,985 | |
| Celadon Group, Inc. | | | 3,900 | | | | 72,813 | |
| Chase Corp. | | | 2,351 | | | | 69,072 | |
| Checkpoint Systems, Inc.* | | | 6,000 | | | | 100,200 | |
| CIRCOR International, Inc. | | | 1,550 | | | | 96,379 | |
See accompanying Notes to Financial Statements.
Vericimetry U.S. Small Cap Value Fund
SCHEDULE OF INVESTMENTS (Continued)
As of September 30, 2013
| | | | | | | |
| COMMON STOCKS (Continued) | | | | | | |
| INDUSTRIAL (Continued) | | | | | | |
| Coherent, Inc. | | | 2,000 | | | $ | 122,900 | |
| Columbus McKinnon Corp.* | | | 5,700 | | | | 136,971 | |
| Comfort Systems USA, Inc. | | | 3,500 | | | | 58,835 | |
| Core Molding Technologies, Inc.* | | | 3,500 | | | | 33,530 | |
| Covenant Transportation Group, Inc. - Class A* | | | 8,442 | | | | 53,522 | |
CPI Aerostructures, Inc.*, 1 | | | 2,200 | | | | 25,498 | |
| CTS Corp. | | | 5,600 | | | | 88,312 | |
Cubic Corp.1 | | | 6,100 | | | | 327,448 | |
| Curtiss-Wright Corp. | | | 8,200 | | | | 385,072 | |
| CyberOptics Corp.* | | | 2,022 | | | | 12,577 | |
| DHT Holdings, Inc. | | | 399 | | | | 1,744 | |
| Ducommun, Inc.* | | | 2,600 | | | | 74,568 | |
Dycom Industries, Inc.*, 1 | | | 5,600 | | | | 156,744 | |
| Dynamic Materials Corp. | | | 2,607 | | | | 60,430 | |
Eagle Bulk Shipping, Inc.*, 1 | | | 7,900 | | | | 56,722 | |
| Eastern Co. | | | 1,500 | | | | 24,255 | |
| Ecology and Environment, Inc. - Class A | | | 950 | | | | 11,068 | |
| Electro Scientific Industries, Inc. | | | 4,900 | | | | 57,379 | |
| EMCOR Group, Inc. | | | 2,800 | | | | 109,564 | |
Encore Wire Corp.1 | | | 4,500 | | | | 177,480 | |
| EnerNOC, Inc.* | | | 1,456 | | | | 21,825 | |
| EnerSys, Inc. | | | 4,000 | | | | 242,520 | |
| Engility Holdings, Inc.* | | | 4,806 | | | | 152,494 | |
EnPro Industries, Inc.*, 1 | | | 2,900 | | | | 174,609 | |
| Era Group, Inc.* | | | 2,300 | | | | 62,514 | |
Erickson Air-Crane, Inc.*, 1 | | | 3,465 | | | | 54,262 | |
ESCO Technologies, Inc.1 | | | 5,300 | | | | 176,119 | |
| Esterline Technologies Corp.* | | | 2,900 | | | | 231,681 | |
Fabrinet*, 1 | | | 7,600 | | | | 127,984 | |
| Flow International Corp.* | | | 12,595 | | | | 50,254 | |
FreightCar America, Inc.1 | | | 2,500 | | | | 51,700 | |
| Frequency Electronics, Inc. | | | 4,000 | | | | 46,720 | |
Frontline Ltd./Bermuda*, 1 | | | 20,900 | | | | 55,385 | |
| Fuel Tech, Inc.* | | | 3,100 | | | | 13,516 | |
| Furmanite Corp.* | | | 4,200 | | | | 41,580 | |
| GATX Corp. | | | 7,900 | | | | 375,408 | |
Genco Shipping & Trading Ltd.*, 1 | | | 6,500 | | | | 25,545 | |
| Gencor Industries, Inc.* | | | 4,000 | | | | 34,320 | |
| General Cable Corp. | | | 10,256 | | | | 325,628 | |
| General Finance Corp.* | | | 3,760 | | | | 20,154 | |
| Gibraltar Industries, Inc.* | | | 8,000 | | | | 114,080 | |
| Global Power Equipment Group, Inc. | | | 3,500 | | | | 70,385 | |
GrafTech International Ltd.*, 1 | | | 27,300 | | | | 230,685 | |
Granite Construction, Inc.1 | | | 7,200 | | | | 220,320 | |
| Greenbrier Cos., Inc.* | | | 6,500 | | | | 160,745 | |
| Griffon Corp. | | | 10,000 | | | | 125,400 | |
| | | | | | | |
| COMMON STOCKS (Continued) | | | | | | |
| INDUSTRIAL (Continued) | | | | | | |
GSE Holding, Inc.*, 1 | | | 11,400 | | | $ | 23,712 | |
| Gulfmark Offshore, Inc. - Class A | | | 3,200 | | | | 162,848 | |
Hardinge, Inc.1 | | | 4,200 | | | | 64,890 | |
| Harsco Corp. | | | 4,150 | | | | 103,335 | |
| Haynes International, Inc. | | | 3,000 | | | | 135,990 | |
Heritage-Crystal Clean, Inc.*, 1 | | | 3,200 | | | | 57,664 | |
Hudson Technologies, Inc.*, 1 | | | 11,829 | | | | 24,013 | |
Hurco Cos., Inc.1 | | | 1,600 | | | | 41,376 | |
| Identive Group, Inc.* | | | 10,000 | | | | 7,000 | |
| IEC Electronics Corp.* | | | 1,180 | | | | 4,331 | |
| II-VI, Inc.* | | | 12,900 | | | | 242,778 | |
| Insteel Industries, Inc. | | | 3,200 | | | | 51,520 | |
| Integrated Electrical Services, Inc.* | | | 2,200 | | | | 8,932 | |
International Shipholding Corp.1 | | | 1,700 | | | | 46,648 | |
| Intevac, Inc.* | | | 4,500 | | | | 26,370 | |
Iteris, Inc.*, 1 | | | 10,667 | | | | 19,521 | |
| Itron, Inc.* | | | 8,700 | | | | 372,621 | |
| Kadant, Inc. | | | 3,200 | | | | 107,488 | |
Kemet Corp.*, 1 | | | 13,000 | | | | 54,340 | |
Key Technology, Inc.*, 1 | | | 2,200 | | | | 30,558 | |
Knightsbridge Tankers Ltd.1 | | | 2,300 | | | | 23,391 | |
| Kratos Defense & Security Solutions, Inc.* | | | 13,600 | | | | 112,608 | |
| Lawson Products, Inc.* | | | 3,546 | | | | 36,559 | |
| Layne Christensen Co.* | | | 3,900 | | | | 77,844 | |
| LB Foster Co. - Class A | | | 1,900 | | | | 86,906 | |
LMI Aerospace, Inc.*, 1 | | | 3,420 | | | | 45,691 | |
| LoJack Corp.* | | | 1,200 | | | | 3,840 | |
| LS Starrett Co. - Class A | | | 2,221 | | | | 24,431 | |
LSI Industries, Inc.1 | | | 5,900 | | | | 49,796 | |
| Lydall, Inc.* | | | 3,088 | | | | 53,021 | |
| Marten Transport Ltd. | | | 6,000 | | | | 102,900 | |
Metalico, Inc.*, 1 | | | 25,000 | | | | 35,000 | |
| Methode Electronics, Inc. | | | 5,500 | | | | 154,000 | |
| Mfri, Inc.* | | | 1,420 | | | | 16,216 | |
| Moog, Inc. - Class A* | | | 4,200 | | | | 246,414 | |
Multi-Fineline Electronix, Inc.*, 1 | | | 5,900 | | | | 95,698 | |
| MYR Group, Inc.* | | | 6,100 | | | | 148,230 | |
| NACCO Industries, Inc. - Class A | | | 900 | | | | 49,878 | |
| NAPCO Security Technologies, Inc.* | | | 2,700 | | | | 14,337 | |
National Presto Industries, Inc.1 | | | 600 | | | | 42,246 | |
| National Technical Systems, Inc.* | | | 800 | | | | 18,280 | |
| NN, Inc. | | | 4,000 | | | | 62,240 | |
| Northwest Pipe Co.* | | | 2,300 | | | | 75,624 | |
Nuverra Environmental Solutions, Inc.*, 1 | | | 65,000 | | | | 148,850 | |
Olympic Steel, Inc.1 | | | 3,400 | | | | 94,452 | |
| Orbital Sciences Corp.* | | | 11,800 | | | | 249,924 | |
| Orion Energy Systems, Inc.* | | | 4,504 | | | | 16,935 | |
See accompanying Notes to Financial Statements.
Vericimetry U.S. Small Cap Value Fund
SCHEDULE OF INVESTMENTS (Continued)
As of September 30, 2013
| | | | | | | |
| COMMON STOCKS (Continued) | | | | | | |
| INDUSTRIAL (Continued) | | | | | | |
| Orion Marine Group, Inc.* | | | 8,000 | | | $ | 83,280 | |
| Pacer International, Inc.* | | | 6,020 | | | | 37,264 | |
PAM Transportation Services, Inc.1 | | | 2,839 | | | | 49,654 | |
| Perma-Fix Environmental Services* | | | 6,040 | | | | 4,349 | |
PHI, Inc. *, 2 | | | 3,000 | | | | 113,130 | |
| PHI, Inc.* | | | 100 | | | | 3,624 | |
| Pike Electric Corp. | | | 4,900 | | | | 55,468 | |
Plexus Corp.*, 1 | | | 5,800 | | | | 215,760 | |
PMFG, Inc.*, 1 | | | 6,500 | | | | 48,100 | |
| Providence and Worcester Railroad Co. | | | 100 | | | | 2,017 | |
Quanex Building Products Corp.1 | | | 7,200 | | | | 135,576 | |
Rand Logistics, Inc.*, 1 | | | 7,200 | | | | 35,136 | |
| Roadrunner Transportation Systems, Inc.* | | | 3,100 | | | | 87,544 | |
| Rofin-Sinar Technologies, Inc.* | | | 7,000 | | | | 169,470 | |
| Rogers Corp.* | | | 2,000 | | | | 118,960 | |
| RTI International Metals, Inc.* | | | 7,600 | | | | 243,504 | |
| Sanmina Corp.* | | | 17,000 | | | | 297,330 | |
Ship Finance International Ltd.1 | | | 8,800 | | | | 134,376 | |
SIFCO Industries, Inc.1 | | | 1,100 | | | | 20,240 | |
| SL Industries, Inc. | | | 1,700 | | | | 41,565 | |
| Sparton Corp.* | | | 2,600 | | | | 66,300 | |
| Sterling Construction Co., Inc.* | | | 5,200 | | | | 48,100 | |
| Stoneridge, Inc.* | | | 6,200 | | | | 67,022 | |
STR Holdings, Inc.*, 1 | | | 28,000 | | | | 62,440 | |
SunPower Corp.*, 1 | | | 6,000 | | | | 156,960 | |
| Synalloy Corp. | | | 2,103 | | | | 34,447 | |
| Sypris Solutions, Inc. | | | 7,285 | | | | 22,729 | |
| Tech Data Corp.* | | | 3,500 | | | | 174,685 | |
| Tecumseh Products Co. - Class A* | | | 5,200 | | | | 46,540 | |
| Tecumseh Products Co. - Class B* | | | 3,300 | | | | 28,677 | |
Teekay Tankers Ltd. - Class A1 | | | 19,900 | | | | 52,138 | |
| Tetra Tech, Inc.* | | | 13,900 | | | | 359,871 | |
| Transcat, Inc.* | | | 1,941 | | | | 15,217 | |
| TTM Technologies, Inc.* | | | 14,900 | | | | 145,275 | |
| Tutor Perini Corp.* | | | 11,400 | | | | 243,048 | |
| Twin Disc, Inc. | | | 1,900 | | | | 49,647 | |
| UFP Technologies, Inc.* | | | 2,600 | | | | 59,202 | |
| Ultralife Corp.* | | | 4,800 | | | | 19,200 | |
Universal Forest Products, Inc.1 | | | 4,000 | | | | 168,400 | |
| USA Truck, Inc.* | | | 5,361 | | | | 48,035 | |
UTi Worldwide, Inc.1 | | | 12,316 | | | | 186,095 | |
Viasystems Group, Inc.*, 1 | | | 3,854 | | | | 55,690 | |
Vicor Corp.*, 1 | | | 4,700 | | | | 38,446 | |
Vishay Intertechnology, Inc.*, 1 | | | 26,000 | | | | 335,140 | |
| Vishay Precision Group, Inc.* | | | 4,000 | | | | 58,200 | |
| VSE Corp. | | | 1,500 | | | | 70,425 | |
| Watts Water Technologies, Inc. - Class A | | | 3,800 | | | | 214,206 | |
| | | | | | | |
| COMMON STOCKS (Continued) | | | | | | |
| INDUSTRIAL (Continued) | | | | | | |
| Willis Lease Finance Corp.* | | | 2,869 | | | $ | 45,129 | |
XPO Logistics, Inc.*, 1 | | | 3,200 | | | | 69,344 | |
Zagg, Inc.*, 1 | | | 5,800 | | | | 26,100 | |
Zygo Corp.*, 1 | | | 4,288 | | | | 68,522 | |
| | | | | | | | 17,639,263 | |
| TECHNOLOGY – 6.8% | | | | | | | | |
| Agilysys, Inc.* | | | 1,082 | | | | 12,897 | |
Alpha & Omega Semiconductor Ltd.*, 1 | | | 8,700 | | | | 73,167 | |
| Amkor Technology, Inc.* | | | 39,600 | | | | 169,884 | |
| Amtech Systems, Inc.* | | | 4,850 | | | | 35,405 | |
| ANADIGICS, Inc.* | | | 22,500 | | | | 44,325 | |
| Astro-Med, Inc. | | | 2,600 | | | | 28,496 | |
| ATMI, Inc.* | | | 5,200 | | | | 137,904 | |
Audience, Inc.*, 1 | | | 6,800 | | | | 76,432 | |
| Avid Technology, Inc.* | | | 5,150 | | | | 30,900 | |
| Axcelis Technologies, Inc.* | | | 19,300 | | | | 40,723 | |
AXT, Inc.*, 1 | | | 19,000 | | | | 44,460 | |
| Brooks Automation, Inc. | | | 12,500 | | | | 116,375 | |
CACI International, Inc. - Class A*, 1 | | | 4,700 | | | | 324,817 | |
| Cascade Microtech, Inc.* | | | 3,230 | | | | 28,973 | |
| CIBER, Inc.* | | | 14,300 | | | | 47,190 | |
| Cohu, Inc. | | | 5,144 | | | | 56,121 | |
| Digi International, Inc.* | | | 5,200 | | | | 52,052 | |
| Digital River, Inc.* | | | 4,400 | | | | 78,628 | |
| Diodes, Inc.* | | | 5,332 | | | | 130,634 | |
| DSP Group, Inc.* | | | 4,700 | | | | 33,135 | |
Dynamics Research Corp.*, 1 | | | 3,800 | | | | 28,880 | |
Echelon Corp.*, 1 | | | 8,500 | | | | 20,315 | |
| Electronics For Imaging, Inc.* | | | 7,100 | | | | 224,928 | |
Emcore Corp.*, 1 | | | 6,400 | | | | 28,736 | |
Emulex Corp.*, 1 | | | 16,200 | | | | 125,712 | |
| Entegris, Inc.* | | | 25,100 | | | | 254,765 | |
| Entropic Communications, Inc.* | | | 23,900 | | | | 104,682 | |
| Epiq Systems, Inc. | | | 6,600 | | | | 87,252 | |
Fairchild Semiconductor International, Inc.*, 1 | | | 24,806 | | | | 344,555 | |
| FormFactor, Inc.* | | | 8,000 | | | | 54,880 | |
| Geeknet, Inc.* | | | 1,500 | | | | 25,260 | |
GSI Technology, Inc.*, 1 | | | 2,790 | | | | 19,614 | |
GT Advanced Technologies, Inc.*, 1 | | | 14,100 | | | | 119,991 | |
| Hutchinson Technology, Inc.* | | | 7,000 | | | | 24,360 | |
| Imation Corp.* | | | 13,900 | | | | 56,990 | |
| Innodata, Inc.* | | | 6,900 | | | | 17,871 | |
| Insight Enterprises, Inc.* | | | 9,100 | | | | 172,172 | |
| Integrated Silicon Solution, Inc.* | | | 7,400 | | | | 80,586 | |
International Rectifier Corp.*, 1 | | | 9,900 | | | | 245,223 | |
| IXYS Corp. | | | 4,400 | | | | 42,460 | |
See accompanying Notes to Financial Statements.
Vericimetry U.S. Small Cap Value Fund
SCHEDULE OF INVESTMENTS (Continued)
As of September 30, 2013
| | | | | | | |
| COMMON STOCKS (Continued) | | | | | | |
| TECHNOLOGY (Continued) | | | | | | |
| Key Tronic Corp.* | | | 2,300 | | | $ | 23,667 | |
KEYW Holding Corp.*, 1 | | | 6,400 | | | | 86,080 | |
Lexmark International, Inc. - Class A1 | | | 6,800 | | | | 224,400 | |
Majesco Entertainment Co.*, 1 | | | 7,500 | | | | 4,125 | |
ManTech International Corp. - Class A1 | | | 4,600 | | | | 132,296 | |
| Mercury Systems, Inc.* | | | 8,000 | | | | 79,920 | |
| NCI, Inc. - Class A* | | | 7,200 | | | | 40,536 | |
| Official Payments Holdings, Inc.* | | | 3,600 | | | | 29,952 | |
OmniVision Technologies, Inc.*, 1 | | | 14,000 | | | | 214,340 | |
| PAR Technology Corp.* | | | 6,600 | | | | 32,604 | |
| Pericom Semiconductor Corp.* | | | 4,000 | | | | 31,200 | |
Photronics, Inc.*, 1 | | | 13,000 | | | | 101,790 | |
| QLogic Corp.* | | | 18,600 | | | | 203,484 | |
| Qumu Corp. | | | 2,500 | | | | 31,025 | |
Radisys Corp.*, 1 | | | 6,300 | | | | 20,223 | |
| Richardson Electronics Ltd./United States | | | 4,000 | | | | 45,480 | |
| Rudolph Technologies, Inc.* | | | 4,500 | | | | 51,300 | |
| Sapiens International Corp. N.V. | | | 871 | | | | 5,270 | |
| Schawk, Inc. | | | 3,200 | | | | 47,488 | |
| Sigma Designs, Inc.* | | | 11,200 | | | | 62,608 | |
| Smith Micro Software, Inc.* | | | 3,500 | | | | 3,150 | |
Spansion, Inc. - Class A*, 1 | | | 12,500 | | | | 126,125 | |
| SunEdison, Inc.* | | | 12,180 | | | | 97,075 | |
| Super Micro Computer, Inc.* | | | 7,200 | | | | 97,488 | |
Sykes Enterprises, Inc.*, 1 | | | 10,800 | | | | 193,428 | |
SYNNEX Corp.*, 1 | | | 6,900 | | | | 424,005 | |
| TriQuint Semiconductor, Inc.* | | | 32,900 | | | | 267,477 | |
| Ultra Clean Holdings, Inc.* | | | 6,300 | | | | 43,533 | |
Veeco Instruments, Inc.*, 1 | | | 5,400 | | | | 201,042 | |
| VeriFone Systems, Inc.* | | | 19,700 | | | | 450,342 | |
| Volterra Semiconductor Corp.* | | | 2,800 | | | | 64,400 | |
Wayside Technology Group, Inc.1 | | | 1,200 | | | | 15,432 | |
| | | | | | | | 7,093,035 | |
| TOTAL COMMON STOCKS | | | | | | | | |
| (Cost $87,617,239) | | | | | | | 103,411,988 | |
| | | | | | | | | |
| MONEY MARKET INVESTMENTS – 22.4% | | | | | |
BlackRock Liquidity Funds TempFund Portfolio, 0.03%3, 4 | | | 15,879,879 | | | | 15,879,879 | |
Federated Treasury Obligations Fund, 0.01%3 | | | 605,039 | | | | 605,039 | |
Fidelity Institutional Money Market Portfolio - Class I, 0.04%3, 4 | | | 6,807,720 | | | | 6,807,720 | |
| | | | | | | | | |
| TOTAL MONEY MARKET INVESTMENTS | | | | | |
| (Cost $23,292,638) | | | | | | | 23,292,638 | |
| | | | | |
| TOTAL INVESTMENTS – 122.1% | | | | |
| (Cost $110,909,877) | | | $ | 126,704,626 | |
| | | | | | |
| Liabilities less other assets – (22.1)% | | | | (22,950,068 | ) |
| | | | | | |
| TOTAL NET ASSETS – 100.0% | | | $ | 103,754,558 | |
See accompanying Notes to Financial Statements.
| * | Non-income producing security. |
| 1 | All or a portion of shares are on loan. Total loaned securities had a fair value of $21,643,598 at September 30, 2013. |
| 3 | Variable rate security; the rate shown represents the rate at September 30, 2013. |
| 4 | Investments purchased with cash proceeds from securities lending. Total collateral had a fair value of $22,687,599 at September 30, 2013. |
See accompanying Notes to Financial Statements.
Vericimetry U.S. Small Cap Value Fund
SUMMARY OF INVESTMENTS
As of September 30, 2013 (Unaudited)
| Percent of Total Net Assets |
| Common Stocks | |
| Banks | 13.7% |
| Insurance | 8.3% |
| Commercial Services | 6.0% |
| Retail | 5.9% |
| Electronics | 4.5% |
| Telecommunications | 3.7% |
| Semiconductors | 3.6% |
| Oil & Gas | 3.3% |
| Savings & Loans | 3.2% |
| Diversified Financial Services | 2.9% |
| Healthcare-Services | 2.6% |
| Oil & Gas Services | 2.6% |
| Chemicals | 2.5% |
| Transportation | 2.2% |
| Apparel | 2.0% |
| Food | 2.0% |
| Aerospace/Defense | 2.0% |
| Healthcare-Products | 1.9% |
| Computers | 1.8% |
| Engineering & Construction | 1.6% |
| Internet | 1.5% |
| Mining | 1.5% |
| Software | 1.4% |
| Electrical Components & Equipment | 1.3% |
| Media | 1.2% |
| Metal Fabricate/Hardware | 1.1% |
| Miscellaneous Manufacturing | 1.1% |
| Machinery-Diversified | 1.1% |
| Auto Parts & Equipment | 1.0% |
| Entertainment | 0.9% |
| Pharmaceuticals | 0.8% |
| Airlines | 0.8% |
| Iron/Steel | 0.8% |
| Building Materials | 0.7% |
| Environmental Control | 0.7% |
| Household Products/Wares | 0.7% |
| Home Furnishings | 0.6% |
| Leisure Time | 0.6% |
| Distribution/Wholesale | 0.6% |
| Trucking & Leasing | 0.6% |
| Coal | 0.5% |
| Agriculture | 0.5% |
| Home Builders | 0.5% |
| Energy-Alternate Sources | 0.4% |
| Forest Products & Paper | 0.4% |
| Textiles | 0.4% |
| Holding Companies-Diversified | 0.4% |
| Storage/Warehousing | 0.2% |
| Percent of Total Net Assets |
| Lodging | 0.2% |
| Advertising | 0.1% |
| Machinery-Construction & Mining | 0.1% |
| Biotechnology | 0.1% |
| Toys/Games/Hobbies | 0.1% |
| Hand/Machine Tools | 0.1% |
| Real Estate | 0.1% |
| Packaging & Containers | 0.1% |
| Beverages | 0.1% |
| Housewares | 0.1% |
| Office Furnishings | |
| Total Common Stocks | 99.7% |
| Money Market Investments | |
| Total Investments | 122.1% |
| Liabilities less other assets | |
| Total Net Assets | |
See accompanying Notes to Financial Statements.
Vericimetry Funds
Vericimetry U.S. Small Cap Value Fund
STATEMENT OF ASSETS AND LIABILITIES
September 30, 2013
| ASSETS | | | |
| Investments in securities, at value (cost $110,909,877) | | $ | 126,704,626 | (1) |
| Cash | | | 12,998 | |
| Receivables: | | | | |
| Fund shares issued | | | 135,607 | |
| Dividends and interest | | | 49,583 | |
| Securities lending income | | | 5,725 | |
| Prepaid expenses and other assets | | | 27,758 | |
| Total assets | | | 126,936,297 | |
| | | | | |
| LIABILITIES | | | | |
| Collateral due to broker for securities loaned | | | 22,687,599 | |
| Payables: | | | | |
| Securities purchased | | | 408,970 | |
| Due to Trustees | | | 22,500 | |
| Accrued other expenses | | | 62,670 | |
| Total liabilities | | | 23,181,739 | |
| | | | | |
| NET ASSETS | | $ | 103,754,558 | |
| | | | | |
| COMPONENTS OF NET ASSETS | | | | |
| Paid-in-capital | | $ | 84,309,584 | |
| Distributions in excess of accumulated undistributed net investment income | | | (14,689 | ) |
| Accumulated net realized gain on investments | | | 3,664,914 | |
| Net unrealized appreciation on investments | | | 15,794,749 | |
| NET ASSETS | | $ | 103,754,558 | |
| | | | | |
| Shares outstanding no par value (unlimited shares authorized) | | | 6,968,340 | |
| | | | | |
| Net asset value, offering and redemption price per share | | $ | 14.89 | |
| (1) | Includes securities on loan of $21,643,598 (Note 2). |
See accompanying Notes to Financial Statements.
Vericimetry Funds
Vericimetry U.S. Small Cap Value Fund
STATEMENT OF OPERATIONS
For the Year Ended September 30, 2013
| INVESTMENT INCOME | | | |
| Income | | | |
| Dividends (net of foreign withholding taxes of $33) | | $ | 1,022,747 | |
| Securities lending income | | | 77,681 | |
| Interest | | | 334 | |
| Total investment income | | | 1,100,762 | |
| | | | | |
| Expenses | | | | |
| Investment advisory fees | | | 313,135 | |
| Professional fees | | | 91,079 | |
| Fund accounting and administration fees and expenses | | | 85,509 | |
| Transfer agent fees | | | 53,837 | |
| Trustees' fees and expenses | | | 45,000 | |
| Registration fees | | | 39,621 | |
| Insurance fees | | | 34,792 | |
| Offering costs | | | 25,096 | |
| Custody fees | | | 23,324 | |
| Shareholder reporting fees | | | 15,682 | |
| Miscellaneous expenses | | | 3,169 | |
| | | | | |
| Total expenses | | | 730,244 | |
| Expenses reimbursed | | | (354,482 | ) |
| Net expenses | | | 375,762 | |
| Net investment income | | | 725,000 | |
| | | | | |
| Net Realized and Unrealized Gain from Investments | | | | |
| Net realized gain on investments | | | 3,909,430 | |
| Net change in unrealized appreciation on investments | | | 14,387,482 | |
| Net realized and unrealized gain on investments | | | 18,296,912 | |
| | | | | |
| Net Increase in Net Assets from Operations | | $ | 19,021,912 | |
See accompanying Notes to Financial Statements.
Vericimetry Funds
Vericimetry U.S. Small Cap Value Fund
STATEMENTS OF CHANGES IN NET ASSETS
| | | For the Year Ended September 30, 2013 | | | For the Period from December 27, 2011* to September 30, 2012 | |
| INCREASE (DECREASE) IN NET ASSETS FROM | | | | | | |
| Operations | | | | | | |
| Net investment income | | $ | 725,000 | | | $ | 150,875 | |
| Net realized gain on investments | | | 3,909,430 | | | | 297,778 | |
| Net change in unrealized appreciation on investments | | | 14,387,482 | | | | 1,407,267 | |
| Net increase resulting from operations | | | 19,021,912 | | | | 1,855,920 | |
| | | | | | | | | |
| Distributions to Shareholders | | | | | | | | |
| From net investment income | | | (664,745 | ) | | | (109,928 | ) |
| From net realized gains | | | (516,826 | ) | | | — | |
| Net decrease resulting from distributions | | | (1,181,571 | ) | | | (109,928 | ) |
| | | | | | | | | |
| Capital Transactions | | | | | | | | |
| Proceeds from shares issued | | | 52,008,585 | | | | 38,356,998 | |
| Reinvestment of distributions | | | 1,181,571 | | | | 109,928 | |
| Cost of shares repurchased | | | (6,078,233 | ) | | | (1,510,624 | ) |
| Net increase resulting from capital transactions | | | 47,111,923 | | | | 36,956,302 | |
| | | | | | | | | |
| Total increase in net assets | | | 64,952,264 | | | | 38,702,294 | |
| | | | | | | | | |
| Net Assets | | | | | | | | |
| Beginning of period | | | 38,802,294 | | | | 100,000 | |
| End of period | | $ | 103,754,558 | | | $ | 38,802,294 | |
| | | | | | | | | |
| Distributions in excess of, and, Accumulated undistributed net investment income, respectively | | $ | (14,689 | ) | | $ | 51,189 | |
| | | | | | | | | |
| Capital Share Activity | | | | | | | | |
| Shares issued | | | 3,919,397 | | | | 3,538,393 | |
| Shares reinvested | | | 102,034 | | | | 10,403 | |
| Shares redeemed | | | (476,469 | ) | | | (135,418 | ) |
| Net increase in capital shares | | | 3,544,962 | | | | 3,413,378 | |
| * | Commencement of operations. |
See accompanying Notes to Financial Statements.
Vericimetry Funds
Vericimetry U.S. Small Cap Value Fund
FINANCIAL HIGHLIGHTS
For a capital share outstanding throughout the period
| | | For the Year Ended September 30, 2013 | | | For the Period from December 27, 2011* to September 30, 2012 | |
| Net asset value, beginning of period | | $ | 11.33 | | | $ | 10.00 | |
| Income from Investment Operations: | | | | | | | | |
| Net investment income | | | 0.16 | | | | 0.05 | |
| Net realized and unrealized gain on investments | | | 3.70 | | | | 1.32 | |
| Total from investment operations | | | 3.86 | | | | 1.37 | |
| | | | | | | | | |
| Less Distributions: | | | | | | | | |
| From net investment income | | | (0.16 | ) | | | (0.04 | ) |
| From net realized gain | | | (0.14 | ) | | | — | |
| Total distributions | | | (0.30 | ) | | | (0.04 | ) |
| | | | | | | | | |
| Net asset value, end of period | | $ | 14.89 | | | $ | 11.33 | |
| | | | | | | | | |
| Total return | | | 34.88 | % | | | 13.75 | %(1) |
| | | | | | | | | |
| Ratios and Supplemental Data | | | | | | | | |
| Net assets, end of period (in thousands) | | $ | 103,755 | | | $ | 38,802 | |
| | | | | | | | | |
| Ratio of expenses to average net assets | | | | | | | | |
| Before fees reimbursed by the Adviser | | | 1.17 | % | | | 2.80 | %(2) |
| After fees reimbursed by the Adviser | | | 0.60 | % | | | 0.60 | %(2) |
| Ratio of net investment income (loss) to average net assets | | | | | | | | |
| Before fees reimbursed by the Adviser | | | 0.59 | % | | | (1.18 | %)(2) |
| After fees reimbursed by the Adviser | | | 1.16 | % | | | 1.02 | %(2) |
| | | | | | | | | |
| Portfolio turnover rate | | | 24 | % | | | 33 | %(1) |
| * | Commencement of operations. |
See accompanying Notes to Financial Statements.
Vericimetry Funds
NOTES TO FINANCIAL STATEMENTS
As of September 30, 2013
1. Organization
Vericimetry Funds (the “Trust”), a Delaware Statutory Trust, is registered under the Investment Company Act of 1940 as a diversified, open-end management investment company. The Trust consists of the Vericimetry U.S. Small Cap Value Fund (the “Fund”). The Fund’s primary investment objective is to provide long-term capital appreciation. The Fund commenced operations on December 27, 2011.
2. Significant Accounting Policies
The following is a summary of significant accounting policies consistently followed by the Trust in the preparation of its financial statements. These policies are in conformity with accounting principles generally accepted in the United States of America (“GAAP”) for investment companies. The presentation of financial statements in conformity with GAAP requires management to make estimates and assumptions that affect the reported amounts of assets and liabilities at the date of the financial statements and the reported amounts of income and expenses. Actual results may differ from those estimates and disclosure of contingent assets and liabilities.
| (a) | Investment Valuation – Investments in securities traded on a national securities exchange are valued at the last reported sales price on the day of valuation. Securities traded on the Nasdaq National Market are valued at the Nasdaq Official Closing Price (“NOCP”). If there is no last reported sale or NOCP, the value of such securities will be at the mean between the most recent quoted bid and ask prices. Short-term investments are valued at amortized cost, which approximates fair value. If amortized cost does not approximate fair value, short-term securities are reported at fair value. Securities for which market quotations are not readily available are valued at their estimated fair value as determined in good faith by the Adviser under procedures established by and under the general supervision and responsibility of the Trust’s Board of Trustees. |
Under GAAP, various inputs are used in determining the value of the Fund’s investments. These inputs are summarized into three broad levels and described below:
| | Level 1 – | quoted prices for active markets for identical securities. An active market for the security is a market in which transactions occur with sufficient frequency and volume to provide pricing information on an ongoing basis. A quoted price in an active market provides the most reliable evidence of fair value. |
| | Level 2 – | other significant observable inputs (including quoted prices for similar securities, interest rates, prepayment speeds, credit risk, etc.). Quoted prices for identical or similar assets in markets that are not active. Inputs that are derived principally from or corroborated by observable market data. An adjustment to any observable input that is significant to the fair value may render the measurement at Level 3 measurement. |
| | Level 3 – | significant unobservable inputs, including the Fund’s own assumptions in determining the fair value of investments. |
In addition, the Fund has adopted Accounting Standards Update No. 2011-04, Fair Value Measurement (Topic 820): Amendments to Achieve Common Fair Value Measurement and Disclosure Requirements in U.S. GAAP and IFRSs which establishes common requirements for measuring fair value and for disclosing information about fair value measurements in accordance with U.S. GAAP and International Financial Reporting Standards. Enhanced disclosure is required to detail any transfers in to and out of Level 1 and Level 2 measurements and Level 2 and Level 3 measurements and the reasons for the transfers.
Vericimetry Funds
NOTES TO FINANCIAL STATEMENTS (Continued)
As of September 30, 2013
The inputs or methodology used for valuing securities are not necessarily an indication of the risk associated with investing in those securities. The following is a summary of the fair values of the Fund’s investments in each category as September 30, 2013:
| | | | | | | | | | | | |
| Investments in Securities | | | | | | | | | | | | |
Common Stocks(1) | | $ | 103,411,988 | | | $ | — | | | $ | — | | | $ | 103,411,988 | |
| Money Market Investments | | | 23,292,638 | | | | — | | | | — | | | | 23,292,638 | |
| Total Investments in Securities | | $ | 126,704,626 | | | $ | — | | | $ | — | | | $ | 126,704,626 | |
| | * | There were no Level 2 or 3 securities as of September 30, 2013. The Fund held one Level 3 security during the year, which was valued at $0 as of September 30, 2012 and was eliminated from the Fund’s portfolio via a corporate action during the year at no gain or loss to the Fund. There were no transfers between each of the three levels. The Fund recognizes such transfers between levels at the end of the reporting period. |
| | (1) | All common stocks held in the Fund are Level 1 securities. For a detailed break-out of common stocks by sector classification, please refer to the Schedule of Investments. |
| (b) | Investment Transactions, Investment Income and Expenses – Investment transactions are recorded on trade date for financial reporting purposes. Dividend income is recorded on the ex-dividend date. Securities gains and losses are calculated based on highest cost, long-term holdings. Interest income is recognized on accrual basis and includes, where applicable, the amortization or accretion of premium or discount. |
The Fund incurred offering costs of $105,570, which were amortized over a one-year period from December 27, 2011 (commencement of operations) through December 27, 2012. The Fund also incurred organizational costs of $114,068 prior to the commencement of operations of the Fund which were reimbursed by the Adviser. The Fund’s offering costs and previously waived organizational costs are subject to reimbursement in accordance with the Fund’s Expense Limitation Agreement discussed in Note 3.
| (c) | Federal Income Taxes – The Fund intends to comply with the requirements of Subchapter M of the Internal Revenue Code applicable to regulated investment companies and to distribute substantially all of its net investment income and any net realized gains to its shareholders. Therefore, no provision is made for federal income or excise taxes. Due to the timing of dividend distributions and the differences in accounting for income and realized gains and losses for financial statement and federal income tax purposes, the fiscal year in which amounts are distributed may differ from the year in which the income and realized gains and losses are recorded by the Fund. During 2012 and 2013, the Fund utilized earnings and profits distributions to shareholders on redemption of shares as part of the dividends paid deduction for income tax purposes. |
Accounting for Uncertainty in Income Taxes (the “Income Tax Statement”) requires an evaluation of tax positions taken (or expected to be taken) in the course of preparing a Fund’s tax returns to determine whether these positions meet a “more-likely-than-not” standard that, based on the technical merits, have a more than fifty percent likelihood of being sustained by a taxing authority upon examination. A tax position that meets the “more-likely-than-not” recognition threshold is measured to determine the amount of benefit to recognize in the financial statements. The Fund recognizes interest and penalties, if any, related to unrecognized tax benefits as income tax expense in the Statement of Operations.
The Income Tax Statement requires management of the Fund to analyze all open tax years (for the Fund, since the commencement of operations), as defined by IRS statute of limitations for all major jurisdictions, including federal tax authorities and certain state tax authorities. As of and during the year ended September 30, 2013, the Fund did not have a liability for any unrecognized tax benefits. The Fund has no examination in progress and is not aware of any tax positions for which it is reasonably possible that the total amounts of unrecognized tax benefits will significantly change in the next twelve months.
| (d) | Distributions to Shareholders – The Fund declares and pays dividends at least annually from net investment income and from net realized gains, if any. Distributions to shareholders are recorded on ex-dividend date. The amount and timing of distributions are determined in accordance with federal income tax regulations, which may differ from GAAP. |
Vericimetry Funds
NOTES TO FINANCIAL STATEMENTS (Continued)
As of September 30, 2013
| (e) | Securities Lending – The Fund is authorized to lend a portion of its portfolio securities (up to a maximum value of one-third of the Fund’s total asset value) for the purpose of seeking to earn additional income. A principal risk in lending portfolio securities, as with other extensions of credit, is the possible loss of rights in the collateral should the borrower fail financially. In addition, the Fund may be exposed to the risk that the sale of any collateral realized will not yield proceeds sufficient to replace the loaned securities. In determining whether to lend securities to a particular borrower, the Adviser (subject to oversight by the Board) will consider all relevant facts and circumstances, including the creditworthiness of the borrower. The loans would be made only to firms deemed by the Adviser to be of good standing, and when, in the judgment of the Adviser, the consideration that can be earned from securities loans of this type justifies the attendant risk. Collateral is received and maintained by the Fund’s securities lending agent concurrent with delivery of the loaned securities and kept in a segregated account or designated on the records of the custodian for the benefit of the Fund. The Fund will have the right to call a loan and obtain the securities loaned at any time on five days’ notice. While securities are on loan, the borrower will pay the Fund any income from the securities. |
The Fund may invest any cash collateral in portfolio securities and earn additional income or receive an agreed-upon amount of income from a borrower who has delivered equivalent collateral. Any such investment of cash collateral will subject the Fund to the related investment risks. The Fund will not have the right to vote on any securities having voting rights during the existence of the loan. The Fund will have the right to regain record ownership of loaned securities in order to exercise ownership rights such as voting rights, subscription rights and rights to dividends, interest or distributions. The Fund may pay reasonable administrative and custodial fees in connection with the loan.
At September 30, 2013, the value of securities loaned by the Fund was $21,643,598. Securities purchased via reinvestment of cash collateral received as part of the securities lending program can be found in the Fund’s Schedule of Investments.
3. Investment Advisory and Other Agreements
The Fund has entered into an Investment Advisory Agreement with the Adviser, pursuant to which the Adviser will provide general investment advisory services for the Fund. For providing these services, the Adviser will receive a fee from the Fund, accrued daily and paid monthly, at an annual rate equal to 0.50% of the Fund’s average daily net assets. However, the Adviser has contractually agreed through an Expense Limitation Agreement to reimburse the Fund so that its total annual operating expenses, including offering costs and the previously waived organizational costs, excluding interest, taxes, brokerage commissions and other expenses that are capitalized in accordance with GAAP, and other extraordinary costs, such as litigation and other expenses not incurred in the ordinary course of the Fund’s business, do not exceed 0.60% of the Fund’s average net assets per year, through January 31, 2015.
Under the terms of the Expense Limitation Agreement, at any time the expenses of the Fund, which include offering costs and the previously waived organizational costs, are less than the expense limitation, the Adviser retains the right to seek reimbursement for any fees previously waived and/or expenses previously assumed, to the extent that such reimbursement will not cause the Fund’s annualized expenses to exceed 0.60% of its average net assets on an annualized basis. The Fund is not obligated to reimburse the Adviser for fees previously waived or expenses previously assumed by the Adviser more than three years before the date of such reimbursement. As of September 30, 2013, reimbursements (including offering costs and the previously waived organizational costs) that may potentially be made by the Fund to the Adviser total $795,033, which expire as follows:
| September 22, 2014 | | $ | 114,068 | |
| September 30, 2015 | | $ | 326,483 | |
| September 30, 2016 | | $ | 354,482 | |
Certain officers and Trustees of the Trust are also officers of the Adviser.
Vericimetry Funds
NOTES TO FINANCIAL STATEMENTS (Continued)
As of September 30, 2013
4. Federal Income Tax Information
At September 30, 2013, gross unrealized appreciation and depreciation on investments owned by the Fund, based on cost for federal income tax purposes, were as follows:
| Cost of Investments | | $ | 110,902,480 | |
| Gross Unrealized Appreciation | | $ | 18,477,414 | |
| Gross Unrealized Depreciation | | | (2,675,268 | ) |
| Net Unrealized Appreciation | | $ | 15,802,146 | |
The difference between cost amounts for financial statement and federal income tax purposes is due primarily to timing differences in recognizing certain gains and losses in security transactions.
GAAP requires that certain components of net assets be reclassified between financial and tax reporting. These reclassifications have no effect on net assets or net asset value per share. For the year ended September 30, 2013, permanent differences in book and tax accounting have been reclassified to paid-in-capital, accumulated undistributed net investment income (loss) and accumulated net realized gain (loss) as follows:
|
| Accumulated Undistributed Net Investment Income | Accumulated Net Realized Gain on Investments |
| $166,505 | $(126,133) | $(40,372) |
As of September 30, 2013 the components of accumulated earnings on a tax basis were as follows:
| Undistributed Ordinary Income | | $ | 2,262,250 | |
| Undistributed Long-term Gains | | | 1,380,578 | |
| Tax Accumulated Earnings | | | 3,642,828 | |
| Accumulated Capital and Other Losses | | $ | — | |
| Unrealized Appreciation on Investments | | | 15,802,146 | |
| Total Accumulated Earnings (Deficit) | | $ | 19,444,974 | |
The tax character of distributions paid during the year ended September 30, 2013 and fiscal period ended September 30, 2012 were as follows:
| | | | | | | |
| Distributions Paid From: | | | | | | |
| Ordinary Income | | $ | 1,181,571 | | | $ | 109,928 | |
| Long-term Capital Gains | | | — | | | | — | |
| Total Distributions | | $ | 1,181,571 | | | $ | 109,928 | |
Vericimetry Funds
NOTES TO FINANCIAL STATEMENTS (Continued)
As of September 30, 2013
5. Investment Transactions
For the year ended September 30, 2013, purchases and sales of investments, excluding short-term investments, were as follows:
| | | | | | | |
| Vericimetry U.S. Small Cap Value Fund | | $ | 61,830,375 | | | $ | 15,267,349 | |
6. Indemnifications
In the normal course of business, the Fund enters into contracts that contain a variety of representations, which provide general indemnifications. The Fund’s maximum exposure under these arrangements is unknown, as this would involve future claims that may be made against the Fund that have not yet occurred. However, the Fund expects the risk of loss to be remote.
7. Events Subsequent to the Fiscal Period End
The Fund has adopted financial reporting rules regarding subsequent events which require an entity to recognize in the financial statements the effects of all subsequent events that provide additional evidence about conditions that existed at the date of the Statement of Assets and Liabilities. There were no subsequent events or transactions that occurred that materially impacted the amounts or disclosures in the Fund’s financial statements.
8. Recently Issued Accounting Pronouncements
In January 2013, the Financial Accounting Standards Board (“FASB”) issued Accounting Standards Update (“ASU”) No. 2013-01 Clarifying the Scope of Disclosures about Offsetting Assets and Liabilities. This update gives additional clarification to the FASB ASU No. 2011-11 Disclosures about Offsetting Assets and Liabilities. The amendments in this ASU require an entity to disclose information about offsetting and related arrangements to enable users of its financial statements to understand the effect of those arrangements on its financial position. The ASU is effective for annual reporting periods beginning on or after January 1, 2013, and interim periods within those annual periods. The guidance requires retrospective application for all comparative periods presented. Management is currently evaluating the impact ASU 2013-01 will have on the financial statement disclosures.
Vericimetry Funds
REPORT OF INDEPENDENT REGISTERED PUBLIC ACCOUNTING FIRM
To the Shareholders and Board of Trustees of
Vericimetry Funds
We have audited the accompanying statement of assets and liabilities, including the schedule of investments, of Vericimetry Funds, comprising Vericimetry U.S. Small Cap Value Fund (the “Fund”), as of September 30, 2013, and the related statement of operations for the year then ended, and the statements of changes in net assets and financial highlights for each of the two periods in the period then ended. These financial statements and financial highlights are the responsibility of the Fund’s management. Our responsibility is to express an opinion on these financial statements and financial highlights based on our audits.
We conducted our audits in accordance with the standards of the Public Company Accounting Oversight Board (United States). Those standards require that we plan and perform the audit to obtain reasonable assurance about whether the financial statements and financial highlights are free of material misstatement. An audit includes examining, on a test basis, evidence supporting the amounts and disclosures in the financial statements. Our procedures included confirmation of securities owned as of September 30, 2013, by correspondence with the custodian and brokers. An audit also includes assessing the accounting principles used and significant estimates made by management, as well as evaluating the overall financial statement presentation. We believe that our audits provide a reasonable basis for our opinion.
In our opinion, the financial statements and financial highlights referred to above present fairly, in all material respects, the financial position of Vericimetry U.S. Small Cap Value Fund as of September 30, 2013, the results of its operations for the year then ended, and the changes in its net assets and financial highlights for each of the two periods in the period then ended, in conformity with accounting principles generally accepted in the United States of America.
COHEN FUND AUDIT SERVICES, LTD.
Cleveland, Ohio
November 25, 2013
Vericimetry Funds
EXPENSE EXAMPLE
For the Six Months Ended September 30, 2013 (Unaudited)
As a shareholder of the Fund, you incur two types of costs: (1) transaction costs and (2) ongoing costs, including management fees and other Fund expenses. This Example is intended to help you understand your ongoing costs (in dollars) of investing in the Fund and to compare these costs with the ongoing costs of investing in other mutual funds.
The Example is based on an investment of $1,000 invested at the beginning of the period and held for the entire period from April 1, 2013 through September 30, 2013 (the “period”).
Actual Expenses
The first line of the table below provides information about actual account values and actual expenses. You may use the information in this line, together with the amount you invested, to estimate the expenses you paid over the period. Simply divide your account value by $1,000 (for example, an $8,600 account value divided by $1,000 equals 8.6), then multiply the result by the number in the first line under the heading entitled “Expenses Paid During the Period” to estimate the expenses you paid on your account during the period.
Hypothetical Example for Comparison Purposes
The second line of the table below provides information about hypothetical account values and hypothetical expenses based on the Fund’s actual expense ratio and an assumed rate of return of 5% per year before expenses, which is not the Fund’s actual return. The hypothetical account values and expenses may not be used to estimate the actual ending account balance or expenses you paid for the period. You may use this information to compare the ongoing costs of investing in the Fund and other funds. To do so, compare this 5% hypothetical example with the 5% hypothetical examples that appear in the shareholder reports of other funds.
Please note that the expenses shown in the table are meant to highlight your ongoing costs only and do not reflect any transactional costs. Therefore, the second line of the table is useful in comparing the ongoing costs only, and will not help you determine the relative total costs of owning different funds. In addition, if these transactional costs were included, your costs could have been higher.
Expenses Paid During the Period
| | Beginning account value April 1, 2013 | Ending account value September 30, 2013 | Expenses paid during the period ended September 30, 2013* |
| Actual Example | $1,000.00 | $1,161.70 | $3.25 |
| Hypothetical Example, assuming a 5% return before expenses | 1,000.00 | 1,021.99 | 3.04 |
| * | Expenses are equal to the Fund’s annualized expense ratio of 0.60% multiplied by the average account value over the period, multiplied by 183/365 (to reflect the six month period). |
Vericimetry Funds
OTHER INFORMATION (Unaudited)
Proxy Voting
The Fund’s proxy voting guidelines and a record of the Vericimetry U.S. Small Cap Value Fund’s proxy votes for the year ended June 30 are available without charge, upon request, by calling 1-855-755-7550 and on the Securities and Exchange Commission’s website at www.sec.gov.
Quarterly Holdings
The Fund will file its complete schedule of portfolio holdings with the SEC for the first and third quarters of each fiscal year on Form N-Q. The Fund’s Form N-Q will be available on the EDGAR database on the Securities and Exchange Commission’s website at www.sec.gov. These Forms may also be reviewed and copied at the Securities and Exchange Commission’s Public Reference Room in Washington, D.C. Information about the operation of the Public Reference Room may be obtained by calling 1-800-SEC-0330.
Risk Disclosures
Economic, political, and issuer specific events will cause the value of securities to rise or fall. Because the value of your investment in the Fund will fluctuate, there is the risk that you will lose money. Securities of small and microcap companies are often less liquid, more volatile and they may have more limited resources. Value stocks may perform differently from the market as a whole and may underperform equity funds that use other investment strategies. The investment strategies, practices and risk analysis used by the Adviser may not produce the desired results.
Tax Information
For the year ended September 30, 2013, 30.85% of the dividends paid from net investment income, including short-term capital gains (if any), for the Fund, is designated as qualified dividend income.
For the year ended September 30, 2013, 29.44% of the dividends paid from net investment income, including short-term capital gains (if any), for the Fund, qualified for the dividends received deduction available to corporate shareholders.
Vericimetry Funds
TRUSTEES AND OFFICERS
September 30, 2013 (Unaudited)
Interested Trustee and Officer |
| | Term of Office(1) and Length of Service | Principal Occupation(s) During Past 5 Years | Funds of the Trust Overseen | Other Public Company or Registered Investment Company Trusteeships Held During Past 5 Years |
Glenn S. Freed, Ph.D.(2) 800 Wilshire Blvd., Suite 300 Los Angeles, CA 90017 Age: 51 | Chairman, President, Secretary & Trustee | Treasurer and Secretary since July 2013; Other Positions since Trust inception | Chief Executive Officer, Vericimetry Advisors LLC, 2011 - present; Vice President, Dimensional Fund Advisors LP, 2001 - 2010. | 1 | None |
|
| | Term of Office(1) and Length of Service | Principal Occupation(s) During Past 5 Years | Funds of the Trust Overseen | Other Public Company or Registered Investment Company Trusteeships Held During Past 5 Years |
David G. Chrencik 800 Wilshire Blvd., Suite 300 Los Angeles, CA 90017 Age: 65 | Trustee | Since Trust’s inception | Vice President Finance, Chief Financial Officer, Secretary and Director, GeoGreen Biofuels Inc., 2010 - present; Partner, PricewaterhouseCoopers LLP, 1972 – 2009; Chief Financial Officer, Sarus Indochina Select (a pooled investment vehicle), 2012 – present. | 1 | Director, Bennett Group of Funds since 2011; Trustee, Del Rey Global Monarch Fund since 2011. |
Kenneth A. Merchant, Ph.D. 800 Wilshire Blvd., Suite 300 Los Angeles, CA 90017 Age: 66 | Trustee | Since Trust’s inception | Deloitte & Touche LLP Chair of Accountancy, 1997-present; Professor, Leventhal School of Accounting, Marshall School of Business, University of Southern California, 1990 - present. | 1 | Director, Entropic Communications Inc. since 2007; Director, Universal Guardian Holdings Inc., 2006-2008. |
| (1) | Each Trustee holds office for an indefinite term until his successor is elected and qualified. Each Officer holds office for an indefinite term at the pleasure of the Board and until his or her successor is elected and qualified. |
| (2) | Mr. Freed is considered an Interested Trustee of the Trust, within the meaning of the 1940 Act, because of his affiliation with Vericimetry Advisors LLC, investment adviser to the Fund. |
The Statement of Additional Information includes additional information about the Trustees and is available upon request, without charge, by calling 1-855-755-7550 or visit www.vericimetryfunds.com.
Vericimetry Funds
TRUSTEES AND OFFICERS (Continued)
September 30, 2013 (Unaudited)
Independent Trustees (Continued) |
| | Term of Office(1) and Length of Service | Principal Occupation(s) During Past 5 Years | Funds of the Trust Overseen | Other Public Company or Registered Investment Company Trusteeships Held During Past 5 Years |
Brian K. Wing 800 Wilshire Blvd., Suite 300 Los Angeles, CA 90017 Age: 45 | Trustee | Since August 2013 | Chief Financial Officer, eRecyclingCorps, Irving, Texas, 2013 – present; Chief Financial Officer, Treasurer and Senior Vice President (Operations), Consolidated Electrical Distributors, Inc., Irving, Texas, 2009 - 2013; Executive Vice President, Corporate Development, MGA Entertainment, Inc., Van Nuys, California, 2008 - 2009; Partner, Ernst & Young, LLP, San Diego, California, 2006 – 2008; Senior Vice President Finance, Accounting and Taxation, MGA Entertainment, Inc., Van Nuys, California, 2004 – 2006; Senior-to-Senior Manager, International Tax Services, Ernst & Young, Los Angeles, California, 1998 – 2004. | 1 | None |
|
| | Term of Office(1) and Length of Service | Principal Occupation(s) During Past 5 Years | Funds of the Trust Overseen |
Carlos A. Elizondo 800 Wilshire Blvd., Suite 300 Los Angeles, CA 90017 Age: 40 | Chief Compliance Officer | Since October, 2012. | Chief Compliance Officer, Vericimetry Advisors LLC (2012-present); Chief Financial Officer, Issio Solutions, Inc. (Software) (2011-present); Managing Member, Eight Reales Capital Investments LLC (Family Office) (2011- present); Chief Operating Officer and Chief Financial Officer, Vericimetry Advisors LLC (2012-2013); Bailey, Elizondo & Brinkman LLC (Consulting) (2009-2012); Senior Vice President, GE Capital Corporation (2001-2009). | 1 |
| (1) | Each Trustee holds office for an indefinite term until his successor is elected and qualified. Each Officer holds office for an indefinite term at the pleasure of the Board and until his or her successor is elected and qualified. |
The Statement of Additional Information includes additional information about the Trustees and is available upon request, without charge, by calling 1-855-755-7550 or visit www.vericimetryfunds.com.
This page intentionally left blank.
This page intentionally left blank.
Vericimetry U.S. Small Cap Value Fund
UMB Distribution Services, LLC, Distributor
P.O. Box 2175, Milwaukee, WI 53201-2175
www.vericimetryfunds.com
Item 2. Code of Ethics.
The registrant, as of the end of the period covered by this report, has adopted a code of ethics that applies to the Registrant’s principal executive officer, principal financial officer, principal accounting officer or controller, or persons performing similar functions, regardless of whether these individuals are employed by the Registrant or a third party.
There have been no amendments to the registrant’s Sarbanes Oxley Code of Ethics during the reporting period for this Form N-CSR. However in November 2013, the registrant’s Sarbanes Oxley Code of Ethics was amended to reflect a change in officers for the Trust. A copy of the amended code of ethics is attached hereto as Exhibit (a). There have also been no waivers granted by the Registrant to individuals covered by the Registrant’s Code of Ethics during the reporting period for this Form N-CSR.
Item 3. Audit Committee Financial Expert.
The Registrant’s board of trustees has determined that Mr. Kenneth Merchant is an audit committee financial expert serving on its audit committee and that Mr. Merchant are independent.
The aggregate fees billed for each of the last two fiscal years for professional services rendered by the principal accountant for the audit of the Registrant’s annual financial statements or services that are normally provided by the accountant in connection with statutory and regulatory filings or engagements are listed below.
The Registrant’s audit committee has adopted an Audit Committee Charter that requires that the Audit Committee review the scope and plan of the registered public accounting firm’s annual and interim examinations, approve the services to be performed for the Registrant by the independent public accountants and approve the fees and other compensation payable to the independent accountants. For the year ended September 30, 2013, all of the audit and non-audit services provided by the Registrant’s principal accountant were pre-approved by the audit committee.
(f) None.
(g) None.
(h) Not applicable.
Item 5. Audit Committee of Listed Registrants
Not applicable.
The schedule of investments in securities in unaffiliated issuers is included as part of the report to shareholders filed under Item 1.
Item 7. Disclosure of Proxy Voting Policies and Procedures for Closed-End Management Investment Companies
Not applicable.
Not applicable.
Item 9. Purchases of Equity Securities by Closed-End Management Investment Company and Affiliated Purchasers
Not applicable.
As of the end of the period covered by this report, the Registrant had not adopted any procedures by which shareholders may recommend nominees to the Registrant’s board of trustees.
Item 11. Controls and Procedures.
(a) The registrant's certifying officer has concluded that the Registrant's disclosure controls and procedures (as defined in Rule 30a-2 under the Investment Company Act of 1940 (the "Act")) are effective in design and operation and are sufficient to form the basis of the certifications required by Rule 30a-2 under the Act, based on his evaluation of these disclosure controls and procedures within 90 days of the filing date of this report on Form N-CSR.
(b) There were no significant changes in the Registrant's internal controls or in other factors that could significantly affect these controls subsequent to the date of their evaluation, including any corrective actions with regard to significant deficiencies and material weaknesses.
Item 12. Exhibits.
(a)(1) Code of Ethics – Filed as an attachment to this filing.
(a)(2) Certification for the principal executive and principal financial officer of the registrant as required by Rule 30a-2 under the Act (17 CFR 270.30a-2(a)) – Filed as an attachment to this filing.
(a)(3) Not Applicable.
(b) Certifications required by Rule 30a-2(b) under the Act (17 CFR 270.30a-2(b)), Rule 13a-14(b) or Rule 15d-14(b) under the Exchange Act (17 CFR 240.13a-14(b) or 240.15d-14(b)), and Section 1350 of Chapter 63 of Title 18 of the United States Code (18 U.S.C. 1350) – Filed as an attachment to this filing.
Pursuant to the requirements of the Securities Exchange Act of 1934 and the Investment Company Act of 1940, the registrant has duly caused this report to be signed on its behalf by the undersigned, thereunto duly authorized.