Washington, D.C. 20549
1968 N. Lake Avenue, #303
Dr. Mendel Fygenson
1968 N. Lake Avenue, #303
Item 1. Reports to Stockholders.
The following is a copy of the report transmitted to shareholders pursuant to Rule 30e-1 under the Investment Company Act of 1940 (17 CFR 270.30e-1).
Vericimetry U.S. Small Cap Value Fund
Annual Report
September 30, 2017
Vericimetry Funds
TABLE OF CONTENTS
September 30, 2017
| Letter to Shareholders | 1 |
| Manager’s Discussion and Analysis | 2 |
| Performance Summary | 3 |
| Schedule of Investments | 4 |
| Financial Statements | 18 |
| Financial Highlights | 21 |
| Notes to Financial Statements | 22 |
| Report of Independent Registered Public Accounting Firm | 27 |
| Expense Example | 28 |
| Other Information | 29 |
| Trustees and Officers | 30 |
This report has been prepared for shareholders and may be distributed to others only if preceded or accompanied by a current prospectus.
Except for historical information, the matters discussed in this report may constitute forward-looking statements. These include any predictions, assessments, analyses or outlooks for individual securities, industries, market sectors and/or markets. These statements involve risks and uncertainties. In addition to the general risks described for the Fund in the current prospectus, other factors bearing on these statements include the accuracy of the Adviser’s forecasts and predictions, and the appropriateness of the investment programs designed by the Adviser to implement its strategies efficiently and effectively. Any one or more of these factors, as well as other risks affecting the securities markets and investment instruments generally, could cause the actual results of the Fund to differ materially as compared to applicable benchmarks.
Vericimetry Funds
LETTER TO SHAREHOLDERS
September 30, 2017 (Unaudited)
Dear Shareholders,
We are pleased to present the enclosed annual report for the Vericimetry U.S. Small Cap Value Fund (the “Fund”) for the year ended September 30, 2017.
Vericimetry Advisors, LLC (the “Adviser”) is an academically based, quantitatively structured investment adviser. We provide a selected group of elite financial advisors access to an enhanced index strategy for a well-defined asset class with a predetermined benchmark. The Fund’s objective is to achieve long-term capital appreciation through its principal investment strategy of investing in U.S. small capitalization and value securities.
The Fund invests in a wide and diverse universe of U.S. small capitalization value stocks using a structured quantitative investment approach based on a set of well-defined fundamental characteristics that historically has shown to deliver the risk-premiums in U.S. small and value equities. Given our capacity advantage, we employ a multi-factor approach to identify value securities. To this end, securities considered for the Fund must pass a “value screen” which combines factors such as book-to-market, price-to-earnings, price to-sales or price-to-operating cash flow.1
In an effort to enhance net returns to the investor, we implement disciplined and patient trading strategies. The Fund is managed with the intent of maintaining competitive management fees and low transaction costs, expenses and turnover in an effort to enhance net returns to the investor. We are committed to limiting the growth of the Fund’s assets under management once it reaches its optimal capacity.
We thank you for your investment in the Vericimetry U.S. Small Cap Value Fund and for the confidence and trust you place in the Adviser’s investment team.
Sincerely,
Dr. Mendel Fygenson
Chief Executive Officer
Economic, political, and issuer specific events may cause the value of securities to rise or fall. Because the value of your investment in the Fund will fluctuate, there is the risk that you will lose money. Securities of small and microcap companies are often less liquid, more volatile and they may have more limited resources. Value stocks may perform differently from the market as a whole and may underperform equity funds that use other investment strategies. The investment strategies, practices and risk analysis used by the Adviser may not produce the desired results.
1 | Book-to-market is the value ratio of a company’s book value to its market value. Price-to-earnings, price-to-sales and price-to-operating cash flow ratios are the value of a company’s share price compared to its previous twelve months earnings per share, sales per share or operating cash flow per share, respectively. |
1
Vericimetry Funds
MANAGER’S DISCUSSION AND ANALYSIS
September 30, 2017 (Unaudited)
The following overview summarizes the results of the Vericimetry U.S. Small Cap Value Fund for the fiscal year ended on September 30, 2017. In general, the Fund seeks to deliver the long side of the size-value risk premiums in U.S. securities through a well diversified portfolio. The outcomes of this fiscal year demonstrate management’s commitment to the Fund’s mandated strategy and its stated investment philosophy. Please note that returns mentioned in the summary below, for both the Fund and for the indices, are total returns.
For the fiscal year ended on September 30, 2017, the Fund had positive returns, but it underperformed its benchmark – the Russell 2000® Value Index (the “Benchmark”). Overall, the Fund’s fiscal-year annual return was a positive 19.06% versus the Benchmark’s positive return of 20.55%. For most of the year, the Fund was almost fully invested and had a well-diversified portfolio, with well over 1,000 equity holdings.
Examining the returns of different segments of the U.S. equity markets over this fiscal year provides additional information (shown below). The broad market had a large positive return, as illustrated by the Russell 3000® Index. Small cap stocks, represented by the Russell 2000® Indices, had higher returns than large cap stocks, represented by the Russell 1000® Indices. Given the Fund’s greater exposure to the smaller cap segment of the market, this size differential had a positive impact on the Fund’s returns. In general, Value stocks have underperformed Growth stocks within most of the sizes, as illustrated by the various Russell indices. Thus, the value differential, which the Fund seeks to deliver through a multifactor approach, had a small negative impact on the Fund’s returns.
For the entire fiscal year, the Fund underperformed the Benchmark by a total of 1.49%. This deficit can be entirely attributed to the performance differentials during the historic fourth quarter of 2016 (the “Quarter”). For that entire Quarter, the Fund’s return was a positive 12.49% versus the Benchmark’s positive return of 14.07%. The Benchmark’s return was greatly propelled by its large exposure to regional banks, which as a group rose more than 30% during the Quarter. As in all other quarters since the Fund’s inception, the Benchmark held, on average, 5% more weight in regional banks than the Fund, causing the Fund’s underperformance for the entire fiscal year.
Returns for the Fiscal Year Ended September 30, 2017
Russell Microcap® Value Index | 26.15% |
Russell Microcap® Index | 22.33% |
Russell 1000® Growth Index | 21.94% |
Russell 3000® Growth Index | 21.87% |
Russell 2000® Growth Index | 20.98% |
Russell 2000® Index | 20.74% |
Russell 2000® Value Index | 20.55% |
Russell 3000® Index | 18.71% |
Russell 1000® Index | 18.54% |
Russell Microcap® Growth Index | 17.27% |
Russell 3000® Value Index | 15.53% |
Russell 1000® Value Index | 15.12% |
Source: Russell Investment Group
2
Vericimetry Funds
PERFORMANCE SUMMARY (Unaudited)
September 30, 2017
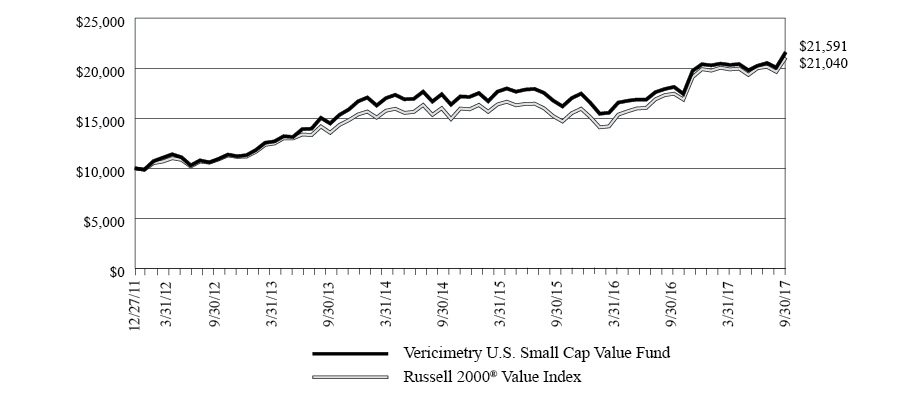
Comparison of a Hypothetical $10,000 Investment
in the Vericimetry U.S. Small Cap Value Fund and the Russell 2000® Value Index*
Total Returns
For the periods ended September 30, 2017 |
| | One Year | Five Year | Average Annual Since Inception ** | |
| Vericimetry U.S. Small Cap Value Fund | 19.06% | 13.68% | 14.29% | |
Russell 2000® Value Index* | 20.55% | 13.27% | 13.78% | |
| * | The Russell 2000® Value Index measures the performance of small-cap value segment of the U.S. equity universe. It includes those Russell 2000 Index companies with lower price-to-book ratios and lower forecasted growth values. |
| ** | Commencement of operations for the Vericimetry U.S. Small Cap Value Fund was December 27, 2011. |
The Fund's net expense ratio of 0.61% and gross expense ratio of 0.69% are reflective of the information disclosed in the Fund's prospectus dated January 27, 2017, and differ from the expense ratios disclosed in this report, which are 0.60% and 0.66% respectively. The Adviser has contractually agreed to waive all or a portion of its management fees and/or reimburse expenses at least through January 31, 2018 in order to keep the Fund’s net annual operating expenses (excluding certain non-operating expenses) from exceeding 0.60% of its average daily net assets. Performance data quoted represents past performance which is not predictive of future performance. The investment return and principal value of Fund shares will fluctuate and when redeemed, may be worth more or less than their original cost. Current performance may be lower or higher than the performance information quoted. To receive current performance to the most recent month end, please call 1-855-755-7550. Please read prospectus carefully before investing.
The line graph and table do not reflect the deduction of taxes that a shareholder would pay on Fund distributions or the redemption of Fund shares.
The Fund’s results as shown are net of fees.
3
Vericimetry U.S. Small Cap Value Fund
SCHEDULE OF INVESTMENTS
As of September 30, 2017
| | | Number
of Shares | | | Value | |
COMMON STOCKS – 96.2% | | | | | | |
BASIC MATERIALS – 4.9% | | | | | | |
| A Schulman, Inc. | | | 5,150 | | | $ | 175,873 | |
AgroFresh Solutions, Inc.*1 | | | 27,000 | | | | 189,810 | |
AK Steel Holding Corp.*1 | | | 36,500 | | | | 204,035 | |
Allegheny Technologies, Inc.*1 | | | 17,200 | | | | 411,080 | |
| American Vanguard Corp. | | | 11,500 | | | | 263,350 | |
| Calgon Carbon Corp. | | | 8,400 | | | | 179,760 | |
| Carpenter Technology Corp. | | | 15,700 | | | | 754,071 | |
| Century Aluminum Co.* | | | 42,700 | | | | 707,966 | |
| Chemours Co. | | | 22,400 | | | | 1,133,664 | |
| Clearwater Paper Corp.* | | | 2,000 | | | | 98,500 | |
| Cleveland-Cliffs, Inc.* | | | 40,200 | | | | 287,430 | |
| Commercial Metals Co. | | | 36,000 | | | | 685,080 | |
| CSW Industrials, Inc.* | | | 2,960 | | | | 131,276 | |
| Domtar Corp. | | | 1,500 | | | | 65,085 | |
Fairmount Santrol Holdings, Inc.*1 | | | 9,600 | | | | 45,888 | |
| Ferroglobe PLC | | | 17,500 | | | | 230,300 | |
| Hecla Mining Co. | | | 189,800 | | | | 952,796 | |
| Huntsman Corp. | | | 6,950 | | | | 190,569 | |
| Innophos Holdings, Inc. | | | 2,700 | | | | 132,813 | |
| Innospec, Inc. | | | 1,050 | | | | 64,733 | |
Intrepid Potash, Inc.*1 | | | 57,100 | | | | 248,956 | |
| Kaiser Aluminum Corp. | | | 5,513 | | | | 568,611 | |
| KMG Chemicals, Inc. | | | 5,031 | | | | 276,101 | |
| Koppers Holdings, Inc.* | | | 4,600 | | | | 212,290 | |
| Kraton Corp.* | | | 14,600 | | | | 590,424 | |
| Kronos Worldwide, Inc. | | | 33,700 | | | | 769,371 | |
| Landec Corp.* | | | 9,200 | | | | 119,140 | |
| Materion Corp. | | | 10,300 | | | | 444,445 | |
| Mercer International, Inc. | | | 21,200 | | | | 251,220 | |
| Minerals Technologies, Inc. | | | 2,500 | | | | 176,625 | |
| Oil-Dri Corp. of America | | | 1,400 | | | | 68,502 | |
| Olin Corp. | | | 24,770 | | | | 848,372 | |
| OMNOVA Solutions, Inc.* | | | 6,900 | | | | 75,555 | |
Orchids Paper Products Co.1 | | | 3,400 | | | | 47,872 | |
| PH Glatfelter Co. | | | 21,967 | | | | 427,258 | |
| Platform Specialty Products Corp.* | | | 7,200 | | | | 80,280 | |
| PolyOne Corp. | | | 4,700 | | | | 188,141 | |
Rayonier Advanced Materials, Inc.1 | | | 8,050 | | | | 110,285 | |
| Schnitzer Steel Industries, Inc. - Class A | | | 10,800 | | | | 304,020 | |
| Schweitzer-Mauduit International, Inc. | | | 3,300 | | | | 136,818 | |
| Stepan Co. | | | 8,850 | | | | 740,391 | |
| Tronox Ltd. - Class A | | | 33,300 | | | | 702,630 | |
| United States Lime & Minerals, Inc. | | | 500 | | | | 42,000 | |
United States Steel Corp.1 | | | 12,600 | | | | 323,316 | |
| Univar, Inc.* | | | 5,400 | | | | 156,222 | |
| Universal Stainless & Alloy Products, Inc.* | | | 4,600 | | | | 95,910 | |
| | | | | | | | 14,908,834 | |
COMMON STOCKS (Continued) | | | | | | | | |
COMMUNICATIONS – 3.3% | | | | | | | | |
| 1-800-Flowers.com, Inc. - Class A* | | | 3,813 | | | | 37,558 | |
| ADTRAN, Inc. | | | 3,200 | | | | 76,800 | |
| AH Belo Corp. - Class A | | | 9,635 | | | | 44,321 | |
| ATN International, Inc. | | | 2,529 | | | | 133,278 | |
| Aware, Inc.* | | | 3,673 | | | | 17,079 | |
| Bankrate, Inc.* | | | 23,100 | | | | 322,245 | |
| Blucora, Inc.* | | | 29,800 | | | | 753,940 | |
| Boingo Wireless, Inc.* | | | 4,200 | | | | 89,754 | |
Chegg, Inc.*1 | | | 11,000 | | | | 163,240 | |
| Comtech Telecommunications Corp. | | | 9,100 | | | | 186,823 | |
Consolidated Communications Holdings, Inc.1 | | | 3,942 | | | | 75,213 | |
Daily Journal Corp.*1 | | | 200 | | | | 43,722 | |
| EchoStar Corp. - Class A* | | | 4,800 | | | | 274,704 | |
Entercom Communications Corp. - Class A1 | | | 10,900 | | | | 124,805 | |
| ePlus, Inc.* | | | 9,280 | | | | 857,936 | |
| EW Scripps Co. - Class A* | | | 13,216 | | | | 252,558 | |
| Finisar Corp.* | | | 2,300 | | | | 50,991 | |
| Gannett Co., Inc. | | | 26,300 | | | | 236,700 | |
| Gigamon, Inc.* | | | 2,400 | | | | 101,160 | |
| Global Eagle Entertainment, Inc.* | | | 13,900 | | | | 47,538 | |
| Gray Television, Inc.* | | | 24,000 | | | | 376,800 | |
| Hawaiian Telcom Holdco, Inc.* | | | 1,100 | | | | 32,802 | |
| Houghton Mifflin Harcourt Co.* | | | 7,400 | | | | 89,170 | |
| Infinera Corp.* | | | 9,400 | | | | 83,378 | |
| InterDigital, Inc. | | | 700 | | | | 51,625 | |
Iridium Communications, Inc.*1 | | | 25,000 | | | | 257,500 | |
| Limelight Networks, Inc.* | | | 16,345 | | | | 64,890 | |
| Meet Group, Inc.* | | | 13,600 | | | | 49,504 | |
Meredith Corp.1 | | | 4,700 | | | | 260,850 | |
| NETGEAR, Inc.* | | | 9,400 | | | | 447,440 | |
| New Media Investment Group, Inc. | | | 8,400 | | | | 124,236 | |
New York Times Co. - Class A1 | | | 16,600 | | | | 325,360 | |
Oclaro, Inc.*1 | | | 34,750 | | | | 299,892 | |
| Overstock.com, Inc.* | | | 2,700 | | | | 80,190 | |
| PC-Tel, Inc. | | | 13,100 | | | | 82,530 | |
| Perficient, Inc.* | | | 2,900 | | | | 57,043 | |
| Preformed Line Products Co. | | | 1,100 | | | | 74,030 | |
Proofpoint, Inc.*1 | | | 2,800 | | | | 244,216 | |
| QuinStreet, Inc.* | | | 18,400 | | | | 135,240 | |
| Saga Communications, Inc. - Class A | | | 2,700 | | | | 123,120 | |
| Salem Media Group, Inc. | | | 5,121 | | | | 33,799 | |
| Scholastic Corp. | | | 14,430 | | | | 536,796 | |
| Sonus Networks, Inc.* | | | 8,700 | | | | 66,555 | |
| Spok Holdings, Inc. | | | 7,800 | | | | 119,730 | |
Stamps.com, Inc.*1 | | | 600 | | | | 121,590 | |
| TechTarget, Inc.* | | | 5,900 | | | | 70,446 | |
See accompanying Notes to Financial Statements.
4
Vericimetry U.S. Small Cap Value Fund
SCHEDULE OF INVESTMENTS (Continued)
As of September 30, 2017
| | | Number
of Shares | | | Value | |
COMMON STOCKS (Continued) | | | | | | |
COMMUNICATIONS (Continued) | | | | | | |
| Telephone & Data Systems, Inc. | | | 15,200 | | | $ | 423,928 | |
| Time, Inc. | | | 7,800 | | | | 105,300 | |
| TiVo Corp. | | | 21,760 | | | | 431,936 | |
| Tribune Media Co. - Class A | | | 3,900 | | | | 159,354 | |
| U.S. Auto Parts Network, Inc.* | | | 14,200 | | | | 41,038 | |
ViaSat, Inc.*1 | | | 1,600 | | | | 102,912 | |
| Viavi Solutions, Inc.* | | | 16,300 | | | | 154,198 | |
| Vonage Holdings Corp.* | | | 20,800 | | | | 169,312 | |
| Web.com Group, Inc.* | | | 4,200 | | | | 105,000 | |
| West Corp. | | | 8,450 | | | | 198,322 | |
| YuMe, Inc. | | | 16,539 | | | | 76,576 | |
| | | | | | | | 10,066,973 | |
CONSUMER, CYCLICAL – 14.3% | | | | | | | | |
Abercrombie & Fitch Co. - Class A1 | | | 40,000 | | | | 577,600 | |
AMC Entertainment Holdings, Inc. - Class A1 | | | 6,840 | | | | 100,548 | |
America's Car-Mart, Inc.*1 | | | 3,700 | | | | 152,163 | |
| American Axle & Manufacturing Holdings, Inc.* | | | 20,900 | | | | 367,422 | |
| American Eagle Outfitters, Inc. | | | 21,200 | | | | 303,160 | |
| American Woodmark Corp.* | | | 700 | | | | 67,375 | |
| Anixter International, Inc.* | | | 2,900 | | | | 246,500 | |
Ascena Retail Group, Inc.*1 | | | 32,700 | | | | 80,115 | |
AV Homes, Inc.*1 | | | 8,620 | | | | 147,833 | |
| Barnes & Noble Education, Inc.* | | | 13,400 | | | | 87,234 | |
| Barnes & Noble, Inc. | | | 29,100 | | | | 221,160 | |
| Bassett Furniture Industries, Inc. | | | 4,050 | | | | 152,685 | |
| Beacon Roofing Supply, Inc.* | | | 5,910 | | | | 302,888 | |
| Beazer Homes USA, Inc.* | | | 24,800 | | | | 464,752 | |
| Belmond Ltd. - Class A* | | | 24,550 | | | | 335,107 | |
Big 5 Sporting Goods Corp.1 | | | 7,600 | | | | 58,140 | |
Big Lots, Inc.1 | | | 5,600 | | | | 299,992 | |
| Biglari Holdings, Inc.* | | | 167 | | | | 55,659 | |
Blue Bird Corp.*1 | | | 2,000 | | | | 41,200 | |
| Boot Barn Holdings, Inc.* | | | 5,100 | | | | 45,390 | |
| Boyd Gaming Corp. | | | 13,300 | | | | 346,465 | |
Buckle, Inc.1 | | | 5,300 | | | | 89,305 | |
| Burlington Stores, Inc.* | | | 2,300 | | | | 219,558 | |
| Caesars Acquisition Co. - Class A* | | | 32,200 | | | | 690,690 | |
Caesars Entertainment Corp.*1 | | | 16,000 | | | | 213,600 | |
Caleres, Inc.1 | | | 13,100 | | | | 399,812 | |
| Callaway Golf Co. | | | 12,450 | | | | 179,654 | |
| Casey's General Stores, Inc. | | | 1,700 | | | | 186,065 | |
| Cato Corp. - Class A | | | 2,500 | | | | 33,075 | |
Cavco Industries, Inc.*1 | | | 600 | | | | 88,530 | |
| Century Casinos, Inc.* | | | 5,600 | | | | 45,976 | |
| Century Communities, Inc.* | | | 4,372 | | | | 107,988 | |
COMMON STOCKS (Continued) | | | | | | | | |
CONSUMER, CYCLICAL (Continued) | | | | | | | | |
Children's Place, Inc.1 | | | 4,840 | | | | 571,846 | |
| Choice Hotels International, Inc. | | | 4,000 | | | | 255,600 | |
| Churchill Downs, Inc. | | | 960 | | | | 197,952 | |
| Citi Trends, Inc. | | | 6,700 | | | | 133,129 | |
| Clarus Corp.* | | | 18,900 | | | | 141,750 | |
| Columbia Sportswear Co. | | | 10,816 | | | | 666,049 | |
| Commercial Vehicle Group, Inc.* | | | 8,600 | | | | 63,210 | |
Conn's, Inc.*1 | | | 5,300 | | | | 149,195 | |
Cooper Tire & Rubber Co.1 | | | 6,200 | | | | 231,880 | |
| Cooper-Standard Holdings, Inc.* | | | 5,150 | | | | 597,245 | |
| Copa Holdings S.A. - Class A | | | 2,200 | | | | 273,966 | |
Core-Mark Holding Co., Inc.1 | | | 1,976 | | | | 63,509 | |
| Crocs, Inc.* | | | 11,700 | | | | 113,490 | |
| Culp, Inc. | | | 2,150 | | | | 70,413 | |
| Daktronics, Inc. | | | 10,700 | | | | 113,099 | |
| Dana, Inc. | | | 18,800 | | | | 525,648 | |
| Deckers Outdoor Corp.* | | | 5,600 | | | | 383,096 | |
| Del Frisco's Restaurant Group, Inc.* | | | 4,600 | | | | 66,930 | |
| Del Taco Restaurants, Inc.* | | | 9,400 | | | | 144,196 | |
Delta Apparel, Inc.*1 | | | 6,000 | | | | 129,060 | |
| Denny's Corp.* | | | 5,700 | | | | 70,965 | |
Dillard's, Inc. - Class A1 | | | 2,500 | | | | 140,175 | |
| Dixie Group, Inc.* | | | 7,600 | | | | 30,400 | |
| Dorman Products, Inc.* | | | 1,300 | | | | 93,106 | |
| Douglas Dynamics, Inc. | | | 2,500 | | | | 98,500 | |
| DSW, Inc. - Class A | | | 24,400 | | | | 524,112 | |
Eldorado Resorts, Inc.*1 | | | 10,772 | | | | 276,302 | |
| Essendant, Inc. | | | 12,700 | | | | 167,259 | |
| Express, Inc.* | | | 12,900 | | | | 87,204 | |
| Extended Stay America, Inc. | | | 11,900 | | | | 238,000 | |
| EZCORP, Inc. - Class A* | | | 20,300 | | | | 192,850 | |
| Finish Line, Inc. - Class A | | | 7,100 | | | | 85,413 | |
| FirstCash, Inc. | | | 11,208 | | | | 707,785 | |
| Flexsteel Industries, Inc. | | | 3,072 | | | | 155,750 | |
Fossil Group, Inc.*1 | | | 11,400 | | | | 106,362 | |
| Fox Factory Holding Corp.* | | | 5,800 | | | | 249,980 | |
Fred's, Inc. - Class A1 | | | 18,500 | | | | 119,140 | |
| Full House Resorts, Inc.* | | | 1,105 | | | | 3,083 | |
| G-III Apparel Group Ltd.* | | | 5,700 | | | | 165,414 | |
| Gaia, Inc.* | | | 7,700 | | | | 92,400 | |
| GameStop Corp. - Class A | | | 7,200 | | | | 148,752 | |
| Genesco, Inc.* | | | 7,400 | | | | 196,840 | |
| Gentherm, Inc.* | | | 2,500 | | | | 92,875 | |
| Golden Entertainment, Inc.* | | | 9,000 | | | | 219,420 | |
| Green Brick Partners, Inc.* | | | 7,898 | | | | 78,190 | |
| Group 1 Automotive, Inc. | | | 11,000 | | | | 797,060 | |
| Guess?, Inc. | | | 41,150 | | | | 700,784 | |
See accompanying Notes to Financial Statements.
5
Vericimetry U.S. Small Cap Value Fund
SCHEDULE OF INVESTMENTS (Continued)
As of September 30, 2017
| | | Number
of Shares | | | Value | |
COMMON STOCKS (Continued) | | | | | | |
CONSUMER, CYCLICAL (Continued) | | | | | | |
| Haverty Furniture Cos., Inc. | | | 3,600 | | | $ | 94,140 | |
| Hawaiian Holdings, Inc.* | | | 6,712 | | | | 252,036 | |
| Hibbett Sports, Inc.* | | | 6,300 | | | | 89,775 | |
| HNI Corp. | | | 1,900 | | | | 78,793 | |
| Hooker Furniture Corp. | | | 5,260 | | | | 251,165 | |
| Iconix Brand Group, Inc.* | | | 15,800 | | | | 89,902 | |
| ILG, Inc. | | | 24,500 | | | | 654,885 | |
| Installed Building Products, Inc.* | | | 3,900 | | | | 252,720 | |
| International Speedway Corp. - Class A | | | 4,400 | | | | 158,400 | |
| Jack in the Box, Inc. | | | 1,670 | | | | 170,206 | |
| JetBlue Airways Corp.* | | | 10,370 | | | | 192,156 | |
| Johnson Outdoors, Inc. - Class A | | | 6,700 | | | | 490,976 | |
| KB Home | | | 29,500 | | | | 711,540 | |
| Kewaunee Scientific Corp. | | | 1,300 | | | | 38,350 | |
| Kimball International, Inc. - Class B | | | 9,000 | | | | 177,930 | |
| Kirkland's, Inc.* | | | 5,000 | | | | 57,150 | |
| La Quinta Holdings, Inc.* | | | 14,300 | | | | 250,250 | |
| La-Z-Boy, Inc. | | | 4,330 | | | | 116,477 | |
| Lakeland Industries, Inc.* | | | 5,200 | | | | 73,320 | |
| LCI Industries | | | 4,060 | | | | 470,351 | |
LGI Homes, Inc.*1 | | | 3,800 | | | | 184,566 | |
| Libbey, Inc. | | | 6,600 | | | | 61,116 | |
| Liberty TripAdvisor Holdings, Inc. - Class A* | | | 23,000 | | | | 284,050 | |
| Lifetime Brands, Inc. | | | 8,047 | | | | 147,260 | |
Lumber Liquidators Holdings, Inc.*1 | | | 10,000 | | | | 389,800 | |
| M/I Homes, Inc.* | | | 12,600 | | | | 336,798 | |
| Malibu Boats, Inc. - Class A* | | | 5,400 | | | | 170,856 | |
| Marcus Corp. | | | 9,780 | | | | 270,906 | |
| Marine Products Corp. | | | 18,901 | | | | 303,361 | |
| Marriott Vacations Worldwide Corp. | | | 7,000 | | | | 871,710 | |
| MDC Holdings, Inc. | | | 25,210 | | | | 837,224 | |
| Meritage Homes Corp.* | | | 11,800 | | | | 523,920 | |
| Meritor, Inc.* | | | 19,400 | | | | 504,594 | |
| Miller Industries, Inc. | | | 5,025 | | | | 140,449 | |
| Mobile Mini, Inc. | | | 7,700 | | | | 265,265 | |
| Modine Manufacturing Co.* | | | 25,504 | | | | 490,952 | |
| Monarch Casino & Resort, Inc.* | | | 8,300 | | | | 328,099 | |
| Movado Group, Inc. | | | 6,950 | | | | 194,600 | |
| NACCO Industries, Inc. - Class A | | | 2,891 | | | | 248,048 | |
| Nathan's Famous, Inc.* | | | 800 | | | | 59,160 | |
Navistar International Corp.*1 | | | 15,300 | | | | 674,271 | |
| Office Depot, Inc. | | | 56,600 | | | | 256,964 | |
Oxford Industries, Inc.1 | | | 2,300 | | | | 146,142 | |
| PC Connection, Inc. | | | 13,242 | | | | 373,292 | |
| Penn National Gaming, Inc.* | | | 3,787 | | | | 88,578 | |
| Perry Ellis International, Inc.* | | | 17,100 | | | | 404,586 | |
COMMON STOCKS (Continued) | | | | | | | | |
CONSUMER, CYCLICAL (Continued) | | | | | | | | |
| PICO Holdings, Inc.* | | | 3,200 | | | | 53,440 | |
| Pool Corp. | | | 1,100 | | | | 118,987 | |
| RCI Hospitality Holdings, Inc. | | | 6,300 | | | | 155,925 | |
| Reading International, Inc. - Class A* | | | 15,989 | | | | 251,347 | |
| Red Lion Hotels Corp.* | | | 12,700 | | | | 109,855 | |
| Regis Corp.* | | | 27,146 | | | | 387,373 | |
| Rush Enterprises, Inc. - Class A* | | | 17,337 | | | | 802,530 | |
| Rush Enterprises, Inc. - Class B* | | | 4,880 | | | | 212,866 | |
| ScanSource, Inc.* | | | 9,300 | | | | 405,945 | |
| Scientific Games Corp. - Class A* | | | 13,200 | | | | 605,220 | |
Shoe Carnival, Inc.1 | | | 9,200 | | | | 205,896 | |
| Skechers U.S.A., Inc. - Class A* | | | 3,910 | | | | 98,102 | |
| Skyline Corp.* | | | 3,400 | | | | 41,106 | |
| SkyWest, Inc. | | | 30,980 | | | | 1,360,022 | |
| Sonic Automotive, Inc. - Class A | | | 17,200 | | | | 350,880 | |
| Spartan Motors, Inc. | | | 14,327 | | | | 158,313 | |
| Speedway Motorsports, Inc. | | | 16,619 | | | | 353,985 | |
| Standard Motor Products, Inc. | | | 1,700 | | | | 82,025 | |
| Steelcase, Inc. - Class A | | | 4,280 | | | | 65,912 | |
| Steven Madden Ltd.* | | | 6,900 | | | | 298,770 | |
| Strattec Security Corp. | | | 3,792 | | | | 155,093 | |
| Superior Industries International, Inc. | | | 13,300 | | | | 221,445 | |
| Superior Uniform Group, Inc. | | | 3,554 | | | | 81,387 | |
| Systemax, Inc. | | | 2,300 | | | | 60,789 | |
| Tailored Brands, Inc. | | | 5,300 | | | | 76,532 | |
| Taylor Morrison Home Corp. - Class A* | | | 16,300 | | | | 359,415 | |
| Tilly's, Inc. - Class A | | | 14,990 | | | | 179,730 | |
Titan International, Inc.1 | | | 12,050 | | | | 122,308 | |
| Titan Machinery, Inc.* | | | 7,647 | | | | 118,758 | |
| Toro Co. | | | 3,600 | | | | 223,416 | |
| Tower International, Inc. | | | 6,700 | | | | 182,240 | |
| TravelCenters of America LLC* | | | 14,800 | | | | 62,900 | |
| TRI Pointe Group, Inc.* | | | 9,500 | | | | 131,195 | |
| Triton International Ltd./Bermuda | | | 10,400 | | | | 346,112 | |
Tuesday Morning Corp.*1 | | | 27,500 | | | | 88,000 | |
| Unifi, Inc.* | | | 5,497 | | | | 195,858 | |
| UniFirst Corp. | | | 3,900 | | | | 590,850 | |
| Universal Electronics, Inc.* | | | 1,200 | | | | 76,080 | |
| Urban Outfitters, Inc.* | | | 11,900 | | | | 284,410 | |
| Vail Resorts, Inc. | | | 900 | | | | 205,308 | |
| Vista Outdoor, Inc.* | | | 18,300 | | | | 419,802 | |
| Visteon Corp.* | | | 1,100 | | | | 136,147 | |
| VOXX International Corp.* | | | 6,900 | | | | 58,995 | |
Wabash National Corp.1 | | | 12,700 | | | | 289,814 | |
| Wendy's Co. | | | 34,100 | | | | 529,573 | |
| WESCO International, Inc.* | | | 5,650 | | | | 329,112 | |
William Lyon Homes - Class A*1 | | | 9,100 | | | | 209,209 | |
See accompanying Notes to Financial Statements.
6
Vericimetry U.S. Small Cap Value Fund
SCHEDULE OF INVESTMENTS (Continued)
As of September 30, 2017
| | | Number
of Shares | | | Value | |
COMMON STOCKS (Continued) | | | | | | |
CONSUMER, CYCLICAL (Continued) | | | | | | |
| Winnebago Industries, Inc. | | | 1,000 | | | $ | 44,750 | |
| Wolverine World Wide, Inc. | | | 12,200 | | | | 351,970 | |
| Zumiez, Inc.* | | | 9,300 | | | | 168,330 | |
| | | | | | | | 43,082,141 | |
CONSUMER, NON-CYCLICAL – 12.5% | | | | | | | | |
AAC Holdings, Inc.*1 | | | 4,324 | | | | 42,937 | |
| Aaron's, Inc. | | | 15,700 | | | | 684,991 | |
| ABM Industries, Inc. | | | 7,550 | | | | 314,910 | |
| ACCO Brands Corp.* | | | 54,600 | | | | 649,740 | |
| Acorda Therapeutics, Inc.* | | | 12,500 | | | | 295,625 | |
| Addus HomeCare Corp.* | | | 2,000 | | | | 70,600 | |
| Adtalem Global Education, Inc. | | | 14,100 | | | | 505,485 | |
Agenus, Inc.*1 | | | 14,200 | | | | 62,622 | |
| Alico, Inc. | | | 1,900 | | | | 64,885 | |
| Almost Family, Inc.* | | | 2,100 | | | | 112,770 | |
AMAG Pharmaceuticals, Inc.*1 | | | 10,700 | | | | 197,415 | |
| American Public Education, Inc.* | | | 4,600 | | | | 96,830 | |
| Analogic Corp. | | | 2,100 | | | | 175,875 | |
| Andersons, Inc. | | | 10,400 | | | | 356,200 | |
| AngioDynamics, Inc.* | | | 9,700 | | | | 165,773 | |
| Anika Therapeutics, Inc.* | | | 800 | | | | 46,400 | |
| Aralez Pharmaceuticals, Inc.* | | | 21,700 | | | | 49,693 | |
| ARC Document Solutions, Inc.* | | | 10,800 | | | | 44,172 | |
Array BioPharma, Inc.*1 | | | 6,800 | | | | 83,640 | |
Arrowhead Pharmaceuticals, Inc.*1 | | | 27,700 | | | | 119,941 | |
| Ascent Capital Group, Inc. - Class A* | | | 7,100 | | | | 92,584 | |
| Assembly Biosciences, Inc.* | | | 5,023 | | | | 175,403 | |
| Barrett Business Services, Inc. | | | 1,700 | | | | 96,101 | |
| Bovie Medical Corp.* | | | 14,700 | | | | 49,686 | |
| Brookdale Senior Living, Inc.* | | | 17,400 | | | | 184,440 | |
| CAI International, Inc.* | | | 13,500 | | | | 409,320 | |
| Cambium Learning Group, Inc.* | | | 7,000 | | | | 46,410 | |
| Career Education Corp.* | | | 15,506 | | | | 161,107 | |
| Carriage Services, Inc. | | | 4,900 | | | | 125,440 | |
| CBIZ, Inc.* | | | 14,300 | | | | 232,375 | |
| Celldex Therapeutics, Inc.* | | | 35,800 | | | | 102,388 | |
| Central Garden & Pet Co. - Class A* | | | 31,370 | | | | 1,166,650 | |
| Chemed Corp. | | | 1,000 | | | | 202,050 | |
| Chiasma, Inc.* | | | 18,400 | | | | 46,920 | |
| Chimerix, Inc.* | | | 10,500 | | | | 55,125 | |
| Civeo Corp.* | | | 58,400 | | | | 166,440 | |
Community Health Systems, Inc.*1 | | | 18,500 | | | | 142,080 | |
| CONMED Corp. | | | 10,700 | | | | 561,429 | |
| CorVel Corp.* | | | 3,300 | | | | 179,520 | |
| CRA International, Inc. | | | 5,800 | | | | 238,090 | |
| Cross Country Healthcare, Inc.* | | | 2,800 | | | | 39,844 | |
COMMON STOCKS (Continued) | | | | | | | | |
CONSUMER, NON-CYCLICAL (Continued) | | | | | |
| CSS Industries, Inc. | | | 7,200 | | | | 207,504 | |
| Cutera, Inc.* | | | 4,300 | | | | 177,805 | |
| Darling Ingredients, Inc.* | | | 53,300 | | | | 933,816 | |
| Dimension Therapeutics, Inc.* | | | 15,948 | | | | 95,688 | |
| Diplomat Pharmacy, Inc.* | | | 15,200 | | | | 314,792 | |
| Dynavax Technologies Corp.* | | | 15,300 | | | | 328,950 | |
| Enanta Pharmaceuticals, Inc.* | | | 4,400 | | | | 205,920 | |
| Endo International PLC* | | | 29,800 | | | | 255,237 | |
| Ennis, Inc. | | | 12,100 | | | | 237,765 | |
Ensign Group, Inc.1 | | | 5,340 | | | | 120,631 | |
Entellus Medical, Inc.*1 | | | 5,100 | | | | 94,146 | |
| Epizyme, Inc.* | | | 3,300 | | | | 62,865 | |
Esperion Therapeutics, Inc.*1 | | | 4,400 | | | | 220,528 | |
| Everi Holdings, Inc.* | | | 17,000 | | | | 129,030 | |
| Exactech, Inc.* | | | 4,900 | | | | 161,455 | |
| Exelixis, Inc.* | | | 12,350 | | | | 299,241 | |
| FONAR Corp.* | | | 1,900 | | | | 57,950 | |
| Franklin Covey Co.* | | | 3,700 | | | | 75,110 | |
| Fresh Del Monte Produce, Inc. | | | 25,000 | | | | 1,136,500 | |
| FTI Consulting, Inc.* | | | 12,200 | | | | 432,856 | |
| Grand Canyon Education, Inc.* | | | 2,700 | | | | 245,214 | |
| Great Lakes Dredge & Dock Corp.* | | | 43,100 | | | | 209,035 | |
| Green Dot Corp. - Class A* | | | 14,100 | | | | 699,078 | |
| Halyard Health, Inc.* | | | 1,900 | | | | 85,557 | |
| Harvard Bioscience, Inc.* | | | 13,900 | | | | 52,125 | |
| HealthEquity, Inc.* | | | 1,600 | | | | 80,928 | |
| Heidrick & Struggles International, Inc. | | | 6,600 | | | | 139,590 | |
Hertz Global Holdings, Inc.*1 | | | 34,900 | | | | 780,364 | |
| Huron Consulting Group, Inc.* | | | 1,800 | | | | 61,740 | |
| ICF International, Inc.* | | | 8,798 | | | | 474,652 | |
| ICU Medical, Inc.* | | | 1,600 | | | | 297,360 | |
| Ignyta, Inc.* | | | 9,400 | | | | 116,090 | |
| Immunomedics, Inc.* | | | 11,400 | | | | 159,372 | |
| Impax Laboratories, Inc.* | | | 21,200 | | | | 430,360 | |
| Ingles Markets, Inc. - Class A | | | 6,450 | | | | 165,765 | |
Innoviva, Inc.*1 | | | 12,300 | | | | 173,676 | |
| Inogen, Inc.* | | | 1,400 | | | | 133,140 | |
Inotek Pharmaceuticals Corp.*1 | | | 39,800 | | | | 70,844 | |
| Insmed, Inc.* | | | 1,900 | | | | 59,299 | |
| Insperity, Inc. | | | 2,950 | | | | 259,600 | |
| Integer Holdings Corp.* | | | 11,560 | | | | 591,294 | |
| Inter Parfums, Inc. | | | 2,800 | | | | 115,500 | |
Invacare Corp.1 | | | 11,200 | | | | 176,400 | |
| John B Sanfilippo & Son, Inc. | | | 3,168 | | | | 213,238 | |
| Juno Therapeutics, Inc.* | | | 4,200 | | | | 188,412 | |
| K12, Inc.* | | | 16,250 | | | | 289,900 | |
| Karyopharm Therapeutics, Inc.* | | | 5,300 | | | | 58,194 | |
See accompanying Notes to Financial Statements.
7
Vericimetry U.S. Small Cap Value Fund
SCHEDULE OF INVESTMENTS (Continued)
As of September 30, 2017
| | | Number
of Shares | | | Value | |
COMMON STOCKS (Continued) | | | | | | |
CONSUMER, NON-CYCLICAL (Continued) | | | | |
| Kelly Services, Inc. - Class A | | | 10,000 | | | $ | 250,900 | |
| Korn/Ferry International | | | 9,020 | | | | 355,659 | |
| Landauer, Inc. | | | 1,300 | | | | 87,490 | |
| Lantheus Holdings, Inc.* | | | 7,200 | | | | 128,160 | |
LendingTree, Inc.*1 | | | 1,900 | | | | 464,455 | |
| LHC Group, Inc.* | | | 6,600 | | | | 468,072 | |
| LifePoint Health, Inc.* | | | 9,400 | | | | 544,260 | |
| LSC Communications, Inc. | | | 1,637 | | | | 27,027 | |
| MacroGenics, Inc.* | | | 3,000 | | | | 55,440 | |
| Magellan Health, Inc.* | | | 10,100 | | | | 871,630 | |
| Matthews International Corp. - Class A | | | 2,130 | | | | 132,593 | |
| McGrath RentCorp | | | 8,035 | | | | 351,531 | |
| Merit Medical Systems, Inc.* | | | 11,500 | | | | 487,025 | |
Merrimack Pharmaceuticals, Inc.1 | | | 5,000 | | | | 72,700 | |
MGP Ingredients, Inc.1 | | | 3,446 | | | | 208,931 | |
| Molina Healthcare, Inc.* | | | 5,500 | | | | 378,180 | |
| Momenta Pharmaceuticals, Inc.* | | | 9,700 | | | | 179,450 | |
| MoneyGram International, Inc.* | | | 15,900 | | | | 256,149 | |
| Myriad Genetics, Inc.* | | | 25,400 | | | | 918,972 | |
| National HealthCare Corp. | | | 2,800 | | | | 175,196 | |
| Natural Alternatives International, Inc.* | | | 5,100 | | | | 54,315 | |
| Nature's Sunshine Products, Inc. | | | 4,800 | | | | 48,720 | |
| Navigant Consulting, Inc.* | | | 13,900 | | | | 235,188 | |
| Neff Corp. - Class A* | | | 5,300 | | | | 132,500 | |
Omega Protein Corp.1 | | | 12,317 | | | | 205,078 | |
| On Assignment, Inc.* | | | 1,000 | | | | 53,680 | |
| OraSure Technologies, Inc.* | | | 8,200 | | | | 184,500 | |
| Pacific Biosciences of California, Inc.* | | | 10,500 | | | | 55,125 | |
| PDL BioPharma, Inc.* | | | 72,300 | | | | 245,097 | |
| PharMerica Corp.* | | | 13,600 | | | | 398,480 | |
Post Holdings, Inc.*1 | | | 3,850 | | | | 339,839 | |
| Prestige Brands Holdings, Inc.* | | | 2,510 | | | | 125,726 | |
Prothena Corp. PLC*1 | | | 900 | | | | 58,293 | |
| PTC Therapeutics, Inc.* | | | 5,800 | | | | 116,058 | |
| Quad/Graphics, Inc. | | | 12,725 | | | | 287,712 | |
| Quorum Health Corp.* | | | 15,700 | | | | 81,326 | |
| RadNet, Inc.* | | | 22,069 | | | | 254,897 | |
| REGENXBIO, Inc.* | | | 3,200 | | | | 105,440 | |
| RPX Corp.* | | | 35,200 | | | | 467,456 | |
| RTI Surgical, Inc.* | | | 14,800 | | | | 67,340 | |
| Sanderson Farms, Inc. | | | 4,450 | | | | 718,764 | |
| SciClone Pharmaceuticals, Inc.* | | | 13,532 | | | | 151,558 | |
| Seaboard Corp. | | | 64 | | | | 288,320 | |
| SEACOR Marine Holdings, Inc.* | | | 10,912 | | | | 170,664 | |
| Select Medical Holdings Corp.* | | | 48,949 | | | | 939,821 | |
| Seneca Foods Corp. - Class A* | | | 3,700 | | | | 127,650 | |
| Smart & Final Stores, Inc.* | | | 6,400 | | | | 50,240 | |
COMMON STOCKS (Continued) | | | | | | | | |
CONSUMER, NON-CYCLICAL (Continued) | | | | | |
| Snyder's-Lance, Inc. | | | 7,700 | | | | 293,678 | |
| Sotheby's* | | | 3,300 | | | | 152,163 | |
| SP Plus Corp.* | | | 2,400 | | | | 94,800 | |
| SpartanNash Co. | | | 20,600 | | | | 543,222 | |
| Spectrum Pharmaceuticals, Inc.* | | | 24,500 | | | | 344,715 | |
| Strayer Education, Inc. | | | 850 | | | | 74,180 | |
T2 Biosystems, Inc.*1 | | | 13,800 | | | | 57,960 | |
Textainer Group Holdings Ltd.*1 | | | 11,600 | | | | 198,940 | |
Tivity Health, Inc.*1 | | | 10,000 | | | | 408,000 | |
| Trevena, Inc.* | | | 10,800 | | | | 27,540 | |
| TriNet Group, Inc.* | | | 8,000 | | | | 268,960 | |
| Triple-S Management Corp. - Class B* | | | 10,500 | | | | 248,640 | |
| United Natural Foods, Inc.* | | | 15,400 | | | | 640,486 | |
| Universal Corp. | | | 4,010 | | | | 229,773 | |
| Vectrus, Inc.* | | | 1,500 | | | | 46,260 | |
| Viad Corp. | | | 7,500 | | | | 456,750 | |
| Vital Therapies, Inc.* | | | 16,100 | | | | 81,305 | |
| Voyager Therapeutics, Inc.* | | | 6,800 | | | | 140,012 | |
Weight Watchers International, Inc.*1 | | | 5,200 | | | | 226,460 | |
| Weis Markets, Inc. | | | 4,652 | | | | 202,362 | |
| WellCare Health Plans, Inc.* | | | 600 | | | | 103,044 | |
| Willdan Group, Inc.* | | | 1,600 | | | | 51,936 | |
| | | | | | | | 37,757,215 | |
ENERGY – 6.7% | | | | | | | | |
| Adams Resources & Energy, Inc. | | | 2,975 | | | | 123,462 | |
| Andeavor | | | 4,002 | | | | 412,806 | |
| Archrock, Inc. | | | 48,500 | | | | 608,675 | |
Atwood Oceanics, Inc.*1 | | | 46,600 | | | | 437,574 | |
| Bill Barrett Corp.* | | | 47,900 | | | | 205,491 | |
Bristow Group, Inc.1 | | | 22,300 | | | | 208,505 | |
California Resources Corp.*1 | | | 14,200 | | | | 148,532 | |
| Callon Petroleum Co.* | | | 34,900 | | | | 392,276 | |
CARBO Ceramics, Inc.*1 | | | 7,400 | | | | 63,862 | |
| Clean Energy Fuels Corp.* | | | 26,500 | | | | 65,720 | |
| CONSOL Energy, Inc.* | | | 6,600 | | | | 111,804 | |
| Delek U.S. Holdings, Inc. | | | 44,838 | | | | 1,198,520 | |
| Denbury Resources, Inc.* | | | 75,200 | | | | 100,768 | |
Diamond Offshore Drilling, Inc.*1 | | | 18,500 | | | | 268,250 | |
| Dril-Quip, Inc.* | | | 2,100 | | | | 92,715 | |
| Eclipse Resources Corp.* | | | 17,100 | | | | 42,750 | |
Ensco PLC - Class A1 | | | 61,300 | | | | 365,961 | |
| Era Group, Inc.* | | | 12,100 | | | | 135,399 | |
| Exterran Corp.* | | | 8,900 | | | | 281,329 | |
| First Solar, Inc.* | | | 3,900 | | | | 178,932 | |
| Forum Energy Technologies, Inc.* | | | 18,507 | | | | 294,261 | |
FuelCell Energy, Inc.*1 | | | 21,200 | | | | 37,100 | |
| FutureFuel Corp. | | | 10,400 | | | | 163,696 | |
See accompanying Notes to Financial Statements.
8
Vericimetry U.S. Small Cap Value Fund
SCHEDULE OF INVESTMENTS (Continued)
As of September 30, 2017
| | | Number
of Shares | | | Value | |
COMMON STOCKS (Continued) | | | | | | |
ENERGY (Continued) | | | | | | |
| Geospace Technologies Corp.* | | | 4,300 | | | $ | 76,626 | |
| Green Plains, Inc. | | | 19,700 | | | | 396,955 | |
Gulf Island Fabrication, Inc.1 | | | 5,500 | | | | 69,850 | |
| Hallador Energy Co. | | | 5,300 | | | | 30,316 | |
| Helix Energy Solutions Group, Inc.* | | | 35,700 | | | | 263,823 | |
| Jones Energy, Inc. - Class A* | | | 23,700 | | | | 45,504 | |
Matador Resources Co.*1 | | | 15,900 | | | | 431,685 | |
| Matrix Service Co.* | | | 14,300 | | | | 217,360 | |
| McDermott International, Inc.* | | | 125,140 | | | | 909,768 | |
| MRC Global, Inc.* | | | 24,400 | | | | 426,756 | |
| Murphy USA, Inc.* | | | 2,300 | | | | 158,700 | |
| Nabors Industries Ltd. | | | 39,000 | | | | 314,730 | |
| Natural Gas Services Group, Inc.* | | | 10,341 | | | | 293,684 | |
| Newpark Resources, Inc.* | | | 32,400 | | | | 324,000 | |
Noble Corp. plc*1 | | | 73,400 | | | | 337,640 | |
| Noble Energy, Inc. | | | 9,210 | | | | 261,196 | |
| Oasis Petroleum, Inc.* | | | 73,100 | | | | 666,672 | |
| Oceaneering International, Inc. | | | 9,800 | | | | 257,446 | |
| Oil States International, Inc.* | | | 7,500 | | | | 190,125 | |
| Pacific Ethanol, Inc.* | | | 20,700 | | | | 114,885 | |
| Parsley Energy, Inc. - Class A* | | | 4,000 | | | | 105,360 | |
| Patterson-UTI Energy, Inc. | | | 35,500 | | | | 743,370 | |
PBF Energy, Inc. - Class A1 | | | 35,700 | | | | 985,677 | |
| PDC Energy, Inc.* | | | 15,900 | | | | 779,577 | |
| Pioneer Energy Services Corp.* | | | 45,800 | | | | 116,790 | |
Plug Power, Inc.*1 | | | 27,100 | | | | 70,731 | |
Renewable Energy Group, Inc.*1 | | | 18,400 | | | | 223,560 | |
REX American Resources Corp.*1 | | | 5,218 | | | | 489,605 | |
| Rice Energy, Inc.* | | | 5,000 | | | | 144,700 | |
| Ring Energy, Inc.* | | | 9,300 | | | | 134,757 | |
| Rowan Cos. Plc - Class A* | | | 42,800 | | | | 549,980 | |
RPC, Inc.1 | | | 20,900 | | | | 518,111 | |
| RSP Permian, Inc.* | | | 14,550 | | | | 503,284 | |
| SEACOR Holdings, Inc.* | | | 9,354 | | | | 431,313 | |
SemGroup Corp. - Class A1 | | | 12,800 | | | | 368,000 | |
Stone Energy Corp.*1 | | | 5,500 | | | | 159,830 | |
| SunCoke Energy, Inc.* | | | 34,600 | | | | 316,244 | |
| Superior Energy Services, Inc.* | | | 13,600 | | | | 145,248 | |
| TETRA Technologies, Inc.* | | | 44,800 | | | | 128,128 | |
| Transocean Ltd.* | | | 39,800 | | | | 428,248 | |
| Unit Corp.* | | | 23,000 | | | | 473,340 | |
| W&T Offshore, Inc.* | | | 19,900 | | | | 60,695 | |
| Willbros Group, Inc.* | | | 23,807 | | | | 76,659 | |
| WPX Energy, Inc.* | | | 38,050 | | | | 437,575 | |
| | | | | | | | 20,116,891 | |
COMMON STOCKS (Continued) | | | | | | | | |
FINANCIAL – 27.0% | | | | | | | | |
| 1st Source Corp. | | | 10,812 | | | | 549,250 | |
| Access National Corp. | | | 1,702 | | | | 48,779 | |
| ACNB Corp. | | | 2,100 | | | | 58,170 | |
| Air Lease Corp. | | | 12,700 | | | | 541,274 | |
| Aircastle Ltd. | | | 19,560 | | | | 435,992 | |
| Alexander & Baldwin, Inc. | | | 3,900 | | | | 180,687 | |
| Allegiance Bancshares, Inc.* | | | 800 | | | | 29,440 | |
| Ambac Financial Group, Inc.* | | | 11,800 | | | | 203,668 | |
| American Equity Investment Life Holding Co. | | | 44,890 | | | | 1,305,401 | |
| American National Bankshares, Inc. | | | 1,366 | | | | 56,279 | |
| American National Insurance Co. | | | 1,900 | | | | 224,352 | |
| American River Bankshares | | | 1,300 | | | | 18,239 | |
Ameris Bancorp1 | | | 6,300 | | | | 302,400 | |
| AMERISAFE, Inc. | | | 6,688 | | | | 389,242 | |
| AmeriServ Financial, Inc. | | | 6,700 | | | | 26,800 | |
| Ames National Corp. | | | 500 | | | | 14,925 | |
| Argo Group International Holdings Ltd. | | | 8,794 | | | | 540,831 | |
| Arrow Financial Corp. | | | 1,435 | | | | 49,292 | |
| Artisan Partners Asset Management, Inc. - Class A | | | 6,700 | | | | 218,420 | |
| Aspen Insurance Holdings Ltd. | | | 5,060 | | | | 204,424 | |
| Associated Banc-Corp | | | 9,400 | | | | 227,950 | |
| Astoria Financial Corp. | | | 37,700 | | | | 810,550 | |
| Atlantic Coast Financial Corp.* | | | 3,000 | | | | 26,430 | |
| Atlas Financial Holdings, Inc.* | | | 2,500 | | | | 47,250 | |
| Baldwin & Lyons, Inc. - Class B | | | 7,000 | | | | 157,850 | |
| BancFirst Corp. | | | 2,384 | | | | 135,292 | |
| Bancorp, Inc.* | | | 18,300 | | | | 151,341 | |
| BancorpSouth, Inc. | | | 14,500 | | | | 464,725 | |
| Bank Mutual Corp. | | | 11,501 | | | | 116,735 | |
| Bank of Commerce Holdings | | | 5,400 | | | | 62,100 | |
| Bank of Hawaii Corp. | | | 1,700 | | | | 141,712 | |
| Bank of Marin Bancorp | | | 1,055 | | | | 72,267 | |
| BankFinancial Corp. | | | 9,450 | | | | 150,160 | |
| Bankwell Financial Group, Inc. | | | 1,600 | | | | 59,104 | |
| Banner Corp. | | | 3,110 | | | | 190,581 | |
| Bar Harbor Bankshares | | | 5,854 | | | | 183,581 | |
Bear State Financial, Inc.1 | | | 4,900 | | | | 50,274 | |
| Beneficial Bancorp, Inc. | | | 8,600 | | | | 142,760 | |
| Berkshire Hills Bancorp, Inc. | | | 9,036 | | | | 350,145 | |
| BOK Financial Corp. | | | 4,200 | | | | 374,136 | |
| Boston Private Financial Holdings, Inc. | | | 11,900 | | | | 196,945 | |
| Bridge Bancorp, Inc. | | | 2,300 | | | | 78,085 | |
| Brookline Bancorp, Inc. | | | 25,600 | | | | 396,800 | |
| Bryn Mawr Bank Corp. | | | 477 | | | | 20,893 | |
| C&F Financial Corp. | | | 500 | | | | 27,500 | |
See accompanying Notes to Financial Statements.
9
Vericimetry U.S. Small Cap Value Fund
SCHEDULE OF INVESTMENTS (Continued)
As of September 30, 2017
| | | Number
of Shares | | | Value | |
COMMON STOCKS (Continued) | | | | | | |
FINANCIAL (Continued) | | | | | | |
| Camden National Corp. | | | 4,271 | | | $ | 186,386 | |
| Canadian Imperial Bank of Commerce | | | 6,492 | | | | 568,180 | |
| Capital Bank Financial Corp. - Class A | | | 6,722 | | | | 275,938 | |
| Capital City Bank Group, Inc. | | | 3,545 | | | | 85,115 | |
| Capitol Federal Financial, Inc. | | | 29,900 | | | | 439,530 | |
| Carolina Financial Corp. | | | 3,600 | | | | 129,168 | |
| Cass Information Systems, Inc. | | | 1,400 | | | | 88,816 | |
| Cathay General Bancorp | | | 18,000 | | | | 723,600 | |
| CenterState Bank Corp. | | | 8,200 | | | | 219,760 | |
| Central Pacific Financial Corp. | | | 3,000 | | | | 96,540 | |
| Central Valley Community Bancorp | | | 7,760 | | | | 173,048 | |
| Century Bancorp, Inc. - Class A | | | 815 | | | | 65,282 | |
| Charter Financial Corp. | | | 2,700 | | | | 50,031 | |
| Chemical Financial Corp. | | | 11,490 | | | | 600,467 | |
| Citizens & Northern Corp. | | | 700 | | | | 17,192 | |
City Holding Co.1 | | | 3,499 | | | | 251,613 | |
| Civista Bancshares, Inc. | | | 5,240 | | | | 117,062 | |
| Clifton Bancorp, Inc. | | | 6,400 | | | | 107,008 | |
| CNB Financial Corp. | | | 4,430 | | | | 121,028 | |
| CNO Financial Group, Inc. | | | 54,580 | | | | 1,273,897 | |
| CoBiz Financial, Inc. | | | 4,300 | | | | 84,452 | |
| Codorus Valley Bancorp, Inc. | | | 1,118 | | | | 34,334 | |
| Colony Bankcorp, Inc. | | | 3,800 | | | | 50,920 | |
| Columbia Banking System, Inc. | | | 13,600 | | | | 572,696 | |
| Community Bank System, Inc. | | | 4,872 | | | | 269,178 | |
Community Bankers Trust Corp.*1 | | | 3,286 | | | | 30,231 | |
Community Financial Corp.1 | | | 900 | | | | 31,833 | |
| Community Trust Bancorp, Inc. | | | 680 | | | | 31,620 | |
| ConnectOne Bancorp, Inc. | | | 3,800 | | | | 93,480 | |
| Consumer Portfolio Services, Inc.* | | | 14,700 | | | | 67,032 | |
| County Bancorp, Inc. | | | 1,800 | | | | 54,090 | |
| Cowen, Inc.* | | | 6,650 | | | | 118,370 | |
| Crawford & Co. - Class B | | | 8,300 | | | | 99,268 | |
| CU Bancorp* | | | 2,352 | | | | 91,199 | |
| Customers Bancorp, Inc.* | | | 6,050 | | | | 197,351 | |
| CVB Financial Corp. | | | 16,200 | | | | 391,554 | |
| Dime Community Bancshares, Inc. | | | 4,900 | | | | 105,350 | |
| Donegal Group, Inc. - Class A | | | 5,031 | | | | 81,150 | |
| Eagle Bancorp, Inc.* | | | 2,137 | | | | 143,286 | |
| eHealth, Inc.* | | | 4,650 | | | | 111,088 | |
| EMC Insurance Group, Inc. | | | 7,749 | | | | 218,134 | |
| Employers Holdings, Inc. | | | 18,200 | | | | 827,190 | |
Encore Capital Group, Inc.*1 | | | 6,800 | | | | 301,240 | |
| Enova International, Inc.* | | | 10,200 | | | | 137,190 | |
| Enstar Group Ltd.* | | | 2,500 | | | | 555,875 | |
| Enterprise Bancorp, Inc. | | | 4,500 | | | | 163,395 | |
| Enterprise Financial Services Corp. | | | 3,100 | | | | 131,285 | |
COMMON STOCKS (Continued) | | | | | | | | |
FINANCIAL (Continued) | | | | | | | | |
| ESSA Bancorp, Inc. | | | 11,128 | | | | 174,710 | |
| Evans Bancorp, Inc. | | | 2,900 | | | | 125,280 | |
| Farmers Capital Bank Corp. | | | 2,000 | | | | 84,100 | |
Farmers National Banc Corp.1 | | | 5,600 | | | | 84,280 | |
| FBL Financial Group, Inc. - Class A | | | 14,400 | | | | 1,072,800 | |
| Federal Agricultural Mortgage Corp. - Class C | | | 7,808 | | | | 567,954 | |
Fidelity & Guaranty Life1 | | | 3,310 | | | | 102,775 | |
| Fidelity Southern Corp. | | | 9,107 | | | | 215,289 | |
| Financial Institutions, Inc. | | | 3,930 | | | | 113,184 | |
| First American Financial Corp. | | | 7,460 | | | | 372,776 | |
| First Bancorp, Inc. | | | 3,070 | | | | 93,052 | |
| First BanCorp/Puerto Rico* | | | 48,800 | | | | 249,856 | |
| First Bancorp/Southern Pines NC | | | 5,900 | | | | 203,019 | |
First Bancshares, Inc.1 | | | 1,086 | | | | 32,743 | |
| First Bank/Hamilton NJ | | | 1,300 | | | | 17,290 | |
| First Busey Corp. | | | 14,229 | | | | 446,221 | |
| First Business Financial Services, Inc. | | | 1,212 | | | | 27,573 | |
| First Citizens BancShares, Inc. - Class A | | | 1,100 | | | | 411,279 | |
| First Commonwealth Financial Corp. | | | 33,960 | | | | 479,855 | |
| First Community Bancshares, Inc. | | | 3,700 | | | | 107,707 | |
| First Defiance Financial Corp. | | | 7,850 | | | | 412,046 | |
| First Financial Bancorp | | | 12,900 | | | | 337,335 | |
First Financial Bankshares, Inc.1 | | | 5,900 | | | | 266,680 | |
| First Financial Corp. | | | 3,081 | | | | 146,656 | |
| First Financial Northwest, Inc. | | | 5,400 | | | | 91,746 | |
| First Horizon National Corp. | | | 13,000 | | | | 248,950 | |
| First Internet Bancorp | | | 1,900 | | | | 61,370 | |
| First Interstate BancSystem, Inc. - Class A | | | 7,926 | | | | 303,169 | |
| First Merchants Corp. | | | 12,605 | | | | 541,133 | |
| First Mid-Illinois Bancshares, Inc. | | | 1,732 | | | | 66,509 | |
| First Midwest Bancorp, Inc. | | | 28,600 | | | | 669,812 | |
| First of Long Island Corp. | | | 5,025 | | | | 153,011 | |
| First United Corp.* | | | 6,300 | | | | 103,950 | |
| Flagstar Bancorp, Inc.* | | | 4,200 | | | | 149,016 | |
| Flushing Financial Corp. | | | 8,900 | | | | 264,508 | |
| FNB Corp. | | | 43,652 | | | | 612,438 | |
| FNFV Group* | | | 17,400 | | | | 298,410 | |
| Forestar Group, Inc.* | | | 8,300 | | | | 142,760 | |
| Franklin Financial Network, Inc.* | | | 2,100 | | | | 74,865 | |
| Fulton Financial Corp. | | | 56,400 | | | | 1,057,500 | |
| GAIN Capital Holdings, Inc. | | | 5,200 | | | | 33,228 | |
| Genworth Financial, Inc. - Class A* | | | 34,500 | | | | 132,825 | |
| German American Bancorp, Inc. | | | 6,387 | | | | 242,898 | |
Glacier Bancorp, Inc.1 | | | 13,400 | | | | 505,984 | |
| Global Indemnity Ltd.* | | | 2,000 | | | | 84,800 | |
| Great Southern Bancorp, Inc. | | | 2,415 | | | | 134,395 | |
See accompanying Notes to Financial Statements.
10
Vericimetry U.S. Small Cap Value Fund
SCHEDULE OF INVESTMENTS (Continued)
As of September 30, 2017
| | | Number
of Shares | | | Value | |
COMMON STOCKS (Continued) | | | | | | |
FINANCIAL (Continued) | | | | | | |
| Great Western Bancorp, Inc. | | | 4,960 | | | $ | 204,749 | |
| Green Bancorp, Inc.* | | | 12,500 | | | | 295,625 | |
| Greenlight Capital Re Ltd. - Class A* | | | 6,900 | | | | 149,385 | |
| Guaranty Bancorp | | | 3,000 | | | | 83,400 | |
| Guaranty Federal Bancshares, Inc. | | | 965 | | | | 20,661 | |
| Hallmark Financial Services, Inc.* | | | 12,699 | | | | 147,435 | |
| Hancock Holding Co. | | | 22,700 | | | | 1,099,815 | |
| Hanmi Financial Corp. | | | 6,200 | | | | 191,890 | |
| Hanover Insurance Group, Inc. | | | 6,900 | | | | 668,817 | |
HCI Group, Inc.1 | | | 4,200 | | | | 160,650 | |
| Heartland Financial USA, Inc. | | | 3,500 | | | | 172,900 | |
| Heritage Commerce Corp. | | | 7,540 | | | | 107,294 | |
| Heritage Financial Corp. | | | 7,070 | | | | 208,565 | |
Heritage Insurance Holdings, Inc.1 | | | 7,400 | | | | 97,754 | |
| HFF, Inc. - Class A | | | 7,200 | | | | 284,832 | |
| Hilltop Holdings, Inc. | | | 18,147 | | | | 471,822 | |
| HMN Financial, Inc.* | | | 1,020 | | | | 18,207 | |
| Home Bancorp, Inc. | | | 3,920 | | | | 163,934 | |
| HomeStreet, Inc.* | | | 4,200 | | | | 113,400 | |
| Hope Bancorp, Inc. | | | 12,217 | | | | 216,363 | |
| Horace Mann Educators Corp. | | | 15,900 | | | | 625,665 | |
| Horizon Bancorp | | | 4,561 | | | | 133,044 | |
| Huntington Bancshares, Inc. | | | 19,336 | | | | 269,931 | |
| IBERIABANK Corp. | | | 9,971 | | | | 819,118 | |
| Independence Holding Co. | | | 6,550 | | | | 165,387 | |
| Independent Bank Corp. | | | 4,889 | | | | 110,736 | |
| Independent Bank Corp./Rockland MA | | | 7,400 | | | | 552,410 | |
| Independent Bank Group, Inc. | | | 3,300 | | | | 198,990 | |
| Infinity Property & Casualty Corp. | | | 6,740 | | | | 634,908 | |
| International Bancshares Corp. | | | 17,700 | | | | 709,770 | |
| INTL. FCStone, Inc.* | | | 3,445 | | | | 132,012 | |
| Investment Technology Group, Inc. | | | 6,775 | | | | 149,998 | |
| Investors Title Co. | | | 1,000 | | | | 179,070 | |
| Janus Henderson Group PLC | | | 15,478 | | | | 539,254 | |
| Kearny Financial Corp. | | | 14,800 | | | | 227,180 | |
| Kemper Corp. | | | 22,330 | | | | 1,183,490 | |
| Lakeland Bancorp, Inc. | | | 13,435 | | | | 274,074 | |
| Lakeland Financial Corp. | | | 6,050 | | | | 294,756 | |
| Legg Mason, Inc. | | | 7,200 | | | | 283,032 | |
| LPL Financial Holdings, Inc. | | | 6,200 | | | | 319,734 | |
| Macatawa Bank Corp. | | | 4,200 | | | | 43,092 | |
| Maiden Holdings Ltd. | | | 37,040 | | | | 294,468 | |
| MainSource Financial Group, Inc. | | | 8,082 | | | | 289,821 | |
Malvern Bancorp, Inc.*1 | | | 2,546 | | | | 68,106 | |
| Marlin Business Services Corp. | | | 7,400 | | | | 212,750 | |
| MB Financial, Inc. | | | 12,543 | | | | 564,686 | |
| MBIA, Inc.* | | | 18,300 | | | | 159,210 | |
COMMON STOCKS (Continued) | | | | | | | | |
FINANCIAL (Continued) | | | | | | | | |
| MBT Financial Corp. | | | 7,000 | | | | 76,650 | |
| Mercantile Bank Corp. | | | 4,830 | | | | 168,567 | |
| Mercury General Corp. | | | 14,100 | | | | 799,329 | |
| Meridian Bancorp, Inc. | | | 6,700 | | | | 124,955 | |
| Meta Financial Group, Inc. | | | 2,600 | | | | 203,840 | |
| MGIC Investment Corp.* | | | 59,400 | | | | 744,282 | |
| MidWestOne Financial Group, Inc. | | | 2,100 | | | | 70,896 | |
| MutualFirst Financial, Inc. | | | 2,626 | | | | 100,970 | |
National Bankshares, Inc.1 | | | 1,700 | | | | 76,415 | |
| National Commerce Corp.* | | | 2,600 | | | | 111,280 | |
| National Western Life Group, Inc. - Class A | | | 1,900 | | | | 663,100 | |
| Nationstar Mortgage Holdings, Inc.* | | | 8,200 | | | | 152,274 | |
| Navigators Group, Inc. | | | 19,666 | | | | 1,147,511 | |
| NBT Bancorp, Inc. | | | 5,400 | | | | 198,288 | |
| Nelnet, Inc. - Class A | | | 6,700 | | | | 338,350 | |
| NewStar Financial, Inc. | | | 8,200 | | | | 96,268 | |
| Nicolet Bankshares, Inc.* | | | 2,265 | | | | 130,305 | |
| NMI Holdings, Inc. - Class A* | | | 29,500 | | | | 365,800 | |
| Northeast Bancorp | | | 2,410 | | | | 63,022 | |
| Northrim BanCorp, Inc. | | | 2,520 | | | | 88,074 | |
| Northwest Bancshares, Inc. | | | 20,108 | | | | 347,265 | |
| OceanFirst Financial Corp. | | | 14,809 | | | | 407,099 | |
OFG Bancorp1 | | | 17,700 | | | | 161,955 | |
| Old Line Bancshares, Inc. | | | 1,300 | | | | 36,400 | |
| Old National Bancorp | | | 33,566 | | | | 614,258 | |
Old Point Financial Corp.1 | | | 861 | | | | 27,896 | |
| Old Second Bancorp, Inc. | | | 14,600 | | | | 196,370 | |
| Opus Bank | | | 2,400 | | | | 57,600 | |
| Oritani Financial Corp. | | | 8,152 | | | | 136,954 | |
| Orrstown Financial Services, Inc. | | | 2,733 | | | | 68,052 | |
| Pacific Premier Bancorp, Inc.* | | | 5,778 | | | | 218,119 | |
| Park National Corp. | | | 2,100 | | | | 226,779 | |
| Park Sterling Corp. | | | 22,389 | | | | 278,071 | |
| Parke Bancorp, Inc. | | | 2,904 | | | | 64,469 | |
| Pathfinder Bancorp, Inc. | | | 1,600 | | | | 24,272 | |
| Peapack Gladstone Financial Corp. | | | 5,295 | | | | 178,653 | |
| Penns Woods Bancorp, Inc. | | | 1,000 | | | | 46,470 | |
| Peoples Bancorp, Inc. | | | 1,800 | | | | 60,462 | |
| PHH Corp.* | | | 10,300 | | | | 143,479 | |
| Pinnacle Financial Partners, Inc. | | | 13,823 | | | | 925,450 | |
| Piper Jaffray Cos. | | | 5,300 | | | | 314,555 | |
| Preferred Bank/Los Angeles CA | | | 7,100 | | | | 428,485 | |
| Premier Financial Bancorp, Inc. | | | 2,530 | | | | 55,129 | |
| Primerica, Inc. | | | 2,200 | | | | 179,410 | |
| ProAssurance Corp. | | | 5,500 | | | | 300,575 | |
| Provident Financial Holdings, Inc. | | | 4,300 | | | | 84,280 | |
| Provident Financial Services, Inc. | | | 14,800 | | | | 394,716 | |
See accompanying Notes to Financial Statements.
11
Vericimetry U.S. Small Cap Value Fund
SCHEDULE OF INVESTMENTS (Continued)
As of September 30, 2017
| | | Number
of Shares | | | Value | |
COMMON STOCKS (Continued) | | | | | | |
FINANCIAL (Continued) | | | | | | |
| QCR Holdings, Inc. | | | 2,640 | | | $ | 120,120 | |
| Radian Group, Inc. | | | 11,700 | | | | 218,673 | |
| RE/MAX Holdings, Inc. - Class A | | | 1,500 | | | | 95,325 | |
| Regional Management Corp.* | | | 7,900 | | | | 191,259 | |
| Renasant Corp. | | | 13,203 | | | | 566,409 | |
| Riverview Bancorp, Inc. | | | 12,348 | | | | 103,723 | |
| RLI Corp. | | | 4,200 | | | | 240,912 | |
| S&T Bancorp, Inc. | | | 10,016 | | | | 396,433 | |
| Safety Insurance Group, Inc. | | | 6,550 | | | | 499,765 | |
| Sandy Spring Bancorp, Inc. | | | 4,031 | | | | 167,045 | |
| Seacoast Banking Corp. of Florida* | | | 7,875 | | | | 188,134 | |
| Security National Financial Corp. - Class A* | | | 6,442 | | | | 32,854 | |
| Selective Insurance Group, Inc. | | | 33,593 | | | | 1,808,983 | |
ServisFirst Bancshares, Inc.1 | | | 4,000 | | | | 155,400 | |
| Shore Bancshares, Inc. | | | 3,600 | | | | 59,940 | |
| SI Financial Group, Inc. | | | 3,700 | | | | 55,315 | |
| Sierra Bancorp | | | 7,700 | | | | 209,055 | |
| Simmons First National Corp. - Class A | | | 4,052 | | | | 234,611 | |
| SLM Corp.* | | | 10,600 | | | | 121,582 | |
| South State Corp. | | | 2,755 | | | | 248,088 | |
| Southern First Bancshares, Inc.* | | | 2,000 | | | | 72,700 | |
Southern National Bancorp of Virginia, Inc.1 | | | 3,504 | | | | 59,533 | |
| Southside Bancshares, Inc. | | | 7,666 | | | | 278,736 | |
| Southwest Bancorp, Inc. | | | 6,100 | | | | 168,055 | |
| St. Joe Co.* | | | 6,200 | | | | 116,870 | |
| State Auto Financial Corp. | | | 15,545 | | | | 407,745 | |
| State Bank Financial Corp. | | | 9,400 | | | | 269,310 | |
| State National Cos., Inc. | | | 9,750 | | | | 204,652 | |
| Sterling Bancorp | | | 39,009 | | | | 961,572 | |
| Stewart Information Services Corp. | | | 7,280 | | | | 274,893 | |
| Stifel Financial Corp. | | | 9,300 | | | | 497,178 | |
| Stock Yards Bancorp, Inc. | | | 4,450 | | | | 169,100 | |
| Summit Financial Group, Inc. | | | 4,001 | | | | 102,666 | |
| Sutherland Asset Management Corp. | | | 5,600 | | | | 87,920 | |
| Synovus Financial Corp. | | | 8,828 | | | | 406,618 | |
| TCF Financial Corp. | | | 3,900 | | | | 66,456 | |
| Texas Capital Bancshares, Inc.* | | | 3,800 | | | | 326,040 | |
| Third Point Reinsurance Ltd.* | | | 18,000 | | | | 280,800 | |
| Timberland Bancorp, Inc. | | | 4,878 | | | | 152,877 | |
| Tiptree, Inc. | | | 8,100 | | | | 50,625 | |
| Tompkins Financial Corp. | | | 2,729 | | | | 235,076 | |
Towne Bank/Portsmouth VA1 | | | 7,392 | | | | 247,632 | |
| TriCo Bancshares | | | 4,525 | | | | 184,394 | |
| TriState Capital Holdings, Inc.* | | | 6,900 | | | | 158,010 | |
| Triumph Bancorp, Inc.* | | | 5,400 | | | | 174,150 | |
| TrustCo Bank Corp. NY | | | 19,200 | | | | 170,880 | |
| Trustmark Corp. | | | 20,750 | | | | 687,240 | |
COMMON STOCKS (Continued) | | | | | | | | |
FINANCIAL (Continued) | | | | | | | | |
Two River Bancorp1 | | | 1,890 | | | | 37,460 | |
| Umpqua Holdings Corp. | | | 50,724 | | | | 989,625 | |
| Union Bankshares Corp. | | | 11,809 | | | | 416,858 | |
United Bankshares, Inc.1 | | | 4,341 | | | | 161,268 | |
| United Community Bancorp | | | 995 | | | | 19,154 | |
| United Community Banks, Inc. | | | 16,200 | | | | 462,348 | |
| United Community Financial Corp. | | | 40,760 | | | | 391,296 | |
| United Financial Bancorp, Inc. | | | 7,289 | | | | 133,316 | |
| United Fire Group, Inc. | | | 17,370 | | | | 795,893 | |
| United Insurance Holdings Corp. | | | 3,006 | | | | 48,998 | |
| United Security Bancshares/Fresno CA | | | 8,200 | | | | 77,900 | |
| Unity Bancorp, Inc. | | | 3,303 | | | | 65,399 | |
Universal Insurance Holdings, Inc.1 | | | 13,760 | | | | 316,480 | |
| Univest Corp. of Pennsylvania | | | 13,530 | | | | 432,960 | |
| Validus Holdings Ltd. | | | 7,900 | | | | 388,759 | |
| Valley National Bancorp | | | 5,191 | | | | 62,552 | |
| Veritex Holdings, Inc.* | | | 8,900 | | | | 239,944 | |
| Virtus Investment Partners, Inc. | | | 1,100 | | | | 127,655 | |
Waddell & Reed Financial, Inc. - Class A1 | | | 14,400 | | | | 289,008 | |
| Walker & Dunlop, Inc.* | | | 9,600 | | | | 502,368 | |
| Washington Federal, Inc. | | | 28,200 | | | | 948,930 | |
| Washington Trust Bancorp, Inc. | | | 1,900 | | | | 108,775 | |
| Waterstone Financial, Inc. | | | 8,924 | | | | 174,018 | |
| Webster Financial Corp. | | | 10,840 | | | | 569,642 | |
| WesBanco, Inc. | | | 11,343 | | | | 465,290 | |
| West Bancorporation, Inc. | | | 2,220 | | | | 54,168 | |
| Westamerica Bancorporation1 | | | 4,300 | | | | 256,022 | |
| Western New England Bancorp, Inc. | | | 13,581 | | | | 148,033 | |
| Wintrust Financial Corp. | | | 12,300 | | | | 963,213 | |
World Acceptance Corp.*1 | | | 2,500 | | | | 207,225 | |
| WSFS Financial Corp. | | | 7,159 | | | | 349,001 | |
| Xenith Bankshares, Inc.* | | | 3,120 | | | | 101,400 | |
| | | | | | | | 81,573,121 | |
INDUSTRIAL – 20.0% | | | | | | | | |
| AAON, Inc. | | | 9,400 | | | | 324,065 | |
| AAR Corp. | | | 18,300 | | | | 691,374 | |
| Actuant Corp. - Class A | | | 4,900 | | | | 125,440 | |
Advanced Emissions Solutions, Inc.1 | | | 4,000 | | | | 43,880 | |
| Advanced Energy Industries, Inc.* | | | 4,100 | | | | 331,116 | |
| Aegion Corp.* | | | 7,989 | | | | 185,984 | |
| Aerovironment, Inc.* | | | 4,500 | | | | 243,540 | |
| Air Transport Services Group, Inc.* | | | 45,900 | | | | 1,117,206 | |
| Alamo Group, Inc. | | | 5,500 | | | | 590,535 | |
| Albany International Corp. - Class A | | | 3,600 | | | | 206,640 | |
| Allied Motion Technologies, Inc. | | | 4,006 | | | | 101,512 | |
American Railcar Industries, Inc.1 | | | 2,600 | | | | 100,360 | |
| Ampco-Pittsburgh Corp. | | | 2,800 | | | | 48,720 | |
See accompanying Notes to Financial Statements.
12
Vericimetry U.S. Small Cap Value Fund
SCHEDULE OF INVESTMENTS (Continued)
As of September 30, 2017
| | | Number
of Shares | | | Value | |
COMMON STOCKS (Continued) | | | | | | |
INDUSTRIAL (Continued) | | | | | | |
Applied Optoelectronics, Inc.*1 | | | 2,200 | | | $ | 142,274 | |
| ArcBest Corp. | | | 7,100 | | | | 237,495 | |
Ardmore Shipping Corp.*1 | | | 13,600 | | | | 112,200 | |
| Argan, Inc. | | | 3,600 | | | | 242,100 | |
| Arotech Corp.* | | | 10,300 | | | | 43,260 | |
| Astec Industries, Inc. | | | 4,397 | | | | 246,276 | |
| Atlas Air Worldwide Holdings, Inc.* | | | 17,050 | | | | 1,121,890 | |
| AVX Corp. | | | 10,700 | | | | 195,061 | |
| Ballantyne Strong, Inc.* | | | 3,565 | | | | 21,747 | |
| Barnes Group, Inc. | | | 13,600 | | | | 957,984 | |
| Bel Fuse, Inc. - Class B | | | 2,780 | | | | 86,736 | |
| Belden, Inc. | | | 2,700 | | | | 217,431 | |
| Benchmark Electronics, Inc.* | | | 23,800 | | | | 812,770 | |
| Berry Global Group, Inc.* | | | 2,920 | | | | 165,418 | |
| Brady Corp. - Class A | | | 5,300 | | | | 201,135 | |
| Briggs & Stratton Corp. | | | 20,700 | | | | 486,450 | |
| BWX Technologies, Inc. | | | 6,800 | | | | 380,936 | |
| Casella Waste Systems, Inc. - Class A* | | | 11,100 | | | | 208,680 | |
| CECO Environmental Corp. | | | 8,800 | | | | 74,448 | |
Celadon Group, Inc.1 | | | 19,700 | | | | 132,975 | |
| Chart Industries, Inc.* | | | 9,200 | | | | 360,916 | |
| Chase Corp. | | | 1,700 | | | | 189,380 | |
Chicago Bridge & Iron Co. N.V.1 | | | 11,100 | | | | 186,480 | |
| Coherent, Inc.* | | | 5,789 | | | | 1,361,399 | |
| Colfax Corp.* | | | 3,200 | | | | 133,248 | |
| Columbus McKinnon Corp. | | | 7,600 | | | | 287,812 | |
| Comfort Systems USA, Inc. | | | 3,000 | | | | 107,100 | |
| Control4 Corp.* | | | 7,700 | | | | 226,842 | |
| Core Molding Technologies, Inc. | | | 4,700 | | | | 103,118 | |
| Covenant Transportation Group, Inc. - Class A* | | | 6,542 | | | | 189,587 | |
| Cree, Inc.* | | | 3,800 | | | | 107,122 | |
| CTS Corp. | | | 5,600 | | | | 134,960 | |
| Cubic Corp. | | | 4,900 | | | | 249,900 | |
| Curtiss-Wright Corp. | | | 11,600 | | | | 1,212,664 | |
| DHT Holdings, Inc. | | | 28,600 | | | | 113,828 | |
| Dorian LPG Ltd.* | | | 7,000 | | | | 47,740 | |
| Ducommun, Inc.* | | | 8,022 | | | | 257,105 | |
| Dycom Industries, Inc.* | | | 1,100 | | | | 94,468 | |
| Eastern Co. | | | 2,500 | | | | 71,750 | |
| Echo Global Logistics, Inc.* | | | 8,400 | | | | 158,340 | |
| Electro Scientific Industries, Inc.* | | | 13,150 | | | | 183,048 | |
| EMCOR Group, Inc. | | | 6,700 | | | | 464,846 | |
| Encore Wire Corp. | | | 8,300 | | | | 371,633 | |
| EnPro Industries, Inc. | | | 1,700 | | | | 136,901 | |
| ESCO Technologies, Inc. | | | 2,900 | | | | 173,855 | |
| Esterline Technologies Corp.* | | | 10,540 | | | | 950,181 | |
COMMON STOCKS (Continued) | | | | | | | | |
INDUSTRIAL (Continued) | | | | | | | | |
| Fabrinet* | | | 4,300 | | | | 159,358 | |
| Federal Signal Corp. | | | 21,000 | | | | 446,880 | |
| Fluidigm Corp.* | | | 15,600 | | | | 78,624 | |
| FreightCar America, Inc. | | | 11,400 | | | | 222,984 | |
GasLog Ltd.1 | | | 13,700 | | | | 239,065 | |
GATX Corp.1 | | | 18,640 | | | | 1,147,478 | |
| Gencor Industries, Inc.* | | | 7,200 | | | | 127,080 | |
| Generac Holdings, Inc.* | | | 3,900 | | | | 179,127 | |
| General Cable Corp. | | | 21,600 | | | | 407,160 | |
| General Finance Corp.* | | | 10,700 | | | | 54,035 | |
| Gibraltar Industries, Inc.* | | | 16,950 | | | | 527,993 | |
| Global Brass & Copper Holdings, Inc. | | | 2,200 | | | | 74,360 | |
Golar LNG Ltd.1 | | | 12,500 | | | | 282,625 | |
| Goldfield Corp.* | | | 21,900 | | | | 137,970 | |
| Granite Construction, Inc. | | | 9,850 | | | | 570,808 | |
Greenbrier Cos., Inc.1 | | | 13,500 | | | | 650,025 | |
| Greif, Inc. - Class A | | | 8,900 | | | | 521,006 | |
| Griffon Corp. | | | 22,230 | | | | 493,506 | |
| Handy & Harman Ltd.* | | | 1,544 | | | | 50,257 | |
| Hardinge, Inc. | | | 9,900 | | | | 151,173 | |
| Harsco Corp.* | | | 24,300 | | | | 507,870 | |
| Heartland Express, Inc. | | | 10,200 | | | | 255,816 | |
| Heritage-Crystal Clean, Inc.* | | | 5,800 | | | | 126,150 | |
Hornbeck Offshore Services, Inc.*1 | | | 27,000 | | | | 109,080 | |
| Hub Group, Inc. - Class A* | | | 8,100 | | | | 347,895 | |
| Hurco Cos., Inc. | | | 4,902 | | | | 203,923 | |
| Hyster-Yale Materials Handling, Inc. | | | 4,080 | | | | 311,875 | |
| IES Holdings, Inc.* | | | 16,500 | | | | 285,450 | |
| II-VI, Inc.* | | | 18,870 | | | | 776,500 | |
| Itron, Inc.* | | | 5,900 | | | | 456,955 | |
| John Bean Technologies Corp. | | | 1,700 | | | | 171,870 | |
| Kadant, Inc. | | | 6,990 | | | | 688,864 | |
| Kaman Corp. | | | 2,000 | | | | 111,560 | |
KapStone Paper and Packaging Corp.1 | | | 11,100 | | | | 238,539 | |
| KBR, Inc. | | | 23,500 | | | | 420,180 | |
| KEMET Corp.* | | | 11,900 | | | | 251,447 | |
| Kennametal, Inc. | | | 18,000 | | | | 726,120 | |
| Kimball Electronics, Inc.* | | | 16,200 | | | | 350,730 | |
Kirby Corp.*1 | | | 1,600 | | | | 105,520 | |
| KLX, Inc.* | | | 9,200 | | | | 486,956 | |
| Knight-Swift Transportation Holdings, Inc.* | | | 8,400 | | | | 349,020 | |
| Kratos Defense & Security Solutions, Inc.* | | | 21,900 | | | | 286,452 | |
| Lawson Products, Inc.* | | | 1,646 | | | | 41,479 | |
| Layne Christensen Co.* | | | 6,500 | | | | 81,575 | |
| LB Foster Co. - Class A | | | 7,400 | | | | 168,350 | |
| Littelfuse, Inc. | | | 600 | | | | 117,528 | |
| Louisiana-Pacific Corp.* | | | 26,560 | | | | 719,245 | |
See accompanying Notes to Financial Statements.
13
Vericimetry U.S. Small Cap Value Fund
SCHEDULE OF INVESTMENTS (Continued)
As of September 30, 2017
| | | Number
of Shares | | | Value | |
COMMON STOCKS (Continued) | | | | | | |
INDUSTRIAL (Continued) | | | | | | |
LSB Industries, Inc.*1 | | | 7,700 | | | $ | 61,138 | |
| Lydall, Inc.* | | | 7,338 | | | | 420,467 | |
| Manitowoc Co., Inc.* | | | 22,800 | | | | 205,200 | |
| Marten Transport Ltd. | | | 27,000 | | | | 554,850 | |
| MasTec, Inc.* | | | 16,444 | | | | 763,002 | |
| Methode Electronics, Inc. | | | 2,730 | | | | 115,616 | |
| Milacron Holdings Corp.* | | | 1,900 | | | | 32,034 | |
| Moog, Inc. - Class A* | | | 5,600 | | | | 467,208 | |
| MSA Safety, Inc. | | | 2,400 | | | | 190,824 | |
| Mueller Industries, Inc. | | | 2,100 | | | | 73,395 | |
| Mueller Water Products, Inc. - Class A | | | 6,901 | | | | 88,333 | |
| Multi-Color Corp. | | | 5,238 | | | | 429,254 | |
| Myers Industries, Inc. | | | 4,500 | | | | 94,275 | |
| MYR Group, Inc.* | | | 5,100 | | | | 148,614 | |
| National Presto Industries, Inc. | | | 600 | | | | 63,870 | |
| NL Industries, Inc.* | | | 7,700 | | | | 70,455 | |
| NN, Inc. | | | 9,400 | | | | 272,600 | |
| Nordson Corp. | | | 1,700 | | | | 201,450 | |
| Northwest Pipe Co.* | | | 3,100 | | | | 58,962 | |
| Novanta, Inc.* | | | 5,350 | | | | 233,260 | |
| Olympic Steel, Inc. | | | 6,300 | | | | 138,600 | |
| Orion Group Holdings, Inc.* | | | 9,300 | | | | 61,008 | |
| Oshkosh Corp. | | | 1,900 | | | | 156,826 | |
| Owens-Illinois, Inc.* | | | 6,000 | | | | 150,960 | |
| PAM Transportation Services, Inc.* | | | 6,706 | | | | 160,475 | |
| Park Electrochemical Corp. | | | 4,700 | | | | 86,950 | |
| Park-Ohio Holdings Corp. | | | 4,700 | | | | 214,320 | |
| Patrick Industries, Inc.* | | | 1,460 | | | | 122,786 | |
| Plexus Corp.* | | | 5,800 | | | | 325,264 | |
| Powell Industries, Inc. | | | 2,600 | | | | 77,974 | |
| Primoris Services Corp. | | | 9,600 | | | | 282,432 | |
| Quanex Building Products Corp. | | | 9,000 | | | | 206,550 | |
| Radiant Logistics, Inc.* | | | 25,300 | | | | 134,343 | |
| Raven Industries, Inc. | | | 3,100 | | | | 100,440 | |
Regal Beloit Corp.1 | | | 5,900 | | | | 466,100 | |
| Rexnord Corp.* | | | 8,800 | | | | 223,608 | |
| Roadrunner Transportation Systems, Inc.* | | | 11,900 | | | | 113,407 | |
| Rogers Corp.* | | | 3,500 | | | | 466,480 | |
| Saia, Inc.* | | | 10,800 | | | | 676,620 | |
| Sanmina Corp.* | | | 44,190 | | | | 1,641,658 | |
| Scorpio Tankers, Inc. | | | 70,110 | | | | 240,477 | |
| Ship Finance International Ltd.1 | | | 15,765 | | | | 228,593 | |
| SigmaTron International, Inc.* | | | 3,300 | | | | 27,654 | |
| SPX Corp.* | | | 7,900 | | | | 231,786 | |
| Standex International Corp. | | | 500 | | | | 53,100 | |
| Sterling Construction Co., Inc.* | | | 5,600 | | | | 85,288 | |
| Stoneridge, Inc.* | | | 6,400 | | | | 126,784 | |
COMMON STOCKS (Continued) | | | | | | | | |
INDUSTRIAL (Continued) | | | | | | | | |
| Summit Materials, Inc. - Class A* | | | 15,013 | | | | 480,866 | |
| Synalloy Corp.* | | | 7,400 | | | | 92,500 | |
| SYNNEX Corp. | | | 15,200 | | | | 1,922,952 | |
| Tech Data Corp.* | | | 9,925 | | | | 881,836 | |
Teekay Corp.1 | | | 14,600 | | | | 130,378 | |
Teekay Tankers Ltd. - Class A1 | | | 39,000 | | | | 63,180 | |
| Teledyne Technologies, Inc.* | | | 5,000 | | | | 795,900 | |
| Terex Corp. | | | 25,100 | | | | 1,130,002 | |
| Tetra Tech, Inc. | | | 11,850 | | | | 551,618 | |
| TimkenSteel Corp.* | | | 19,000 | | | | 313,500 | |
| TopBuild Corp.* | | | 13,100 | | | | 853,727 | |
| Transcat, Inc.* | | | 5,141 | | | | 70,175 | |
| Tredegar Corp. | | | 10,592 | | | | 190,656 | |
| Trex Co., Inc.* | | | 6,000 | | | | 540,420 | |
| TriMas Corp.* | | | 8,300 | | | | 224,100 | |
| Trinseo S.A. | | | 9,600 | | | | 644,160 | |
| Triumph Group, Inc. | | | 6,100 | | | | 181,475 | |
| TTM Technologies, Inc.* | | | 52,444 | | | | 806,064 | |
| Tutor Perini Corp.* | | | 23,500 | | | | 667,400 | |
| U.S. Ecology, Inc. | | | 2,700 | | | | 145,260 | |
| Universal Forest Products, Inc. | | | 7,350 | | | | 721,476 | |
| USA Truck, Inc.* | | | 8,400 | | | | 118,020 | |
| Vishay Intertechnology, Inc. | | | 44,450 | | | | 835,660 | |
| Vishay Precision Group, Inc.* | | | 13,900 | | | | 339,160 | |
| VSE Corp. | | | 5,600 | | | | 318,416 | |
| Watts Water Technologies, Inc. - Class A | | | 3,400 | | | | 235,280 | |
| Werner Enterprises, Inc. | | | 12,400 | | | | 453,220 | |
| Willis Lease Finance Corp.* | | | 3,500 | | | | 86,065 | |
| Worthington Industries, Inc. | | | 1,400 | | | | 64,400 | |
| XPO Logistics, Inc.* | | | 17,612 | | | | 1,193,741 | |
YRC Worldwide, Inc.*1 | | | 4,700 | | | | 64,860 | |
| ZAGG, Inc.* | | | 26,260 | | | | 413,595 | |
| Zebra Technologies Corp. - Class A* | | | 1,800 | | | | 195,444 | |
| | | | | | | | 60,361,120 | |
TECHNOLOGY – 7.4% | | | | | | | | |
| Actua Corp.* | | | 11,600 | | | | 177,480 | |
| Acxiom Corp.* | | | 6,200 | | | | 152,768 | |
Advanced Micro Devices, Inc.*1 | | | 93,700 | | | | 1,194,675 | |
| Agilysys, Inc.* | | | 4,700 | | | | 56,165 | |
| Alpha & Omega Semiconductor Ltd.* | | | 20,050 | | | | 330,624 | |
| Amkor Technology, Inc.* | | | 58,300 | | | | 615,065 | |
| Amtech Systems, Inc.* | | | 6,900 | | | | 82,662 | |
| Axcelis Technologies, Inc.* | | | 4,525 | | | | 123,759 | |
| AXT, Inc.* | | | 14,450 | | | | 132,218 | |
| Brooks Automation, Inc. | | | 31,000 | | | | 941,160 | |
| Cabot Microelectronics Corp. | | | 4,900 | | | | 391,657 | |
| CACI International, Inc. - Class A* | | | 13,600 | | | | 1,895,160 | |
See accompanying Notes to Financial Statements.
14
Vericimetry U.S. Small Cap Value Fund
SCHEDULE OF INVESTMENTS (Continued)
As of September 30, 2017
| | | Number
of Shares | | | Value | |
COMMON STOCKS (Continued) | | | | | | |
TECHNOLOGY (Continued) | | | | | | |
| Cavium, Inc.* | | | 1,592 | | | $ | 104,976 | |
| CEVA, Inc.* | | | 5,200 | | | | 222,560 | |
| Cirrus Logic, Inc.* | | | 13,100 | | | | 698,492 | |
| Cohu, Inc. | | | 13,994 | | | | 333,617 | |
| Convergys Corp. | | | 27,200 | | | | 704,208 | |
| CSG Systems International, Inc. | | | 1,700 | | | | 68,170 | |
Cypress Semiconductor Corp.1 | | | 54,153 | | | | 813,378 | |
| Digi International, Inc.* | | | 8,400 | | | | 89,040 | |
| Digital Turbine, Inc.* | | | 30,800 | | | | 46,508 | |
| Diodes, Inc.* | | | 11,700 | | | | 350,181 | |
DMC Global, Inc.1 | | | 6,300 | | | | 106,470 | |
| Donnelley Financial Solutions, Inc.* | | | 1,637 | | | | 35,294 | |
DSP Group, Inc.*1 | | | 11,400 | | | | 148,200 | |
| Ebix, Inc.1 | | | 14,070 | | | | 918,067 | |
| Engility Holdings, Inc.* | | | 9,706 | | | | 336,604 | |
| Entegris, Inc.* | | | 17,550 | | | | 506,317 | |
| ExlService Holdings, Inc.* | | | 3,410 | | | | 198,871 | |
ExOne Co.*1 | | | 6,000 | | | | 68,160 | |
| FormFactor, Inc.* | | | 35,136 | | | | 592,042 | |
| Glu Mobile, Inc.* | | | 43,300 | | | | 162,808 | |
| GSI Technology, Inc.* | | | 4,700 | | | | 34,169 | |
| InnerWorkings, Inc.* | | | 4,400 | | | | 49,500 | |
Inovalon Holdings, Inc. - Class A*1 | | | 9,300 | | | | 158,565 | |
| Insight Enterprises, Inc.* | | | 15,600 | | | | 716,352 | |
| IXYS Corp.* | | | 15,100 | | | | 357,870 | |
| Key Tronic Corp.* | | | 7,700 | | | | 55,517 | |
| Kulicke & Soffa Industries, Inc.* | | | 35,000 | | | | 754,950 | |
| MagnaChip Semiconductor Corp.* | | | 2,750 | | | | 31,213 | |
| ManTech International Corp. - Class A | | | 13,980 | | | | 617,217 | |
| MaxLinear, Inc.* | | | 5,833 | | | | 138,534 | |
| Mercury Systems, Inc.* | | | 12,400 | | | | 643,312 | |
| MKS Instruments, Inc. | | | 15,600 | | | | 1,473,420 | |
| MTS Systems Corp. | | | 1,600 | | | | 85,520 | |
| NetScout Systems, Inc.* | | | 15,700 | | | | 507,895 | |
| PAR Technology Corp.* | | | 3,200 | | | | 33,408 | |
pdvWireless, Inc.*1 | | | 2,800 | | | | 83,440 | |
| Photronics, Inc.* | | | 41,100 | | | | 363,735 | |
| Pitney Bowes, Inc. | | | 5,000 | | | | 70,050 | |
| QAD, Inc. - Class A | | | 2,200 | | | | 75,570 | |
| Qorvo, Inc.* | | | 3,705 | | | | 261,869 | |
| Rudolph Technologies, Inc.* | | | 6,470 | | | | 170,161 | |
Sapiens International Corp. N.V.*1 | | | 14,900 | | | | 196,680 | |
| Sigma Designs, Inc.* | | | 10,800 | | | | 68,040 | |
| StarTek, Inc.* | | | 5,600 | | | | 65,800 | |
| Stratasys Ltd.* | | | 5,900 | | | | 136,408 | |
| Super Micro Computer, Inc.* | | | 9,218 | | | | 203,718 | |
| Sykes Enterprises, Inc.* | | | 11,797 | | | | 344,001 | |
COMMON STOCKS (Continued) | | | | | | | | |
TECHNOLOGY (Continued) | | | | | | | | |
| Syntel, Inc. | | | 4,500 | | | | 88,425 | |
| Take-Two Interactive Software, Inc.* | | | 2,000 | | | | 204,460 | |
| Teradyne, Inc. | | | 3,200 | | | | 119,328 | |
| Ultra Clean Holdings, Inc.* | | | 14,850 | | | | 454,707 | |
| Veeco Instruments, Inc.* | | | 5,908 | | | | 126,431 | |
| VeriFone Systems, Inc.* | | | 7,600 | | | | 154,128 | |
| Verint Systems, Inc.* | | | 4,300 | | | | 179,955 | |
| Virtusa Corp.* | | | 1,200 | | | | 45,336 | |
| Vocera Communications, Inc.* | | | 2,000 | | | | 62,740 | |
| Xcerra Corp.* | | | 11,800 | | | | 116,230 | |
| Zynga, Inc. - Class A* | | | 117,300 | | | | 443,394 | |
| | | | | | | | 22,289,404 | |
UTILITIES – 0.1% | | | | | | | | |
| Ameresco, Inc. - Class A* | | | 19,413 | | | | 151,421 | |
| | | | | | | | | |
TOTAL COMMON STOCKS | | | | | | | | |
| (Cost $202,322,838) | | | | | | | 290,307,120 | |
| | | Principal Amount | | | | |
| CORPORATE BONDS – 0.0% | | | | | | |
| INDUSTRIAL – 0.0% | | | | | | |
| Mueller Industries, Inc. | | | | | | |
6.00%, 3/1/20272 | | $ | 22,000 | | | | 22,679 | |
| | | | | | | | | |
| TOTAL CORPORATE BONDS | | | | | | | | |
| (Cost $22,000) | | | | | | | 22,679 | |
| | | Number
of Shares | | | | |
| EXCHANGE-TRADED FUNDS – 1.2% | | | | | | |
Direxion Daily S&P Oil & Gas Exp. & Prod. Bull 3X Shares ETF1 | | | 32,125 | | | | 781,280 | |
SPDR S&P Metals & Mining ETF1 | | | 18,388 | | | | 591,726 | |
SPDR S&P Oil & Gas Equipment & Services ETF1 | | | 105,500 | | | | 1,749,190 | |
SPDR S&P Oil & Gas Exploration & Production ETF1 | | | 11,800 | | | | 402,262 | |
| | | | | | | | | |
| TOTAL EXCHANGE-TRADED FUNDS | | | | | | | | |
| (Cost $3,091,029) | | | | | | | 3,524,458 | |
See accompanying Notes to Financial Statements.
15
Vericimetry U.S. Small Cap Value Fund
SCHEDULE OF INVESTMENTS (Continued)
As of September 30, 2017
| | | Number
of Shares | | | Value | |
| MONEY MARKET INVESTMENTS – 11.2% | |
Blackrock Liquidity Funds FedFund Portfolio - Class Institutional, 1.01%3, 4 | | | 914,210 | | | $ | 914,210 | |
Federated Treasury Obligations Fund - Class Institutional, 0.86%3 | | | 8,891,145 | | | | 8,891,145 | |
Invesco Government & Agency Portfolio - Class Institutional, 1.02%3, 4 | | | 23,980,647 | | | | 23,980,647 | |
| | | | | | | | | |
| TOTAL MONEY MARKET INVESTMENTS | |
| (Cost $33,786,002) | | | | | | | 33,786,002 | |
| | | | | | | | | |
| TOTAL INVESTMENTS – 108.6% | | | | | | | | |
| (Cost $239,221,869) | | | | | | | 327,640,259 | |
| | | | | | | | | |
| Liabilities less other assets – (8.6)% | | | | | | | (25,879,792 | ) |
| | | | | | | | | |
TOTAL NET ASSETS – 100.0% | | | | | | $ | 301,760,467 | |
PLC – Public Limited Company
| * | Non-income producing security. |
1 | All or a portion of shares are on loan. Total loaned securities had a fair value of $24,050,882 at September 30, 2017. |
3 | Variable rate security; the rate shown represents the 7-day yield at September 30, 2017. |
4 | Investments purchased with cash proceeds from securities lending. Total collateral had a fair value of $24,894,857 at September 30, 2017. |
See accompanying Notes to Financial Statements.
16
Vericimetry U.S. Small Cap Value Fund
SUMMARY OF INVESTMENTS
As of September 30, 2017 (Unaudited)
| Security Type/Industry | Percent of
Total Net Assets |
| Common Stocks | |
| Banks | 14.0% |
| Insurance | 7.4% |
| Electronics | 4.6% |
| Retail | 4.3% |
| Commercial Services | 4.1% |
| Semiconductors | 4.0% |
| Oil & Gas | 3.8% |
| Savings & Loans | 3.1% |
| Transportation | 3.0% |
| Chemicals | 2.6% |
| Diversified Financial Services | 2.3% |
| Computers | 2.2% |
| Oil & Gas Services | 2.0% |
| Aerospace/Defense | 2.0% |
| Engineering & Construction | 2.0% |
| Food | 1.9% |
| Healthcare-Services | 1.8% |
| Miscellaneous Manufacturing | 1.7% |
| Biotechnology | 1.6% |
| Home Builders | 1.5% |
| Auto Parts & Equipment | 1.4% |
| Building Materials | 1.4% |
| Entertainment | 1.4% |
| Machinery-Diversified | 1.3% |
| Software | 1.2% |
| Healthcare-Products | 1.2% |
| Internet | 1.2% |
| Telecommunications | 1.1% |
| Media | 1.1% |
| Iron/Steel | 1.0% |
| Lodging | 1.0% |
| Apparel | 1.0% |
| Mining | 1.0% |
| Pharmaceuticals | 1.0% |
| Leisure Time | 0.9% |
| Distribution/Wholesale | 0.8% |
| Machinery-Construction & Mining | 0.7% |
| Electrical Components & Equipment | 0.7% |
| Airlines | 0.7% |
| Household Products/Wares | 0.7% |
| Trucking & Leasing | 0.6% |
| Metal Fabricate/Hardware | 0.6% |
| Energy-Alternate Sources | 0.6% |
| Packaging & Containers | 0.5% |
| Hand/Machine Tools | 0.5% |
| Environmental Control | 0.4% |
| Forest Products & Paper | 0.3% |
| Auto Manufacturers | 0.3% |
| Real Estate | 0.3% |
| Home Furnishings | 0.2% |
| Textiles | 0.2% |
| Housewares | 0.2% |
| Agriculture | 0.2% |
| Coal | 0.1% |
| Pipelines | 0.1% |
| Office Furnishings | 0.1% |
| Storage/Warehousing | 0.1% |
| Beverages | 0.1% |
| Electric | 0.1% |
| Cosmetics/Personal Care | 0.0%1 |
| REITS | 0.0%1 |
| Office/Business Equipment | 0.0%1 |
Total Common Stocks | 96.2% |
| Corporate Bonds | |
| Metal Fabricate/Hardware | 0.0% |
Total Corporate Bonds | 0.0% |
Exchange-Traded Funds | 1.2% |
Money Market Investments | 11.2% |
Total Investments | 108.6% |
| Liabilities less other assets | (8.6)% |
Total Net Assets | 100.0% |
1 | Resulted in less than 0.05% per industry. |
See accompanying Notes to Financial Statements.
17
Vericimetry Funds
Vericimetry U.S. Small Cap Value Fund
STATEMENT OF ASSETS AND LIABILITIES
September 30, 2017
| ASSETS | | | |
| Investments in securities, at value (cost $239,221,869) | | $ | 327,640,259 | (1) |
| Receivables: | | | | |
| Securities sold | | | 830,604 | |
| Fund shares issued | | | 114,986 | |
| Dividends and interest | | | 159,516 | |
| Securities lending income | | | 22,309 | |
| Prepaid expenses and other assets | | | 18,316 | |
| Total assets | | | 328,785,990 | |
| | | | | |
LIABILITIES | | | | |
| Collateral due to broker for securities loaned | | | 24,894,857 | |
| Payables: | | | | |
| Securities purchased | | | 1,807,996 | |
| Fund shares redeemed | | | 142,160 | |
| Due to Trustees | | | 2,175 | |
| Due to Adviser | | | 108,243 | |
| Accrued other expenses | | | 70,092 | |
| Total liabilities | | | 27,025,523 | |
| | | | | |
NET ASSETS | | $ | 301,760,467 | |
| | | | | |
COMPONENTS OF NET ASSETS | | | | |
| Paid-in-capital | | $ | 212,329,100 | |
| Accumulated undistributed net investment income | | | 166,016 | |
| Accumulated undistributed net realized gain on investments | | | 846,961 | |
| Net unrealized appreciation on investments | | | 88,418,390 | |
NET ASSETS | | $ | 301,760,467 | |
| | | | | |
Shares outstanding no par value (unlimited shares authorized) | | | 15,324,720 | |
| | | | | |
Net asset value, offering and redemption price per share | | $ | 19.69 | |
(1) | Includes securities on loan of $24,050,882 (see Note 2). |
See accompanying Notes to Financial Statements.
18
Vericimetry Funds
Vericimetry U.S. Small Cap Value Fund
STATEMENT OF OPERATIONS
For the Year Ended September 30, 2017
| INVESTMENT INCOME | | | |
| Income | | | |
| Dividends (net of foreign withholding taxes of $2,020) | | $ | 3,239,679 | |
| Net securities lending income | | | 210,371 | |
| Interest | | | 51,633 | |
| Total investment income | | | 3,501,683 | |
| | | | | |
Expenses | | | | |
| Investment advisory fees | | | 1,408,626 | |
| Fund accounting and administration fees and expenses | | | 144,959 | |
| Transfer agent fees | | | 104,410 | |
| Professional fees | | | 47,058 | |
| Registration fees | | | 46,177 | |
| Custody fees | | | 41,327 | |
| Shareholder reporting fees | | | 31,735 | |
| Insurance fees | | | 13,376 | |
| Trustees' fees and expenses | | | 8,700 | |
| Miscellaneous expenses | | | 3,784 | |
| Total expenses | | | 1,850,152 | |
| Expenses waived by the Adviser | | | (159,801 | ) |
| Net expenses | | | 1,690,351 | |
Net investment income | | | 1,811,332 | |
| | | | | |
Net Realized and Unrealized Gain on Investments | | | | |
| Net realized gain on investments | | | 7,761,265 | |
| Net change in unrealized appreciation on investments | | | 39,793,128 | |
| Net realized and unrealized gain on investments | | | 47,554,393 | |
| | | | | |
Net Increase in Net Assets from Operations | | $ | 49,365,725 | |
See accompanying Notes to Financial Statements.
19
Vericimetry Funds
Vericimetry U.S. Small Cap Value Fund
STATEMENTS OF CHANGES IN NET ASSETS
| | | For the Year Ended September 30, 2017 | | | For the Year Ended September 30, 2016 | |
| INCREASE IN NET ASSETS FROM | | | | | | |
| Operations | | | | | | |
| Net investment income | | $ | 1,811,332 | | | $ | 2,092,663 | |
| Net realized gain (loss) on investments | | | 7,761,265 | | | | (5,666,510 | ) |
| Net change in unrealized appreciation on investments | | | 39,793,128 | | | | 32,373,663 | |
| Net increase resulting from operations | | | 49,365,725 | | | | 28,799,816 | |
| | | | | | | | | |
| Distributions to Shareholders | | | | | | | | |
| From net investment income | | | (1,770,699 | ) | | | (1,892,275 | ) |
| Net decrease resulting from distributions | | | (1,770,699 | ) | | | (1,892,275 | ) |
| | | | | | | | | |
| Capital Transactions | | | | | | | | |
| Proceeds from shares issued | | | 39,098,119 | | | | 82,306,238 | |
| Reinvestment of distributions | | | 1,766,811 | | | | 1,888,511 | |
| Cost of shares redeemed | | | (47,921,627 | ) | | | (39,982,190 | ) |
| Net increase (decrease) resulting from capital transactions | | | (7,056,697 | ) | | | 44,212,559 | |
| | | | | | | | | |
Total increase in net assets | | | 40,538,329 | | | | 71,120,100 | |
| | | | | | | | | |
| Net Assets | | | | | | | | |
| Beginning of year | | | 261,222,138 | | | | 190,102,038 | |
| End of year | | $ | 301,760,467 | | | $ | 261,222,138 | |
| | | | | | | | | |
| Accumulated undistributed net investment income | | $ | 166,016 | | | $ | 266,897 | |
| | | | | | | | | |
| Capital Share Activity | | | | | | | | |
| Shares issued | | | 2,140,587 | | | | 5,535,531 | |
| Shares reinvested | | | 94,262 | | | | 120,913 | |
| Shares redeemed | | | (2,606,935 | ) | | | (2,647,407 | ) |
Net increase (decrease) in capital shares | | | (372,086 | ) | | | 3,009,037 | |
See accompanying Notes to Financial Statements.
20
Vericimetry Funds
Vericimetry U.S. Small Cap Value Fund
FINANCIAL HIGHLIGHTS
| For a capital share outstanding throughout each year | | | | |
| | | For the Year Ended September 30, 2017 | | | For the Year Ended September 30, 2016 | | | For the Year Ended September 30, 2015 | | | For the Year Ended September 30, 2014 | | | For the Year Ended September 30, 2013 | |
| Net asset value, beginning of year | | $ | 16.64 | | | $ | 14.98 | | | $ | 15.32 | | | $ | 14.89 | | | $ | 11.33 | |
| Income from Investment Operations: | | | | | | | | | | | | | | | | | | | | |
| Net investment income | | | 0.12 | | | | 0.14 | | | | 0.16 | | | | 0.10 | | | | 0.16 | |
| Net realized and unrealized gain (loss) on investments | | | 3.04 | | | | 1.65 | | | | (0.32 | ) | | | 0.89 | | | | 3.70 | |
| Total from investment operations | | | 3.16 | | | | 1.79 | | | | (0.16 | ) | | | 0.99 | | | | 3.86 | |
| | | | | | | | | | | | | | | | | | | | | |
| Less Distributions: | | | | | | | | | | | | | | | | | | | | |
| From net investment income | | | (0.11 | ) | | | (0.13 | ) | | | (0.14 | ) | | | (0.08 | ) | | | (0.16 | ) |
| From net realized gain | | | — | | | | — | | | | (0.04 | ) | | | (0.48 | ) | | | (0.14 | ) |
| Total distributions | | | (0.11 | ) | | | (0.13 | ) | | | (0.18 | ) | | | (0.56 | ) | | | (0.30 | ) |
| | | | | | | | | | | | | | | | | | | | | |
Net asset value, end of year | | $ | 19.69 | | | $ | 16.64 | | | $ | 14.98 | | | $ | 15.32 | | | $ | 14.89 | |
| | | | | | | | | | | | | | | | | | | | | |
Total return | | | 19.06 | % | | | 12.01 | % | | | (1.10 | %) | | | 6.70 | % | | | 34.88 | % |
| | | | | | | | | | | | | | | | | | | | | |
| Ratios and Supplemental Data | | | | | | | | | | | | | | | | | | | | |
| Net assets, end of year (in thousands) | | $ | 301,760 | | | $ | 261,222 | | | $ | 190,102 | | | $ | 161,458 | | | $ | 103,755 | |
| | | | | | | | | | | | | | | | | | | | | |
| Ratio of expenses to average net assets | | | | | | | | | | | | | | | | | | | | |
| Before fees reimbursed by the Adviser | | | 0.66 | % | | | 0.68 | % | | | 0.69 | % | | | 0.72 | % | | | 1.17 | % |
| After fees reimbursed by the Adviser | | | 0.60 | % | | | 0.60 | % | | | 0.60 | % | | | 0.60 | % | | | 0.60 | % |
| Ratio of net investment income to average net assets | | | | | | | | | | | | | | | | | | | | |
| Before fees reimbursed by the Adviser | | | 0.58 | % | | | 0.84 | % | | | 0.91 | % | | | 0.52 | % | | | 0.59 | % |
| After fees reimbursed by the Adviser | | | 0.64 | % | | | 0.92 | % | | | 1.00 | % | | | 0.64 | % | | | 1.16 | % |
| | | | | | | | | | | | | | | | | | | | | |
| Portfolio turnover rate | | | 42 | % | | | 39 | % | | | 34 | % | | | 16 | % | | | 24 | % |
See accompanying Notes to Financial Statements.
21
Vericimetry Funds
NOTES TO FINANCIAL STATEMENTS
As of September 30, 2017
1. Organization
Vericimetry Funds (the “Trust”), a Delaware statutory trust, is registered under the Investment Company Act of 1940, as amended, as an open-end management investment company. The Trust consists of one diversified series of shares: the Vericimetry U.S. Small Cap Value Fund (the “Fund”). The Fund’s primary investment objective is to achieve long-term capital appreciation. The Fund commenced operations on December 27, 2011.
2. Significant Accounting Policies
The Fund is an investment company and accordingly follows the investment company accounting and reporting guidance of the Financial Accounting Standards Board, Accounting Standards Codification Topic 946, Financial Services – Investment Companies including FASB Accounting Standard Update ASU 2013-08.
The following is a summary of significant accounting policies consistently followed by the Trust in the preparation of its financial statements. These policies are in conformity with accounting principles generally accepted in the United States of America (“GAAP”) for investment companies. The presentation of financial statements in conformity with GAAP requires management to make estimates and assumptions that affect the reported amounts of assets and liabilities at the date of the financial statements and the reported amounts of income and expenses. Actual results may differ from those estimates and disclosure of contingent assets and liabilities.
| (a) | Investment Valuation – Investments in securities traded on a national securities exchange, including common stocks, exchange-traded funds and rights, are valued at the last reported sales price on the day of valuation. Securities traded on the Nasdaq National Market are valued at the Nasdaq Official Closing Price (“NOCP”). If there is no last reported sale or NOCP, the value of such securities will be at the mean between the most recent quoted bid and ask prices. Debt securities are valued on the basis of bid-side prices. Money market investments are valued at their traded net asset value. Short-term investments may be valued at amortized cost, when it approximates fair value. If amortized cost does not approximate fair value, short-term securities are reported at fair value. Securities for which market quotations are not readily available are valued at their estimated fair value as determined in good faith by Vericimetry Advisors LLC (the “Adviser”) under procedures established by and under the general supervision and responsibility of the Trust’s Board of Trustees (the “Board”). |
Under GAAP, various inputs are used in determining the value of the Fund’s investments. These inputs are summarized into three broad levels and described below:
| | Level 1 – | quoted prices for active markets for identical securities. An active market for the security is a market in which transactions occur with sufficient frequency and volume to provide pricing information on an ongoing basis. A quoted price in an active market provides the most reliable evidence of fair value. |
| | Level 2 – | other significant observable inputs (including quoted prices for similar securities, interest rates, prepayment speeds, credit risk, etc.). Quoted prices for identical or similar assets in markets that are not active. Inputs that are derived principally from or corroborated by observable market data. An adjustment to any observable input that is significant to the fair value may render the measurement to a Level 3 measurement. |
| | Level 3 – | significant unobservable inputs, including the Fund’s own assumptions in determining the fair value of investments. |
22
Vericimetry Funds
NOTES TO FINANCIAL STATEMENTS (Continued)
As of September 30, 2017
The inputs or methodology used for valuing securities are not necessarily an indication of the risk associated with investing in those securities. The following is a summary of the fair values of the Fund’s investments in each category as of September 30, 2017:
| | | Level 1 | | | Level 2 | | | Level 3*** | | | Total | |
| Investments in Securities | | | | | | | | | | | | |
| Common Stocks* | | | | | | | | | | | | |
| Basic Materials | | $ | 14,908,834 | | | $ | — | | | $ | — | | | $ | 14,908,834 | |
| Communications | | | 10,066,973 | | | | — | | | | — | | | | 10,066,973 | |
| Consumer, Cyclical | | | 43,082,141 | | | | — | | | | — | | | | 43,082,141 | |
| Consumer, Non-Cyclical | | | 37,757,215 | | | | — | | | | — | | | | 37,757,215 | |
| Energy | | | 20,116,891 | | | | — | | | | — | | | | 20,116,891 | |
| Financial | | | 81,430,361 | | | | 142,760 | | | | — | | | | 81,573,121 | |
| Industrial | | | 60,361,120 | | | | — | | | | — | | | | 60,361,120 | |
| Technology | | | 22,289,404 | | | | — | | | | — | | | | 22,289,404 | |
| Utilities | | | 151,421 | | | | — | | | | — | | | | 151,421 | |
| Corporate Bonds** | | | | | | | | | | | | | | | | |
| Industrial | | | — | | | | 22,679 | | | | — | | | | 22,679 | |
| Exchange-Traded Funds | | | 3,524,458 | | | | — | | | | — | | | | 3,524,458 | |
| Money Market Investments | | | 33,786,002 | | | | — | | | | — | | | | 33,786,002 | |
Total Investments in Securities | | $ | 327,474,820 | | | $ | 165,439 | | | $ | — | | | $ | 327,640,259 | |
| | * | The Fund held a security classified as Level 2 security at period end because this security did not have any trading activity on September 29, 2017, the last business day of the fiscal year and thus did not have a last reported sales price of the day. As a result, this security was valued in accordance with procedures established by and under the general supervision and responsibility of the Board. This Level 2 security which was held on September 30, 2016 was classified as a Level 1 security at that time. The Fund recognizes transfers between levels at the end of the reporting period. The amount of such transfers out of Level 1 and into Level 2 was $142,760. |
| | | Certain Level 1 securities at September 30, 2017 which were held at September 30, 2016, were classified as Level 2 securities at September 30, 2016 because they did not have any trading activity on September 30, 2016 and were valued at the mean between the most recent bid and ask prices. The amount of such transfers out of Level 2 into Level 1 at September 30, 2017 was $50,040. There were no other transfers between Levels. |
| | ** | All corporate bonds held in the Fund are classified as Level 2 securities. |
| | *** | There were no Level 3 securities as of September 30, 2017. There were no transfers into or out of Level 3 as of period end. |
| (b) | Investment Transactions, Investment Income and Expenses – Investment transactions are recorded on trade date for financial reporting purposes. Dividend income is recorded on the ex-dividend date. Non-cash dividends included in dividend income, if any, are recorded at fair market value. Securities gains and losses are calculated based on highest cost, long-term holdings. Interest income is recognized on accrual basis and includes, where applicable, the amortization or accretion of premium or discount over the life of the security. Withholding taxes on foreign dividends have been provided for in accordance with the Fund’s understanding of the applicable country’s tax rules and rates. |
| (c) | Federal Income Taxes – The Fund intends to comply with the requirements of Subchapter M of the Internal Revenue Code applicable to regulated investment companies and to distribute substantially all of its net investment income and any net realized gains to its shareholders. Therefore, no provision is made for federal income or excise taxes. Due to the timing of dividend distributions and the differences in accounting for income and realized gains and losses for financial statement and federal income tax purposes, the fiscal year in which amounts are distributed may differ from the year in which the income and realized gains and losses are recorded by the Fund. The Fund may utilize earnings and profits on redemption of shares as part of the dividends paid deduction. |
23
Vericimetry Funds
NOTES TO FINANCIAL STATEMENTS (Continued)
As of September 30, 2017
GAAP requires an evaluation of tax positions taken (or expected to be taken) in the course of preparing a Fund’s tax returns to determine whether these positions meet a “more-likely-than-not” standard that, based on the technical merits, have a more than fifty percent likelihood of being sustained by a taxing authority upon examination. A tax position that meets the “more-likely-than-not” recognition threshold is measured to determine the amount of benefit to recognize in the financial statements. The Fund recognizes interest and penalties, if any, related to unrecognized tax benefits as income tax expense in the Statement of Operations.
GAAP requires management of the Fund to analyze all open tax years (for the Fund, tax years 2014-2017), as defined by IRS statute of limitations for all major jurisdictions, including federal tax authorities and certain state tax authorities. As of and during the year ended September 30, 2017, the Fund did not have a liability for any unrecognized tax benefits. The Fund has no examination in progress and is not aware of any tax positions for which it is reasonably possible that the total amounts of unrecognized tax benefits will significantly change in the next twelve months.
| (d) | Distributions to Shareholders – The Fund declares and pays dividends at least annually from net investment income and from net realized gains, if any. Distributions to shareholders are recorded on ex-dividend date. The amount and timing of distributions are determined in accordance with federal income tax regulations, which may differ from GAAP. |
| (e) | Securities Lending – The Fund is authorized to lend a portion of its portfolio securities (up to a maximum value of one-third of the Fund’s total asset value) for the purpose of seeking to earn additional income net of fees. The Fund may pay reasonable administrative and custodial fees in connection with the loan. A principal risk in lending portfolio securities, as with other extensions of credit, is the possible loss of rights in the collateral should the borrower fail financially. In addition, the Fund may be exposed to the risk that the sale of any collateral realized will not yield proceeds sufficient to replace the loaned securities. In determining whether to lend securities to a particular borrower, the Adviser (subject to oversight by the Board) will consider all relevant facts and circumstances, including the creditworthiness of the borrower. The loans would be made only to firms deemed by the Adviser to be of good standing, and when, in the judgment of the Adviser, the consideration that can be earned from securities' loans of this type justifies the attendant risk. All loans are required to be secured continuously by collateral in cash, cash equivalents (negotiable certificates of deposit, bankers acceptances or letters of credit), or securities of the U.S. Government or its agencies maintained on a current basis at an amount at least equal to 102% of the current value of the securities loaned for domestic U.S. securities, (excluding Government Securities as defined below), and 105% of the current value of foreign equity loaned securities. Securities issued or guaranteed by the United States Government or its federal agencies or instrumentalities (“Government Securities”) may be maintained at 100% of current value. Collateral is received and maintained by the Fund’s securities lending agent concurrent with delivery of the loaned securities and kept in a segregated account or designated on the records of the custodian for the benefit of the Fund. The Fund will have the right to call a loan and obtain the securities loaned at any time on five days’ notice. While securities are on loan, the borrower will pay the Fund any income from the securities. Gain or loss in the value of securities loaned that may occur while the securities are on loan will be for the account of the Fund. |
The Fund may invest any cash collateral in portfolio securities and earn additional income or receive an agreed-upon amount of income from a borrower who has delivered equivalent collateral. Any such investment of cash collateral will subject the Fund to the related investment risks. The Fund will not have the right to vote on any securities having voting rights during the existence of the loan. The Fund will have the right to regain record ownership of loaned securities in order to exercise ownership rights such as voting rights, subscription rights and rights to dividends, interest or distributions.
At September 30, 2017, the value of securities loaned by the Fund was $24,050,882 and the Fund received cash collateral of $24,894,857. Securities purchased via reinvestment of cash collateral received as part of the securities lending program consisted of institutional money market funds with overnight and continuous maturities.
| (f) | Disclosures about Offsetting Assets and Liabilities requires an entity to disclose information about offsetting and related arrangements to enable users of its financial statements to understand the effect of those arrangements on its financial position. The guidance requires retrospective application for all comparative periods presented. Management has evaluated the impact on the financial statement disclosures and determined that there is no effect. As there are no master netting arrangements relating to the Fund’s participation in securities lending, and all amounts related to securities lending are presented gross on the Fund’s Statement of Assets and Liabilities, no additional disclosures have been made on behalf of the Fund. Please reference Note 2(e) for additional disclosures related to securities lending, including collateral related to securities on loan. |
24
Vericimetry Funds
NOTES TO FINANCIAL STATEMENTS (Continued)
As of September 30, 2017
3. Investment Advisory and Other Agreements
The Fund has entered into an Investment Advisory Agreement with the Adviser, pursuant to which the Adviser provides general investment advisory services for the Fund. For providing these services, the Adviser receives a fee from the Fund, accrued daily and paid monthly, at an annual rate equal to 0.50% of the Fund’s average daily net assets. However, the Adviser has contractually agreed through an Expense Limitation Agreement to waive its management fee or reimburse the Fund so that its total annual operating expenses (excluding non-operating costs, which includes but is not limited to taxes, interest, acquired fund fees and expenses, litigation, extraordinary expenses, brokerage and other transaction expenses relating to the purchase or sale of portfolio investments) do not exceed 0.60% of the Fund’s average daily net assets until January 31, 2018. For the year ended September 30, 2017, the Fund accrued $1,408,626 in advisory fees under the Investment Advisory Agreement.
Under the terms of the Expense Limitation Agreement, if at any time the expenses of the Fund are less than the expense limitation, the Adviser retains the right to seek reimbursement for any fees previously waived and/or expenses previously assumed within the prior three fiscal years, to the extent that such reimbursement will not cause the Fund’s annualized expenses to exceed 0.60% of its average net assets on an annualized basis, or the expense limitation in place at time of waiver. The Fund is not obligated to reimburse the Adviser for fees previously waived or expenses previously assumed by the Adviser more than three fiscal years before the date of such reimbursement. All such reimbursements are contingent upon Board review and approval. As of September 30, 2017, reimbursements that may potentially be made by the Fund to the Adviser total $500,448, which expire as follows:
| September 30, 2018 | | $ | 162,276 | |
| September 30, 2019 | | $ | 178,371 | |
| September 30, 2020 | | $ | 159,801 | |
Certain officers and a Trustee of the Trust are also officers of the Adviser. Such persons are not compensated by the Fund for the services they provide to the Fund.
4. Federal Income Tax Information
At September 30, 2017, gross unrealized appreciation and depreciation on investments owned by the Fund, based on cost for federal income tax purposes were as follows:
| Cost of Investments | | $ | 239,612,076 | |
| Gross Unrealized Appreciation | | $ | 92,601,097 | |
| Gross Unrealized Depreciation | | | (4,572,914 | ) |
| Net Unrealized Appreciation | | $ | 88,028,183 | |
The difference between cost amounts for financial statement and federal income tax purposes is due primarily to timing differences in recognizing certain gains and losses in security transactions.
GAAP requires that certain components of net assets be reclassified between financial and tax reporting. These reclassifications have no effect on net assets or net asset value per share. For the year ended September 30, 2017, permanent differences in book and tax accounting have been reclassified between paid-in-capital, accumulated undistributed net investment income (loss) and accumulated net realized gain (loss) as follows:
| Increase (Decrease) |
| Paid-in- Capital | Accumulated Undistributed Net Investment Income | Accumulated Undistributed Net Realized Gain on Investments |
| $ 1 | $ (141,514) | $ 141,513 |
25
Vericimetry Funds
NOTES TO FINANCIAL STATEMENTS (Continued)
As of September 30, 2017
As of September 30, 2017, the components of accumulated earnings on a tax basis were as follows:
| Undistributed Ordinary Income | | $ | 213,878 | |
| Undistributed Long-term Gains | | | 1,199,559 | |
| Tax Accumulated Earnings | | | 1,413,437 | |
| Accumulated Capital and Other Losses | | $ | — | |
| Unrealized Appreciation on Investments | | | 88,028,183 | |
| Total Accumulated Earnings | | $ | 89,441,620 | |
Capital loss carryovers are available to offset future realized capital gains and thereby reduce further taxable gain distributions. During the year ended September 30, 2017, the Fund utilized $5,481,824 of short-term and $1,272,780 of long-term non-expiring capital loss carryovers.
The tax character of distributions paid during the fiscal years ended September 30, 2017 and September 30, 2016 were as follows:
| | | September 30, 2017 | | | September 30, 2016 | |
| Distributions Paid From: | | | | | | |
| Ordinary Income | | $ | 1,770,699 | | | $ | 1,892,275 | |
| Long-term Capital Gains | | | — | | | | — | |
| Total Distributions | | $ | 1,770,699 | | | $ | 1,892,275 | |
5. Investment Transactions
For the year ended September 30, 2017, the Fund’s purchases and sales of investments, excluding short-term investments, were as follows:
| Purchases | Sales |
| $ 115,339,736 | $ 126,984,715 |
6. Concentration Risk
The Fund may invest a significant portion (27.0% as of September 30, 2017) of its assets in securities of companies in the financial services industry, developments affecting the financial services industry will have a disproportionate impact on the Fund. If the Fund invests more heavily in the financial sector, the value of its shares may be especially sensitive to factors and economic risks that specifically affect that sector, such as interest rate risk and credit risk. As a result, the Fund's share price may fluctuate more widely than the value of shares of a mutual fund that invests in a broader range of sectors.
7. Indemnifications
In the normal course of business, the Fund enters into contracts that contain a variety of representations, which provide general indemnifications. The Fund’s maximum exposure under these arrangements is unknown, as this would involve future claims that may be made against the Fund that have not yet occurred. However, the Fund expects the risk of loss to be remote.
8. Events Subsequent to the Fiscal Year End
The Fund has adopted financial reporting rules regarding subsequent events which require an entity to recognize in the financial statements the effects of all subsequent events that provide additional evidence about conditions that existed at the date of the balance sheet. There were no subsequent events or transactions that occurred that materially impacted the amounts or disclosures in the Fund’s financial statements, through the date of issuance of these financial statements.
26
Vericimetry Funds
REPORT OF INDEPENDENT REGISTERED PUBLIC ACCOUNTING FIRM
To the Shareholders of Vericimetry U.S. Small Cap Value Fund and
Board of Trustees of Vericimetry Funds
We have audited the accompanying statement of assets and liabilities, including the schedule of investments, of Vericimetry Funds comprising Vericimetry U.S. Small Cap Value (the “Fund”) as of September 30, 2017, and the related statement of operations for the year then ended, the statements of changes in net assets for each of the two years in the period then ended, and the financial highlights for each of the five years in the period then ended. These financial statements and financial highlights are the responsibility of the Fund’s management. Our responsibility is to express an opinion on these financial statements and financial highlights based on our audits.
We conducted our audits in accordance with the standards of the Public Company Accounting Oversight Board (United States). Those standards require that we plan and perform the audit to obtain reasonable assurance about whether the financial statements and financial highlights are free of material misstatement. An audit includes examining, on a test basis, evidence supporting the amounts and disclosures in the financial statements. Our procedures included confirmation of securities owned as of September 30, 2017, by correspondence with the custodian and brokers. An audit also includes assessing the accounting principles used and significant estimates made by management, as well as evaluating the overall financial statement presentation. We believe that our audits provide a reasonable basis for our opinion.
In our opinion, the financial statements and financial highlights referred to above present fairly, in all material respects, the financial position of Vericimetry U.S. Small Cap Value Fund as of September 30, 2017, the results of its operations for the year then ended, the changes in its net assets for each of the two years in the period then ended, and the financial highlights for each of the five years in the period then ended, in conformity with accounting principles generally accepted in the United States of America.
COHEN & COMPANY, LTD.
Cleveland, Ohio
November 22, 2017
27
Vericimetry Funds
EXPENSE EXAMPLE
For the Six Months Ended September 30, 2017 (Unaudited)
As a shareholder of the Fund, you incur ongoing costs, including management fees and other Fund expenses. This Example is intended to help you understand your ongoing costs (in dollars) of investing in the Fund and to compare these costs with the ongoing costs of investing in other mutual funds.
The Example is based on an investment of $1,000 invested at the beginning of the period and held for the entire period from April 1, 2017 through September 30, 2017 (the “period”).
Actual Expenses
The first line of the table below provides information about actual account values and actual expenses. You may use the information in this line, together with the amount you invested, to estimate the expenses you paid over the period. Simply divide your account value by $1,000 (for example, an $8,600 account value divided by $1,000 equals 8.6), then multiply the result by the number in the first line under the heading entitled “Expenses Paid During the Period” to estimate the expenses you paid on your account during the period.
Hypothetical Example for Comparison Purposes
The second line of the table below provides information about hypothetical account values and hypothetical expenses based on the Fund’s actual expense ratio and an assumed rate of return of 5% per year before expenses, which is not the Fund’s actual return. The hypothetical account values and expenses may not be used to estimate the actual ending account balance or expenses you paid for the period. You may use this information to compare the ongoing costs of investing in the Fund and other funds. To do so, compare this 5% hypothetical example with the 5% hypothetical examples that appear in the shareholder reports of other funds.
Please note that the expenses shown in the table are meant to highlight your ongoing costs only and do not reflect any transactional costs. Therefore, the second line of the table is useful in comparing the ongoing costs only, and will not help you determine the relative total costs of owning different funds. In addition, if these transactional costs were included, your costs could have been higher.
Expenses Paid During the Period
| | Beginning
account value
April 1, 2017 | Ending
account value
September 30, 2017 | Expenses paid during the period ended September 30, 2017* |
| Actual Example | $ 1,000.00 | $ 1,061.70 | $ 3.10 |
| Hypothetical Example, assuming a 5% return before expenses | 1,000.00 | 1,021.99 | 3.04 |
| * | Expenses are equal to the Fund’s annualized expense ratio of 0.60% multiplied by the average account value over the period, multiplied by 183/365 (to reflect the six month period). |
28
Vericimetry Funds
OTHER INFORMATION (Unaudited)
Proxy Voting
The Fund’s proxy voting guidelines and a record of the Vericimetry U.S. Small Cap Value Fund’s proxy votes for the year ended June 30 are available without charge, upon request, by calling 1-855-755-7550 and on the Securities and Exchange Commission’s website at www.sec.gov.
Quarterly Holdings
The Fund files its complete schedule of portfolio holdings with the SEC for the first and third quarters of each fiscal year on Form N-Q. The Fund’s Form N-Q is available on the EDGAR database on the Securities and Exchange Commission’s website at www.sec.gov. These Forms may also be reviewed and copied at the Securities and Exchange Commission’s Public Reference Room in Washington, D.C. Information about the operation of the Public Reference Room may be obtained by calling 1-800-SEC-0330.
Risk Disclosures
Economic, political, and issuer specific events may cause the value of securities to rise or fall. Because the value of your investment in the Fund will fluctuate, there is the risk that you will lose money. Securities of small and microcap companies are often less liquid, more volatile and they may have more limited resources. Value stocks may perform differently from the market as a whole and may underperform equity funds that use other investment strategies. The investment strategies, practices and risk analysis used by the Adviser may not produce the desired results.
Tax Information
For the year ended September 30, 2017, 100.00% of the dividends paid from net investment income, including short-term capital gains (if any), for the Fund, is designated as qualified dividend income.
For the year ended September 30, 2017, 100.00% of the dividends paid from net investment income including short-term capital gains (if any), for the Fund, qualifies for the dividends received deduction available to corporate shareholders.
29
Vericimetry Funds
TRUSTEES AND OFFICERS
September 30, 2017 (Unaudited)
| Interested Trustee and Officer |
Name, Age
and Address | Positions Held | Term of Office(1) and Length of Service | Principal Occupation(s) During Past 5 Years | Funds of the Trust Overseen | Other Public Company or Registered Investment Company Trusteeships Held During Past 5 Years |
Mendel Fygenson, Ph.D.(2) 1968 North Lake Avenue, # 303
Altadena, CA 91001 Age: 60 | Chairman, President, Secretary, & Trustee | Trustee since March 2016. Other positions since April 2016. | Professor, University of Southern California (1995 – Present); Consultant, Divine Analytics (2008 – Present); Chief Executive Officer, Vericimetry Advisors LLC (2014 – Present). | 1 | None |
| Independent Trustees |
Name, Age
and Address | Positions
Held | Term of Office(1) and Length of Service | Principal Occupation(s)
During Past 5 Years | Funds of the Trust Overseen | Other Public Company or Registered Investment Company Trusteeships Held During Past 5 Years |
Brian K. Wing
1968 North Lake Avenue, # 303
Altadena, CA 91001 Age: 50 | Trustee | Since August 2013. | Senior Vice President and Chief Financial Officer, Ryan LLC (tax services firm), Dallas, Texas (May 2016 – Present); Chief Financial Officer, HYLA Mobile, Irving, Texas (2013 – 2015); Chief Financial Officer, Treasurer and Senior Vice President (Operations), Consolidated Electrical Distributors, Inc., Irving, Texas (2009 – 2013); Executive Vice President, Corporate Development, MGA Entertainment, Inc., Van Nuys, California (2008 – 2009). | 1 | None |
Chad Lasdon
1968 North Lake Avenue, # 303
Altadena, CA 91001 Age: 38 | Trustee | Since March 2016. | Vice President and Relationship Manager, Bank of the West (2013 – 2016); Senior Vice President – Capital Markets, BentleyForbes (2008 – 2013). | 1 | None |
Paul Karapetian
1968 North Lake Avenue, # 303
Altadena, CA 91001 Age: 40 | Trustee | Since March 2016. | Senior Vice President, IDS Real Estate Group (2006 – Present). | 1 | None |
30
Vericimetry Funds
TRUSTEES AND OFFICERS (Continued)
September 30, 2017 (Unaudited)
| Officers |
Name, Age
and Address | Positions
Held | Term of Office(1) and Length of
Service | Principal Occupation(s)
During Past 5 Years | Funds of
the Trust
Overseen |
Christopher Thomas
1968 North Lake Avenue, # 303
Altadena, CA 91001 Age: 60 | Chief Compliance Officer | Since September, 2014. | Chief Compliance Officer (2014 – present); Chief Compliance Officer, First Pacific Advisors, LLC, (2005 – 2014), Vice President, Controller, Fund Assistant Treasurer, First Pacific Advisors, LLC, (1995 – 2005). | 1 |
Michael Thill
235 W. Galena Street, Milwaukee, WI 53212 Age: 39 | Treasurer | Since October 2017. | Lead Administrator and Officer (2007 – present) and other positions (2000 – 2007) at UMB Fund Services, Inc. | 1 |
(1) | Each Trustee holds office for an indefinite term until his successor is elected and qualified. Each Officer holds office for an indefinite term at the pleasure of the Board and until his or her successor is elected and qualified. |
(2) | Dr. Fygenson is considered an interested Trustee of the Trust, within the meaning of the 1940 Act, because of his affiliation with the Advisor. |
| The Statement of Additional Information includes additional information about the Trustees and is available upon request, without charge, by calling 1-855-755-7550 or visiting www.vericimetryfunds.com. |
31
This page intentionally left blank.
This page intentionally left blank.
Vericimetry U.S. Small Cap Value Fund
UMB Distribution Services, LLC, Distributor
P.O. Box 2175, Milwaukee, WI 53201-2175
www.vericimetryfunds.com
Item 2. Code of Ethics.
The Registrant, as of the end of the period covered by this report, has adopted a code of ethics that applies to the Registrant’s principal executive officer, principal financial officer, principal accounting officer or controller, or persons performing similar functions, regardless of whether these individuals are employed by the Registrant or a third party. A copy of this code of ethics is attached hereto as an Exhibit.
There were no substantive amendments, during the period covered by this report, to a provision of the code of ethics that applies to the Registrant's principal executive officer, principal financial officer, principal accounting officer or controller, or persons performing similar functions, regardless of whether these individuals are employed by the Registrant or a third party, and that relates to any element of the code of ethics description. The Registrant has not granted any waivers, including an implicit waiver, from a provision of the code of ethics during the period covered by this report.
Item 3. Audit Committee Financial Expert.
The Registrant’s board of trustees has determined that Mr. Brian Wing is an audit committee financial expert serving on its audit committee and that Mr. Wing is independent.
Item 4. Principal Accountant Fees and Services.
The aggregate fees billed for each of the last two fiscal years for professional services rendered by the principal accountant for the audit of the Registrant’s annual financial statements or services that are normally provided by the accountant in connection with statutory and regulatory filings or engagements are listed below:
The Registrant’s audit committee has adopted an Audit Committee Charter that requires that the Audit Committee review the scope and plan of the registered public accounting firm’s annual and interim examinations, approve the services to be performed for the Registrant by the independent public accountants and approve the fees and other compensation payable to the independent accountants. For the year ended September 30, 2017, all of the audit and non-audit services provided by the Registrant’s principal accountant were pre-approved by the audit committee.
(f) None.
(g) None.
(h) Not applicable.
Item 5. Audit Committee of Listed Registrants.
Not applicable.
Item 6. Schedule of Investments.
The schedule of investments in securities in unaffiliated issuers is included as part of the report to shareholders filed under Item 1.
Item 7. Disclosure of Proxy Voting Policies and Procedures for Closed-End Management Investment Companies.
Not applicable.
Item 8. Portfolio Managers of Closed-End Management Investment Companies.
Not applicable.
Item 9. Purchases of Equity Securities by Closed-End Management Investment Company and Affiliated Purchasers.
Not applicable.
Item 10. Submissions of Matters to a Vote of Security Holders.
As of the end of the period covered by this report, the Registrant had not adopted any procedures by which shareholders may recommend nominees to the Registrant’s board of trustees.
Item 11. Controls and Procedures.
(a) The Registrant's certifying officer has concluded that the Registrant's disclosure controls and procedures (as defined in Rule 30a-2 under the Investment Company Act of 1940 (the "Act")) are effective in design and operation and are sufficient to form the basis of the certifications required by Rule 30a-2 under the Act, based on his evaluation of these disclosure controls and procedures within 90 days of the filing date of this report on Form N-CSR.
(b) There were no significant changes in the Registrant's internal controls or in other factors that could significantly affect these controls subsequent to the date of their evaluation, including any corrective actions with regard to significant deficiencies and material weaknesses.
Item 12. Disclosure of Securities Lending Activities for Closed-End Management Investment Companies.
Not applicable.
Item 13. Exhibits.
(a)(1) Code of Ethics – Filed as an attachment to this filing.
(a)(2) Certification for the principal executive and principal financial officer of the Registrant as required by Rule 30a-2 under the Act (17 CFR 270.30a-2(a)) – Filed as an attachment to this filing.
(a)(3) Not Applicable.
(b) Certifications required by Rule 30a-2(b) under the Act (17 CFR 270.30a-2(b)), Rule 13a-14(b) or Rule 15d-14(b) under the Exchange Act (17 CFR 240.13a-14(b) or 240.15d-14(b)), and Section 1350 of Chapter 63 of Title 18 of the United States Code (18 U.S.C. 1350) – Filed as an attachment to this filing.
Pursuant to the requirements of the Securities Exchange Act of 1934 and the Investment Company Act of 1940, the registrant has duly caused this report to be signed on its behalf by the undersigned, thereunto duly authorized.
Pursuant to the requirements of the Securities Exchange Act of 1934 and the Investment Company Act of 1940, this report has been signed below by the following person on behalf of the registrant and in the capacities and on the dates indicated.