Barclays CEO Energy-Power Conference 0 September 3, 2014

1 This presentation contains “forward-looking statements.” Forward-looking statements give the Company’s current expectations or forecasts of future events. Forward-looking statements generally can be identified by the use of forward-looking terminology such as “may,” “will,” “expect,” “intend,” “estimate,” “anticipate,” “believe,” “project,” or “continue,” or other similar words. These statements reflect management’s current views with respect to future events and are subject to risks and uncertainties, both known and unknown. The Company’s actual results may vary materially from those anticipated in forward-looking statements. The Company cautions investors not to place undue reliance on any forward-looking statements. Such risks, uncertainties and other important factors include, among others, the Company’s dependence on, and the cyclical nature of, the offshore oil and gas industry; the Company’s dependence on oil and gas exploration and development activity in the areas where the Company operates; fluctuations in worldwide prices of and demand for oil and natural gas; the ability to successfully expand into other geographic and helicopter service markets; the impact of increased U.S. and foreign government regulation and legislation, including potential government implemented moratoriums on drilling activities; the requirement to engage in competitive processes or expend significant resources with no guaranty of recoupment; inherent risks in operating helicopters; the failure to maintain an acceptable safety record; the grounding of all or a portion of our fleet for extended periods of time or indefinitely; reduction or cancellation of services for government agencies; reliance on a small number of helicopter manufacturers and suppliers; political instability, governmental action, war, acts of terrorism and changes in the economic condition in any foreign country where the Company does business, which may result in expropriation, nationalization, confiscation or deprivation of our assets or result in claims of a force majeure situation; declines in the global economy and financial markets; foreign currency exposure and exchange controls; credit risk exposure; the ongoing need to replace aging helicopters; the Company’s reliance on the secondary used helicopter market to dispose of older helicopters; the Company’s reliance on a small number of customers; allocation of risk between the Company and its customers; liability, legal fees and costs in connection with providing emergency response services; risks associated with the Company’s debt structure; operational and financial difficulties of the Company’s joint ventures and partners; conflict with the other owners of the Company’s non-wholly owned subsidiaries and other equity investees; adverse results of legal proceedings; adverse weather conditions and seasonality; adequacy of insurance coverage; the attraction and retention of qualified personnel; restrictions on the amount of foreign ownership of the Company’s common stock; the effect of the Spin-off, including the ability of the Company to recognize the expected benefits from the Spin-off and the Company’s dependence on SEACOR’s performance under various agreements; and various other matters and factors included in the Company’s annual reports on Form 10-K, quarterly reports on Form 10-Q and other SEC filings. These factors are not exhaustive, and new factors may emerge or changes to the foregoing factors may occur that could impact the Company’s business. Except to the extent required by law, the Company undertakes no obligation to update or revise any forward-looking statements, whether as a result of new information, future events or otherwise. This presentation includes disclosure of the Company’s Net Asset Value. The Company’s Net Asset Value is based upon the fair market value (FMV) of the Company’s owned helicopters plus the book value of the Company’s other assets less the Company’s liabilities. The Company derives FMV from observable market data if available and may require utilization of estimates, application of significant judgment and assistance of valuation specialists. In some cases, FMV is obtained from third party analysts. There is no assurance that FMV of an asset represents the amount that Era could obtain from an unaffiliated third party in an arm’s length sale of the asset. Cautionary Statement Regarding Forward Looking Statements

2 This presentation includes EBITDA and Adjusted EBITDA as supplemental measures of the Company’s operating performance. EBITDA is defined as Earnings before Interest (includes interest income, interest expense and interest expense on advances from SEACOR), Taxes, Depreciation and Amortization. Adjusted EBITDA is defined as EBITDA further adjusted for SEACOR Management Fees and certain other items that occurred during the reporting period. Neither EBITDA nor Adjusted EBITDA is a recognized term under generally accepted accounting principles in the U.S. (“GAAP”). Accordingly, they should not be used as an indicator of, or an alternative to, net income as a measure of operating performance. In addition, EBITDA and Adjusted EBITDA are not intended to be a measure of free cash flow available for discretionary use, as they do not consider certain cash requirements, such as debt service requirements. EBITDA and Adjusted EBITDA have limitations as analytical tools, and you should not consider them in isolation, nor as a substitute for analysis of our results as reported under GAAP. Because the definitions of EBITDA and Adjusted EBITDA (or similar measures) may vary among companies and industries, they may not be comparable to other similarly titled measures used by other companies. A reconciliation of EBITDA and Adjusted EBITDA is included in this presentation. Non-GAAP Financial Measures Reconciliation

• Founded in Alaska in 1948, Era is the longest-serving helicopter transport company in the U.S. • Announced CEO change on August 28, 2014, with Chris Bradshaw assuming the role of Acting CEO • NYSE:ERA – $525mm market capitalization(a) • 166 helicopters(b) supporting two primary businesses – Operations – Dry-leasing • Asset ownership strategy focused on returns over the full life of the asset, including residual value – Helicopters retain value • 884 employees, including 305 pilots and 238 mechanics(b) (none of which are unionized) • Company-wide focus on safety Company Overview 3 LTM Revenue by End Market LTM Revenue by Geography (a) As of 8/25/2014 (b) As of 6/30/2014 Oil & Gas 70% Dry-leasing 14% Search & Rescue 7% Air Medical Services 4% FBO 3% Flightseeing 2% North America 85% Latin America & the Caribbean 6% Europe 6% Asia 3%

Areas of Operation Australia Continental United States Sweden Aircraft in Region (# of aircraft) Spain Canada India Mexico 1 UK 3 Norway Brazil Training Center Joint Venture 17 2 1 102 3 Joint Ventures Australia 12 24 Alaska 4 1 Colombia Note: As of 6/30/14. Map excludes one AW139 (medium) helicopter that was fully paid for and delivered in May 2014 but not yet operational as of June 30, 2014. Map includes seven A119 (light–single engine) helicopters in Spain under the Lake Palma joint venture; effective July 24, 2014, we sold our 51% interest in Lake Palma.

Heavy, 9, 5% Medium, 61, 37% Light Twin, 37, 22% Light Single, 59, 36% 5 Fleet Snapshot • On a dollar-weighted basis: − Heavy and medium helicopters represent 80% of fleet value − Average age of the fleet is 4 years(a) Fleet by Type Fleet by Ownership A119 AS350 AW139 Bell 212 Bell 412 S76A/A++ S76C+/C++ A109 BK-117 EC135 EC145 EC225 Owned, 147, 89% Joint Ventured, 8, 5% Leased, 4, 2% Managed, 7, 4% Notes: As of 6/30/14. Excludes one AW139 helicopter that was fully paid for and delivered in May 2014 but not yet operational as of June 30, 2014; also excludes orders and options. Effective July 24, 2014, we sold our 51% interest in Lake Palma, which owns the seven A119 helicopters listed as joint-ventured above. (a) Average for owned fleet

6 C ur re nt O rd er B oo k O pt io ns Delivery Class Type Number Remaining Amount Firm Cancellable 2014 Heavy AW189 3 $35.8 – 2015 Heavy AW189 2 $14.1 $16.6 2015 Heavy S92 1 $17.2 – 2016 Heavy AW189 3 – $51.0 2016 Heavy S92 2 $51.3 – 2017 Heavy AW189 2 – $34.7 2017 Heavy S92 1 $26.4 – TBD Light Twin AW169 5 – $43.0 19 $144.8 $145.3 Note: Capital commitments shown by year of scheduled helicopter delivery (not year in which cash is spent); US$mm estimates as of 6/30/14 Class Type Number Remaining Amount Firm Cancellable Heavy AW189 10 – $171.7 Heavy S92 5 – $175.5 Medium AW139 4 – $52.5 19 – $399.7 Helicopter Order and Options Book

• Era initially invested in Aeroleo in July 2011 (50% economic interest) – Shortly after mobilizing 4 AW139s to Brazil in 2011, Petrobras cancelled the contract award due to an AW139 accident at one of Aeroleo’s competitors – Beginning in late 2012 and continuing through most of 2013, Aeroleo’s 3 EC225s were suspended from operations due to an OEM main gear box shaft issue • Aeroleo’s 3 EC225s and 5 of the 9 AW139s are currently operating on contracts – 7 AW139s are expected to start long-term contracts with Petrobras with staggered start dates commencing in Dec 2014 – By May 2015, all of Aeroleo’s aircraft are expected to be operating on long-term contracts (fully utilized for the first time) • We continue to see robust demand for helicopter services in Brazil – Petrobras tenders for Heavy, Medium and Medevac helicopters due later this month – Multiple tenders from other international oil & gas operators are under evaluation or expected shortly Brazil Update – An Inflection Point 7 Current Aeroleo Fleet EC225 AW139 3 9 Aeroleo Bases Rio de Janeiro

• Significant expansion of our Houma, LA base is currently underway with completion expected in Q4 – When completed, it will be the premier helicopter operating facility in the Gulf Coast area • Strategic benefits – Customer sustainability, including future growth – Increased passenger terminal capacity – Enhanced safety • Reduce flyaway limitations • Instrument (IFR) infrastructure • Better storm protection • Addition of TSA-like security Houma Base Expansion 8

Investment Highlights 9 Sound Industry Structure Stable and Growing End Markets Strong Customer Relationships Residual Value Retention Attractive Growth Profile Substantial Net Asset Value

10 Stable and Growing End Markets Demand has grown through periods of economic and price volatility Global Deepwater Platform With Helipad Count Offshore Spending(a) ($bn) (a) Excludes costs for capital equipment, offshore and subsea infrastructure and seismic exploration Source: IHS, Wall Street research • ~75% of Era’s operating fleet is servicing production, pipelines, and government services, the more stable parts of the industry • Once installed, production platforms are economic to operate in almost any commodity price environment 109 124 134 145 159 171 176 182 189 200 201 209 219 100 125 150 175 200 225 2005 2006 2007 2008 2009 2010 2011 2012 2013 2014E 2015E 2016E 2017E – $50 $100 $150 $200 2008 2009 2010 2011 2012 2013 2014E 2015E Jackups Floaters

11 Residual Value Retention (a) Indexed resale value of several helicopter types by vintage, inflation adjusted to 2011 dollars. Source: HeliValue$, Cowen and Co. (b) Index includes: Augusta Westland 109A Widebody (1988 model), Bell 212 (1979 model), Bell 412 (1984 model), Eurocopter BK 117A-4 (1988 model), Eurocopter AS 350B (1982 model), Sikorsky S-76A Mark II (1982 model) (c) Era depreciates its helicopters to 40% salvage value over 15 years • Given helicopters retain significant value over their useful lives, Era has consistently sold helicopters at a premium to book value • Since 2004, Era has sold 89 aircraft for an aggregate gain of nearly $75 million • We spent $50 million, $44 million and $57 million in 2011, 2012 and 2013, respectively, to maintain our fleet Helicopter Value Retention 20 40 60 80 100 0 1 2 3 4 5 6 7 8 9 10 11 12 13 14 15 Helicopter Age (Indexed Resale Value) Premium to Book Helicopter Resale Value(a)(b) Illustrative Book Value(c) Historical Gains on Helicopter Sales ($000s) 2004 2005 2006 2007 2008 2009 2010 2011 2012 2013 2014 Total # of Aircraft Sold 2 8 15 11 8 5 2 14 6 15 3 89 Acquisition Cost $1,401 $13,599 $34,373 $20,842 $11,781 $24,670 $471 $20,848 $4,164 $74,296 $2,317 $208,762 Sale Proceeds 1,385 19,011 36,628 28,170 14,790 25,267 740 28,680 3,435 68,165 6,950 233,221 Book Value at Sale 936 10,958 27,231 19,362 9,776 24,853 254 12,640 1,268 50,247 931 158,457 Gain on Sale $449 $8,053 $9,397 $8,808 $5,014 $414 $486 $16,040 $2,167 $17,918 $6,019 $74,764

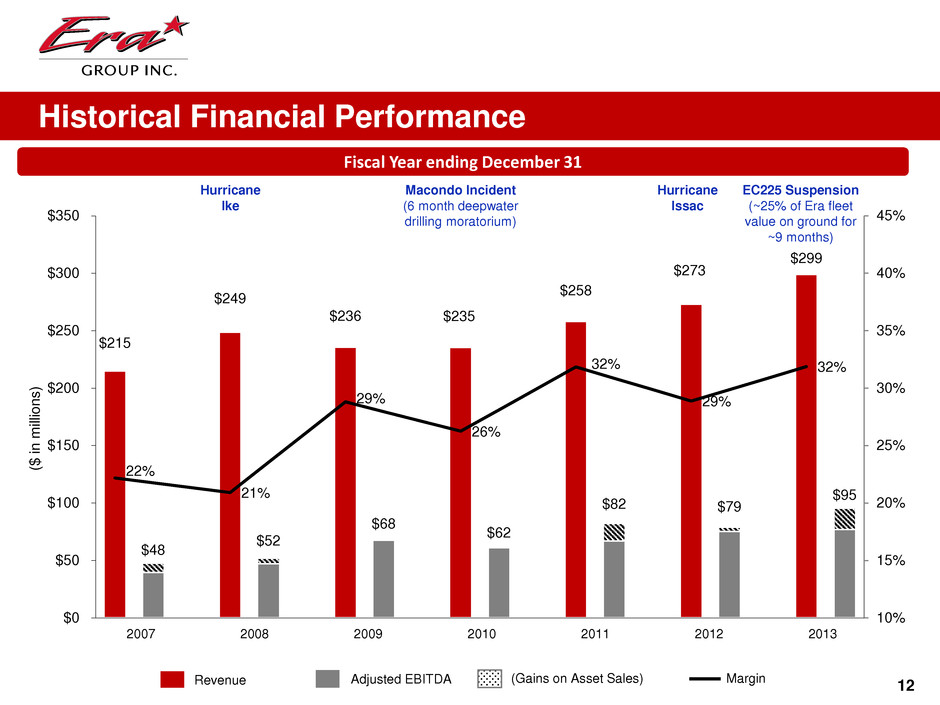
Historical Financial Performance 12 Revenue Adjusted EBITDA (Gains on Asset Sales) Margin Fiscal Year ending December 31 $215 $249 $236 $235 $258 $273 $299 $48 $52 $68 $62 $82 $79 $95 22% 21% 29% 26% 32% 29% 32% 10% 15% 20% 25% 30% 35% 40% 45% $0 $50 $100 $150 $200 $250 $300 $350 ($ in m ill io ns ) 2007 2008 2009 2010 2011 2012 2013 Hurricane Ike Macondo Incident (6 month deepwater drilling moratorium) Hurricane Issac EC225 Suspension (~25% of Era fleet value on ground for ~9 months)

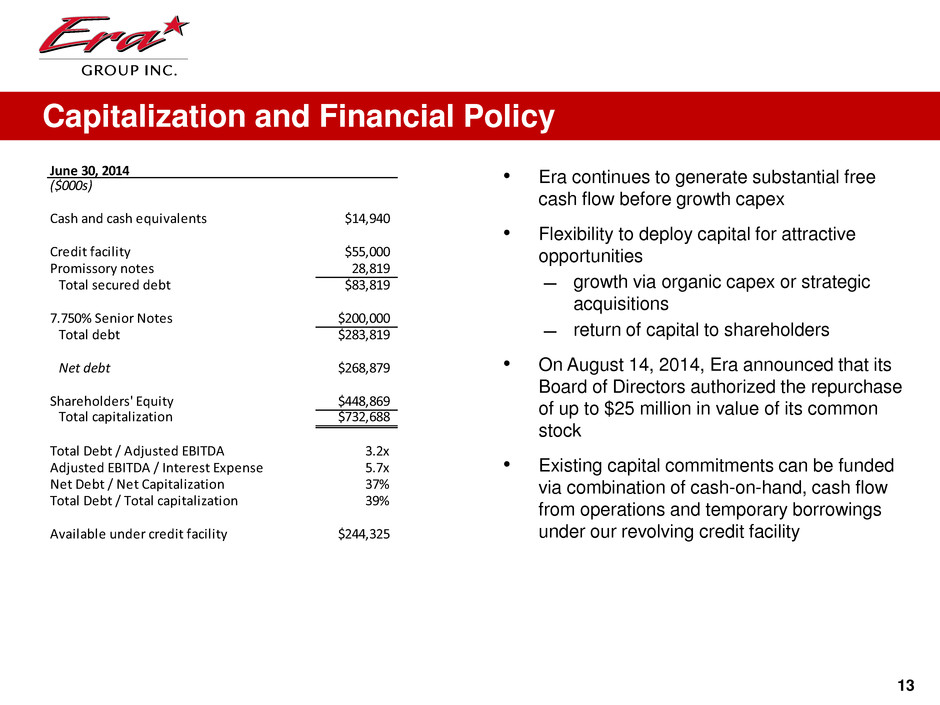
13 • Era continues to generate substantial free cash flow before growth capex • Flexibility to deploy capital for attractive opportunities ̶ growth via organic capex or strategic acquisitions ̶ return of capital to shareholders • On August 14, 2014, Era announced that its Board of Directors authorized the repurchase of up to $25 million in value of its common stock • Existing capital commitments can be funded via combination of cash-on-hand, cash flow from operations and temporary borrowings under our revolving credit facility June 30, 2014 ($000s) Cash and cash equivalents $14,940 Credit facility $55,000 Promissory notes 28,819 Total secured debt $83,819 7.750% Senior Notes $200,000 Total debt $283,819 Net debt $268,879 Shareholders' Equity $448,869 Total capitalization $732,688 Total Debt / Adjusted EBITDA 3.2x Adjusted EBITDA / Interest Expense 5.7x Net Debt / Net Capitalization 37% Total Debt / Total capitalization 39% Available under credit facility $244,325 Capitalization and Financial Policy

14 Net Asset Value $15 $20 $25 $30 $35 $40 $45 $50 Jan-13 Apr-13 Jul-13 Oct-13 Jan-14 May-14 Aug-14 NAV per Share (excl. deferred taxes) Stock Price NAV per Share (net of deferred taxes) Book Value per Share

Appendix 15

16 Owned Joint Ventured Leased-In Managed Total Average Age(a) Heavy: EC225 9 – – – 9 4 Total Heavy 9 – – – 9 Medium: AW139 37 1 – – 38 4 B212 9 – – – 9 36 B412 6 – – – 6 33 S76 A/A++ 2 – – – 2 24 S76 C+/C++ 5 – – 1 6 7 Total Medium 59 1 – 1 61 Light – twin engine: A109 7 – – 2 9 8 BK-117 – – 2 1 3 N/A EC135 17 – 2 1 20 6 EC145 3 – – 2 5 6 Total Light – twin engine 27 – 4 6 37 Light – single engine: A119 17 7 – – 24 8 AS350 35 – – – 35 17 Total Light – single engine 52 7 – – 59 Total Helicopters 147 8 4 7 166 12 Notes: As of 6/30/14. Excludes one AW139 helicopter that was fully paid for and delivered in May 2014 but not yet operational as of June 30, 2014; also excludes orders and options. Effective July 24, 2014, we sold our 51% interest in Lake Palma, which owns the seven A119 helicopters listed as joint-ventured above. (a) Average for owned fleet Fleet Overview

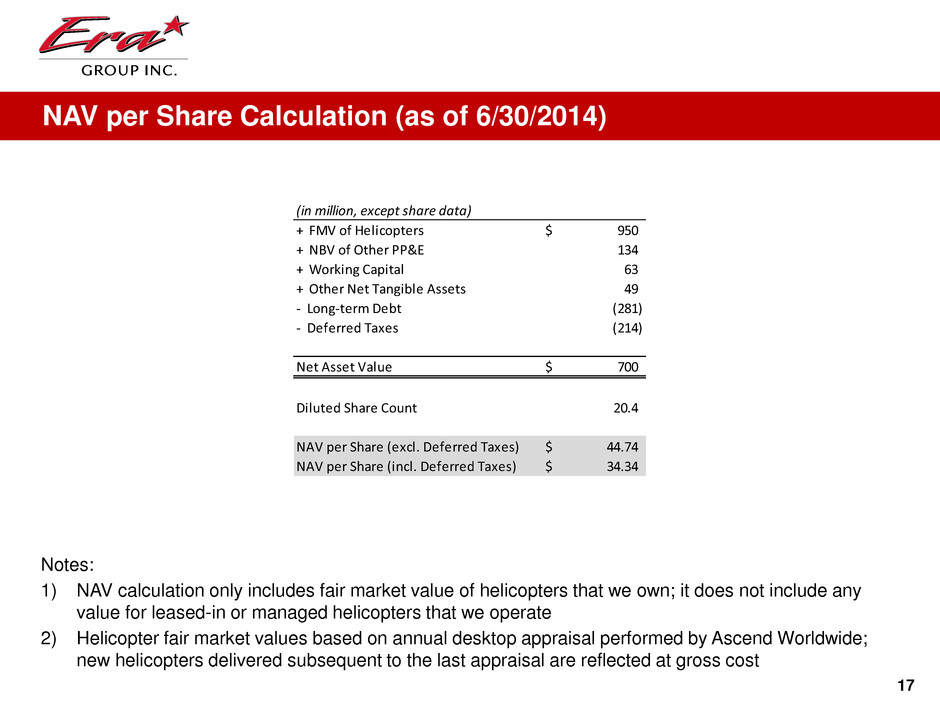
17 Notes: 1) NAV calculation only includes fair market value of helicopters that we own; it does not include any value for leased-in or managed helicopters that we operate 2) Helicopter fair market values based on annual desktop appraisal performed by Ascend Worldwide; new helicopters delivered subsequent to the last appraisal are reflected at gross cost NAV per Share Calculation (as of 6/30/2014) (in million, except share data) + FMV of Helicopters 950$ + NBV of Other PP&E 134 + Working Capital 63 + Other Net Tangible Assets 49 - Long-term Debt (281) - Deferred Taxes (214) Net Asset Value 700$ Diluted Share Count 20.4 NAV per Share (excl. Deferred Taxes) 44.74$ NAV per Share (incl. Deferred Taxes) 34.34$

18 (a) Primarily oil and gas services, but also includes revenues from activities such as firefighting and utility support Operating Revenues by Line of Service Three Months Ended ($000s) 30-Jun-14 31-Mar-14 31-Dec-13 30-Sep-13 30-Jun-13 Oil and gas:(a) U.S. Gulf of Mexico $51,715 $49,141 $45,435 $40,503 $38,443 Alaska 9,305 6,197 6,885 14,003 9,398 International 173 1,245 1,228 1,248 1,278 Total oil and gas $61,193 $56,583 $53,548 $55,754 $49,119 Dry-Leasing 11,466 10,876 11,566 10,376 13,074 Search and rescue 5,095 6,152 5,417 4,614 3,466 Air medical services 3,137 3,091 3,135 3,288 3,131 Flightseeing 2,946 – – 4,390 2,794 FBO 2,858 2,842 2,434 2,671 2,782 Eliminations (115) (101) (102) (96) (129) $86,580 $79,443 $75,998 $80,997 $74,237

19 Note: Does not include hours flown by helicopters in our dry-leasing line of service (a) Primarily oil and gas services, but also includes revenues from activities such as firefighting and utility support Flight Hours by Line of Service Three Months Ended 30-Jun-14 31-Mar-14 31-Dec-13 30-Sep-13 30-Jun-13 Oil and gas:(a) U.S. Gulf of Mexico 11,065 9,447 10,304 10,003 9,676 Alaska 1,122 682 895 2,860 1,405 International – 57 62 60 48 Total oil and gas 12,187 10,186 11,261 12,923 11,129 Search and rescue 258 382 305 299 208 Air medical services 1,100 951 1,059 1,224 1,016 Flightseeing 1,080 – – 1,744 1,134 14,625 11,519 12,625 16,190 13,487

20 (a) See next page for Adjusted EBITDA reconciliation to Net Income (Loss) Fiscal Year 3 Mos. Ended June 30, ($ millions) 2009 2010 2011 2012 2013 2014 2013 Revenue 235.7$ 235.4$ 258.1$ 272.9$ 299.0$ 86.6$ 74.2$ Operating Expenses 148.0 147.2 162.7 167.2 186.6 54.7 46.9 G&A 21.4 25.8 31.9 34.8 38.9 10.1 9.5 Depreciation 37.3 43.4 42.6 42.5 45.6 11.4 11.4 Gains on Asset Dispositions 0.3 0.8 15.2 3.6 18.3 3.1 4.5 Operating Income 29.3 19.8 36.1 32.0 46.2 13.6 10.8 Other Income (Expense): Interest Income 0.1 0.1 0.7 0.9 0.6 0.1 0.2 Interest Expense - (0.1) (1.4) (10.6) (18.1) (3.8) (4.6) Intercompany Interest (20.3) (21.4) (23.4) - - - - Derivative Gains (Losses) 0.3 (0.1) (1.3) (0.5) (0.1) (0.0) 0.0 Note Receivable Impairment - - - - - (2.5) - Foreign Currency Transactions 1.4 (1.5) 0.5 0.7 0.7 0.0 0.3 SEACOR Corporate Charges (5.5) (4.6) (8.8) (2.0) (0.2) - - All Other Income or Expense - - - - - 0.0 0.0 (24.0) (27.6) (33.7) (11.5) (17.1) (6.1) (4.1) Income before Taxes and Equity Earnings 5.3 (7.8) 2.4 20.5 29.1 7.4 6.7 Income Taxes 2.9 (4.3) 0.4 7.3 11.7 2.8 2.4 Income before Equity Earnings 2.4 (3.5) 2.0 13.2 17.4 4.7 4.3 Equity Earnings (0.5) (0.1) 0.1 (5.5) 0.9 0.5 0.7 Net Income 1.9$ (3.6)$ 2.1$ 7.7$ 18.3$ 5.2$ 4.9$ Adjusted EBITDA(a) 67.9$ 61.8$ 82.2$ 78.8$ 95.3$ 25.5$ 23.2$ Adjusted EBITDA Excluding Gains(a) 67.6 61.0 67.0 75.2 77.0 22.4 18.8 Financial Highlights

• Historically, SEACOR charged its corporate costs and overhead charges to all of its operating divisions − These charges have been excluded from Adjusted EBITDA to more accurately reflect Era’s historical results if we had not been a SEACOR subsidiary • Effective as of the spin-off, Era pays SEACOR a fixed fee pursuant to the TSA. The initial annualized fee was $3.4 million. As Era transitions the functions covered by the TSA, the amount paid to SEACOR will be reduced • Adjusted EBITDA reflects special items: – Non-recurring executive severance adjustments of $0.4 million, $4.2 million, and $0.7 million in FY 2010, 2011 and 2012, respectively – An adjustment for IPO related fees and expenses of $2.9 million in FY 2012 – Impairment of our investment in Aeróleo in the first quarter of 2012 ($5.9 million) – A one-time charge related to operating leases on certain air medical helicopters in Q3 2013 of $2.0 million – A pre-tax impairment charge of $2.5 million in Q2 2014 representing a reserve against a note receivable 21 Historical EBITDA and Adjusted EBITDA Fiscal Year 3 Mos. Ended June 30, (USD$ in thousands) 2009 2010 2011 2012 2013 2014 2013 Net Income (Loss) 1,839 (3,639) 2,108 7,747 18,304 5,196 4,950 Depreciation 37,358 43,351 42,612 42,502 45,561 11,425 11,431 Interest Income (52) (109) (738) (910) (591) (143) (150) Interest Expense 13 94 1,376 10,648 18,050 3,840 4,613 Interest Expense on Advances 20,328 21,437 23,410 - - - - Income Tax Expense (Benefit) 2,883 (4,301) 434 7,298 11,727 2,759 2,398 EBITDA 62,369 56,833 69,202 67,285 93,051 23,077 23,242 SEACOR Management Fees 5,481 4,550 8,799 2,000 168 - - Special Items - 379 4,171 9,552 2,045 2,457 - Adjusted EBITDA 67,850 61,762 82,172 78,837 95,264 25,534 23,242 Gains on Asset Dispositions, Net ("Gains") (316) (764) (15,172) (3,612) (18,301) (3,139) (4,476) Adjusted EBITDA Excluding Gains 67,534 60,998 67,000 75,225 76,963 22,395 18,766 Reconciliation of Non-GAAP Financial Measures


