UNITED STATES
SECURITIES AND EXCHANGE COMMISSION
Washington, D.C. 20549
FORM N-CSR
CERTIFIED SHAREHOLDER REPORT OF REGISTERED MANAGEMENT INVESTMENT COMPANIES
Investment Company Act file number 811-22584
Guggenheim Equal Weight Enhanced Equity Income Fund
(Exact name of registrant as specified in charter)
2455 Corporate West Drive, Lisle, IL 60532
(Address of principal executive offices) (Zip code)
Kevin M. Robinson
2455 Corporate West Drive, Lisle, IL 60532
(Name and address of agent for service)
Registrant's telephone number, including area code: (630) 505-3700
Date of fiscal year end: June 30
Date of reporting period: October 27, 2011 – June 30, 2012
Item 1. Reports to Stockholders.
The registrant's annual report transmitted to shareholders pursuant to Rule 30e-1 under the Investment Company Act of 1940, as amended (the “Investment Company Act”), is as follows:

JUNE 30, 2012
GEQ | ANNUAL REPORT
Guggenheim Equal Weight Enhanced Equity
Income Fund
WWW.GUGGENHEIMFUNDS.COM/GEQ
. . .YOUR LINK TO THE LATEST, MOST UP-TO-DATE INFORMATION ABOUT THE GUGGENHEIM
EQUAL WEIGHT ENHANCED EQUITY INCOME FUND
The shareholder report you are reading right now is just the beginning of the story. Online at www.guggenheimfunds.com/geq, you will find:
| · | Daily, weekly and monthly data on share prices, net asset values, distributions and more |
| · | Portfolio overviews and performance analyses |
| · | Announcements, press releases and special notices |
| · | Fund and adviser contact information |
Guggenheim Partners Investment Management, LLC and Guggenheim Funds Investment Advisors, LLC are continually updating and expanding shareholder information services on the Fund’s website, in an ongoing effort to provide you with the most current information about how your Fund’s assets are managed, and the results of our efforts. It is just one more small way we are working to keep you better informed about your investment in the Fund.
June 30, 2012
DEAR SHAREHOLDER
We thank you for your investment in the Guggenheim Equal Weight Enhanced Equity Income Fund (the “Fund”). This report covers the Fund’s performance for the initial fiscal period from the Fund’s inception date of October 27, 2011, through June 30, 2012.
The Fund’s investment objective is to provide a high level of risk-adjusted total return with an emphasis on current income.
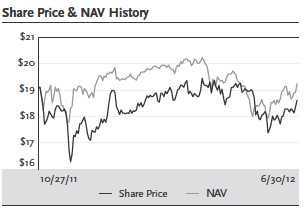
All Fund returns cited—whether based on net asset value (“NAV”) or market price—assume the reinvestment of all distributions. For the initial fiscal period from the Fund’s inception date of October 27, 2011, through June 30, 2012, the Fund returned 5.30% on an NAV basis and -2.57% on a market price basis. The closing price of the Fund’s shares as of June 30, 2012, was $18.61, which represented a discount of 3.27% to the NAV of $19.24. The Fund’s initial public offering price was $20.00 and its NAV at inception was $19.10. Past performance does not guarantee future results. The market price of the Fund’s shares fluctuates from time to time, and it may be higher or lower than the Fund’s NAV.
Guggenheim Funds Investment Advisors, LLC (the “Adviser”) serves as the investment adviser to the Fund. Guggenheim Partners Investment Management, LLC (“GPIM”) serves as the Fund’s Options Strategy Sub-Adviser, responsible for the management of the Fund’s options strategy. Security Investors, LLC serves as the Equity Strategy Sub-Adviser, responsible for managing the underlying equity portfolio. Each of the Adviser and the two sub-advisers is an affiliate of Guggenheim Partners, LLC (“Guggenheim”), a global diversified financial services firm with more than $160 billion in assets under management and supervision.
The Fund seeks to achieve its investment objective primarily through a two-part strategy. Under normal circumstances, the Fund invests substantially all of its managed assets in a portfolio of common stocks included in the S&P 500 Equal Weight™ Index in equal weight. In addition, the Fund utilizes a call option writing strategy to seek to generate current income and potentially mitigate overall portfolio volatility.
In connection with the implementation of its strategy, the Fund currently uses leverage through a credit facility provided by a large multi-national financial institution. As of June 30, 2012, the amount of leverage was approximately 16% of the Fund’s total assets. Although the use of financial leverage by the Fund may create an opportunity for increased return for the common shares, it also results in additional risks and can magnify the effect of any losses. There can be no assurance that a leveraging strategy will be successful during any period during which it is employed.
We encourage shareholders to consider the opportunity to reinvest their distributions from the Fund through the Dividend Reinvestment Plan (“DRIP”), which is described in detail on page 31 of this report. When shares trade at a discount to NAV, the DRIP takes advantage of the discount by reinvesting the quarterly dividend distribution in common shares of the Fund purchased in the market at a price less than NAV. Conversely, when the market price of the Fund’s common shares is at a premium above NAV, the DRIP reinvests participants’ dividends in newly-issued common shares at NAV, subject to an IRS limitation that the purchase price cannot be more than 5% below the market price per share. The DRIP provides a cost-effective means to accumulate additional shares and enjoy the potential benefits of compounding returns over time.
To learn more about the Fund’s performance and investment strategy, we encourage you to read the Questions & Answers section of the report, which begins on page 4.
We appreciate your investment and look forward to serving your investment needs in the future. For the most up-to-date information on your investment, please visit the Fund’s website at www.guggenheimfunds.com/geq.
Sincerely,

Donald C. Cacciapaglia
Chief Executive Officer
Guggenheim Equal Weight Enhanced Equity Income Fund
July 31, 2012
GEQ l GUGGENHEIM EQUAL WEIGHT ENHANCED EQUITY INCOME FUND ANNUAL REPORT l 3
| QUESTIONS & ANSWERS | June 30, 2012 |
Guggenheim Equal Weight Enhanced Equity Income Fund (the “Fund”) is managed by a team of seasoned professionals. Guggenheim Funds Investment Advisors, LLC (the “Adviser”) is responsible for overall management of the Fund. The Fund’s investment sub-adviser responsible for the management of the Fund’s options strategy (“Options Strategy Sub-Adviser”) is Guggenheim Partners Investment Management, LLC (“GPIM”). The options strategy is managed by a team that includes Farhan Sharaff, Assistant Chief Investment Officer; Jayson Flowers, Managing Director; and Jamal Pesaran, CFA, Portfolio Manager.
Security Investors, LLC (“Security Investors”) serves as the sub-adviser responsible for managing the underlying equity portfolio (“Equity Strategy Sub-Adviser”). The team at Security Investors includes Ryan Harder, CFA, Portfolio Manager, and James R. King, CFA, Portfolio Manager.
Each of the Adviser, the Options Strategy Sub-Adviser and the Equity Strategy Sub-Adviser is an affiliate of Guggenheim Partners, LLC (“Guggenheim”), a global diversified financial services firm with more than $160 billion in assets under management.
In the following interview, the investment team discusses the market environment and the Fund’s performance for the initial fiscal period from the Fund’s inception date of October 27, 2011, through June 30, 2012.
Please describe the Fund’s objective and strategy.
The Fund’s investment objective is to provide a high level of risk-adjusted total return with an emphasis on current income.
The Fund seeks to achieve its investment objective primarily through a two-part strategy. Under normal circumstances, the Fund invests substantially all of its managed assets in a portfolio of common stocks included in the S&P 500 Equal Weight™ Index (the “Index”) in equal weight. In addition, the Fund utilizes a call option writing strategy to seek to generate current income and potentially mitigate overall portfolio volatility.
The Index has the same constituents as the S&P 500® Index (“S&P 500”), a capitalization-weighted index comprised of 500 common stocks, chosen by Standard & Poor’s Financial Services LLC on a statistical basis, but each company in the Index is assigned an equal weight instead of being assigned a weight based on the relative market capitalizations of such companies. The Fund’s equity portfolio will be rebalanced quarterly so that each stock in the Fund’s portfolio will have the same target weighting as every other stock in the portfolio. While the Fund generally expects to invest in substantially all of the stocks included in the Index, the Fund may also seek to obtain exposure through investments in other investment funds, other securities and/or financial instruments that are intended to correlate with or replicate the characteristics of exposure to stocks included in the Index or the Index generally.
The Fund utilizes a call option writing strategy to seek to generate current income and potentially mitigate overall portfolio volatility. The Fund’s options strategy follows the Options Strategy Sub-Adviser’s proprietary dynamic rules-based methodology, GPIM’s “Portable Volatility Monetization Strategy”SM. The Options Strategy Sub-Adviser initially expects to implement the Fund’s options strategy by selling (i.e. writing) call options on securities indices, exchange-traded funds (“ETFs”) that track securities indices, baskets of securities and other instruments, which will include securities that are not held by the Fund. As this strategy involves uncovered option writing, it may result in less volatility mitigation than, and may be subject to more risks compared to, option strategies involving writing options on securities held by the Fund. There can be no assurance that the Fund’s use of call options will be successful.
The Fund currently employs leverage through a credit facility provided by a large multi-national financial institution. As of June 30, 2012, the amount of leverage was approximately 16% of the Fund’s total assets. Although the use of financial leverage by the Fund may create an opportunity for increased return for the common shares, it also results in additional risks and can magnify the effect of any losses. If the income and gains earned on securities purchased with the financial leverage proceeds are greater than the cost of the financial leverage, then the common shares’ return will be greater than if financial leverage had not been used. Conversely, if the income and gains from the securities purchased with the financial leverage is less than the cost of the financial leverage then the return on the common shares will be less than if financial leverage, had not been used. There can be no assurance that a leveraging strategy will be implemented or that it will be successful during any period during which it is employed.
Under normal market conditions, the Fund seeks overall portfolio volatility that, after giving effect to the Fund’s option writing strategy and use of leverage, approximates that of the broad equity market. There can be no assurance that the Fund will achieve its investment objective or be able to structure its investments as anticipated.
Please provide an overview of the economic and market environment between the Fund’s inception date and June 30, 2012.
The securities markets, both in the U.S. and around the world, were affected by uncertainties on multiple fronts during the Fund’s initial fiscal period ending June 30, 2012. Although the U.S. economy demonstrated considerable momentum in the closing months of 2011 and the first quarter of 2012, market sentiment turned negative as concerns over the health of the euro member nations and slowing growth in China threatened the global recovery. The market weakened, and investors demonstrated a preference for lower-risk stocks with higher dividend yields.
Recent economic data cast doubt on what had previously appeared to be the movement of the U.S. economy into a self-sustaining expansion in the wake of the worst recession in generations. Retail sales for June were weak, fueling fears that the economy is stalling after gaining ground earlier this year. On the positive side, industrial production and manufacturing output
4 l GEQ l GUGGENHEIM EQUAL WEIGHT ENHANCED EQUITY INCOME FUND ANNUAL REPORT
| QUESTIONS & ANSWERS continued | June 30, 2012 |
edged up in June. There have even been some signs of growth in housing starts, providing the first signs of sustained good news in the housing market in several years.
In late June, the U.S. Department of Commerce confirmed the previous report that gross domestic product (GDP) grew at an annual rate of 1.9% for the first quarter of 2012, following a growth rate of 3.0% in the fourth quarter of 2011. However, a recent survey conducted by the National Association for Business Economics found that 40% of those surveyed believed the economy will grow at a rate of 2% or less over the next year. In the last survey, conducted in April 2012, just 23% expected such slow growth.
The recovery is even more tenuous for international economies. While the European Central Bank has taken temporary measures to postpone an immediate crisis in Europe, structural issues remain due to unsustainable debt levels throughout the peripheral European countries. Financial weakness in Europe will likely cause the euro to continue to weaken against other developed currencies. A recession in Europe will negatively affect emerging market economies, particularly China, which rely heavily on exports.
For the period between the Fund’s inception date of October 27, 2011, and June 30, 2012, the S&P 500, which is generally regarded as an indicator of the broad U.S. stock market, returned 7.68% and the Index returned 4.72%. The underperformance of the Index versus the S&P 500 reflects the strong performance of the largest stocks in the S&P 500 during the period. Most notably, Apple Inc. (0.2% of the Fund’s long-term investments) was up approximately 44% for the period. Also, large pharmaceutical companies, including Pfizer Inc. and Merck & Co., Inc. (0.2% and 0.2%, respectively, of the Fund’s long-term investments), were quite strong.
Recent market conditions indicate that investors are quite fearful, but this perceived fear has not been reflected in the “VIX,” the ticker symbol for the Chicago Board Options Exchange Market Volatility Index, a measure of the implied volatility of S&P 500 options. Often referred to as the “fear index” or the “fear gauge,” it represents a measure of the market’s expectation of stock market volatility. Quoted in percentage points, the VIX represents the expected daily movement in the S&P 500 over the next 30-day period, which is then annualized. A surprising feature of the market during the first half of 2012 was that, even though investors seemed fearful, the VIX never rose above the mid-20s, much lower than recent periods.
Usually when investors are fearful, they sell equities and hold cash or buy government securities. But in recent months, instead of retreating from stocks, investors have rotated into what they perceive to be less risky areas of the equity market, meaning large capitalization stocks. This has created an unusual situation where a high level of demand for the largest stocks has outstripped supply of these shares, with the result that the prices of these stocks have been bid up rather dramatically. Typically, investors expect to give up some return in exchange for safety, but, in this market, the very largest stocks have performed best. The S&P 100 Index, which includes the largest 100 stocks in the S&P 500, returned 9.10% for the period from the Fund’s inception date through June 30, 2012, 140 basis points higher than the S&P 500. Taking it a step further, the Russell Top 50 Index (from a different provider, but essentially the largest 50 stocks), returned 10.66% for the same period.
How did the Fund perform during the period from its inception date through June 30, 2012?
All Fund returns cited—whether based on net asset value (“NAV”) or market price—assume the reinvestment of all distributions. For the initial fiscal period from the Fund’s inception date of October 27, 2011, through June 30, 2012, the Fund returned 5.30% on an NAV basis and -2.57% on a market price basis. The last closing price of the Fund’s shares as of June 30, 2012, was $18.61, which represented a discount of 3.27% to the NAV of $19.24. The Fund’s initial public offering price was $20.00 and its NAV at inception was $19.10. The market value of the Fund’s shares fluctuates from time to time and it may be higher or lower than the Fund’s NAV.
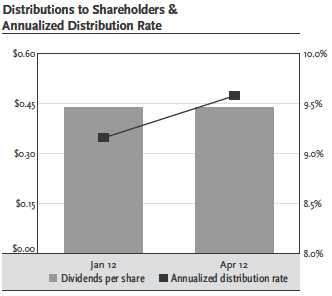
The Fund paid distributions of $0.4375 in January and April 2012. The most recent dividend represents an annualized distribution rate of 9.40% based on the Fund’s last closing market price of $18.61 as of June 30, 2012.
What strategies were important to the Fund’s performance during this period?
As discussed previously, the return of the S&P 500 was higher than the return of the Index during the period covered by this report. Accordingly, the return of the Fund’s underlying portfolio, which replicates the equally-weighted version of the S&P 500, was less than the return of the S&P 500. The dominance of the largest stocks in performance of the S&P 500 meant that the Fund, which has more of a mid-cap portfolio, performed less well than the more familiar capitalization-weighted S&P 500. This underperformance prevailed in all sectors except financial, where ongoing poor performance and negative news from the largest banks resulted in better performance by stocks of smaller financial institutions.
The Fund’s option strategy, which is based on a proprietary dynamic rules-based methodology, contributed positively to the Fund’s performance, enabling the Fund to deliver higher total return and much higher income than the underlying portfolio. This is not a typical covered call strategy, but rather a program of writing call options on securities indices, ETFs and other instruments in such a way as to take advantage of the volatility of the market, selecting for option writing those indices for which investors are paying the greatest risk premiums at any given time, with the customized option portfolio carefully selected to complement the underlying portfolio of securities. This strategy offers investors the dual advantages of receiving income from option premiums and potentially dampening the volatility, of the Fund’s portfolio.
GEQ l GUGGENHEIM EQUAL WEIGHT ENHANCED EQUITY INCOME FUND ANNUAL REPORT l 5
| QUESTIONS & ANSWERS continued | June 30, 2012 |
The program of writing options, mainly selling out-of-the-money calls, generates income equal to approximately 2% of the Fund’s NAV every month. In down markets, the Fund keeps all of this income, providing downside protection; in up markets, of course, some of the capital appreciation is given up due to lack of participation in rising stock prices.
The options portfolio also reduced the risk of the Fund, as measured by standard deviation of returns. Over the period from the Fund’s inception date through June 30, 2012, the standard deviation of the Fund’s NAV return was 15.78%, compared with 17.30% for the S&P 500 Index and 19.17% for the Index.
Since the Fund’s NAV return was positive, and the cost of leverage was less than the NAV return, leverage also contributed positively to performance. Leverage also contributed to income, since the use of leverage made it possible to own more stocks that pay dividends than would be possible without leverage.
Why was the S&P 500 Equal Weight™ Index chosen for the Fund’s portfolio, rather than the more familiar S&P 500 Index?
Because the S&P 500 is weighted by market value, it is extremely top-heavy. The top 50 names represent more than 50% of the weight of the S&P 500, and the single top stock has more weight than the bottom 100 stocks combined. This means that performance of the many smaller companies included in the S&P 500 has very little impact on performance of the S&P 500, and it also means that the weighting of any given stock tends to be at its highest just when the stock is peaking. In contrast, the Index provides broader market representation, with less stock-specific risk. The equal weight approach provides meaningful exposure to the mid-cap companies included in the S&P 500, whereas performance the S&P 500 is dominated by the largest stocks.
It is disappointing that the Fund, like the Index, has underperformed the S&P 500 in recent months. Based on extensive research, Guggenheim believes that, over the long term, the advantages of the Index, which include smaller capitalization and more emphasis on value, will result in better performance than the S&P 500. It is always difficult to determine exactly what is driving market trends, but the recent strong performance of the largest capitalization stocks appears to result from four major factors:
| · | Fear. Investors are skittish and they perceive mega-cap stocks as being safer. |
| · | Valuation. After a decade of underperformance, mega-cap stocks appear cheap relative to mid-caps, based on price-earnings ratios. |
| · | Dividends. Wary investors see dividends as a way to reduce risk, and larger companies pay higher dividends. |
| · | Momentum. Market trends tend to persist. |
How did the Fund’s leverage affect performance during this period?
Since leverage adds to performance when the cost of leverage is less than the total return generated by investments, the use of leverage contributed to the Fund’s total return during this period. The purpose of leverage (borrowing) is to fund the purchase of additional securities that provide increased income and potentially greater appreciation to common shareholders than could be achieved from an unlevered portfolio. Leverage results in greater NAV volatility and entails more downside risk than an unleveraged portfolio.
What is the current outlook for the markets and the Fund, and how is the Fund positioned for this outlook?
Despite recent setbacks in the economy, Guggenheim remains fairly optimistic about the U.S. economy. The aggressive monetary policy of the Federal Reserve (the “Fed”), which is now being reinforced by the European Central Bank, is likely to fuel continued modest economic expansion. The United States has become the economic locomotive of the global economy, and the Fed understands that U.S. growth is necessary to reduce domestic unemployment and to provide support to the struggling economies in Europe and Asia.
With its combination of equity exposure and option writing for current income and potential mitigation of portfolio volatility, Guggenheim believes the Fund is well positioned to provide investors attractive levels of income and positive returns with moderate volatility in a wide variety of market conditions.
Index Definitions
Indices are unmanaged and reflect no expenses. It is not possible to invest directly in an index.
The Chicago Board Options Exchange Market Volatility Index is a key measure of market expectations of near-term volatility conveyed by the S&P 500 stock index option prices.
The Standard & Poor’s 100 Index is a subset of the S&P 500 which includes 100 leading U.S. stocks with exchange-listed options.
The Standard & Poor’s 500 Index is a capitalization-weighted index of 500 stocks. The index is designed to measure performance of the broad domestic economy through changes in the aggregate market value of 500 stocks representing all major industries.
The Standard & Poor’s 500 Equal Weight Index has the same constituents as the S&P 500, but each company is assigned a fixed equal weight.
The Russell Top 50 Index measures the performance of the largest companies in the Russell 3000® Index. It includes approximately 50 of the largest securities based on a combination of their market cap and current index membership and represents approximately 40% of the total market capitalization of the Russell 3000.
The Russell 3000 Index measures the performance of the largest 3000 U.S. companies representing approximately 98% of the investable U.S. equity market.
6 l GEQ l GUGGENHEIM EQUAL WEIGHT ENHANCED EQUITY INCOME FUND ANNUAL REPORT
June 30, 2012
Risks and Other Considerations
The views expressed in this report reflect those of the portfolio managers only through the report period as stated on the cover. These views are subject to change at any time, based on market and other conditions and should not be construed as a recommendation of any kind. The material may also include forward looking statements that involve risk and uncertainty, and there is no guarantee that any predictions will come to pass. There can be no assurance that the Fund will achieve its investment objectives. The value of the Fund will fluctuate with the value of the underlying securities. Historically, closed-end funds often trade at a discount to their net asset value.
Common Stock Risk
Although common stocks have historically generated higher average total returns than debt securities over the long-term, common stocks also have experienced significantly more volatility in those returns and, in certain periods, have significantly under-performed relative to debt securities. The price of common stocks is sensitive to general movements in the stock market and a drop in the stock market may depress the price of common stocks to which the Fund has exposure. Common stock prices fluctuate for several reasons, including changes in investors’ perceptions of the financial condition of an issuer or the general condition of the relevant stock market or when political or economic events affecting the issuers occur. They may also decline due to factors which affect a particular industry or industries, such as labor shortages or increased production costs and competitive conditions within an industry. The value of a particular common stock held by the Fund may decline for a number of other reasons which directly relate to the issuer, such as management performance, financial leverage, the issuer’s historical and prospective earnings, the value of its assets and reduced demand for its goods and services. In addition, common stock prices may be particularly sensitive to rising interest rates, as the cost of capital rises and borrowing costs increase. Common stock in which the Fund may invest is structurally subordinated to preferred stock, bonds and other debt instruments in a company’s capital structure in terms of priority to corporate income and is therefore inherently more risky than preferred securities or debt instruments of such issuers.
Options Risk
The Fund will implement a call option writing strategy using GPIM’s proprietary options overlay strategy to generate current income from cash premiums received from selling options on securities indices, ETFs and baskets of securities, which will include securities that are not held by the Fund. As this strategy involves uncovered option writing, it may result in less volatility mitigation than, and may be subject to more risks compared to, option strategies involving writing options on securities held by the Fund. Under normal market conditions, the Fund seeks overall portfolio volatility that, after giving effect to the Fund’s option writing strategy and use of leverage, approximates that of the broad equity market. There are various risks associated with the Fund’s call option writing strategy. The purchaser of an index option written by the Fund has the right to any appreciation in the cash value of the index over the strike price on the expiration date. Therefore, as the writer of a covered index call option, the Fund forgoes the opportunity to profit from increases in the index over the strike price of the option. However, the Fund has retained the risk of loss (net of premiums received) should the price of the index decline. Similarly, as the writer of a covered call option on a security or basket of securities held in the Fund’s portfolio, the Fund forgoes, during the option’s life, the opportunity to profit from increases in the market value of the security or securities covering the call option above the sum of the premium and the exercise price of the call but has retained the risk of loss (net of premiums received) should the price of the underlying security decline.
There are special risks associated with uncovered option writing (i.e. writing options on securities not held in the Fund’s portfolio, on indices or on exchange traded funds comprised of such securities or that track such indices), which expose the Fund to potentially significant loss. As the writer of an uncovered call option, the Fund has no risk of loss should the price of the underlying security or index decline, but bears unlimited risk of loss should the price of the underlying security or index increase above the exercise price.
The value of options written by the Fund, which will be priced daily, will be affected by, among other factors, changes in the value of underlying securities (including those comprising an index), changes in the dividend rates of underlying securities, changes in interest rates, changes in the actual or perceived volatility of the stock market and underlying securities and the remaining time to an option’s expiration. The value of an option also may be adversely affected if the market for the option is reduced or becomes less liquid.
There are significant differences between the securities and options markets that could result in an imperfect correlation between these markets, causing a given transaction not to achieve its objectives. A decision as to whether, when and how to use options involves the exercise of skill and judgment, and even a well-conceived transaction may be unsuccessful to some degree because of market behavior or unexpected events. To the extent that there is a lack of correlation between the index options written by the Fund and the Fund’s portfolio securities, movements in the indexes underlying the options positions may result in losses to the Fund, which may more than offset any gains received by the Fund from options premiums. In these and other circumstances, the Fund may be required to sell portfolio securities to satisfy its obligations as the writer of an index call option, when it would not otherwise choose to do so, or may choose to sell portfolio securities to realize gains to supplement Fund distributions. Such sales would involve transaction costs borne by the Fund and may also result in realization of taxable capital gains, including short-term capital gains taxed at ordinary income tax rates, and may adversely impact the Fund’s after-tax returns.
There can be no assurance that a liquid market will exist when the Fund seeks to close out an option position. Reasons for the absence of a liquid secondary market on an exchange include the following: (i) there may be insufficient trading interest in certain options; (ii) restrictions may be imposed by an exchange on opening transactions or closing transactions or both; (iii) trading halts, suspensions or other restrictions may be imposed with respect to particular classes or series of options; (iv) unusual or unforeseen circumstances may interrupt normal operations on an exchange; (v) the facilities of an exchange or The Options Clearing Corporation (the “OCC”) may not at all times be adequate to handle current trading volume; or (vi) one or more exchanges could, for economic or other reasons, decide or be compelled at some future date to discontinue the trading of options (or a particular class or series of options). If trading were discontinued, the secondary market on that exchange (or in that class or series of options) would cease to exist. However, outstanding options on that exchange that had been issued by the OCC as a result of trades on that exchange would continue to be exercisable in accordance with their terms. In the event that the Fund were unable to close out a call option that it had written on a portfolio security, it would not be able to sell the underlying security unless the option expired without exercise. To the extent that the Fund owns unlisted (or “over-the-counter”) options, the Fund’s ability to terminate these options may be more limited than with exchange-traded options and may involve enhanced risk that counterparties participating in such transactions will not fulfill their obligations.
GEQ l GUGGENHEIM EQUAL WEIGHT ENHANCED EQUITY INCOME FUND ANNUAL REPORT l 7
June 30, 2012
The hours of trading for options may not conform to the hours during which the underlying securities for such options are traded. To the extent that the options markets close before the markets for the underlying securities, significant price and rate movements can take place in the underlying markets that cannot be reflected in the options markets. Additionally, the exercise price of an option may be adjusted downward before the option’s expiration as a result of the occurrence of certain corporate events affecting the underlying securities, such as extraordinary dividends, stock splits, mergers or other extraordinary distributions or events. A reduction in the exercise price of an option might reduce the Fund’s capital appreciation potential on underlying securities held by the Fund.
The Fund’s options transactions will be subject to limitations established by each of the exchanges, boards of trade or other trading facilities on which the options are traded. These limitations govern the maximum number of options in each class which may be written or purchased by a single investor or group of investors acting in concert, regardless of whether the options are written or purchased on the same or different exchanges, boards of trade or other trading facilities or are held or written in one or more accounts or through one or more brokers. Thus, the number of options which the Fund may write or purchase may be affected by options written or purchased by other investment advisory clients of the Sub-Advisers. An exchange, board of trade or other trading facility may order the liquidation of positions found to be in excess of these limits, and it may impose other sanctions.
Major exchanges on which options and futures are traded have established limits on how much an option or futures contract may decline over various periods of time. If the price of an option increases or decreases more than the established limit, trading in the contract may be suspended for set periods of time. If trading is suspended, the Fund may be unable to purchase or sell options or futures contracts at times that may be desirable or advantageous for the Fund to do so. Trading suspensions may limit the Fund’s ability to achieve its investment objective. The Fund also may be required, in these instances, to “fair value” any options and futures contracts that it currently owns.
Although the Fund will generally write options each month, the Options Strategy Sub-Adviser may vary the times when it writes the options when the Options Strategy Sub-Adviser believes it is in the best interest of the Fund to do so (including by not writing options in a particular month or months). Varying the timing of when the Fund will write options may not have the intended effect and the Fund may sustain losses.
Income on options on individual stocks will not be recognized by the Fund for tax purposes until an option is exercised, lapses or is subject to a “closing transaction” (as defined by applicable regulations) pursuant to which the Fund’s obligations with respect to the option are otherwise terminated. If the option lapses without exercise or is otherwise subject to a closing transaction, the premiums received by the Fund from the writing of such options will generally be characterized as short-term capital gain. If an option written by the Fund is exercised, the Fund may recognize taxable gain depending on the exercise price of the option, the option premium, and the fair market value of the security underlying the option. The character of any gain on the sale of the underlying security as short-term or long-term capital gain will depend on the holding period of the Fund in the underlying security. In general, distributions received by shareholders of the Fund that are attributable to short-term capital gains recognized by the Fund from its option writing activities will be taxed to such shareholders as ordinary income and will not be eligible for the reduced tax rate applicable to qualified dividend income.
Options on indices of securities and sectors of securities that qualify as “section 1256 contracts” will generally be “marked-to-market” for U.S. federal income tax purposes. As a result, the Fund will generally recognize gain or loss on the last day of each taxable year equal to the difference between the value of the option on that date and the adjusted basis of the option. The adjusted basis of the option will consequently be increased by such gain or decreased by such loss. Any gain or loss with respect to options on indices and sectors that qualify as “section 1256 contracts” will be treated as short-term capital gain or loss to the extent of 40% of such gain or loss and long-term capital gain or loss to the extent of 60% of such gain or loss. Because the mark-to-market rules may cause the Fund to recognize gain in advance of the receipt of cash, the Fund may be required to dispose of investments in order to meet its distribution requirements. Mark-to-market losses may be suspended or otherwise limited if such losses are part of a straddle or similar transaction.
Financial Leverage Risk
Use of financial leverage creates an opportunity for increased income and capital appreciation but, at the same time, creates special risks, including increasing the Fund’s overall portfolio volatility. Under normal market conditions, the Fund seeks overall portfolio volatility that, after giving effect to the Fund’s option writing strategy and use of leverage, approximates that of the broad equity market. There can be no assurance that a leveraging strategy will be utilized or will be successful.
The use of financial leverage is a speculative technique that exposes the Fund to greater risk and increased costs than if it were not implemented. Financial leverage involves risks and special considerations for common shareholders, including:
• the likelihood of greater volatility of net asset value and dividend rate of the common shares than a comparable portfolio without financial leverage;
• the risk that fluctuations in interest rates on borrowings and short-term debt or in the interest or dividend rates on any financial leverage that the Fund must pay will reduce the return to common shareholders;
• the effect of financial leverage in a declining market may result in a greater decline in the net asset value of the common shares than if the Fund were not leveraged;
• when the Fund uses financial leverage, the investment advisory fees payable to the Adviser and Sub- Advisers will be higher than if the Fund did not use financial leverage; and
• financial leverage may increase operating costs, which may reduce total return.
The Fund will have to pay interest on its indebtedness, if any, which may reduce the Fund’s returns. This interest expense may be greater than the Fund’s return on the underlying investment. Certain types of indebtedness subject the Fund to covenants in credit agreements relating to asset coverage and portfolio composition requirements. Certain indebtedness issued by the Fund also may subject the Fund to certain restrictions on investments imposed by guidelines of one or more rating agencies, which may issue ratings for such indebtedness. Such guidelines may impose asset coverage or portfolio composition requirements that are more stringent than those imposed by the Investment Company Act of 1940, as amended. It is not anticipated that these covenants or guidelines will impede the Sub-Advisers from managing the Fund’s portfolio in accordance with the Fund’s investment objective and policies.
During the time in which the Fund is utilizing financial leverage, the amount of the fees paid to the Adviser and the Sub-Advisers for investment advisory services will be higher than if the Fund did not utilize financial leverage
8 l GEQ l GUGGENHEIM EQUAL WEIGHT ENHANCED EQUITY INCOME FUND ANNUAL REPORT
June 30, 2012
because the fees paid will be calculated based on the Fund’s Managed Assets, including proceeds of financial leverage. This may create a conflict of interest between the Adviser and the Sub-Advisers, on the one hand, and the common shareholders, on the other hand. Common shareholders bear the portion of the investment advisory fee attributable to the assets purchased with the proceeds of financial leverage, which means that common shareholders effectively bear the entire advisory fee. In order to manage this conflict of interest, the Board of Trustees will receive regular reports from the Adviser and the Sub-Advisers regarding the Fund’s use of financial leverage and the effect of financial leverage on the management of the Fund’s portfolio and the performance of the Fund.
In addition, the Fund may engage in certain derivative transactions, including swaps, that have characteristics similar to leverage. To the extent the terms of any such transaction obligate the Fund to make payments, the Fund intends to earmark or segregate cash or liquid securities in an amount at least equal to the current value of the amount then payable by the Fund under the terms of such transaction in accordance with applicable interpretations of the staff of the SEC. To the extent the terms of any such transaction obligate the Fund to deliver particular securities to extinguish the Fund’s obligations under such transactions, the Fund may “cover” its obligations under such transaction by either (i) owning the securities or collateral underlying such transactions or (ii) having an absolute and immediate right to acquire such securities or collateral without additional cash consideration (or, if additional cash consideration is required, having earmarked or segregated cash or liquid securities). Securities so segregated or designated as “cover” will be unavailable for sale by the Sub-Advisers (unless replaced by other securities qualifying for segregation or cover requirements), which may adversely effect the ability of the Fund to pursue its investment objective.
Strategic Transactions Risk
The Fund may engage in various strategic transactions, including derivatives transactions involving interest rate and foreign currency transactions, swaps, options and futures, for hedging and risk management purposes and to enhance total return. Strategic transactions involve risks, including the imperfect correlation between the value of such instruments and the underlying assets, the possible default of the other party to the transaction and illiquidity of the derivative instruments. Furthermore, the Fund’s ability to successfully use strategic transactions depends on the Sub-Advisers’ ability to predict pertinent market movements, which cannot be assured. The use of strategic transactions may result in losses greater than if they had not been used, may require the Fund to sell or purchase portfolio securities at inopportune times or for prices other than current market values, may limit the amount of appreciation the Fund can realize on an investment or may cause the Fund to hold a security that it might otherwise sell. Additionally, amounts paid by the Fund as premiums and cash or other assets held in margin accounts with respect to strategic transactions are not otherwise available to the Fund for investment purposes.
Counterparty Risk
The Fund will be subject to credit risk with respect to the counterparties to the derivative contracts purchased by the Fund. If a counterparty becomes bankrupt or otherwise fails to perform its obligations under a derivative contract due to financial difficulties, the Fund may experience significant delays in obtaining any recovery under the derivative contract in bankruptcy or other reorganization proceeding. The Fund may obtain only a limited recovery or may obtain no recovery in such circumstances.
Synthetic Investment Risk
As an alternative to holding investments directly, the Fund may also obtain investment exposure through the use of derivative instruments (including swaps, options, forwards, notional principal contracts or customized derivative or financial instruments) to replicate, modify or replace the economic attributes associated with an investment in securities in which the Fund may invest. The Fund may be exposed to certain additional risks should the Sub-Advisers use derivatives as a means to synthetically implement the Fund’s investment strategies. If the Fund enters into a derivative instrument whereby it agrees to receive the return of a security or financial instrument or a basket of securities or financial instruments, it will typically contract to receive such returns for a predetermined period of time. During such period, the Fund may not have the ability to increase or decrease its exposure. In addition, customized derivative instruments will likely be highly illiquid, and it is possible that the Fund will not be able to terminate such derivative instruments prior to their expiration date or that the penalties associated with such a termination might impact the Fund’s performance in a materially adverse manner. Furthermore, derivative instruments typically contain provisions giving the counterparty the right to terminate the contract upon the occurrence of certain events. Such events may include a decline in the value of the reference securities and material violations of the terms of the contract or the portfolio guidelines as well as other events determined by the counter-party. If a termination were to occur, the Fund’s return could be adversely affected as it would lose the benefit of the indirect exposure to the reference securities and it may incur significant termination expenses.
Investment Funds Risk
Investments in other investment funds present certain special considerations and risks not present in making direct investments in securities in which the Fund may invest. Investments in investment funds involve operating expenses and fees that are in addition to the expenses and fees borne by the Fund. Such expenses and fees attributable to the Fund’s investments in investment funds are borne indirectly by common shareholders. Accordingly, investment in such entities involves expense and fee layering. Investments in investment funds may expose the Fund to an additional layer of financial leverage. To the extent management fees of investment funds are based on total gross assets, it may create an incentive for such entities’ managers to employ financial leverage, thereby adding additional expense and increasing volatility and risk.
Recent Market Developments Risk. Global and domestic financial markets have experienced periods of unprecedented turmoil. Recently, markets have witnessed more stabilized economic activity as expectations for an economic recovery increased. However, risks to a robust resumption of growth persist. Continuing uncertainty as to the status of the euro and the European Monetary Union has created significant volatility in currency and financial markets generally. A return to unfavorable economic conditions or sustained economic slowdown could adversely impact the Fund’s portfolio. Financial market conditions, as well as various social and political tensions in the United States and around the world, have contributed to increased market volatility and may have long-term effects on the United States and worldwide financial markets and cause further economic uncertainties or deterioration in the United States and worldwide. The Adviser and Sub-Adviser do not know how long the financial markets will continue to be affected by these events and cannot predict the effects of these or similar events in the future on the United States and global economies and securities markets.
Please see www.guggenheimfunds.com/geq for a more detailed discussion about Fund risks and considerations.
GEQ l GUGGENHEIM EQUAL WEIGHT ENHANCED EQUITY INCOME FUND ANNUAL REPORT l 9
| FUND SUMMARY (Unaudited) | June 30, 2012 |
| Fund Statistics | ||
| Share Price | $18.61 | |
| Common Share Net Asset Value | $19.24 | |
| Premium/(Discount) to NAV | -3.27% | |
| Net Assets ($000) | $168,444 | |
| Total Returns | ||
| (Inception 10/27/11) | Market | NAV |
| Since Inception - Cumulative | -2.57% | 5.30% |
Performance data quoted represents past performance, which is no guarantee of future results and current performance may be lower or higher than the figures shown. For the most recent month-end performance figures, please visit www.guggenheimfunds.com/geq. The investment return and principal value of an investment will fluctuate with changes in the market conditions and other factors so that an investor’s shares, when sold, may be worth more or less than their original cost.
| % of | |
| Portfolio Composition | Net Assets |
| Common Stocks | 121.3% |
| Short-Term Investments | 2.3% |
| Total Investments | 123.6% |
| Total Value of Options Written | -3.3% |
| Liabilities in excess of Other Assets | -0.1% |
| Borrowings | -20.2% |
| Net Assets | 100.0% |
| % of Long-Term | |
| Sector Breakdown* | Investments |
| Consumer, Non-cyclical | 20.2% |
| Financial | 16.2% |
| Consumer, Cyclical | 12.7% |
| Industrial | 12.2% |
| Technology | 10.0% |
| Energy | 9.1% |
| Communications | 8.3% |
| Utilities | 5.9% |
| Basic Materials | 5.2% |
| Diversified | 0.2% |
*Securities are classified by sectors that represent broad groupings of industries.
Portfolio composition and sector breakdown are subject to change daily. For more information, please visit www.guggenheimfunds.com/geq. The above summaries are provided for informational purposes only and should not be viewed as recommendations. Past performance does not guarantee future results.
10 l GEQ l GUGGENHEIM EQUAL WEIGHT ENHANCED EQUITY INCOME FUND ANNUAL REPORT
| PORTFOLIO OF INVESTMENTS | June 30, 2012 |
| Number | |||
| of Shares | Description | Value | |
| Common Stocks – 121.3% | |||
| Basic Materials – 6.3% | |||
| 4,998 | Air Products & Chemicals, Inc.(a) | $ 403,489 | |
| 4,620 | Airgas, Inc.(a) | 388,126 | |
| 46,704 | Alcoa, Inc.(a) | 408,660 | |
| 13,133 | Allegheny Technologies, Inc.(a) | 418,811 | |
| 2,334 | CF Industries Holdings, Inc.(a) | 452,188 | |
| 8,159 | Cliffs Natural Resources, Inc.(a) | 402,157 | |
| 12,393 | Dow Chemical Co.(a) | 390,380 | |
| 8,338 | Eastman Chemical Co.(a) | 419,985 | |
| 5,981 | Ecolab, Inc.(a) | 409,878 | |
| 8,038 | EI du Pont de Nemours & Co.(a) | 406,482 | |
| 7,662 | FMC Corp.(a) | 409,764 | |
| 11,762 | Freeport-McMoRan Copper & Gold, Inc.(a) | 400,731 | |
| 7,043 | International Flavors & Fragrances, Inc.(a) | 385,956 | |
| 13,595 | International Paper Co.(a) | 393,031 | |
| 14,216 | MeadWestvaco Corp.(a) | 408,710 | |
| 5,012 | Monsanto Co.(a) | 414,893 | |
| 8,207 | Mosaic Co.(a) | 449,415 | |
| 7,915 | Newmont Mining Corp.(a) | 383,957 | |
| 10,690 | Nucor Corp.(a) | 405,151 | |
| 3,838 | PPG Industries, Inc.(a) | 407,289 | |
| 3,756 | Praxair, Inc.(a) | 408,390 | |
| 3,028 | Sherwin-Williams Co.(a) | 400,756 | |
| 5,629 | Sigma-Aldrich Corp.(a) | 416,152 | |
| 34,935 | Titanium Metals Corp.(a) | 395,115 | |
| 20,801 | United States Steel Corp.(a) | 428,501 | |
| 11,625 | Vulcan Materials Co.(a) | 461,629 | |
| 10,669,596 | |||
| Communications – 10.1% | |||
| 1,820 | Amazon.Com, Inc.(a) (b) | 415,597 | |
| 11,518 | AT&T, Inc.(a) | 410,732 | |
| 34,452 | Cablevision Systems Corp., Class A(a) | 457,866 | |
| 12,341 | CBS Corp., Class B(a) | 404,538 | |
| 10,630 | CenturyLink, Inc.(a) | 419,779 | |
| 23,786 | Cisco Systems, Inc.(a) | 408,406 | |
| 13,145 | Comcast Corp., Class A(a) | 420,246 | |
| 30,305 | Corning, Inc.(a) | 391,844 | |
| 7,119 | Crown Castle International Corp.(a) (b) | 417,601 | |
| 9,023 | DIRECTV, Class A(a) (b) | 440,503 | |
| 7,799 | Discovery Communications, Inc., Class A(a) (b) | 421,146 | |
| 9,693 | eBay, Inc.(a) (b) | 407,203 | |
| 8,316 | Expedia, Inc.(a) | 399,750 | |
| 3,886 | F5 Networks, Inc.(a) (b) | 386,890 | |
| 115,338 | Frontier Communications Corp.(a) | 441,744 |
| Number | |||
| of Shares | Description | Value | |
| 31,282 | Gannett Co., Inc.(a) | $ 460,783 | |
| 686 | Google, Inc., Class A(a) (b) | 397,928 | |
| 9,739 | Harris Corp.(a) | 407,577 | |
| 36,708 | Interpublic Group of Cos., Inc.(a) | 398,282 | |
| 37,824 | JDS Uniphase Corp.(a) (b) | 416,064 | |
| 23,559 | Juniper Networks, Inc.(a) (b) | 384,247 | |
| 9,144 | McGraw-Hill Cos., Inc.(a) | 411,480 | |
| 64,701 | MetroPCS Communications, Inc.(a) (b) | 391,441 | |
| 8,187 | Motorola Solutions, Inc.(a) | 393,877 | |
| 6,062 | Netflix, Inc.(a) (b) | 415,065 | |
| 20,469 | News Corp., Class A(a) | 456,254 | |
| 8,279 | Omnicom Group, Inc.(a) | 402,359 | |
| 617 | priceline.com, Inc.(a) (b) | 410,009 | |
| 7,053 | Scripps Networks Interactive, Inc., Class A(a) | 401,034 | |
| 133,529 | Sprint Nextel Corp.(a) (b) | 435,304 | |
| 27,311 | Symantec Corp.(a) (b) | 399,014 | |
| 5,231 | Time Warner Cable, Inc.(a) | 429,465 | |
| 11,295 | Time Warner, Inc.(a) | 434,858 | |
| 9,250 | TripAdvisor, Inc.(a) (b) | 413,383 | |
| 9,996 | VeriSign, Inc.(a) (b) | 435,526 | |
| 9,377 | Verizon Communications, Inc.(a) | 416,714 | |
| 8,352 | Viacom, Inc., Class B(a) | 392,711 | |
| 8,605 | Walt Disney Co.(a) | 417,343 | |
| 1,092 | Washington Post Co., Class B(a) | 408,211 | |
| 42,514 | Windstream Corp.(a) | 410,685 | |
| 25,427 | Yahoo!, Inc.(a) (b) | 402,509 | |
| 16,985,968 | |||
| Consumer, Cyclical – 15.4% | |||
| 12,373 | Abercrombie & Fitch Co., Class A(a) | 422,415 | |
| 10,690 | AutoNation, Inc.(a) (b) | 377,143 | |
| 1,031 | AutoZone, Inc.(a) (b) | 378,552 | |
| 5,619 | Bed Bath & Beyond, Inc.(a) (b) | 347,254 | |
| 19,916 | Best Buy Co., Inc.(a) | 417,439 | |
| 10,316 | Big Lots, Inc.(a) (b) | 420,790 | |
| 5,841 | BorgWarner, Inc.(a) (b) | 383,111 | |
| 14,136 | CarMax, Inc.(a) (b) | 366,688 | |
| 12,047 | Carnival Corp. (Panama)(a) | 412,851 | |
| 977 | Chipotle Mexican Grill, Inc.(a) (b) | 371,211 | |
| 10,939 | Cintas Corp.(a) | 422,355 | |
| 6,217 | Coach, Inc.(a) | 363,570 | |
| 4,485 | Costco Wholesale Corp.(a) | 426,075 | |
| 8,864 | CVS Caremark Corp.(a) | 414,215 | |
| 7,954 | Darden Restaurants, Inc.(a) | 402,711 | |
| 7,456 | Dollar Tree, Inc.(a) (b) | 401,133 |
See notes to financial statements.
GEQ l GUGGENHEIM EQUAL WEIGHT ENHANCED EQUITY INCOME FUND ANNUAL REPORT l 11
| PORTFOLIO OF INVESTMENTS continued | June 30, 2012 |
| Number | |||
| of Shares | Description | Value | |
| Consumer, Cyclical (continued) | |||
| 24,916 | DR Horton, Inc.(a) | $ 457,956 | |
| 5,718 | Family Dollar Stores, Inc.(a) | 380,133 | |
| 9,880 | Fastenal Co.(a) | 398,263 | |
| 37,329 | Ford Motor Co.(a) | 357,985 | |
| 5,225 | Fossil, Inc.(b) | 399,922 | |
| 20,911 | GameStop Corp., Class A(a) | 383,926 | |
| 15,165 | Gap, Inc.(a) | 414,914 | |
| 6,460 | Genuine Parts Co.(a) | 389,215 | |
| 37,933 | Goodyear Tire & Rubber Co.(a) (b) | 447,989 | |
| 8,177 | Harley-Davidson, Inc.(a) | 373,934 | |
| 9,926 | Harman International Industries, Inc.(a) | 393,070 | |
| 11,534 | Hasbro, Inc.(a) | 390,657 | |
| 7,600 | Home Depot, Inc.(a) | 402,724 | |
| 28,752 | International Game Technology(a) | 452,844 | |
| 15,803 | JC Penney Co., Inc.(a) | 368,368 | |
| 13,507 | Johnson Controls, Inc.(a) | 374,279 | |
| 8,828 | Kohl’s Corp.(a) | 401,586 | |
| 14,988 | Lennar Corp., Class A(a) | 463,279 | |
| 9,297 | Limited Brands, Inc., Class A(a) | 395,401 | |
| 14,251 | Lowe’s Cos., Inc.(a) | 405,298 | |
| 10,694 | Macy’s, Inc.(a) | 367,339 | |
| 10,527 | Marriott International, Inc., Class A(a) | 412,658 | |
| 12,556 | Mattel, Inc.(a) | 407,316 | |
| 4,534 | McDonald’s Corp.(a) | 401,395 | |
| 22,118 | Newell Rubbermaid, Inc.(a) | 401,221 | |
| 3,663 | NIKE, Inc., Class B(a) | 321,538 | |
| 8,159 | Nordstrom, Inc.(a) | 405,421 | |
| 4,057 | O’Reilly Automotive, Inc.(a) (b) | 339,855 | |
| 10,304 | PACCAR, Inc.(a) | 403,814 | |
| 44,312 | Pulte Group, Inc.(a) (b) | 474,139 | |
| 2,744 | Ralph Lauren Corp.(a) | 384,325 | |
| 6,170 | Ross Stores, Inc.(a) | 385,440 | |
| 7,612 | Sears Holdings Corp.(a) (b) | 454,436 | |
| 43,920 | Southwest Airlines Co.(a) | 404,942 | |
| 30,942 | Staples, Inc.(a) | 403,793 | |
| 7,425 | Starbucks Corp.(a) | 395,901 | |
| 7,640 | Starwood Hotels & Resorts Worldwide, Inc.(a) | 405,226 | |
| 6,721 | Target Corp.(a) | 391,095 | |
| 7,198 | Tiffany & Co.(a) | 381,134 | |
| 9,598 | TJX Cos., Inc.(a) | 412,042 | |
| 14,397 | Urban Outfitters, Inc.(a) (b) | 397,213 | |
| 2,849 | VF Corp.(a) | 380,199 | |
| 12,769 | Walgreen Co.(a) | 377,707 | |
| 5,833 | Wal-Mart Stores, Inc.(a) | 406,677 |
| Number | |||
| of Shares | Description | Value | |
| 6,542 | Whirlpool Corp.(a) | $ 400,108 | |
| 2,095 | WW Grainger, Inc.(a) | 400,647 | |
| 7,843 | Wyndham Worldwide Corp.(a) | 413,640 | |
| 3,818 | Wynn Resorts Ltd.(a) | 396,003 | |
| 6,160 | Yum! Brands, Inc.(a) | 396,827 | |
| 25,901,307 | |||
| Consumer, Non-cyclical – 24.6% | |||
| 6,430 | Abbott Laboratories(a) | 414,542 | |
| 9,202 | Aetna, Inc.(a) | 356,762 | |
| 4,305 | Alexion Pharmaceuticals, Inc.(b) | 427,487 | |
| 4,349 | Allergan, Inc.(a) | 402,587 | |
| 12,091 | Altria Group, Inc.(a) | 417,744 | |
| 10,738 | AmerisourceBergen Corp.(a) | 422,540 | |
| 5,778 | Amgen, Inc.(a) | 422,025 | |
| 11,376 | Apollo Group, Inc., Class A(a) (b) | 411,697 | |
| 12,493 | Archer Daniels Midland Co.(a) | 368,793 | |
| 7,413 | Automatic Data Processing, Inc.(a) | 412,608 | |
| 14,050 | Avery-Dennison Corp.(a) | 384,127 | |
| 25,043 | Avon Products, Inc.(a) | 405,947 | |
| 7,861 | Baxter International, Inc.(a) | 417,812 | |
| 6,496 | Beam, Inc.(a) | 405,935 | |
| 5,432 | Becton, Dickinson & Co.(a) | 406,042 | |
| 2,980 | Biogen Idec, Inc.(a) (b) | 430,253 | |
| 69,687 | Boston Scientific Corp.(a) (b) | 395,125 | |
| 11,577 | Bristol-Myers Squibb Co.(a) | 416,193 | |
| 4,461 | Brown-Forman Corp., Class B(a) | 432,048 | |
| 12,544 | Campbell Soup Co.(a) | 418,719 | |
| 9,496 | Cardinal Health, Inc.(a) | 398,832 | |
| 16,195 | CareFusion Corp.(a) (b) | 415,888 | |
| 6,118 | Celgene Corp.(a) (b) | 392,531 | |
| 8,868 | Cigna Corp.(a) | 390,192 | |
| 5,541 | Clorox Co.(a) | 401,501 | |
| 5,288 | Coca-Cola Co.(a) | 413,469 | |
| 14,771 | Coca-Cola Enterprises, Inc.(a) | 414,179 | |
| 3,973 | Colgate-Palmolive Co.(a) | 413,590 | |
| 15,827 | ConAgra Foods, Inc.(a) | 410,394 | |
| 20,779 | Constellation Brands, Inc., Class A(a) (b) | 562,280 | |
| 12,262 | Coventry Health Care, Inc.(a) | 389,809 | |
| 7,612 | Covidien PLC (Ireland)(a) | 407,242 | |
| 3,995 | CR Bard, Inc.(a) | 429,222 | |
| 4,648 | DaVita, Inc.(a) (b) | 456,480 | |
| 24,838 | Dean Foods Co.(a) (b) | 422,991 | |
| 10,694 | DENTSPLY International, Inc.(a) | 404,340 | |
| 13,692 | DeVry, Inc.(a) | 424,041 |
See notes to financial statements.
12 l GEQ l GUGGENHEIM EQUAL WEIGHT ENHANCED EQUITY INCOME FUND ANNUAL REPORT
| PORTFOLIO OF INVESTMENTS continued | June 30, 2012 |
| Number | |||
| of Shares | Description | Value | |
| Consumer, Non-cyclical (continued) | |||
| 9,331 | Dr Pepper Snapple Group, Inc.(a) | $ 408,231 | |
| 4,510 | Edwards Lifesciences Corp.(a) (b) | 465,883 | |
| 9,582 | Eli Lilly & Co.(a) | 411,164 | |
| 8,494 | Equifax, Inc.(a) | 395,820 | |
| 7,234 | Estee Lauder Cos., Inc., Class A(a) | 391,504 | |
| 7,481 | Express Scripts Holding Co.(a) (b) | 417,664 | |
| 11,150 | Forest Laboratories, Inc.(a) (b) | 390,139 | |
| 10,417 | General Mills, Inc.(a) | 401,471 | |
| 8,016 | Gilead Sciences, Inc.(a) (b) | 411,060 | |
| 25,755 | H&R Block, Inc.(a) | 411,565 | |
| 5,889 | Hershey Co.(a) | 424,185 | |
| 7,425 | HJ Heinz Co.(a) | 403,772 | |
| 13,370 | Hormel Foods Corp.(a) | 406,715 | |
| 12,134 | Hospira, Inc.(a) (b) | 424,447 | |
| 5,012 | Humana, Inc.(a) | 388,129 | |
| 742 | Intuitive Surgical, Inc.(a) (b) | 410,912 | |
| 12,160 | Iron Mountain, Inc.(a) | 400,794 | |
| 5,253 | JM Smucker Co.(a) | 396,707 | |
| 6,319 | Johnson & Johnson(a) | 426,912 | |
| 8,183 | Kellogg Co.(a) | 403,667 | |
| 4,900 | Kimberly-Clark Corp.(a) | 410,473 | |
| 10,406 | Kraft Foods, Inc., Class A(a) | 401,880 | |
| 18,447 | Kroger Co.(a) | 427,785 | |
| 4,644 | Laboratory Corp. of America Holdings(a) (b) | 430,081 | |
| 9,510 | Life Technologies Corp.(a) (b) | 427,855 | |
| 3,231 | Lorillard, Inc.(a) | 426,330 | |
| 955 | MasterCard, Inc., Class A(a) | 410,755 | |
| 7,131 | McCormick & Co., Inc.(a) | 432,494 | |
| 4,500 | McKesson Corp.(a) | 421,875 | |
| 4,884 | Mead Johnson Nutrition Co.(a) | 393,211 | |
| 10,660 | Medtronic, Inc.(a) | 412,862 | |
| 10,346 | Merck & Co., Inc.(a) | 431,946 | |
| 10,209 | Molson Coors Brewing Co., Class B(a) | 424,796 | |
| 5,334 | Monster Beverage Corp.(b) | 379,781 | |
| 10,963 | Moody’s Corp.(a) | 400,698 | |
| 18,465 | Mylan, Inc.(a) (b) | 394,597 | |
| 11,989 | Patterson Cos., Inc.(a) | 413,261 | |
| 12,833 | Paychex, Inc.(a) | 403,085 | |
| 5,826 | PepsiCo, Inc.(a) | 411,665 | |
| 3,746 | Perrigo Co. | 441,765 | |
| 17,972 | Pfizer, Inc.(a) | 413,356 | |
| 4,739 | Philip Morris International, Inc.(a) | 413,525 | |
| 6,341 | Procter & Gamble Co.(a) | 388,386 | |
| 17,654 | Quanta Services, Inc.(a) (b) | 424,932 |
| Number | |||
| of Shares | Description | Value | |
| 7,178 | Quest Diagnostics, Inc.(a) | $ 429,962 | |
| 9,675 | Reynolds American, Inc.(a) | 434,118 | |
| 14,070 | Robert Half International, Inc.(a) | 401,980 | |
| 36,913 | RR Donnelley & Sons Co.(a) | 434,465 | |
| 21,840 | Safeway, Inc.(a) | 396,396 | |
| 34,541 | SAIC, Inc.(a) | 418,637 | |
| 10,211 | St. Jude Medical, Inc.(a) | 407,521 | |
| 7,755 | Stryker Corp.(a) | 427,301 | |
| 13,816 | Sysco Corp.(a) | 411,855 | |
| 85,025 | Tenet Healthcare Corp.(a) (b) | 445,531 | |
| 16,969 | Total System Services, Inc.(a) | 406,068 | |
| 20,889 | Tyson Foods, Inc., Class A(a) | 393,340 | |
| 6,860 | UnitedHealth Group, Inc.(a) | 401,310 | |
| 6,691 | Varian Medical Systems, Inc.(a) (b) | 406,612 | |
| 5,613 | Watson Pharmaceuticals, Inc.(a) (b) | 415,306 | |
| 5,762 | WellPoint, Inc.(a) | 367,558 | |
| 24,563 | Western Union Co.(a) | 413,641 | |
| 4,375 | Whole Foods Market, Inc.(a) | 417,025 | |
| 6,528 | Zimmer Holdings, Inc.(a) | 420,142 | |
| 41,292,870 | |||
| Diversified – 0.2% | |||
| 19,168 | Leucadia National Corp.(a) | 407,703 | |
| Energy – 11.0% | |||
| 42,695 | Alpha Natural Resources, Inc.(a) (b) | 371,873 | |
| 6,233 | Anadarko Petroleum Corp.(a) | 412,625 | |
| 4,797 | Apache Corp.(a) | 421,608 | |
| 10,139 | Baker Hughes, Inc.(a) | 416,713 | |
| 12,061 | Cabot Oil & Gas Corp.(a) | 475,202 | |
| 8,657 | Cameron International Corp.(a) (b) | 369,740 | |
| 21,673 | Chesapeake Energy Corp.(a) | 403,118 | |
| 3,945 | Chevron Corp.(a) | 416,198 | |
| 7,373 | ConocoPhillips(a) | 412,003 | |
| 14,086 | CONSOL Energy, Inc.(a) | 425,961 | |
| 26,527 | Denbury Resources, Inc.(a) (b) | 400,823 | |
| 6,779 | Devon Energy Corp.(a) | 393,114 | |
| 6,621 | Diamond Offshore Drilling, Inc.(a) | 391,500 | |
| 4,238 | EOG Resources, Inc.(a) | 381,886 | |
| 8,621 | EQT Corp.(a) | 462,344 | |
| 4,922 | Exxon Mobil Corp.(a) | 421,176 | |
| 9,785 | FMC Technologies, Inc.(a) (b) | 383,866 | |
| 14,232 | Halliburton Co.(a) | 404,047 | |
| 8,633 | Helmerich & Payne, Inc.(a) | 375,363 | |
| 8,897 | Hess Corp.(a) | 386,575 | |
| 12,620 | Kinder Morgan, Inc. | 406,616 |
See notes to financial statements.
GEQ l GUGGENHEIM EQUAL WEIGHT ENHANCED EQUITY INCOME FUND ANNUAL REPORT l 13
| PORTFOLIO OF INVESTMENTS continued | June 30, 2012 |
| Number | |||
| of Shares | Description | Value | |
| Energy (continued) | |||
| 15,897 | Marathon Oil Corp.(a) | $ 406,486 | |
| 10,650 | Marathon Petroleum Corp.(a) | 478,397 | |
| 8,689 | Murphy Oil Corp.(a) | 436,970 | |
| 29,762 | Nabors Industries Ltd. (Bermuda)(a) (b) | 428,573 | |
| 5,975 | National Oilwell Varco, Inc.(a) | 385,029 | |
| 13,627 | Newfield Exploration Co.(a) (b) | 399,407 | |
| 12,483 | Noble Corp. (Switzerland)(a) (b) | 406,072 | |
| 4,687 | Noble Energy, Inc.(a) | 397,551 | |
| 4,680 | Occidental Petroleum Corp.(a) | 401,404 | |
| 9,640 | ONEOK, Inc.(a) | 407,868 | |
| 16,396 | Peabody Energy Corp.(a) | 402,030 | |
| 12,389 | Phillips 66(a) (b) | 411,810 | |
| 4,220 | Pioneer Natural Resources Co.(a) | 372,246 | |
| 15,135 | QEP Resources, Inc.(a) | 453,596 | |
| 7,031 | Range Resources Corp.(a) | 435,008 | |
| 12,702 | Rowan Companies PLC, Class A (United Kingdom)(a) (b) | 410,656 | |
| 6,166 | Schlumberger Ltd. (Curacao)(a) | 400,235 | |
| 14,689 | Southwestern Energy Co.(a) (b) | 469,020 | |
| 14,309 | Spectra Energy Corp.(a) | 415,821 | |
| 8,511 | Sunoco, Inc.(a) | 404,273 | |
| 17,749 | Tesoro Corp.(a) (b) | 443,015 | |
| 18,708 | Valero Energy Corp.(a) | 451,798 | |
| 13,549 | Williams Cos., Inc.(a) | 390,482 | |
| 28,381 | WPX Energy, Inc.(a) (b) | 459,205 | |
| 18,599,303 | |||
| Financial – 19.6% | |||
| 5,461 | ACE Ltd. (Switzerland)(a) | 404,824 | |
| 9,791 | Aflac, Inc.(a) | 416,999 | |
| 11,597 | Allstate Corp.(a) | 406,939 | |
| 7,123 | American Express Co.(a) | 414,630 | |
| 13,056 | American International Group(a) (b) | 418,967 | |
| 6,003 | American Tower Corp., REIT(a) | 419,670 | |
| 8,199 | Ameriprise Financial, Inc.(a) | 428,480 | |
| 8,505 | Aon PLC (United Kingdom)(a) | 397,864 | |
| 14,645 | Apartment Investment & Management Co., Class A, REIT(a) | 395,854 | |
| 11,715 | Assurant, Inc.(a) | 408,151 | |
| 2,809 | AvalonBay Communities, Inc., REIT(a) | 397,417 | |
| 52,635 | Bank of America Corp.(a) | 430,553 | |
| 19,410 | Bank of New York Mellon Corp.(a) | 426,049 | |
| 13,716 | BB&T Corp.(a) | 423,139 | |
| 4,890 | Berkshire Hathaway, Inc., Class B(a) (b) | 407,484 | |
| 2,288 | BlackRock, Inc.(a) | 388,548 | |
| 3,782 | Boston Properties, Inc., REIT(a) | 409,855 | |
| 7,566 | Capital One Financial Corp.(a) | 413,558 |
| Number | |||
| of Shares | Description | Value | |
| 24,502 | CBRE Group, Inc., Class A(a) (b) | $ 400,853 | |
| 32,351 | Charles Schwab Corp.(a) | 418,298 | |
| 5,563 | Chubb Corp.(a) | 405,098 | |
| 10,839 | Cincinnati Financial Corp.(a) | 412,641 | |
| 14,329 | Citigroup, Inc.(a) | 392,758 | |
| 1,466 | CME Group, Inc.(a) | 393,049 | |
| 13,493 | Comerica, Inc.(a) | 414,370 | |
| 12,125 | Discover Financial Services(a) | 419,283 | |
| 48,586 | E*Trade Financial Corp.(a) (b) | 390,631 | |
| 6,428 | Equity Residential, REIT(a) | 400,850 | |
| 19,796 | Federated Investors, Inc., Class B(a) | 432,543 | |
| 30,775 | Fifth Third Bancorp(a) | 412,385 | |
| 49,990 | First Horizon National Corp.(a) | 432,414 | |
| 3,681 | Franklin Resources, Inc.(a) | 408,554 | |
| 73,963 | Genworth Financial, Inc., Class A(a) (b) | 418,631 | |
| 4,210 | Goldman Sachs Group, Inc.(a) | 403,571 | |
| 23,175 | Hartford Financial Services Group, Inc.(a) | 408,575 | |
| 9,540 | HCP, Inc., REIT(a) | 421,191 | |
| 7,111 | Health Care REIT, Inc., REIT(a) | 414,571 | |
| 25,940 | Host Hotels & Resorts, Inc., REIT(a) | 410,371 | |
| 65,881 | Hudson City Bancorp, Inc.(a) | 419,662 | |
| 63,872 | Huntington Bancshares, Inc.(a) | 408,781 | |
| 3,112 | IntercontinentalExchange, Inc.(a) (b) | 423,170 | |
| 17,437 | Invesco Ltd. (Bermuda)(a) | 394,076 | |
| 11,814 | JPMorgan Chase & Co.(a) | 422,114 | |
| 54,660 | KeyCorp(a) | 423,068 | |
| 21,567 | Kimco Realty Corp., REIT(a) | 410,420 | |
| 15,545 | Legg Mason, Inc.(a) | 409,922 | |
| 18,967 | Lincoln National Corp.(a) | 414,808 | |
| 9,980 | Loews Corp.(a) | 408,282 | |
| 4,978 | M&T Bank Corp.(a) | 411,033 | |
| 12,443 | Marsh & McLennan Cos., Inc.(a) | 401,038 | |
| 13,376 | MetLife, Inc.(a) | 412,650 | |
| 29,024 | Morgan Stanley(a) | 423,460 | |
| 17,990 | NASDAQ OMX Group, Inc.(a) | 407,833 | |
| 9,196 | Northern Trust Corp.(a) | 423,200 | |
| 16,175 | NYSE Euronext(a) | 413,757 | |
| 33,980 | People’s United Financial, Inc.(a) | 394,508 | |
| 10,650 | Plum Creek Timber Co., Inc., REIT(a) | 422,805 | |
| 6,705 | PNC Financial Services Group, Inc.(a) | 409,743 | |
| 16,038 | Principal Financial Group, Inc.(a) | 420,676 | |
| 18,169 | Progressive Corp.(a) | 378,460 | |
| 12,485 | Prologis, Inc., REIT(a) | 414,877 | |
| 8,295 | Prudential Financial, Inc.(a) | 401,727 | |
| 2,869 | Public Storage, REIT(a) | 414,312 |
See notes to financial statements.
14 l GEQ l GUGGENHEIM EQUAL WEIGHT ENHANCED EQUITY INCOME FUND ANNUAL REPORT
| PORTFOLIO OF INVESTMENTS continued | June 30, 2012 |
| Number | |||
| of Shares | Description | Value | |
| Financial (continued) | |||
| 64,701 | Regions Financial Corp.(a) | $ 436,732 | |
| 2,642 | Simon Property Group, Inc., REIT(a) | 411,254 | |
| 27,387 | SLM Corp.(a) | 430,250 | |
| 9,439 | State Street Corp.(a) | 421,357 | |
| 17,940 | SunTrust Banks, Inc.(a) | 434,686 | |
| 6,767 | T Rowe Price Group, Inc.(a) | 426,050 | |
| 8,378 | Torchmark Corp.(a) | 423,507 | |
| 6,404 | Travelers Cos., Inc.(a) | 408,831 | |
| 20,107 | Unum Group(a) | 384,647 | |
| 13,221 | US Bancorp(a) | 425,187 | |
| 6,826 | Ventas, Inc., REIT(a) | 430,857 | |
| 3,414 | Visa, Inc., Class A(a) | 422,073 | |
| 4,815 | Vornado Realty Trust, REIT(a) | 404,364 | |
| 12,660 | Wells Fargo & Co.(a) | 423,350 | |
| 19,458 | Weyerhaeuser Co., REIT(a) | 435,081 | |
| 19,516 | XL Group PLC (Ireland)(a) | 410,617 | |
| 21,627 | Zions Bancorporation(a) | 419,996 | |
| 33,052,839 | |||
| Industrial – 14.8% | |||
| 4,628 | 3M Co.(a) | 414,669 | |
| 10,049 | Agilent Technologies, Inc.(a) | 394,323 | |
| 7,254 | Amphenol Corp., Class A(a) | 398,390 | |
| 9,669 | Ball Corp.(a) | 396,912 | |
| 12,536 | Bemis Co.(a) | 392,878 | |
| 5,690 | Boeing Co.(a) | 422,768 | |
| 4,542 | Caterpillar, Inc.(a) | 385,661 | |
| 6,870 | CH Robinson Worldwide, Inc.(a) | 402,101 | |
| 5,740 | Cooper Industries PLC (Ireland) | 391,353 | |
| 18,877 | CSX Corp.(a) | 422,090 | |
| 4,110 | Cummins, Inc.(a) | 398,300 | |
| 7,726 | Danaher Corp.(a) | 402,370 | |
| 5,354 | Deere & Co.(a) | 432,978 | |
| 7,021 | Dover Corp.(a) | 376,396 | |
| 9,650 | Eaton Corp.(a) | 382,430 | |
| 8,523 | Emerson Electric Co.(a) | 397,001 | |
| 10,109 | Expeditors International of Washington, Inc.(a) | 391,724 | |
| 4,544 | FedEx Corp.(a) | 416,276 | |
| 18,814 | FLIR Systems, Inc.(a) | 366,873 | |
| 3,786 | Flowserve Corp.(a) | 434,443 | |
| 8,199 | Fluor Corp.(a) | 404,539 | |
| 6,211 | General Dynamics Corp.(a) | 409,678 | |
| 20,726 | General Electric Co.(a) | 431,931 | |
| 3,150 | Goodrich Corp.(a) | 399,735 | |
| 7,107 | Honeywell International, Inc.(a) | 396,855 |
| Number | |||
| of Shares | Description | Value | |
| 7,105 | Illinois Tool Works, Inc.(a) | $ 375,783 | |
| 9,755 | Ingersoll-Rand PLC (Ireland)(a) | 411,466 | |
| 20,833 | Jabil Circuit, Inc.(a) | 423,535 | |
| 10,919 | Jacobs Engineering Group, Inc.(a) (b) | 413,393 | |
| 6,846 | Joy Global, Inc.(a) | 388,374 | |
| 5,716 | L-3 Communications Holdings, Inc.(a) | 423,041 | |
| 19,094 | Leggett & Platt, Inc.(a) | 403,456 | |
| 4,777 | Lockheed Martin Corp.(a) | 415,981 | |
| 29,476 | Masco Corp.(a) | 408,832 | |
| 16,388 | Molex, Inc.(a) | 392,329 | |
| 5,989 | Norfolk Southern Corp.(a) | 429,830 | |
| 6,657 | Northrop Grumman Corp.(a) | 424,650 | |
| 20,533 | Owens-Illinois, Inc.(a) (b) | 393,618 | |
| 7,511 | Pall Corp.(a) | 411,678 | |
| 4,896 | Parker Hannifin Corp.(a) | 376,404 | |
| 15,292 | PerkinElmer, Inc.(a) | 394,534 | |
| 2,427 | Precision Castparts Corp.(a) | 399,217 | |
| 7,714 | Raytheon Co.(a) | 436,535 | |
| 15,135 | Republic Services, Inc.(a) | 400,472 | |
| 5,694 | Rockwell Automation, Inc.(a) | 376,146 | |
| 7,909 | Rockwell Collins, Inc.(a) | 390,309 | |
| 3,973 | Roper Industries, Inc.(a) | 391,658 | |
| 9,275 | Ryder System, Inc.(a) | 333,993 | |
| 25,459 | Sealed Air Corp.(a) | 393,087 | |
| 6,351 | Snap-On, Inc.(a) | 395,350 | |
| 6,154 | Stanley Black & Decker, Inc.(a) | 396,071 | |
| 4,546 | Stericycle, Inc.(a) (b) | 416,732 | |
| 12,252 | TE Connectivity Ltd. (Switzerland)(a) | 390,961 | |
| 16,368 | Textron, Inc.(a) | 407,072 | |
| 7,823 | Thermo Fisher Scientific, Inc.(a) | 406,092 | |
| 7,439 | Tyco International Ltd. (Switzerland)(a) | 393,151 | |
| 3,597 | Union Pacific Corp.(a) | 429,157 | |
| 5,193 | United Parcel Service, Inc., Class B(a) | 409,001 | |
| 5,270 | United Technologies Corp.(a) | 398,043 | |
| 12,252 | Waste Management, Inc.(a) | 409,217 | |
| 5,052 | Waters Corp.(a) (b) | 401,482 | |
| 15,352 | Xylem, Inc. | 386,410 | |
| 24,909,734 | |||
| Technology – 12.1% | |||
| 6,798 | Accenture PLC, Class A (Ireland)(a) | 408,492 | |
| 12,572 | Adobe Systems, Inc.(a) (b) | 406,956 | |
| 67,330 | Advanced Micro Devices, Inc.(a) (b) | 385,801 | |
| 13,211 | Akamai Technologies, Inc.(a) (b) | 419,449 | |
| 11,882 | Altera Corp.(a) | 402,087 | |
| 10,726 | Analog Devices, Inc.(a) | 404,048 |
See notes to financial statements.
GEQ l GUGGENHEIM EQUAL WEIGHT ENHANCED EQUITY INCOME FUND ANNUAL REPORT l 15
| PORTFOLIO OF INVESTMENTS continued | June 30, 2012 |
| Number | |||
| of Shares | Description | Value | |
| Technology (continued) | |||
| 686 | Apple, Inc.(a) (b) | $ 400,624 | |
| 36,980 | Applied Materials, Inc.(a) | 423,791 | |
| 12,138 | Autodesk, Inc.(a) (b) | 424,709 | |
| 9,106 | BMC Software, Inc.(a) (b) | 388,644 | |
| 11,683 | Broadcom Corp., Class A(a) (b) | 394,885 | |
| 15,622 | CA, Inc.(a) | 423,200 | |
| 5,040 | Cerner Corp.(a) (b) | 416,606 | |
| 5,159 | Citrix Systems, Inc.(a) (b) | 433,046 | |
| 6,761 | Cognizant Technology Solutions Corp., Class A(a) (b) | 405,660 | |
| 15,216 | Computer Sciences Corp.(a) | 377,661 | |
| 32,832 | Dell, Inc.(a) (b) | 411,057 | |
| 5,941 | Dun & Bradstreet Corp.(a) | 422,821 | |
| 29,541 | Electronic Arts, Inc.(a) (b) | 364,831 | |
| 16,149 | EMC Corp.(a) (b) | 413,899 | |
| 12,286 | Fidelity National Information Services, Inc.(a) | 418,707 | |
| 31,087 | First Solar, Inc.(a) (b) | 468,169 | |
| 5,758 | Fiserv, Inc.(a) (b) | 415,843 | |
| 17,837 | Hewlett-Packard Co.(a) | 358,702 | |
| 15,067 | Intel Corp.(a) | 401,536 | |
| 2,039 | International Business Machines Corp.(a) | 398,788 | |
| 6,981 | Intuit, Inc.(a) | 414,322 | |
| 8,408 | KLA-Tencor Corp.(a) | 414,094 | |
| 10,577 | Lam Research Corp.(a) (b) | 399,176 | |
| 15,405 | Lexmark International, Inc., Class A(a) | 409,465 | |
| 13,344 | Linear Technology Corp.(a) | 418,068 | |
| 60,290 | LSI Corp.(a) (b) | 384,047 | |
| 12,431 | Microchip Technology, Inc.(a) | 411,217 | |
| 67,674 | Micron Technology, Inc.(a) (b) | 427,023 | |
| 13,420 | Microsoft Corp.(a) | 410,518 | |
| 13,119 | NetApp, Inc.(a) (b) | 417,446 | |
| 32,832 | NVIDIA Corp.(a) (b) | 453,738 | |
| 14,651 | Oracle Corp.(a) | 435,135 | |
| 27,866 | Pitney Bowes, Inc.(a) | 417,154 | |
| 6,773 | Qualcomm, Inc.(a) | 377,121 | |
| 7,137 | Red Hat, Inc.(a) (b) | 403,098 | |
| 2,915 | Salesforce.com, Inc.(a) (b) | 403,028 | |
| 11,231 | SanDisk Corp.(a) (b) | 409,707 | |
| 17,283 | Seagate Technology PLC (Ireland) | 427,408 | |
| 5,796 | Teradata Corp.(a) (b) | 417,370 | |
| 27,671 | Teradyne, Inc.(a) (b) | 389,054 | |
| 13,953 | Texas Instruments, Inc.(a) | 400,312 | |
| 12,741 | Western Digital Corp.(a) (b) | 388,346 | |
| 51,610 | Xerox Corp.(a) | 406,171 | |
| 12,117 | Xilinx, Inc.(a) | 406,768 | |
| 20,429,798 |
| Number | |||
| of Shares | Description | Value | |
| Utilities – 7.2% | |||
| 31,706 | AES Corp.(a) (b) | $ 406,788 | |
| 10,429 | AGL Resources, Inc.(a) | 404,124 | |
| 11,967 | Ameren Corp.(a) | 401,373 | |
| 10,018 | American Electric Power(a) | 399,718 | |
| 19,506 | CenterPoint Energy, Inc.(a) | 403,189 | |
| 16,890 | CMS Energy Corp.(a) | 396,915 | |
| 6,393 | Consolidated Edison, Inc.(a) | 397,581 | |
| 7,475 | Dominion Resources, Inc.(a) | 403,650 | |
| 6,862 | DTE Energy Co.(a) | 407,122 | |
| 17,188 | Duke Energy Corp.(a) | 396,355 | |
| 8,643 | Edison International(a) | 399,307 | |
| 6,005 | Entergy Corp.(a) | 407,679 | |
| 10,636 | Exelon Corp.(a) | 400,126 | |
| 8,314 | FirstEnergy Corp.(a) | 408,966 | |
| 7,172 | Integrys Energy Group, Inc.(a) | 407,872 | |
| 5,945 | NextEra Energy, Inc.(a) | 409,075 | |
| 15,760 | NiSource, Inc.(a) | 390,060 | |
| 10,642 | Northeast Utilities(a) | 413,016 | |
| 24,979 | NRG Energy, Inc.(a) (b) | 433,636 | |
| 20,586 | Pepco Holdings, Inc.(a) | 402,868 | |
| 8,826 | PG&E Corp.(a) | 399,553 | |
| 7,791 | Pinnacle West Capital Corp.(a) | 403,106 | |
| 14,273 | PPL Corp.(a) | 396,932 | |
| 12,463 | Public Service Enterprise Group, Inc.(a) | 405,048 | |
| 8,468 | SCANA Corp.(a) | 405,109 | |
| 5,963 | Sempra Energy(a) | 410,731 | |
| 8,398 | Southern Co.(a) | 388,827 | |
| 22,431 | TECO Energy, Inc.(a) | 405,104 | |
| 10,308 | Wisconsin Energy Corp.(a) | 407,888 | |
| 13,997 | Xcel Energy, Inc.(a) | 397,655 | |
| 12,109,373 | |||
| Total Common Stocks – 121.3% | |||
| (Cost $197,409,182) | 204,358,491 | ||
| Short-Term Investments – 2.3% | |||
| Money Market – 2.3% | |||
| 3,883,028 | Dreyfus Treasury Prime Cash Management Institutional Shares | ||
| (Cost $3,883,028) | 3,883,028 | ||
| Total Investments – 123.6% | |||
| (Cost $201,292,210) | 208,241,519 | ||
| Liabilities in excess of Other Assets – (0.1%) | (250,657) | ||
| Total Value of Options Written – (3.3%) | |||
| (Premiums received $4,285,524) | (5,546,489) | ||
| Borrowings – (20.2% of Net Assets or 16.3% | |||
| of Total Investments) | (34,000,000) | ||
| Net Assets – 100.0% | $168,444,373 |
See notes to financial statements.
16 l GEQ l GUGGENHEIM EQUAL WEIGHT ENHANCED EQUITY INCOME FUND ANNUAL REPORT
| PORTFOLIO OF INVESTMENTS continued | June 30, 2012 |
| Contracts | |||||
| (100 shares | Expiration | Exercise | |||
| per contract) | Call Options Written | Month | Price | Value | |
| 1,587 | Energy Select Sector SPDR Fund | July 2012 | $ 65.00 | $ (360,249) | |
| 7,202 | Financial Select Sector SPDR Fund | July 2012 | 14.00 | (558,155) | |
| 7,795 | iShares Russell 2000 Index Fund | July 2012 | 78.00 | (2,030,598) | |
| 2,979 | Materials Select Sector SPDR Fund | July 2012 | 34.00 | (454,297) | |
| 40 | NASDAQ 100 Index | July 2012 | 2,600.00 | (201,000) | |
| 397 | ProShares Ultra Dow30 | July 2012 | 68.00 | (49,625) | |
| 540 | S&P 500 Index | July 2012 | 1,360.00 | (1,085,400) | |
| 1,358 | SPDR Dow Jones Industrial | ||||
| Average ETF | July 2012 | 126.00 | (458,325) | ||
| 612 | SPDR S&P MidCap 400 ETF | July 2012 | 167.00 | (348,840) | |
| Total Value of Options Written - (3.3)% | |||||
| (Premiums received $4,285,524) | $ (5,546,489) | ||||
| PLC – Public Limited Company |
| REIT – Real Estate Investment Trust |
| S&P – Standard & Poor’s |
(a) All or a portion of these securities have been physically segregated in connection with borrowings. As of June 30, 2012, the total amount segregated was $157,998,605. |
| (b) Non-income producing security. |
| Securities are classified by sectors that represent broad groupings of industries. |
See notes to financial statements.
GEQ l GUGGENHEIM EQUAL WEIGHT ENHANCED EQUITY INCOME FUND ANNUAL REPORT l 17
| STATEMENT OF ASSETS AND LIABILITIES | June 30, 2012 |
| Assets | |||
| Investments, at value (cost $201,292,210) | $ | 208,241,519 | |
| Investments sold receivable | 778,860 | ||
| Dividends receivable | 262,934 | ||
| Other assets | 12,848 | ||
| Total assets | 209,296,161 | ||
| Liabilities | |||
| Borrowings | 34,000,000 | ||
| Options written, at value (premiums received of $4,285,524) | 5,546,489 | ||
| Investments purchased payable | 793,647 | ||
| Investment advisory fee payable | 161,631 | ||
| Interest due on borrowings | 31,829 | ||
| Administration fee payable | 4,444 | ||
| Due to custodian | 604 | ||
| Accrued expenses | 313,144 | ||
| Total liabilities | 40,851,788 | ||
| Net Assets | $ | 168,444,373 | |
| Composition of Net Assets | |||
| Common shares, $.01 par value per share; unlimited number of shares authorized, | |||
| 8,755,240 shares issued and outstanding | $ | 87,552 | |
| Additional paid-in capital | 162,809,251 | ||
| Accumulated net realized loss on investments and options transactions | (140,774 | ) | |
| Net unrealized appreciation on investments and options transactions | 5,688,344 | ||
| Net Assets | $ | 168,444,373 | |
Net Asset Value (based on 8,755,240 common shares outstanding) | $ | 19.24 | |
See notes to financial statements.
18 l GEQ l GUGGENHEIM EQUAL WEIGHT ENHANCED EQUITY INCOME FUND ANNUAL REPORT
STATEMENT OF OPERATIONS For the period October 27, 2011* through June 30, 2012 | June 30, 2012 |
| Investment Income | |||||||
| Dividends | $ | 2,864,432 | |||||
| Interest | 650 | ||||||
| Less return of capital distributions received | (8,193 | ) | |||||
| Total income | $ | 2,856,889 | |||||
| Expenses | |||||||
| Investment advisory fee | 1,344,797 | ||||||
| Interest expense | 243,564 | ||||||
| Professional fees | 146,259 | ||||||
| Custodian fee | 85,734 | ||||||
| Trustees’ fees and expenses | 66,004 | ||||||
| Fund accounting | 48,629 | ||||||
| Administrative fee | 36,886 | ||||||
| Licensing fee | 34,065 | ||||||
| Printing expenses | 29,321 | ||||||
| NYSE listing fee | 21,233 | ||||||
| Transfer agent fee | 14,690 | ||||||
| Insurance | 12,867 | ||||||
| Miscellaneous | 14,920 | ||||||
| Total expenses | 2,098,969 | ||||||
| Net investment income | 757,920 | ||||||
| Realized and Unrealized Gain (Loss) on Investments and Options | |||||||
| Net realized gain (loss) on: | |||||||
| Investments | 3,186,366 | ||||||
| Options | (402,506 | ) | |||||
| Net change in unrealized appreciation (depreciation) on: | |||||||
| Investments | 6,949,309 | ||||||
| Options | (1,260,965 | ) | |||||
| Net realized and unrealized gain on investments and options transactions | 8,472,204 | ||||||
| Net Increase in Net Assets Resulting from Operations | $ | 9,230,124 | |||||
| * Commencement of investment operations | |||||||
See notes to financial statements.
GEQ l GUGGENHEIM EQUAL WEIGHT ENHANCED EQUITY INCOME FUND ANNUAL REPORT l 19
| STATEMENTS OF CHANGES IN NET ASSETS | June 30, 2012 |
| For the Period | |||
| October 27, 2011* | |||
| through | |||
| June 30, 2012 | |||
| Increase in Net Assets Resulting from Operations | |||
| Net investment income | $ | 757,920 | |
| Net realized gain on investments and options | 2,783,860 | ||
| Net change in unrealized appreciation on investments and options | 5,688,344 | ||
| Net increase in net assets resulting from operations | 9,230,124 | ||
| Distributions to Shareholders | |||
| From and in excess of net investment income | (3,695,304 | ) | |
| Return of capital | (3,965,531 | ) | |
| (7,660,835 | ) | ||
| Capital Share Transactions | |||
| Net proceeds from the issuance of common shares | 167,125,000 | ||
| Common share offering costs charged to paid-in capital | (350,000 | ) | |
| Net increase from capital share transactions | 166,775,000 | ||
| Total increase in net assets | 168,344,289 | ||
| Net Assets: | |||
| Beginning of period | 100,084 | ||
| End of period (including distributions in excess of net investment income of $0) | $ | 168,444,373 | |
| * Commencement of investment operations | |||
See notes to financial statements.
20 l GEQ l GUGGENHEIM EQUAL WEIGHT ENHANCED EQUITY INCOME FUND ANNUAL REPORT
STATEMENT OF CASH FLOWS For the period October 27, 2011* through June 30, 2012 | June 30, 2012 |
| Cash Flows from Operating Activities: | |||
| Net increase in net assets resulting from operations | $ | 9,230,124 | |
| Adjustments to Reconcile Net Increase in Net Assets Resulting from Operations to | |||
| Net Cash Used by Operating and Investing Activities: | |||
| Net unrealized appreciation on investments | (6,949,309 | ) | |
| Net unrealized depreciation on options | 1,260,965 | ||
| Net realized gain on investments | (3,186,366 | ) | |
| Net realized loss on options | 402,506 | ||
| Purchase of long-term investments | (254,308,105 | ) | |
| Cost of written options closed and assigned | (30,381,060 | ) | |
| Premiums received on call options written | 34,264,078 | ||
| Proceeds from sale of long-term investments | 60,077,096 | ||
| Net purchases of short-term investments | (3,883,028 | ) | |
| Increase in dividends receivable | (262,934 | ) | |
| Increase in securities sold receivable | (778,860 | ) | |
| Increase in other assets | (12,848 | ) | |
| Increase in payable for securities purchased | 793,647 | ||
| Increase in advisory fee payable | 161,631 | ||
| Increase in due to custodian | 604 | ||
| Increase in administration fee payable | 4,444 | ||
| Increase in interest due on borrowings | 31,829 | ||
| Increase in accrued expenses and other liabilities | 313,144 | ||
| Return of capital distributions received | 8,193 | ||
| Net Cash Used in Operating and Investing Activities | (193,214,249 | ) | |
| Cash Flows From Financing Activities: | |||
| Net proceeds from the issuance of common shares | 167,125,000 | ||
| Proceeds from borrowings | 45,500,000 | ||
| Payments made on borrowings | (11,500,000 | ) | |
| Distributions to common shareholders | (7,660,835 | ) | |
| Offering expenses in connection with the issuance of common shares | (350,000 | ) | |
| Net Cash Provided by Financing Activities | 193,114,165 | ||
| Cash at Beginning of Period | 100,084 | ||
| Cash at End of Period | $ | – | |
| Supplemental Disclosure of Cash Flow Information: Cash paid during the period for interest | $ | 211,735 | |
| * Commencement of investment operations | |||
See notes to financial statements.
GEQ l GUGGENHEIM EQUAL WEIGHT ENHANCED EQUITY INCOME FUND ANNUAL REPORT l 21
| FINANCIAL HIGHLIGHTS | June 30, 2012 |
| For the Period | |||
| October 27, 2011* | |||
| through | |||
| June 30, 2012 | |||
| Net asset value, beginning of period | $ | 19.10 | (a) |
| Investment operations | |||
Net investment income (b) | 0.09 | ||
| Net realized and unrealized gain on investments and options | 0.97 | ||
| Total from investment operations | 1.06 | ||
| Common shares’ offering expenses charged to paid-in-capital | (0.04 | ) | |
| Distributions to Common Shareholders | |||
| From and in excess of net investment income | (0.42 | ) | |
| Return of capital | (0.46 | ) | |
| Total distributions to shareholders | (0.88 | ) | |
| Net asset value, end of period | $ | 19.24 | |
| Market value, end of period | $ | 18.61 | |
Total investment return (c) | |||
| Net asset value | 5.30 | % | |
| Market value | -2.57 | % | |
| Ratios and supplemental data | |||
| Net assets end of period (thousands) | $ | 168,444 | |
| Ratios to Average Net Assets applicable to Common Shares: | |||
| Total expenses, excluding interest expense | 1.59 | %(d) | |
| Total expenses, including interest expense | 1.80 | %(d) | |
| Net investment income (loss), including interest expense | 0.71 | %(d) | |
Portfolio Turnover(e) | 31 | % | |
| Senior Indebtedness: | |||
| Total Borrowings outstanding (in thousands) | $ | 34,000 | |
| Asset Coverage per $1,000 of indebtedness(f) | $ | 5,954 | |
| * | Commencement of investment operations |
| (a) | Before deduction of offering expenses charged to capital. |
| (b) | Based on average shares outstanding. |
| (c) | Total investment return is calculated assuming a purchase of a common share at the beginning of the period and a sale on the last day of the period reported either at net asset value (NAV) or market price per share. Dividends and distributions are assumed to be reinvested at NAV for NAV returns or the prices obtained under the Fund’s Dividend Reinvestment Plan market value returns. Total investment return does not reflect brokerage commissions. A return calculated for a period of less than one year is not annualized. |
| (d) | Annualized |
| (e) | Portfolio turnover is not annualized for periods of less than one year. |
| (f) | Calculated by subtracting the Fund’s total liabilities (not including borrowings) from the Fund’s total assets and dividing by the total borrowings. |
See notes to financial statements.
22 l GEQ l GUGGENHEIM EQUAL WEIGHT ENHANCED EQUITY INCOME FUND ANNUAL REPORT
| NOTES TO FINANCIAL STATEMENTS | June 30, 2012 |
Note 1 – Organization:
Guggenheim Equal Weight Enhanced Equity Income Fund (the “Fund”) was organized as a Delaware statutory trust on July 11, 2011. The Fund is registered as a diversified, closed-end management investment company under the Investment Company Act of 1940, as amended (the “1940 Act”).
The Fund’s investment objective is to provide a high level of risk-adjusted total return with an emphasis on current income. There can be no assurance that the Fund will achieve its investment objectives. The Fund’s investment objectives are considered fundamental and may not be changed without shareholder approval.
Note 2 – Accounting Policies:
The preparation of the financial statements in accordance with U.S. generally accepted accounting principles (“GAAP”) requires management to make estimates and assumptions that affect the reported amounts and disclosures in the financial statements. Actual results could differ from these estimates.
The following is a summary of significant accounting policies followed by the Fund.
(a) Valuation of Investments
The Fund values equity securities at the last reported sale price on the principal exchange or in the principal over-the-counter (“OTC”) market in which such securities are traded, as of the close of regular trading on the New York Stock Exchange (“NYSE”) on the day the securities are being valued or, if there are no sales, at the mean between the last available bid and ask prices on that day. Securities traded on the NASDAQ are valued at the NASDAQ Official Closing Price. Preferred stocks are valued at their sales price as of the close of the exchange on which they are traded. Preferred stocks for which the last price is not available are valued at the mean between the last available bid and asked prices on that day. Equity index options are valued at the mean between the last available bid and asked prices on the primary exchange on which they are traded. Exchange-traded options are valued at the mean of the best bid and asked prices at the close on those exchanges on which they are traded. The Fund values money market funds at net asset value. Short-term securities with remaining maturities of 60 days or less, at the time of purchase, are valued at amortized cost, which approximated market value.
For those securities where quotations or prices are not available, the valuations are determined in accordance with procedures established in good faith by management and approved by the Board of Trustees. Valuations in accordance with these procedures are intended to reflect each security’s (or asset’s) “fair value.” Fair value is defined as the price that the Fund would receive to sell an investment or pay to transfer a liability in an orderly transaction with an independent buyer in the principal market, or in the absence of a principal market, the most advantageous market for the investment or liability. Each such determination should be based on a consideration of all relevant factors, which are likely to vary from one pricing context to another. Examples of such factors may include, but are not limited to: (i) the type of security, (ii) the initial cost of the security, (iii) the existence of any contractual restrictions on the security’s disposition, (iv) the price and extent of public trading in similar securities of the issuer or of comparable companies, (v) quotations or evaluated prices from broker-dealers and/or pricing services, (vi) information obtained from the issuer, analysts, and/or the appropriate stock exchange (for exchange traded securities), (vii) an analysis of the company’s financial statements, and (viii) an evaluation of the forces that influence the issuer and the market(s) in which the security is purchased and sold (e.g. the existence of pending merger activity, public offerings or tender offers that might affect the value of the security).
There are three different categories for valuations. Level 1 valuations are those based upon quoted prices in active markets. Level 2 valuations are those based upon quoted prices in inactive markets or based upon significant observable inputs (e.g. yield curves; benchmark interest rates; indices). Level 3 valuations are those based upon unobservable inputs (e.g. discounted cash flow analysis; non-market based methods used to determine fair valuation).
The Fund values Level 1 securities using readily available market quotations in active markets. Money Market Funds are valued at net asset value. The Fund values Level 2 fixed income securities using independent pricing providers who employ matrix pricing models utilizing market prices, broker quotes and prices of securities with comparable maturities and qualities. The Fund values Level 2 equity securities using various observable market inputs as described above. The Fund did not have any Level 2 or Level 3 securities during the period ended June 30, 2012.
The following table represents the Fund’s investments carried on the Statement of Assets and Liabilities by caption and by level within the fair value hierarchy at June 30, 2012.
| Description | |||||||||||||||
| (value in $000s) | Level 1 | Level 2 | Level 3 | Total | |||||||||||
| Assets: | |||||||||||||||
| Common Stocks | $ | 204,359 | $ | – | $ | – | $ | 204,359 | |||||||
| Money Market Fund | 3,883 | – | – | 3,883 | |||||||||||
| Total | $ | 208,242 | $ | – | $ | – | $ | 208,242 | |||||||
| Liabilities: | |||||||||||||||
| Options Written | $ | 5,546 | $ | – | $ | – | $ | 5,546 | |||||||
| Total | $ | 5,546 | $ | – | $ | – | $ | 5,546 | |||||||
There were no transfers between Levels during the period ended June 30, 2012.
(b) Investment Transactions and Investment Income
Investment transactions are accounted for on the trade date. Realized gains and losses on investments are determined on the identified cost basis. Dividend income is recorded net of applicable withholding taxes on the ex-dividend date and interest income is recorded on an accrual basis.
(c) Options
The Fund will utilize a call option writing strategy to seek to generate current income and potentially mitigate overall portfolio volatility. The option strategy will include writing (i.e. selling) call options on securities
GEQ l GUGGENHEIM EQUAL WEIGHT ENHANCED EQUITY INCOME FUND ANNUAL REPORT l 23
| NOTES TO FINANCIAL STATEMENTS continued | June 30, 2012 |
indices, exchange-traded funds that track securities indices, baskets of securities and other instruments, which will include securities that are not held by the Fund.
An option on a security is a contract that gives the holder of the option, in return for a premium, the right to buy from (in the case of a call) or sell to (in the case of a put) the writer of the option the security underlying the option at a specific exercise or “strike” price. The writer of an option on a security has an obligation upon exercise of the option to deliver the underlying security upon payment of the exercise price (in the case of a call) or to pay the exercise price upon delivery of the underlying security (in the case of a put). When an option is written, the premium received is recorded as an asset with an equal liability and is subsequently marked to market to reflect the current market value of the option written. These liabilities are reflected as options written in the Statement of Assets and Liabilities. Premiums received from writing options which expire unexercised are recorded on the expiration date as a realized gain. The difference between the premium received and the amount paid on effecting a closing purchase transaction, including brokerage commissions, is also treated as a realized gain, or if the premium is less than the amount paid for the closing purchase transactions, as a realized loss. If an option is exercised, the premium is added to the cost of the purchase (in the case of a put) or proceeds from the sale of the underlying security (in the case of a call) in determining whether there has been a realized gain or loss.
As the seller of an index call option, the Fund receives cash (the premium) from the purchaser. The purchaser of an index call option has the right to any appreciation in the value of the index over a fixed price (the exercise price) on or before a certain date in the future (the expiration date). The Fund, in effect, agrees to sell the potential appreciation in the value of the relevant index over the exercise price in exchange for the premium. If, at or before expiration, the purchaser exercises the call option sold by the Fund, the Fund will pay the purchaser the difference between the cash value of the index and the exercise price of the index option (the exercise settlement amount). The premium, the exercise price and the market value of the index determine the gain or loss realized by the Fund as the seller of the index call option.
When a call option is purchased, the Fund obtains the right (but not the obligation) to buy the underlying instrument at the strike price at anytime during the option period. When a put option is purchased, the Fund obtains the right (but not the obligation) to sell the option’s underlying instrument at the strike price at anytime during the option period. When the Fund purchases an option, an amount equal to the premium paid by the Fund is reflected as an asset and subsequently marked-to-market to reflect the current market value of the option purchased. The maximum exposure the Fund has at risk when purchasing an option is the premium paid. Purchased options are included with Investments on the Statement of Assets and Liabilities. Realized and unrealized gains and losses on purchased options are included with Investments on the Statement of Operations.
Options on an index differ from options on securities because (i) the exercise of an index option requires cash payments and does not involve the actual purchase or sale of securities, (ii) the holder of an index call option has the right to receive cash (instead of securities) upon exercise of the option in an amount equal to the amount by which the level of the index exceeds the exercise price and (iii) index options reflect price-fluctuations in a group of securities or segments of the securities market rather than price fluctuations in a single security.
(d) Distributions to Shareholders
The Fund declares and pays quarterly dividends to common shareholders. Distributions to shareholders are recorded on the ex-dividend date. The amount and timing of distributions are determined in accordance with federal income tax regulations, which may differ from GAAP. These dividends consist of investment company taxable income, which generally includes qualified dividend income, ordinary income and short-term capital gains, including premiums received on written options. Realized short-term capital gains are considered ordinary income for tax purposes and will be reclassified at the Fund’s fiscal year end on the Fund’s Statement of Assets and Liabilities from accumulated net realized gains to distributions in excess of net investment income. Any net realized long-term capital gains are distributed annually to common shareholders. It is possible that a portion of the distributions paid during a calendar year could ultimately be classified as return of capital for income tax purposes.
(e) Recent Accounting Pronouncements
On May 12, 2011, the Financial Accounting Standards Board (“FASB”) issued Accounting Standards Update 2011-04 (“ASU”), modifying Topic 820, Fair Value Measurements and Disclosures. At the same time, the International Accounting Standards Board (“IASB”) issued International Financial Reporting Standard (“IFRS”) 13, Fair Value Measurement. The objective by the FASB and IASB is convergence of their guidance on fair value measurements and disclosures. Specifically, the ASU requires reporting entities to disclose (i) the amounts of any transfers between Level 1 and Level 2, and the reasons for the transfers, (ii) for Level 3 fair value measurements, quantitative information about significant unobservable inputs used, (iii) a description of the valuation processes used by the reporting entity and, (iv) a narrative description of the sensitivity of the fair value measurement to changes in unobservable inputs if a change in those inputs might result in a significantly higher or lower fair value measurement. The Fund has adopted the disclosures required by this update.
Note 3 – Investment Advisory Agreement, Sub-Advisory Agreement and Other Agreements:
Pursuant to an Investment Advisory Agreement between the Fund and Guggenheim Funds Investment Advisors, LLC (the “Adviser”), the Adviser furnishes offices, necessary facilities and equipment, provides personnel, including certain officers required for the Fund’s administrative management and compensates the officers or trustees of the Fund who are affiliates of the Adviser. As compensation for these services, the Fund pays the Adviser a fee, payable monthly, in the amount equal to 1.00% of the Fund’s average daily managed assets (net asset applicable to common shareholders plus any assets attributable to financial leverage).
The Fund and the Adviser have entered into a Sub-Advisory Agreement (the “Options Strategy Sub-Advisory Agreement”) with Guggenheim Partners Investment Management, LLC (“GPIM”). GPIM is responsible for the management of the Fund’s option strategy. Under the terms of the
24 l GEQ l GUGGENHEIM EQUAL WEIGHT ENHANCED EQUITY INCOME FUND ANNUAL REPORT
| NOTES TO FINANCIAL STATEMENTS continued | June 30, 2012 |
Options Strategy Sub-Advisory Agreement, the Adviser pays monthly to GPIM a fee at the annual rate of 0.50% of the Fund’s average daily managed assets.
The Fund and the Adviser have also entered into a Sub-Advisory Agreement (the “Equity Portfolio Sub-Advisory Agreement”) with Security Investors, LLC (“Security Investors”). Security Investors is responsible for the management of the Fund’s portfolio of equity securities. Under the terms of the Equity Portfolio Sub-Advisory Agreement, the Adviser pays monthly to Security Investors a fee at the annual rate of 0.15% of the Fund’s average daily managed assets.
Certain officers and trustees of the Fund may also be officers, directors and/or employees of the Adviser or GPIM. The Fund does not compensate its officers or trustees who are officers, directors and/or employees of the aforementioned firms.
Under a separate Fund Administration Agreement (the “Administration Agreement”), the Adviser provides fund administration services to the Fund. As compensation for services performed under the Administration Agreement, the Adviser receives a fund administration fee payable monthly at the annual rate set forth below as a percentage of the average daily managed assets of the Fund.
| Managed Assets | Rate |
| First $200,000,000 | 0.0275% |
| Next $300,000,000 | 0.0200% |
| Next $500,000,000 | 0.0150% |
| Over $1,000,000,000 | 0.0100% |
The Bank of New York Mellon (“BNY”) acts as the Fund’s custodian and accounting agent. As custodian, BNY is responsible for the custody of the Fund’s assets. As accounting agent, BNY is responsible for maintaining the books and records of the Fund’s securities and cash.
Note 4 – Federal Income Taxes:
The Fund intends to comply with the requirements of Subchapter M of the Internal Revenue Code of 1986, as amended, applicable to regulated investment companies. Accordingly, no provision for U.S. federal income taxes is required. In addition, by distributing substantially all of its ordinary income and long-term capital gains, if any, during each calendar year, the Fund intends not to be subject to U.S. federal excise tax.
At June 30, 2012, the following reclassifications were made to the capital accounts of the Fund to reflect permanent book/tax differences and income gains available for distributions under income tax regulations, which are primarily due to the differences between book and tax treatment of investments in real estate investment trusts. Net investment income, net realized gains and net assets were not affected by the changes.
| Undistributed Net | Accumulated Net | |
| Investment Income/(Loss) | Realized Gain/(Loss) | Paid in Capital |
| $2,937,384 | $(2,924,634) | $(12,750) |
Information on the components of investments, excluding purchased and written options, and net assets as of June 30, 2012, is as follows:
| Net Tax | Net Tax | Undistributed | Undistributed | |||
| Cost of | Gross Tax | Gross Tax | Unrealized | Unrealized | Ordinary | Long-Term |
| Investments for | Unrealized | Unrealized | Appreciation | Depreciation on | Income/(Accumulated | Gains/(Accumulated |
| Tax Purposes | Appreciation | Depreciation | on Investments | Derivatives | Ordinary Loss) | Capital Loss) |
| $201,509,098 | $16,379,144 | $(9,646,723) | $6,732,421 | $(1,184,851) | $ – | $ – |
The difference between book basis and tax basis unrealized appreciation (depreciation) is primarily attributable to the tax deferral of losses on wash sales.
For the period ended June 30, 2012, the tax character of distributions paid to common shareholders as reflected in the Statement of Changes in Net Assets was as follows:
| Distributions paid from | 2012 |
| Ordinary income | $3,695,304 |
| Return of capital | $3,965,531 |
For all open tax years and all major jurisdictions, management of the Fund has concluded that there are no significant uncertain tax positions that would require recognition in the financial statements. Uncertain tax positions are tax positions taken or expected to be taken in the course of preparing the Fund’s tax returns that would not meet a more-likely-than-not threshold of being sustained by the applicable tax authority and would be recorded as a tax expense in the current year. Open tax years are those that are open for examination by taxing authorities (i.e. generally the last four tax year ends and the interim tax period since then). Furthermore, management of the Fund is also not aware of any tax positions for which it is reasonably possible that the total amounts of unrecognized tax benefits will significantly change in the next twelve months.
Note 5 – Investments in Securities:
During the period ended June 30, 2012, the cost of purchases and proceeds from sales of investments, excluding written options with maturities of less than one year and short-term investments were $254,308,105 and $60,077,096, respectively.
Note 6 – Derivatives:
The Fund will utilize a call option writing strategy to seek to generate current income and potentially mitigate overall portfolio volatility. As this
GEQ l GUGGENHEIM EQUAL WEIGHT ENHANCED EQUITY INCOME FUND ANNUAL REPORT l 25
| NOTES TO FINANCIAL STATEMENTS continued | June 30, 2012 |
strategy involves uncovered option writing, it may result in less volatility mitigation than, and may be subject to more risks compared to, option strategies involving writing options on securities held by the Fund. There are various risks associated with the Fund’s call option writing strategy. The purchaser of an index option written by the Fund has the right to any appreciation in the cash value of the index over the strike price on the expiration date. Therefore, as the writer of a covered index call option, the Fund forgoes the opportunity to profit from increases in the index over the strike price of the option. However, the Fund has retained the risk of loss (net of premiums received) should the price of the index decline. Similarly, as the writer of a covered call option on a security or basket of securities held in the Fund’s portfolio, the Fund forgoes, during the option’s life, the opportunity to profit from increases in the market value of the security or securities covering the call option above the sum of the premium and the exercise price of the call but has retained the risk of loss (net of premiums received) should the price of the underlying security decline.
There are special risks associated with uncovered option writing (i.e. writing options on securities not held in the Fund’s portfolio, on indices or on exchange traded funds comprised of such securities or that track such indices), which expose the Fund to potentially significant loss. As the writer of an uncovered call option, the Fund has no risk of loss should the price of the underlying security or index decline, but bears unlimited risk of loss should the price of the underlying security or index increase above the exercise price.
To the extent that the Fund purchases options, the Fund will be subject to the following additional risks. If a put or call option purchased by the Fund is not sold when it has remaining value, and if the market price of the underlying security remains equal to or greater than the exercise price (in the case of a put), or remains less than or equal to the exercise price (in the case of a call), the Fund will lose its entire investment in the option. Also, where a put or call option on a particular security is purchased to hedge against price movements in a related security, the price of the put or call option may move more or less than the price of the related security. If restrictions on exercise were imposed, the Fund might be unable to exercise an option it had purchased. If the Fund were unable to close out an option that it had purchased on a security, it would have to exercise the option in order to realize any profit or the option may expire worthless.
The Fund entered into written option contracts during the period ended June 30, 2012.
Details of the transactions were as follows:
| Number of | Premiums | ||||||
| Contracts | Received | ||||||
| Options outstanding, beginning of period | – | $ | – | ||||
| Options written during the period | 178,764 | 34,264,078 | |||||
| Options expired during the period | (50,964 | ) | (10,278,948 | ) | |||
| Options closed during the period | (104,936 | ) | (19,608,160 | ) | |||
| Options assigned during the period | (354 | ) | (91,446 | ) | |||
| Options outstanding, end of the period | 22,510 | $ | 4,285,524 | ||||
The following table presents the types of derivatives in the Fund by location as presented on the Statement of Assets Liabilities at June 30, 2012.
| Statement of Asset and Liability Presentation of Fair Values of Derivatives (in $000s): | ||||
| (value in $000s) | Asset Derivatives | Liability Derivatives | ||
| Statement | Statement | |||
| of Assets | of Assets | |||
| Derivatives not accounted | and Liabilities | and Liabilities | ||
| for as hedging instruments | Location | Fair Value | Location | Fair Value |
| Equity risk | Investments, | $ – | Options | |
| at value* | Written, | |||
| at value | $ 5,546 | |||
| Total | $ – | $ 5,546 | ||
| * Represents purchased options, at value. | ||||
The following table presents the effect of Derivatives Instruments on the Statement of Operations for the period ended June 30, 2012.
| Effect of Derivative Instruments on the Statement of Operations (in $000s): | ||||
| Amount of | Change in Unrealized | |||
| Realized Loss | Depreciation | |||
| on Derivatives | on Derivatives | |||
Investments* | Options | Investments* | Options | |
| Equity risk | $ (165) | $ (402) | $ – | ($1,261) |
| Total | $ (165) | $ (402) | $ – | ($1,261) |
* Represents realized gain (loss) and change in unrealized appreciation (depreciation), respectively, for purchased options during the period. | ||||
Note 7 – Leverage:
Borrowings
On November 3, 2011, the Fund entered into a committed credit facility agreement with an approved counterparty (the “Counterparty”). The Counterparty has agreed to provide secured financing to the Fund up to a maximum of $42,500,000 and the Fund will provide pledged collateral to the Counterparty. Interest on the amount borrowed is based on the 1-month LIBOR plus 0.75%. An unused commitment fee of 0.10% is charged on the difference between the amount available to borrow under the credit agreement and the actual amount borrowed. At June 30, 2012, there was $34,000,000 outstanding in connection with the Fund’s credit facility. The average daily amount of borrowings on the credit facility during the period ended June 30, 2012, was $31,495,868 with a related average interest rate of 1.00%. The maximum amount outstanding during the period ended June 30, 2012 was $35,000,000. As of June 30, 2012, the market value of the securities segregated as collateral is $157,998,605.
Note 8 – Capital:
Common Shares
In connection with its organization process, the Fund sold 5,240 shares of beneficial interest to Guggenheim Funds Distributors, LLC, an affiliate of the Adviser, for consideration of $100,084 at a price of $19.10 per share. The Fund has an unlimited amount of common shares, $0.01 par value, authorized and 8,755,240 issued and outstanding. Of this amount, the Fund issued 8,750,000 shares of common stock in its initial public offering. These shares were issued at $19.10 per share after deducting the sales load.
26 l GEQ l GUGGENHEIM EQUAL WEIGHT ENHANCED EQUITY INCOME FUND ANNUAL REPORT
| NOTES TO FINANCIAL STATEMENTS continued | June 30, 2012 |
Offering costs, estimated at $350,000 or $0.04 per share, in connection with the issuance of common shares have been borne by the Fund and were charged to paid-in capital. The Adviser agreed to pay offering expenses (other than sales load) in excess of $0.04 per common share.
Note 9 – Indemnifications:
In the normal course of business, the Fund enters into contracts that contain a variety of representations, which provide general indemnifications. The Fund’s maximum exposure under these arrangements is unknown, as this would require future claims that may be made against the Fund that have not yet occurred. However, the Fund expects the risk of loss to be remote.
Note 10 – Regulatory Matters:
The Adviser has notified the Fund of the following: In 2009, the Securities and Exchange Commission (“SEC”) staff conducted an examination of the Adviser and in 2010 reported to the Adviser that the SEC staff believed certain deficiencies existed in connection with the management of a liquidated closed-end fund formerly advised by the Adviser and a thirdparty sub-adviser. In April 2012, the Adviser and a current and a former employee of the Adviser each received separate letters from the SEC staff (commonly referred to as a Wells Notice) stating that the staff intends to recommend to the SEC that action be brought against the Adviser and the current and former employee for allegedly failing to cause the fund to adequately disclose certain investments made by the fund and providing the recipients of the letters with an opportunity to respond to the potential allegations.
The Adviser has replied to the Wells Notice and responded to the SEC staff’s allegations. Although there can be no assurance as to the outcome, the Adviser has advised the Fund that it believes its disclosures were proper and that resolution of this matter will not materially and adversely affect its financial condition or its ability to act as an investment adviser to the Fund.
Note 11 – Subsequent Event:
The Fund evaluated subsequent events through the date the financial statements were available for issue and determined there were no additional material events that would require disclosure in the Fund’s financial statements, except as noted below.
On July 2, 2012, the Fund declared a quarterly dividend in the amount of $0.4375 per share. The dividend was payable on July 31, 2012 to shareholders of record on July 13, 2012.
GEQ l GUGGENHEIM EQUAL WEIGHT ENHANCED EQUITY INCOME FUND ANNUAL REPORT l 27
| REPORT OF INDEPENDENT REGISTERED PUBLIC ACCOUNTING FIRM | June 30, 2012 |
The Board of Trustees and Shareholders of
Guggenheim Equal Weight Enhanced Equity Income Fund
We have audited the accompanying statement of assets and liabilities of Guggenheim Equal Weight Enhanced Equity Income Fund (the Fund), including the portfolio of investments, as of June 30, 2012, and the related statements of operations, statement of changes in net assets, cash flows and the financials highlights for the period October 27, 2011 (commencement of investment operations) through June 30, 2012. These financial statements and financial highlights are the responsibility of the Fund’s management. Our responsibility is to express an opinion on these financial statements and financial highlights based on our audit.
We conducted our audit in accordance with the standards of the Public Company Accounting Oversight Board (United States). Those standards require that we plan and perform the audit to obtain reasonable assurance about whether the financial statements and financial highlights are free of material misstatement. We were not engaged to perform an audit of the Fund’s internal control over financial reporting. Our audit included consideration of internal control over financial reporting as a basis for designing audit procedures that are appropriate in the circumstances, but not for the purpose of expressing an opinion on the effectiveness of the Fund’s internal control over financial reporting. Accordingly, we express no such opinion. An audit also includes examining, on a test basis, evidence supporting the amounts and disclosures in the financial statements and financial highlights, assessing the accounting principles used and significant estimates made by management, and evaluating the overall financial statement presentation. Our procedures included confirmation of securities owned as of June 30, 2012, by correspondence with the custodian and brokers. We believe that our audit provides a reasonable basis for our opinion.
In our opinion, the financial statements and financial highlights referred to above present fairly, in all material respects, the financial position of Guggenheim Equal Weight Enhanced Equity Income Fund at June 30, 2012, and the results of its operations, changes in net assets, cash flows and the financial highlights for the period October 27, 2011 through June 30, 2012, in conformity with U.S. generally accepted accounting principles.

Chicago, Illinois
August 24, 2012
28 l GEQ l GUGGENHEIM EQUAL WEIGHT ENHANCED EQUITY INCOME FUND ANNUAL REPORT
| SUPPLEMENTAL INFORMATION (Unaudited) | June 30, 2012 |
Federal Income Tax Information
Qualified dividend income of as much as $2,711,764 was received by the Fund through June 30, 2012. The Fund intends to designate the maximum amount of dividends that qualify for the reduced tax rate pursuant to the Jobs and Growth Relief Reconciliation Act of 2003.
For corporate shareholders, $2,593,074 of investment income qualifies for the dividends-received deduction.
In January 2013, you will be advised on IRS Form 1099 DIV or substitute 1099 DIV as to the federal tax status of the distributions received by you in the calendar year 2012.
Trustees
The Trustees of the Guggenheim Equal Weight Enhanced Equity Income Fund and their principal occupations during the past five years:
Number of | ||||
Name, Address*, | Portfolios in | |||
| Year of Birth | the Fund | |||
| and Position(s) | Term of Office** | Principal Occupations during | Complex*** | |
| Held with | and Length of | the Past Five Years and | Overseen | Other Directorships |
| Registrant | Time Served | Other Affiliations | by Trustee | Held by Trustee |
| Independent Trustees: | ||||
| Randall C. Barnes | Since 2011 | Private Investor (2001-present). Formerly, Senior Vice President & Treasurer, | 55 | None. |
| Year of Birth: 1951 | PepsiCo., Inc. (1993-1997), President, Pizza Hut International (1991-1993) | |||
| Trustee | and Senior Vice President, Strategic Planning and New Business Development | |||
| of PepsiCo, Inc. (1987-1990). | ||||
| Roman Friedrich III | Since 2011 | Founder and President of Roman Friedrich & Company, Ltd., a mining and | 50 | Director, Blue Sky Uranium Corp. |
| Year of birth: 1946 | metals investment bank (1998-present). Formerly, Senior Managing Director | (2011-present), Zincore Metals, | ||
| Trustee | of MLV & Co., LLC, an investment bank and institutional broker-dealer | Inc. (2009-present). Previously, | ||
| specializing in capital intensive industries such as energy, metals and mining | Director of Axiom Gold and Silver | |||
| (2010-2011). | Corp. (2011-2012), GFM Resources | |||
| Ltd. (2005-2010), StrataGold Corp. | ||||
| (2003-2009), and Gateway Gold | ||||
| Corp. (2004-2008). | ||||
| Robert B. Karn III | Since 2011 | Consultant (1998-present). Previously, Managing Partner, Financial and | 50 | Director of Peabody Energy Co. |
| Year of birth: 1942 | Economic Consulting, St. Louis office of Arthur Andersen, LLP (1965-1998). | (2003 – present), GP Natural | ||
| Trustee | Resource Partners LLC | |||
| (2002 – present). | ||||
| Ronald A. Nyberg | Since 2011 | Partner of Nyberg & Cassioppi, LLC, a law firm specializing in corporate law, | 57 | None. |
| Year of birth: 1953 | estate planning and business transactions (2000-present). Formerly, Executive | |||
| Trustee | Vice President, General Counsel and Corporate Secretary of Van Kampen | |||
| Investments (1982-1999). | ||||
| Ronald E. Toupin, Jr. | Since 2011 | Portfolio Consultant (2010-present). Formerly, Vice President, Manager and | 54 | Trustee, Bennett Group of |
| Year of birth: 1958 | Portfolio Manager of Nuveen Asset Management (1998-1999), Vice President | Funds (2011-present). | ||
| Trustee, Chairman | of Nuveen Investment Advisory Corp. (1992-1999), Vice President and Manager | |||
| of Nuveen Unit Investment Trusts (1991-1999), and Assistant Vice President | ||||
| and Portfolio Manager of Nuveen Unit Investment Trusts (1988-1999), each | ||||
| of John Nuveen & Co., Inc. (1982-1999). | ||||
| Interested Trustee: | ||||
| Donald C. Cacciapaglia† | Since 2012 | President and Chief Executive Officer of Guggenheim Funds Distributors, | 50 | Trustee, Rydex Dynamic Funds, |
| Year of Birth: 1951 | LLC and President and Chief Executive Officer of Guggenheim Funds Investment | Rydex ETF Trust, Rydex Series | ||
| Trustee, Chief | Advisors, LLC (2010 – present); Chief Executive Officer of funds in the Fund | Funds and Rydex Variable Trust | ||
| Executive Officer | Complex; President and Chief Executive Officer of funds in the Rydex fund | (2012-present); Independent Board | ||
| complex (2012-present). Formerly, Chief Operating Officer of Guggenheim | Member, Equitrust Life Insurance | |||
| Partners Investment Management, LLC (2010 – 2011); Chairman and CEO | Company, Guggenheim Life and | |||
| of Channel Capital Group Inc. and Channel Capital Group LLC (2002-2010); | Annuity Company, and Paragon Life | |||
| Managing Director of PaineWebber (1996-2002). | Insurance Company of Indiana. | |||
| † | Mr. Donald C. Cacciapaglia is an “interested person” (as defined in section 2(a)(19) of the 1940 Act) (“Interested Trustee”) of the Trust because of his position as the President and CEO of the Adviser. |
| * | Address for all Trustees: 2455 Corporate West Drive, Lisle, IL 60532 |
| ** | After a Trustee’s initial term, each Trustee is expected to serve a two-year term concurrent with the class of Trustees for which he serves: |
| - Messrs. Barnes and Cacciapaglia, as Class I Trustees, are expected to stand for re-election at the Fund’s annual meeting of shareholders for the fiscal year ending June 30, 2014. | |
| - Messrs. Friedrich and Nyberg, as Class II Trustees, are expected to stand for re-election at the Fund’s annual meeting of shareholders for the fiscal year ending June 30, 2015. | |
| - Messrs. Karn and Toupin, as Class III Trustees, are expected to stand for re-election at the Fund’s annual meeting of shareholders for the fiscal year ending June 30, 2013. | |
| *** | The Guggenheim Funds Fund Complex consists of U.S. registered investment companies advised or serviced by Guggenheim Funds Investment Advisors, LLC or Guggenheim Funds Distributors, LLC. The Guggenheim Funds Fund Complex is overseen by multiple Boards of Trustees. |
GEQ l GUGGENHEIM EQUAL WEIGHT ENHANCED EQUITY INCOME FUND ANNUAL REPORT l 29
| SUPPLEMENTAL INFORMATION (Unaudited) continued | June 30, 2012 |
Executive Officers
The executive officers of the Guggenheim Equal Weight Enhanced Equity Income Fund, who are not trustees, and their principal occupations during the past five years:
| Name, Address*, | ||
| Year of Birth | Term of Office** | |
| and Position(s) Held | and Length of | Principal Occupations During the Past Five Years and |
| with Registrant | Time Served | Other Affiliations |
| Kevin M. Robinson | Since 2011 | Senior Managing Director and General Counsel of Guggenheim Funds Investment Advisors, LLC, Guggenheim Funds |
| Year of Birth: 1959 | Distributors, LLC and Guggenheim Funds Services LLC (2007-present). Chief Legal Officer and/or Chief Executive | |
| Chief Legal Officer | Officer of certain other funds in the Fund Complex. Formerly, Associate General Counsel and Assistant Corporate | |
| Secretary of NYSE Euronext, Inc. (2000-2007). | ||
| John Sullivan | Since 2011 | Senior Managing Director of Guggenheim Funds Investment Advisors, LLC and Guggenheim Funds Distributors, |
| Year of Birth: 1955 | LLC (2010-present). Chief Financial Officer, Chief Accounting Officer and Treasurer of certain other funds in the Fund | |
| Chief Accounting Officer, | Complex. Formerly, Chief Compliance Officer, Van Kampen Funds (2004–2010). | |
| Chief Financial Officer | ||
| and Treasurer | ||
| Ann E. Edgeworth | Since 2012 | Director, Foreside Compliance Services, LLC (2011-present). Formerly, Vice President, State Street Corporation |
| Year of birth: 1961 | (2007-2011); Director, Investors Bank & Trust (2004-2007). | |
| Interim Chief | ||
| Compliance Officer | ||
| Mark E. Mathiasen | Since 2011 | Director, Associate General Counsel of Guggenheim Funds Services LLC (2012-present). Formerly, Vice President; |
| Year of birth: 1978 | Assistant General Counsel of Guggenheim Funds Services LLC (2007-present). Secretary of certain other funds | |
| Secretary | in the Fund Complex. |
| * | Address for all Officers: 2455 Corporate West Drive, Lisle, IL 60532 |
| ** | Officers serve at the pleasure of the Board of Trustees and until his or her successor is appointed and qualified or until his or her earlier resignation or removal. |
30 l GEQ l GUGGENHEIM EQUAL WEIGHT ENHANCED EQUITY INCOME FUND ANNUAL REPORT
| DIVIDEND REINVESTMENT PLAN (Unaudited) | June 30, 2012 |
Unless the registered owner of common shares elects to receive cash by contacting the Plan Administrator, all dividends declared on common shares of the Fund will be automatically reinvested by Computershare Shareowner Services LLC (the “Plan Administrator”), Administrator for shareholders in the Fund’s Dividend Reinvestment Plan (the “Plan”), in additional common shares of the Fund. Participation in the Plan is completely voluntary and may be terminated or resumed at any time without penalty by notice if received and processed by the Plan Administrator prior to the dividend record date; otherwise such termination or resumption will be effective with respect to any subsequently declared dividend or other distribution. Some brokers may automatically elect to receive cash on your behalf and may re-invest that cash in additional common shares of the Fund for you. If you wish for all dividends declared on your common shares of the Fund to be automatically reinvested pursuant to the Plan, please contact your broker.
The Plan Administrator will open an account for each common shareholder under the Plan in the same name in which such common shareholder’s common shares are registered. Whenever the Fund declares a dividend or other distribution (together, a “Dividend”) payable in cash, non-participants in the Plan will receive cash and participants in the Plan will receive the equivalent in common shares. The common shares will be acquired by the Plan Administrator for the participants’ accounts, depending upon the circumstances described below, either (i) through receipt of additional unissued but authorized common shares from the Fund (“Newly Issued Common Shares”) or (ii) by purchase of outstanding common shares on the open market (“Open-Market Purchases”) on the New York Stock Exchange or elsewhere. If, on the payment date for any Dividend, the closing market price plus estimated brokerage commission per common share is equal to or greater than the net asset value per common share, the Plan Administrator will invest the Dividend amount in Newly Issued Common Shares on behalf of the participants. The number of Newly Issued Common Shares to be credited to each participant’s account will be determined by dividing the dollar amount of the Dividend by the net asset value per common share on the payment date; provided that, if the net asset value is less than or equal to 95% of the closing market value on the payment date, the dollar amount of the Dividend will be divided by 95% of the closing market price per common share on the payment date. If, on the payment date for any Dividend, the net asset value per common share is greater than the closing market value plus estimated brokerage commission, the Plan Administrator will invest the Dividend amount in common shares acquired on behalf of the participants in Open-Market Purchases.
If, before the Plan Administrator has completed its Open-Market Purchases, the market price per common share exceeds the net asset value per common share, the average per common share purchase price paid by the Plan Administrator may exceed the net asset value of the common shares, resulting in the acquisition of fewer common shares than if the Dividend had been paid in Newly Issued Common Shares on the Dividend payment date. Because of the foregoing difficulty with respect to Open-Market Purchases, the Plan provides that if the Plan Administrator is unable to invest the full Dividend amount in Open-Market Purchases during the purchase period or if the market discount shifts to a market premium during the purchase period, the Plan Administrator may cease making Open-Market Purchases and may invest the uninvested portion of the Dividend amount in Newly Issued Common Shares at net asset value per common share at the close of business on the Last Purchase Date provided that, if the net asset value is less than or equal to 95% of the then current market price per common share; the dollar amount of the Dividend will be divided by 95% of the market price on the payment date.
The Plan Administrator maintains all shareholders’ accounts in the Plan and furnishes written confirmation of all transactions in the accounts, including information needed by shareholders for tax records. Common shares in the account of each Plan participant will be held by the Plan Administrator on behalf of the Plan participant, and each shareholder proxy will include those shares purchased or received pursuant to the Plan. The Plan Administrator will forward all proxy solicitation materials to participants and vote proxies for shares held under the Plan in accordance with the instruction of the participants.
There will be no brokerage charges with respect to common shares issued directly by the Fund. However, each participant will pay a pro rata share of brokerage commission incurred in connection with Open-Market Purchases. The automatic reinvestment of Dividends will not relieve participants of any Federal, state or local income tax that may be payable (or required to be withheld) on such Dividends.
The Fund reserves the right to amend or terminate the Plan. There is no direct service charge to participants with regard to purchases in the Plan; however, the Fund reserves the right to amend the Plan to include a service charge payable by the participants.
All correspondence or questions concerning the Plan should be directed to the Plan Administrator, Computershare Shareowners Services, LLC, P.O. Box 358015, Pittsburgh, PA 15252-8015, Phone Number: (866) 488-3559.
GEQ l GUGGENHEIM EQUAL WEIGHT ENHANCED EQUITY INCOME FUND ANNUAL REPORT l 31
This Page Intentionally Left Blank.
This Page Intentionally Left Blank.
This Page Intentionally Left Blank.
| FUND INFORMATION | June 30, 2012 |
| Board of Trustees | Executive Officers | Adviser and Administrator |
| Randall C. Barnes | Donald C. Cacciapaglia | Guggenheim Funds Investment |
| Chief Executive Officer | Advisors, LLC | |
| Donald C. Cacciapaglia* | Lisle, Illinois | |
| Kevin M. Robinson | ||
| Roman Friedrich III | Chief Legal Officer | Options Strategy Investment |
| Sub-Adviser | ||
| Robert B. Karn III | John Sullivan | Guggenheim Partners |
| Chief Accounting Officer, Chief | Investment Management, LLC | |
| Ronald A. Nyberg | Financial Officer, and Treasurer | Santa Monica, California |
| Ronald E. Toupin, Jr., | Ann E. Edgeworth | Equity Strategy Investment |
| Chairman | Interim Chief Compliance Officer | Sub-Adviser |
| Security Investors, LLC | ||
| * Trustee is an “interested person” | Mark E. Mathiasen | New York, NY |
| (as defined in section 2(a)(19) | Secretary | |
| of the 1940 Act) (“Interested | Accounting Agent and Custodian | |
| Trustee”) of the Trust because | The Bank of New York Mellon | |
| of his position as the President | New York, New York | |
| and CEO of the Adviser. | ||
| Legal Counsel | ||
| Skadden, Arps, Slate, Meagher & | ||
| Flom LLP | ||
| New York, New York | ||
| Independent Registered | ||
| Public Accounting Firm | ||
| Ernst & Young LLP | ||
| Chicago, Illinois |
Privacy Principles of the Fund
The Fund is committed to maintaining the privacy of its shareholders and to safeguarding their non-public personal information. The following information is provided to help you understand what personal information the Fund collects, how the Fund protects that information and why, in certain cases, the Fund may share information with select other parties.
Generally, the Fund does not receive any non-public personal information relating to its shareholders, although certain non-public personal information of its shareholders may become available to the Fund. The Fund does not disclose any non-public personal information about its shareholders or former shareholders to anyone, except as permitted by law or as is necessary in order to service shareholder accounts (for example, to a transfer agent or third party administrator).
The Fund restricts access to non-public personal information about its shareholders to employees of the Fund’s investment advisor and its affiliates with a legitimate business need for the information. The Fund maintains physical, electronic and procedural safeguards designed to protect the non-public personal information of its shareholders.
Questions concerning your shares of Guggenheim Equal Weight Enhanced Equity Income Fund?
| · | If your shares are held in a Brokerage Account, contact your Broker. |
| · | If you have physical possession of your shares in certificate form, contact the Fund’s Transfer Agent: |
| Computershare Shareowner Services LLC, 480 Washington Blvd., Jersey City, NJ 07310; (866) 488-3559. |
This report is sent to shareholders of Guggenheim Equal Weight Enhanced Equity Income Fund for their information. It is not a Prospectus, circular or representation intended for use in the purchase or sale of shares of the Fund or of any securities mentioned in this report.
A description of the Fund’s proxy voting policies and procedures related to portfolio securities is available without charge, upon request, by calling the Fund at (866)274-2227.
Information regarding how the Fund voted proxies for portfolio securities, if applicable, during the most recent 12-month period ended June 30, is also available, without charge and upon request by calling (866)274-2227, by visiting the Funds’ website at www.guggenheimfunds.com/geq or by accessing the Fund’s Form N-PX on the U.S. Securities and Exchange Commission’s (SEC) website at www.sec.gov.
The Fund files its complete schedule of portfolio holdings with the SEC for the first and third quarters of each fiscal year on Form N-Q. The Fund’s Form N-Q is available on the SEC website at www.sec.gov or by visiting the Funds’ website at www.guggenheimfunds.com/geq. The Fund’s Form N-Q may also be viewed and copied at the SEC’s Public Reference Room in Washington, DC; information on the operation of the Public Reference Room may be obtained by calling (800) SEC-0330 or at www.sec.gov.
Notice to Shareholders
Notice is hereby give in accordance with Section 23(c) of the Investment Company Act of 1940, as amended, that the Fund from time to time may purchase shares of its common stock in the open market.
GEQ l GUGGENHEIM EQUAL WEIGHT ENHANCED EQUITY INCOME FUND ANNUAL REPORT l 35
ABOUT THE FUND MANAGER
Guggenheim Partners Investment Management, LLC
Guggenheim Partners Investment Management, LLC (“GPIM”) is an indirect subsidiary of Guggenheim Partners, LLC, a diversified financial services firm. The firm provides capital markets services, portfolio and risk management expertise, wealth management, and investment advisory services. Clients of Guggenheim Partners, LLC subsidiaries are an elite mix of individuals, family offices, endowments, foundations, insurance companies and other institutions.
Investment Philosophy
GPIM’s investment philosophy is predicated upon the belief that thorough research and independent thought are rewarded with performance that has the potential to outperform benchmark indexes with both lower volatility and lower correlation of returns over time as compared to such benchmark indexes.
Investment Process
GPIM’s investment process is a collaborative effort between various groups including the Portfolio Construction Group, which utilize proprietary portfolio construction and risk modeling tools to determine allocation of assets among a variety of sectors, and its Sector Specialists, who are responsible for security selection within these sectors and for implementing securities transactions, including the structuring of certain securities directly with the issuers or with investment banks and dealers involved in the origination of such securities.
Security Investors, LLC
Security Investors, LLC is a registered investment advisor, and does business as Security Global Investors (“SGI”)® and Rydex Investments. Security Investors, LLC is currently a subsidiary of Security Benefit Corporation which is wholly owned by Guggenheim SBC Holdings, LLC. a special purpose entity managed by an affiliate of Guggenheim Partners, LLC. For more than 20 years, SGI has been dedicated to helping investors and financial professionals navigate diverse market conditions with confidence. With approximately $20 billion in assets, SGI offers institutional investors and financial intermediaries a range of four investment competencies for building well-diversified portfolios; Alternative Assets and Strategies; Fundamental Active Alpha Strategies (Equity and Fixed-Income); Target Beta Strategies; and Exchange Traded products (ETFs).
Guggenheim Funds Distributors, Inc. 2455 Corporate West Drive Lisle, IL 60532 Member FINRA/SIPC (08/12) | NOT FDIC-INSURED l NOT BANK-GUARANTEED l MAY LOSE VALUE |
CEF-GEQ-AR-0612
Item 2. Code of Ethics.
(a) The registrant has adopted a code of ethics (the "Code of Ethics") that applies to its principal executive officer, principal financial officer, principal accounting officer or controller, or persons performing similar functions.
(b) No information need be disclosed pursuant to this paragraph.
(c) The registrant’s code of ethics that applies to the registrant’s principal executive officer, principal accounting officer or controller, or persons performing similar functions, was amended during the period to include: specific examples of conflict of interest situations requiring prior written approval; annual certification requirements for officers covered under the code of ethics; specific recordkeeping obligations by the registrant; and a confidentiality provision.
(d) The registrant has not granted a waiver or an implicit waiver to its principal executive officer, principal financial officer, principal accounting officer or controller, or persons performing similar functions from a provision of its Code of Ethics during the period covered by this report.
(e) Not applicable.
(f) (1) The registrant's Code of Ethics is attached hereto as an exhibit.
(2) Not applicable.
(3) Not applicable.
Item 3. Audit Committee Financial Expert.
The registrant's Board of Trustees has determined that it has at least one audit committee financial expert serving on its audit committee, Robert B. Karn III. Mr. Karn is an “independent” Trustee as defined in this Item 3 of Form N-CSR. Mr. Karn qualifies as an audit committee financial expert by virtue of his experience obtained as a managing partner in a public accounting firm, which included an understanding of generally accepted accounting principles (“GAAP”) in connection with the accounting for estimates, accruals and reserves and also the review, audit and evaluation of financial statements using GAAP.
(Under applicable securities laws, a person who is determined to be an audit committee financial expert will not be deemed an "expert" for any purpose, including without limitation for the purposes of Section 11 of the Securities Act of 1933, as amended, as a result of being designated or identified as an audit committee financial expert. The designation or identification of a person as an audit committee financial expert does not impose on such person any duties, obligations, or liabilities that are greater than the duties, obligations, and liabilities imposed on such person as a member of the audit committee and Board of Trustees in the absence of such designation or identification. The designation or identification of a person as an audit committee financial expert does not affect the duties, obligations or liability of any other member of the audit committee or Board of Trustees.)
Item 4. Principal Accountant Fees and Services.
(a) Audit Fees: the aggregate fees billed for professional services rendered by the principal accountant for the audit of the registrant's annual financial statements or services that are normally provided by the accountant in connection with statutory and regulatory filings or engagements was $28,900 for the initial fiscal period from the registrant’s inception date of October 27, 2011, through June 30, 3012.
(b) Audit-Related Fees: the aggregate fees billed for assurance and related services by the principal accountant that are reasonably related to the performance of the audit of the registrant’s financial statements and are not reported under paragraph (a) of this Item, was $24,000 for the initial fiscal period from the registrant’s inception date of October 27, 2011, through June 30, 3012.
The registrant’s principal accountant did not bill for non-audit services that required approval by the audit committee pursuant to paragraph (c)(7)(ii) of Rule 2-01 of Regulation S-X during the registrant’s last two fiscal years.
(c) Tax Fees: the aggregate fees billed for professional services rendered by the principal accountant for tax compliance, tax advice and tax planning, including federal, state and local income tax return preparation and related advice and determination of taxable income and miscellaneous tax advice was $4,250 for the initial fiscal period from the registrant’s inception date of October 27, 2011, through June 30, 3012.
The registrant’s principal accountant did not bill for non-audit services that required approval by the audit committee pursuant to paragraph (c)(7)(ii) of Rule 2-01 of Regulation S-X during the registrant’s last two fiscal years.
(d) All Other Fees: the aggregate fees billed for products and services provided by the principal accountant, other than the services reported in paragraphs (a) through (c) of this Item was $0 for the initial fiscal period from the registrant’s inception date of October 27, 2011, through June 30, 3012.
The registrant’s principal accountant did not bill for non-audit services that required approval by the audit committee pursuant to paragraph (c)(7)(ii) of Rule 2-01 of Regulation S-X during the registrant’s last two fiscal years.
(e) Audit Committee Pre-Approval Policies and Procedures.
(1) The registrant’s audit committee reviews, and in its sole discretion, pre-approves, pursuant to written pre-approval procedures (A) all engagements for audit and non-audit services to be provided by the principal accountant to the registrant and (B) all engagements for non-audit services to be provided by the principal accountant (1) to the registrant’s investment adviser (not including a sub-adviser whose role is primarily portfolio management and is sub-contracted or overseen by another investment adviser) and (2) to any entity controlling, controlled by or under common control with the registrant’s investment adviser that provides ongoing services to the registrant; but in the case of the services described in subsection (B)(1) or (2), only if the engagement relates directly to the operations and financial reporting of the registrant; provided that such pre-approval need not be obtained in circumstances in which the pre-approval requirement is waived under rules promulgated by the Securities and Exchange Commission or New York Stock Exchange listing standards. Sections IV.C.2 and IV.C.3 of the registrant’s audit committee’s Audit Committee Charter contain the Audit Committee’s Pre-Approval Policies and Procedures and such sections are included below.
Section IV.C.2: Pre-approve any engagement of the independent auditors to provide any non-prohibited services to the Trust, including the fees and other compensation to be paid to the independent auditors (unless an exception is available under Rule 2-01 of Regulation S-X).
| (a) | The categories of services to be reviewed and considered for pre-approval include the following: |
Audit Services
| · | Annual financial statement audits |
| · | Seed audits (related to new product filings, as required) |
| · | SEC and regulatory filings and consents |
Audit-Related Services
| · | Accounting consultations |
| · | Fund merger/reorganization support services |
| · | Other accounting related matters |
| · | Agreed upon procedures reports |
| · | Attestation reports |
| · | Other internal control reports |
Tax Services
| · | Tax compliance services related to the filing of amendments: |
| o | Federal, state and local income tax compliance |
| o | Sales and use tax compliance |
| · | Timely RIC qualification reviews |
| · | Tax distribution analysis and planning |
| · | Tax authority examination services |
| · | Tax appeals support services |
| · | Accounting methods studies |
| · | Fund merger support services |
| · | Tax compliance, planning and advice services and related projects |
| (b) | The Audit Committee has pre-approved those services, which fall into one of the categories of services listed under 2(a) above and for which the estimated fees are less than $25,000. |
| (c) | For services with estimated fees of $25,000 or more, but less than $50,000, the Chairman is hereby authorized to pre-approve such services on behalf of the Audit Committee. |
| (d) | For services with estimated fees of $50,000 or more, such services require pre-approval by the Audit Committee. |
| (e) | The independent auditors or the Chief Accounting Officer of the Trust (or an officer of the Trust who reports to the Chief Accounting Officer) shall report to the Audit Committee at each of its regular quarterly meetings all audit, audit-related and permissible non-audit services initiated since the last such report (unless the services were contained in the initial audit plan, as previously presented to, and approved by, the Audit Committee). The report shall include a general description of the services and projected fees, and the means by which such services were approved by the Audit Committee (including the particular category listed above under which pre-approval was obtained). |
Section IV.C.3: Pre-approve any engagement of the independent auditors, including the fees and other compensation to be paid to the independent auditors, to provide any non-audit services to the Adviser (or any “control affiliate” of the Adviser providing ongoing services to the Trust), if the engagement relates directly to the operations and financial reporting of the Trust (unless an exception is available under Rule 2-01 of Regulation S-X).
| (a) | The Chairman or any member of the Audit Committee may grant the pre-approval for non-audit services to the Adviser (or any “control affiliate” of the Adviser providing ongoing services to the Trust) relating directly to the operations and financial reporting of the Trust for which the estimated fees are less than $25,000. All such delegated pre-approvals shall be presented to the Audit Committee no later than the next Audit Committee meeting. |
| (b) | For non-audit services to the Adviser (or any “control affiliate” of the Adviser providing ongoing services to the Trust) relating directly to the operations and financial reporting of the Trust for which the estimated fees are $25,000 or more, such services require pre-approval by the Audit Committee. |
(2) None of the services described in each of Items 4(b) through (d) were approved by the Audit Committee pursuant to paragraph (c)(7)(i)(C) of Rule 2-01 of Regulation S-X.
(f) Not applicable.
(g) The aggregate non-audit fees billed by the registrant's accountant for services rendered to the registrant, the registrant’s investment adviser (not including a sub-adviser whose role is primarily portfolio management and is sub-contracted with or overseen by another investment adviser) and/or any entity controlling, controlled by, or under common control with the adviser that provides ongoing services to the registrant that directly related to the operations and financial reporting of the registrant was $4,250 for the initial fiscal period from the registrant’s inception date of October 27, 2011, through June 30, 3012.
(h) Not applicable.
Item 5. Audit Committee of Listed Registrants.
| (a) The registrant has a separately designated standing audit committee established in accordance with Section 3(a)(58)(A) of the Securities Exchange Act of 1934, as amended. The audit committee of the registrant is composed of: Randall C. Barnes; Ronald A. Nyberg; Ronald E. Toupin, Jr.; Robert B. Karn III; and Roman Friedrich III. |
(b) Not applicable.
Item 6. Schedule of Investments.
The Schedule of Investments is included as part of Item 1.
Item 7. Disclosure of Proxy Voting Policies and Procedures for Closed-End Management Investment Companies.
The registrant has delegated the voting of proxies relating to its voting securities to the registrant’s Options Strategy Sub-Adviser, Guggenheim Partners Investment Management, LLC (“GPIM”), formerly known as Guggenheim Partners Asset Management, LLC. GPIM’s proxy voting policies and procedures are included as an exhibit hereto.
Item 8. Portfolio Managers of Closed-End Management Investment Companies.
(a)(1) GPIM serves as the Options Strategy Sub-Adviser for the registrant and is responsible for the day-to-day management of the registrant’s options portfolio. The Fund’s options strategy follows the Options Strategy Sub-Adviser’s proprietary dynamic rules-based methodology, GPIM’s “Portable Volatility Monetization Strategy”SM.
The following individuals at GPIM share primary responsibility for the management of the registrant’s portfolio and is provided as of June 30, 2012:
Name | Since | Professional Experience During the Last Five Years |
| Farhan Sharaff | 2011 | Guggenheim Partners Investment Management, LLC.: Senior Managing Director – 7/10–Present. |
| Jayson Flowers | 2011 | Guggenheim Partners Investment Management, LLC.: Managing Director, 12/05 – Present; Guggenheim Partners, LLC: Managing Director -2001–2005 |
| Jamal Pesaran | 2011 | Guggenheim Partners Investment Management, LLC.: Vice President, Portfolio Manager– 2008 –Present. |
Security Investors, LLC (“Security Investors”) serves as the Equity Strategy Sub-Adviser for the registrant and is responsible for the day-to-day management of the registrant’s equity portfolio. The Fund’s equity strategy provides that the registrant will invest in a portfolio of common stocks included in the S&P 500 Index in equal weight.
The following individuals at Security Investors share primary responsibility for the management of the registrant’s equity portfolio and is provided as of June 30, 2012:
Name | Since | Professional Experience During the Last Five Years |
| Ryan Harder | 2011 | Security Investors, LLC: Senior Portfolio Manager, 2004-present. |
| James R. King | 2011 | Security Investors, LLC: Portfolio Manager, 1996-present. With the exception of the period from March 15, 2008 to January 18, 2011, Mr. King has been associated with the Advisor since 1996. |
(a)(2)(i-iii) Other Accounts Managed by the Portfolio Managers
The following tables summarize information regarding each of the other accounts managed by the GPIM portfolio managers as of June 30, 2012:
Farhan Sharaff:
| Type of Account | Number of Accounts | Total Assets in the Accounts | Number of Accounts In Which the Advisory Fee is Based on Performance | Total Assets in the Accounts In Which the Advisory Fee is Based on Performance | |||||
Registered investment companies | 3 | $318,793,347 | 0 | 0 | |||||
Other pooled investment vehicles | 3 | $481,377,323 | 1 | 421,203,451 | |||||
Other accounts | 3 | $317,535,748 | 0 | 0 | |||||
Jayson Flowers:
| Type of Account | Number of Accounts | Total Assets in the Accounts | Number of Accounts In Which the Advisory Fee is Based on Performance | Total Assets in the Accounts In Which the Advisory Fee is Based on Performance | |||||
Registered investment companies | 2 | $274,085,968 | 0 | 0 | |||||
Other pooled investment vehicles | 5 | $275,277,370 | 0 | 0 | |||||
Other accounts | 1 | $3,263,221 | 0 | 0 | |||||
Jamal Pesaran:
| Type of Account | Number of Accounts | Total Assets in the Accounts | Number of Accounts In Which the Advisory Fee is Based on Performance | Total Assets in the Accounts In Which the Advisory Fee is Based on Performance | |||||
Registered investment companies | 3 | $318,793,347 | 0 | 0 | |||||
Other pooled investment vehicles | 2 | $60,173,872 | 0 | 0 | |||||
Other accounts | 1 | $3,263,211 | 0 | 0 | |||||
The following tables summarize information regarding each of the other accounts managed by the Security Investors portfolio managers as of June 30, 2012:
Ryan Harder:
| Type of Account | Number of Accounts | Total Assets in the Accounts | Number of Accounts In Which the Advisory Fee is Based on Performance | Total Assets in the Accounts In Which the Advisory Fee is Based on Performance | |||||
Registered investment companies | 158 | $14,821,071,792 | 0 | $0 | |||||
Other pooled investment vehicles | 1 | $85,859,449 | 0 | $0 | |||||
Other accounts | 6 | Less than $5 million | 0 | $0 | |||||
James R. King:
| Type of Account | Number of Accounts | Total Assets in the Accounts | Number of Accounts In Which the Advisory Fee is Based on Performance | Total Assets in the Accounts In Which the Advisory Fee is Based on Performance | |||||
Registered investment companies | 28 | $5,234,027,327 | 0 | $0 | |||||
Other pooled investment vehicles | 0 | $0 | 0 | $0 | |||||
Other accounts | 5 | Less than $5 million | 0 | $0 | |||||
(a)(2)(iv) Potential Conflicts of Interest
Actual or apparent conflicts of interest may arise when a portfolio manager has day-to-day management responsibilities with respect to more than one fund or other account. More specifically, portfolio managers who manage multiple funds and/or other accounts may be presented with one or more of the following potential conflicts.
The management of multiple funds and/or other accounts may result in a portfolio manager devoting unequal time and attention to the management of each fund and/or other account. The Sub-Advisers seek to manage such competing interests for the time and attention of a portfolio manager by having the portfolio manager focus on a particular investment discipline. Most other accounts managed by a portfolio manager are managed using the same investment models that are used in connection with the management of the Fund.
If a portfolio manager identifies a limited investment opportunity which may be suitable for more than one fund or other account, a fund may not be able to take full advantage of the opportunity due to an allocation of filled purchase or sale orders across all eligible funds and other accounts. To deal with these situations, the Sub-Advisers have adopted procedures for allocating portfolio transactions across multiple accounts. In such situations the Sub-Advisers will, consistent with their fiduciary obligations under the Advisers Act, endeavor to achieve a fair and equitable allocation of limited investment opportunities among all funds and accounts by employing methods such as a rotation strategy, under which limited investment opportunities are allocated to funds on an alternating basis.
The Sub-Advisers determine which broker to use to execute each order, consistent with their duty to seek best execution of the transaction. However, with respect to certain other accounts (such as mutual funds for which the Sub-Advisers act as adviser, other pooled investment vehicles that are not registered mutual funds, and other accounts managed for organizations and individuals), the Sub-Advisers may be limited by the client with respect to the selection of brokers or may be instructed to direct trades through a particular broker. In these cases, trades for a fund in a particular security may be placed separately from, rather than aggregated with, such other accounts. Having separate transactions with respect to a security may temporarily affect the market price of the security for the execution of the transaction, or both, to the possible detriment of the Fund or other account(s) involved.
The Sub-Advisers have adopted certain compliance procedures which are designed to address these types of conflicts. However, there is no guarantee that such procedures will detect each and every situation in which a conflict arises.
(a)(3) Portfolio Manager Compensation
GPIM compensates Messrs. Farhan, Flowers, and Pesaran for their management of the registrant’s portfolio. Compensation is evaluated based on their contribution to investment performance relative to pertinent benchmarks and qualitatively based on factors such as teamwork and client service efforts. GPIM’s staff incentives may include: a competitive base salary, bonus determined by individual and firm wide performance, equity participation, and participation opportunities in various GPIM investments. All GPIM employees are also eligible to participate in a 401(k) plan to which GPIM may make a discretionary match after the completion of each plan year.
Security Investors compensates Messrs. Harder and King for their management of the registrant. The portfolio managers’ compensation consists of an annual salary and the potential for two discretionary awards through a short-term and long-term incentive plan.
| · | The Short-Term Incentive award is designed to create an annual pool funded through the retention of a percentage of revenue on those assets managed by the investment team. Senior management then determines individual allocations based primarily on contribution to investment performance as well as a number of more subjective factors, including enhancements to existing products, creation of new products and concepts, support of sales, marketing and client service, and contributions to the advancement of the organization as a whole. |
| · | Certain senior portfolio managers are also incented through a Long-Term Plan which is designed to reward the portfolio managers on the growth of the business as a whole. This pool funds over a three year time frame based upon the operating income growth of the business. Units, which represent the percentage of the pool, are allocated over time to individuals based upon the portfolio managers’ contributions to Security Investors’s success as determined by management |
(a)(4) Portfolio Manager Securities Ownership
The following table discloses the dollar range of equity securities of the registrant beneficially owned by each GPIM portfolio manager as of June 30, 2012:
| Name of Portfolio Manager | Dollar Amount of Equity Securities in Fund | |
Farhan Sharaff Jayson Flowers Jamal Pesaran | $0 $0 $0 |
The following table discloses the dollar range of equity securities of the registrant beneficially owned by each Security Investors portfolio manager as of June 30, 2012:
| Name of Portfolio Manager | Dollar Amount of Equity Securities in Fund | |
Ryan Harder James R. King | $0 $0 |
Item 9. Purchases of Equity Securities by Closed-End Management Investment Company and Affiliated Purchasers.
None.
Item 10. Submission of Matters to a Vote of Security Holders.
The registrant has not made any material changes to the procedures by which shareholders may recommend nominees to the registrant’s Board of Trustees.
Item 11. Controls and Procedures.
(a) The registrant's principal executive officer and principal financial officer have evaluated the registrant's disclosure controls and procedures (as defined in Rule 30a-3(c) under the Investment Company Act) as of a date within 90 days of this filing and have concluded based on such evaluation, as required by Rule 30a-3(b) under the Investment Company Act, that the registrant's disclosure controls and procedures were effective, as of that date, in ensuring that information required to be disclosed by the registrant in this Form N-CSR was recorded, processed, summarized, and reported within the time periods specified in the Securities and Exchange Commission’s rules and forms.
(b) There were no changes in the registrant’s internal control over financial reporting (as defined in Rule 30a-3(d) under the Investment Company Act) that occurred during the registrant’s second fiscal quarter of the period covered by this report that have materially affected, or are reasonably likely to materially affect, the registrant’s internal control over financial reporting.
Item 12. Exhibits.
| (a)(1) | Code of Ethics for Chief Executive and Senior Financial Officers. |
| (a)(2) | Certifications of principal executive officer and principal financial officer pursuant to Rule 30a-2(a) under the Investment Company Act. |
| (a)(3) | Not applicable. |
| (b) | Certifications of principal executive officer and principal financial officer pursuant to Rule 30a-2(b) under the Investment Company Act and Section 906 of the Sarbanes-Oxley Act of 2002. |
| (c) | Proxy Voting Policies and Procedures. |
SIGNATURES
Pursuant to the requirements of the Securities Exchange Act of 1934 and the Investment Company Act of 1940, the registrant has duly caused this report to be signed on its behalf by the undersigned, thereunto duly authorized.
(Registrant) Guggenheim Equal Weight Enhanced Equity Income Fund
By: /s/Donald C. Cacciapaglia
Name: Donald C. Cacciapaglia
Title: Chief Executive Officer
Date: September 6, 2012
Pursuant to the requirements of the Securities Exchange Act of 1934 and the Investment Company Act of 1940, this report has been signed by the following persons on behalf of the registrant and in the capacities and on the dates indicated.
By: /s/Donald C. Cacciapaglia
Name: Donald C. Cacciapaglia
Title: Chief Executive Officer
Date: September 6, 2012
By: /s/John Sullivan
Name: John Sullivan
Title: Chief Financial Officer, Chief Accounting Officer and Treasurer
Date: September 6, 2012