Exhibit 99.1

Global Net Lease First Quarter 2023 Investor Presentation Pictured – McLaren Campus in Woking , U.K.
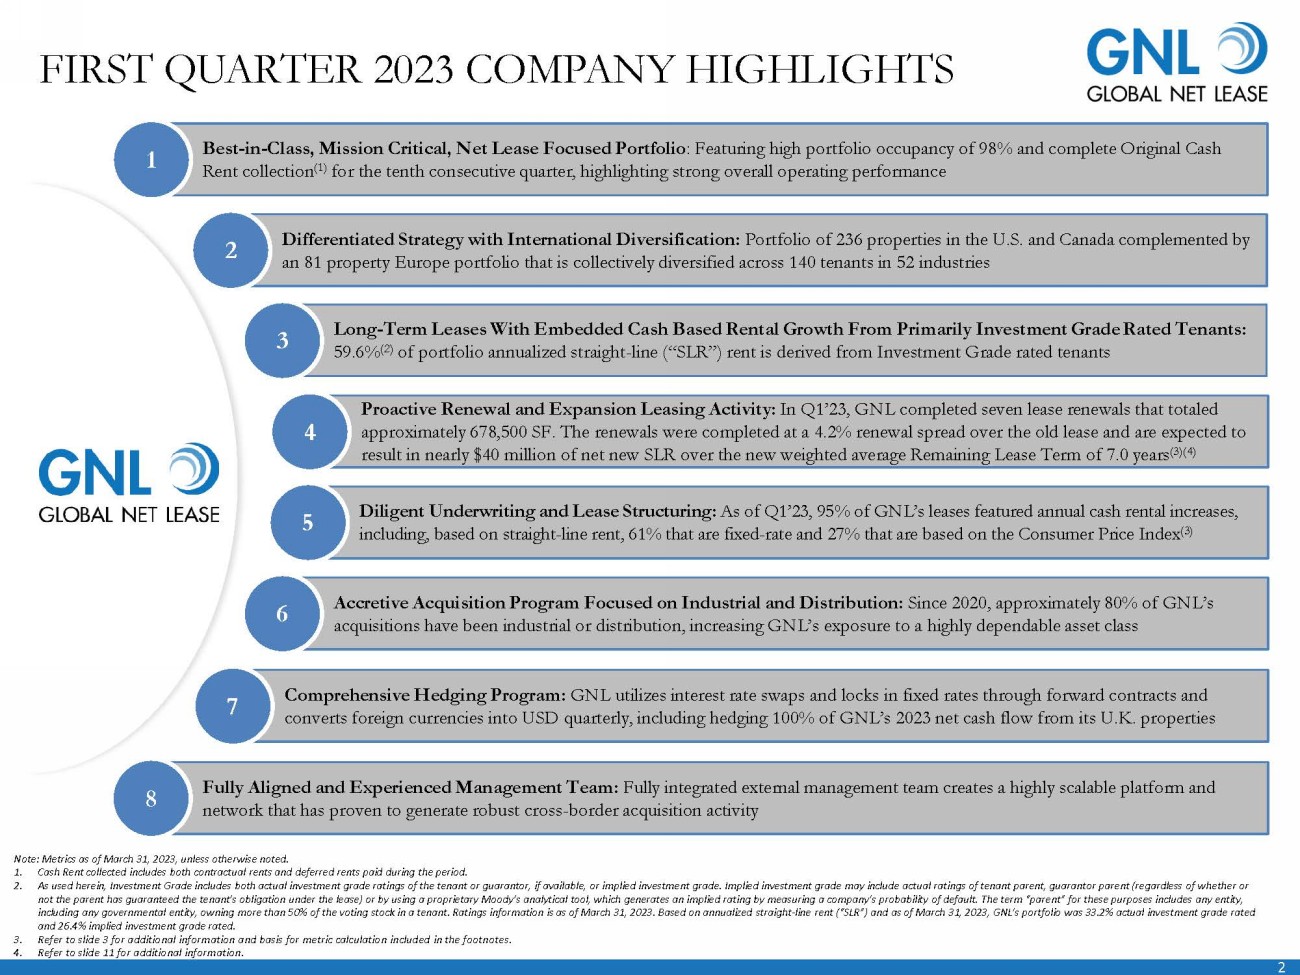
FIRST QUARTER 2023 COMPANY HIGHLIGHTS Best - in - Class, Mission Critical, Net Lease Focused Portfolio : Featuring high portfolio occupancy of 98% and complete Original Cash Rent collection (1) for the tenth consecutive quarter, highlighting strong overall operating performance 1 2 Note: Metrics as of March 31, 2023, unless otherwise noted. 1. Cash Rent collected includes both contractual rents and deferred rents paid during the period. 2. As used herein, Investment Grade includes both actual investment grade ratings of the tenant or guarantor, if available, or i mpl ied investment grade. Implied investment grade may include actual ratings of tenant parent, guarantor parent (regardless of w het her or not the parent has guaranteed the tenant’s obligation under the lease) or by using a proprietary Moody’s analytical tool, whi ch generates an implied rating by measuring a company’s probability of default. The term “parent” for these purposes includes an y e ntity, including any governmental entity, owning more than 50% of the voting stock in a tenant. Ratings information is as of March 3 1, 2023. Based on annualized straight - line rent (“SLR”) and as of March 31, 2023, GNL’s portfolio was 33.2% actual investment grade rated and 26.4% implied investment grade rated. 3. Refer to slide 3 for additional information and basis for metric calculation included in the footnotes. 4. Refer to slide 11 for additional information. Differentiated Strategy with International Diversification: Portfolio of 236 properties in the U.S. and Canada complemented by an 81 property Europe portfolio that is collectively diversified across 140 tenants in 52 industries 2 Long - Term Leases With Embedded Cash Based Rental Growth From Primarily Investment Grade Rated Tenants: 59.6 % (2) of portfolio annualized straight - line (“SLR”) rent is derived from Investment Grade rated tenants 3 Proactive Renewal and Expansion Leasing Activity: In Q1’23, GNL completed seven lease renewals that totaled approximately 678,500 SF. The renewals were completed at a 4.2% renewal spread over the old lease and are expected to result in nearly $40 million of net new SLR over the new weighted average Remaining Lease Term of 7.0 years (3)(4) 4 Diligent Underwriting and Lease Structuring: As of Q1’23, 95% of GNL’s leases featured annual cash rental increases, including, based on straight - line rent, 61% that are fixed - rate and 27% that are based on the Consumer Price Index (3) 5 Accretive Acquisition Program Focused on Industrial and Distribution: Since 2020, approximately 80% of GNL’s acquisitions have been industrial or distribution, increasing GNL’s exposure to a highly dependable asset class 6 Comprehensive Hedging Program: GNL utilizes interest rate swaps and locks in fixed rates through forward contracts and converts foreign currencies into USD quarterly, including hedging 100% of GNL’s 2023 net cash flow from its U.K. properties 7 Fully Aligned and Experienced Management Team: Fully integrated external management team creates a highly scalable platform and network that has proven to generate robust cross - border acquisition activity 8

3 FIRST QUARTER 2023 PORTFOLIO HIGHLIGHTS Portfolio Overview Q1’23 Properties 317 Square Feet (millions) 39.6 Tenants 140 Industries 52 Countries and Territories 11 Leased 98.0% Weighted Average Remaining Lease Term (1) 7.8 years % of SLR derived from Investment Grade Tenants (2)(3) 59.6% % of leases with contractual rent increases (4) 95.0% Metrics as of March 31, 2023. 1. Weighted average remaining lease term in years is based on square feet as of March 31 , 2023 for Q1’23. 2. Refer to Investment Grade Rating definition included in the footnotes on slide 2. Based on annualized straight - line rent and as of March 31, 2023 , GNL’s portfolio was 33.2 % actual investment grade rated and 26.4% implied investment grade rated. 3. For Q1’23, calculated as of March 31 , 2023, using annualized straight - line rent converted from local currency into USD as of March 31 , 2023 for the in - place lease on the property on a straight - line basis, which includes tenant concessions such as free rent, as applicable. 4. The percentage of leases with rent increases is based on straight line rent as of March 31, 2023. Contractual cash base rent inc reases average 1.2% per year and include fixed percent or actual increases, or country CPI - indexed increases, which may include certain floors or caps on rental increases. As of March 31, 2023, and based on straight - line rent, approximately 60.5% are fixed - rate increases, 27.1 % are based on the Consumer Price Index, 7.0% are based on other measures and 5.4% do not contain any escalation provisions.
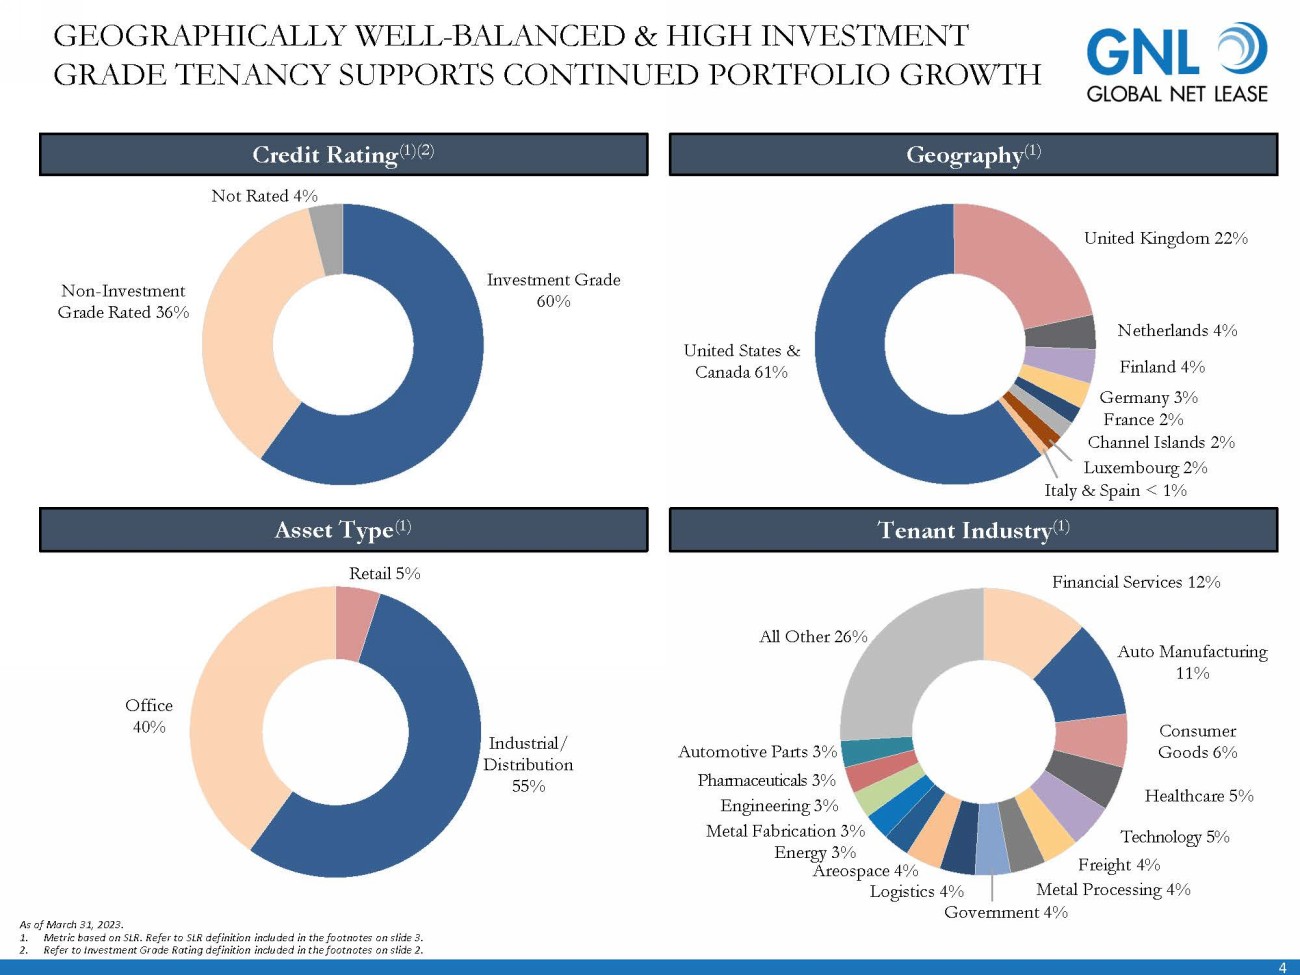
4 Financial Services 12% Auto Manufacturing 11% Consumer Goods 6% Healthcare 5% Technology 5% Freight 4% Metal Processing 4% Areospace 4% Energy 3% Metal Fabrication 3% Engineering 3% Pharmaceuticals 3% Automotive Parts 3% All Other 26% Investment Grade 60% Non - Investment Grade Rated 36% Not Rated 4% Logistics 4% GEOGRAPHICALLY WELL - BALANCED & HIGH INVESTMENT GRADE TENANCY SUPPORTS CONTINUED PORTFOLIO GROWTH As of March 31 , 2023. 1. Metric based on SLR . Refer to SLR definition included in the footnotes on slide 3. 2. Refer to Investment Grade Rating definition included in the footnotes on slide 2. Credit Rating (1)(2) Tenant Industry (1) Geography (1) Asset Type (1) United States & Canada 61% United Kingdom 22% Netherlands 4% Finland 4% Germany 3% France 2% Channel Islands 2% Luxembourg 2% Italy & Spain < 1% Retail 5% Industrial/ Distribution 55% Office 40% Government 4%

5 ATTRACTIVE PORTFOLIO IN LINE WITH INVESTMENT GRADE RATED PEERS GNL’s portfolio features leases to primarily Investment Grade rated tenants with contractual rental increases and is diversif ied across select North American and European countries, resulting in favorable comparisons to GNL’s investment grade rated peers Weighted Average Remaining Lease Term (3) Occupancy Rate Percentage Investment Grade Tenants (1) Industrial & Distribution Concentration (2) 10.9 10.8 7.8 6.2 6.2 BNL WPC GNL LXP OPI 62.7% 59.6% 56.5% 31.9% 15.4% OPI GNL LXP WPC BNL 99.5% 99.4% 98.8% 98.0% 90.6% LXP BNL WPC GNL OPI 92.0% 54.5% 51.0% 50.6% - LXP GNL BNL WPC OPI Source: Company filings. Note: Company metrics as of March 31, 2023, unless otherwise indicated. Peer metrics as of the last rep orting period of December 31, 2022, unless otherwise indicated. 1. Refer to Investment Grade Rating definition included in the footnotes on slide 2. For GNL, based on annualized straight - line ren t and comprised of 33.2% leased to tenants with an actual investment grade rating and 26.4% leased to tenants with an implied investment grade rating as of March 31, 2023. Peers report tenants with actual Investment Grade ratings but not implied ratin gs. 2. Based on straight - line rent for GNL as of March 31, 2023. LXP, OPI, and WPC weight on a cash basis. 3. GNL’s weighted average remaining lease term in years is based on square feet as of March 31, 2023. LXP, OPI, WPC and BNL may wei gh differently than GNL.
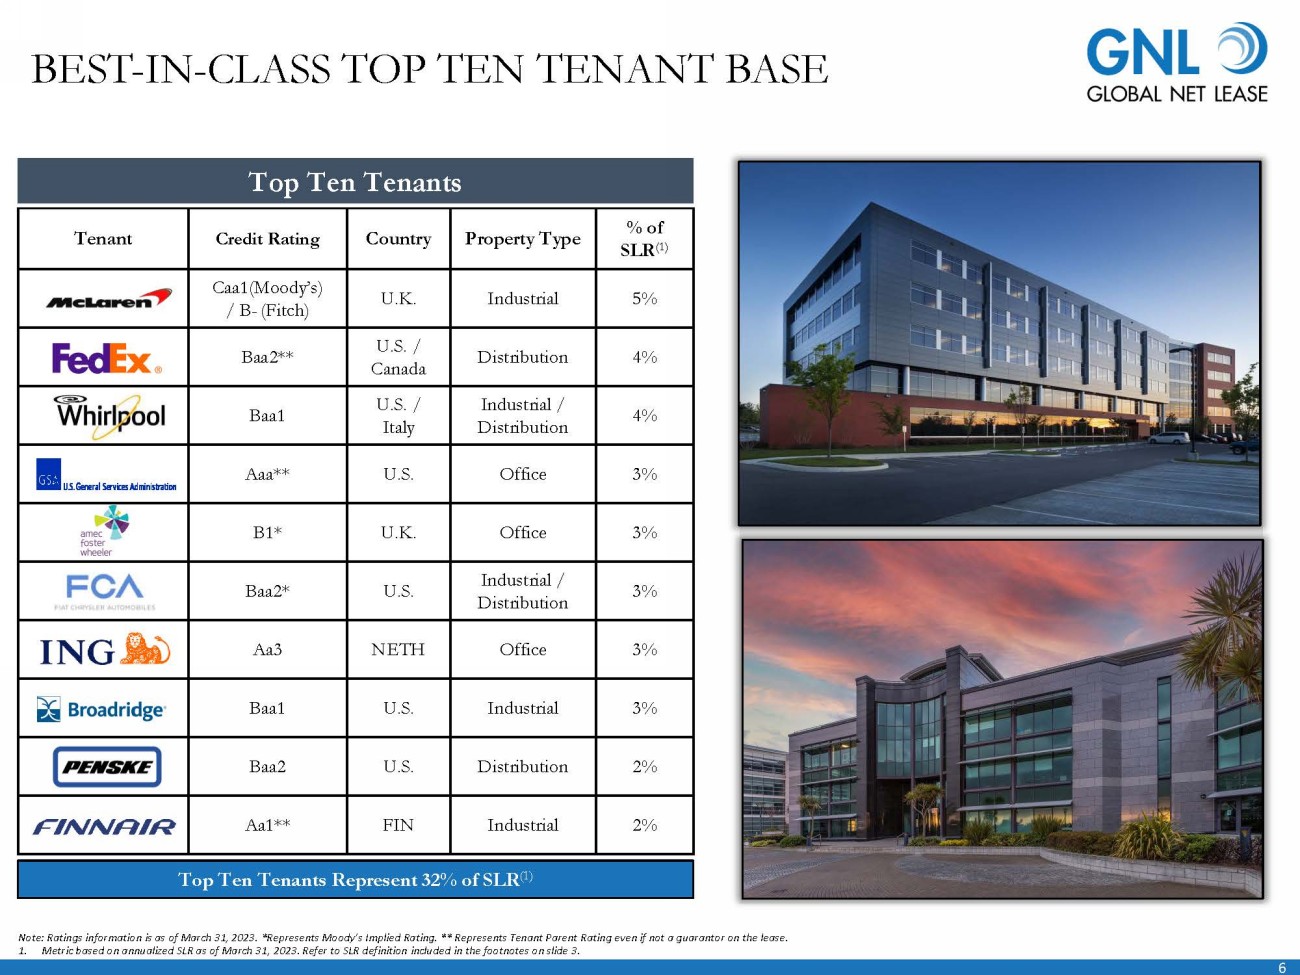
6 Tenant Credit Rating Country Property Type % of SLR (1) Caa1 (Moody’s) / B - (Fitch) U.K. Industrial 5% Baa2** U.S. / Canada Distribution 4% Baa1 U.S. / Italy Industrial / Distribution 4% Aaa** U.S. Office 3% B1* U.K. Office 3% Baa2* U.S. Industrial / Distribution 3% Aa3 NETH Office 3% Baa1 U.S. Industrial 3% Baa2 U.S. Distribution 2% Aa1** FIN Industrial 2% BEST - IN - CLASS TOP TEN TENANT BASE Top Ten Tenants Note: Ratings information is as of March 31, 2023. *Represents Moody’s Implied Rating. ** Represents Tenant Parent Rating even if not a guarantor on the lease. 1. Metric based on annualized SLR as of March 31 , 2023. Refer to SLR definition included in the footnotes on slide 3. Top Ten Tenants Represent 32 % of SLR (1)

7 Office Distribution Industrial Only Focused on Markets with Quality Sovereign Debt Ratings (S&P) U.S. Finland Luxembourg Germany The Netherlands Canada U.K. France Guernsey Spain Italy AA+ AA+ AAA AAA AAA AAA AA AA AA - A BBB Moody’s: A1 Moody’s: Aaa** Moody’s: Aa3 Moody’s: Aa3 Moody’s: Baa2 Moody’s: Baa2** Moody’s: Baa2 Moody’s: Aa1** Moody’s: Baa1 Moody’s: Baa2 * Moody’s: A2 Best - in - class portfolio leased to primarily Investment Grade (1) rated tenants across North America and Europe Note: Ratings information is as of March 31, 2023. *Represents Moody’s Implied Rating. ** Represents Tenant Parent Rating even if not a guarantor on the lease. 1. Refer to Investment Grade Rating definition included in the footnotes on slide 2. Based on annualized straight - line rent and as of March 31, 2023 , GNL’s portfolio is 33.2% leased to tenants with an actual investment grade rating and 26.4% leased to tenants with an implied investment grade rating as of March 31, 2023. Moody’s: Baa2* FOCUS ON WORLD - CLASS TENANTS IN QUALITY SOVEREIGN DEBT RATED COUNTRIES
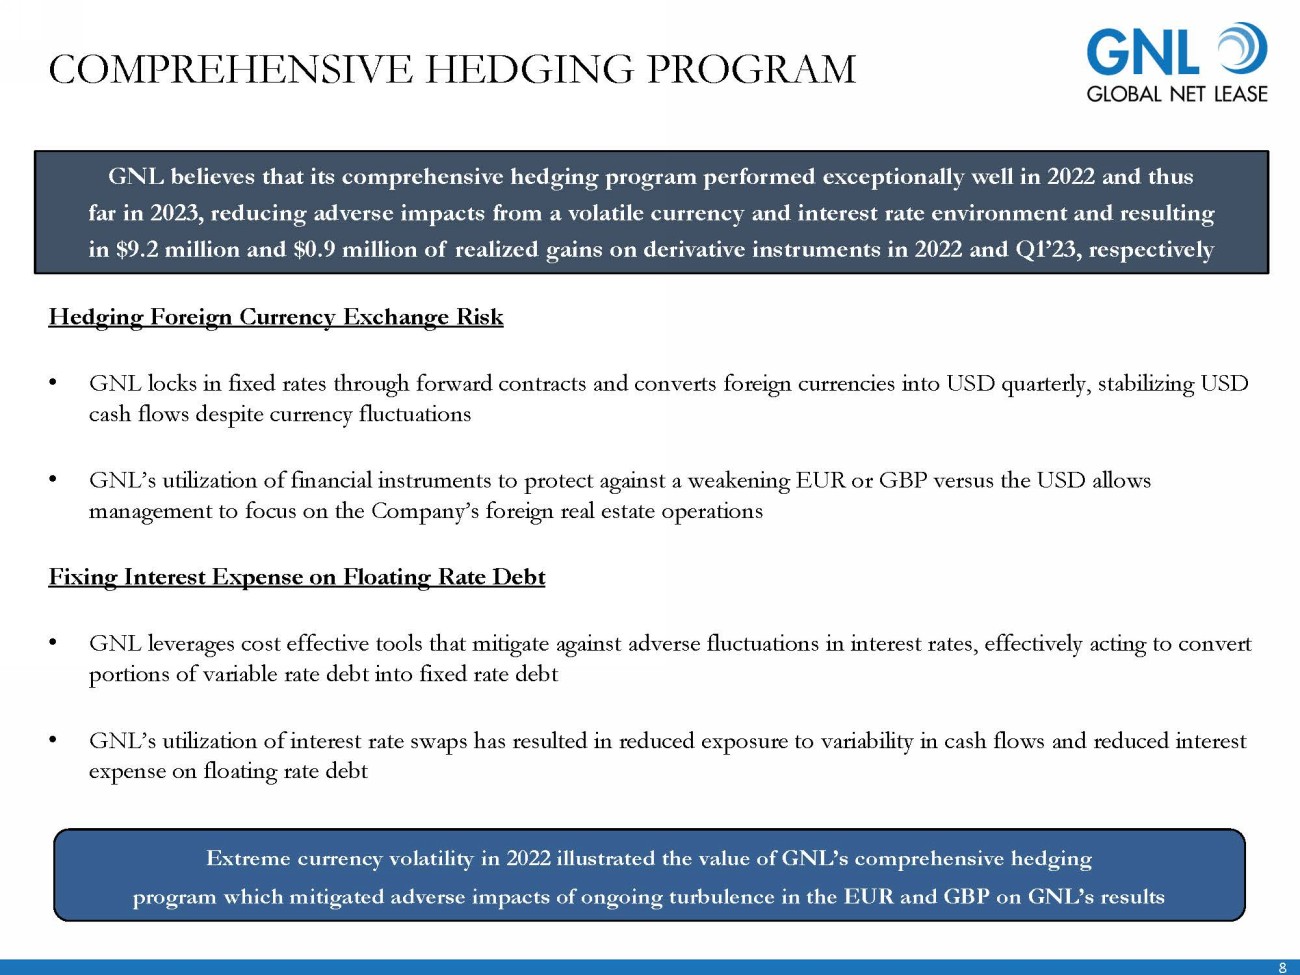
8 COMPREHENSIVE HEDGING PROGRAM Hedging Foreign Currency Exchange Risk • GNL locks in fixed rates through forward contracts and converts foreign currencies into USD quarterly, stabilizing USD cash flows despite currency fluctuations • GNL’s utilization of financial instruments to protect against a weakening EUR or GBP versus the USD allows management to focus on the Company’s foreign real estate operations Fixing Interest Expense on Floating Rate Debt • GNL leverages cost effective tools that mitigate against adverse fluctuations in interest rates, effectively acting to conver t portions of variable rate debt into fixed rate debt • GNL’s utilization of interest rate swaps has resulted in reduced exposure to variability in cash flows and reduced interest expense on floating rate debt GNL believes that its comprehensive hedging program performed exceptionally well in 2022 and thus far in 2023, reducing adverse impacts from a volatile currency and interest rate environment and resulting in $9.2 million and $0.9 million of realized gains on derivative instruments in 2022 and Q1’23, respectively Extreme currency volatility in 2022 illustrated the value of GNL’s comprehensive hedging program which mitigated adverse impacts of ongoing turbulence in the EUR and GBP on GNL’s results
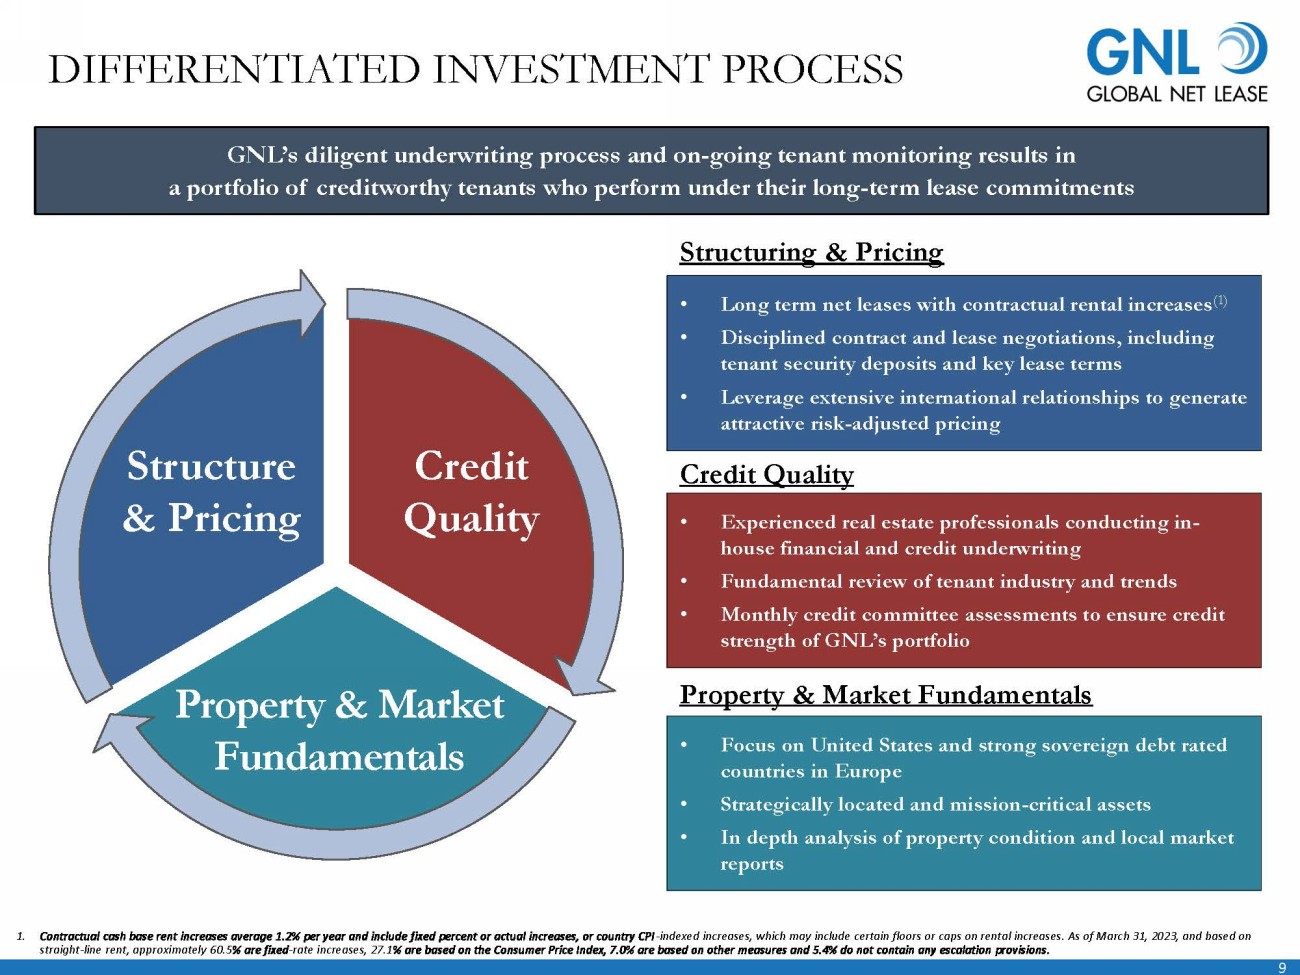
9 DIFFERENTIATED INVESTMENT PROCESS Structuring & Pricing • Long term net leases with contractual rental increases (1) • Disciplined contract and lease negotiations, including tenant security deposits and key lease terms • Leverage extensive international relationships to generate attractive risk - adjusted pricing GNL’s diligent underwriting process and on - going tenant monitoring results in a portfolio of creditworthy tenants who perform under their long - term lease commitments Credit Quality • Experienced real estate professionals conducting in - house financial and credit underwriting • Fundamental review of tenant industry and trends • Monthly credit committee assessments to ensure credit strength of GNL’s portfolio Property & Market Fundamentals • Focus on United States and strong sovereign debt rated countries in Europe • Strategically located and mission - critical assets • In depth analysis of property condition and local market reports Property & Market Fundamentals Structure & Pricing Credit Quality 1. Contractual cash base rent increases average 1.2% per year and include fixed percent or actual increases, or country CPI - indexed increases, which may include certain floors or caps on rental increases. As of March 31, 2023, and based on straight - line rent, approximately 60.5 % are fixed - rate increases, 27.1 % are based on the Consumer Price Index, 7.0% are based on other measures and 5.4% do not contain any escalation provisions.
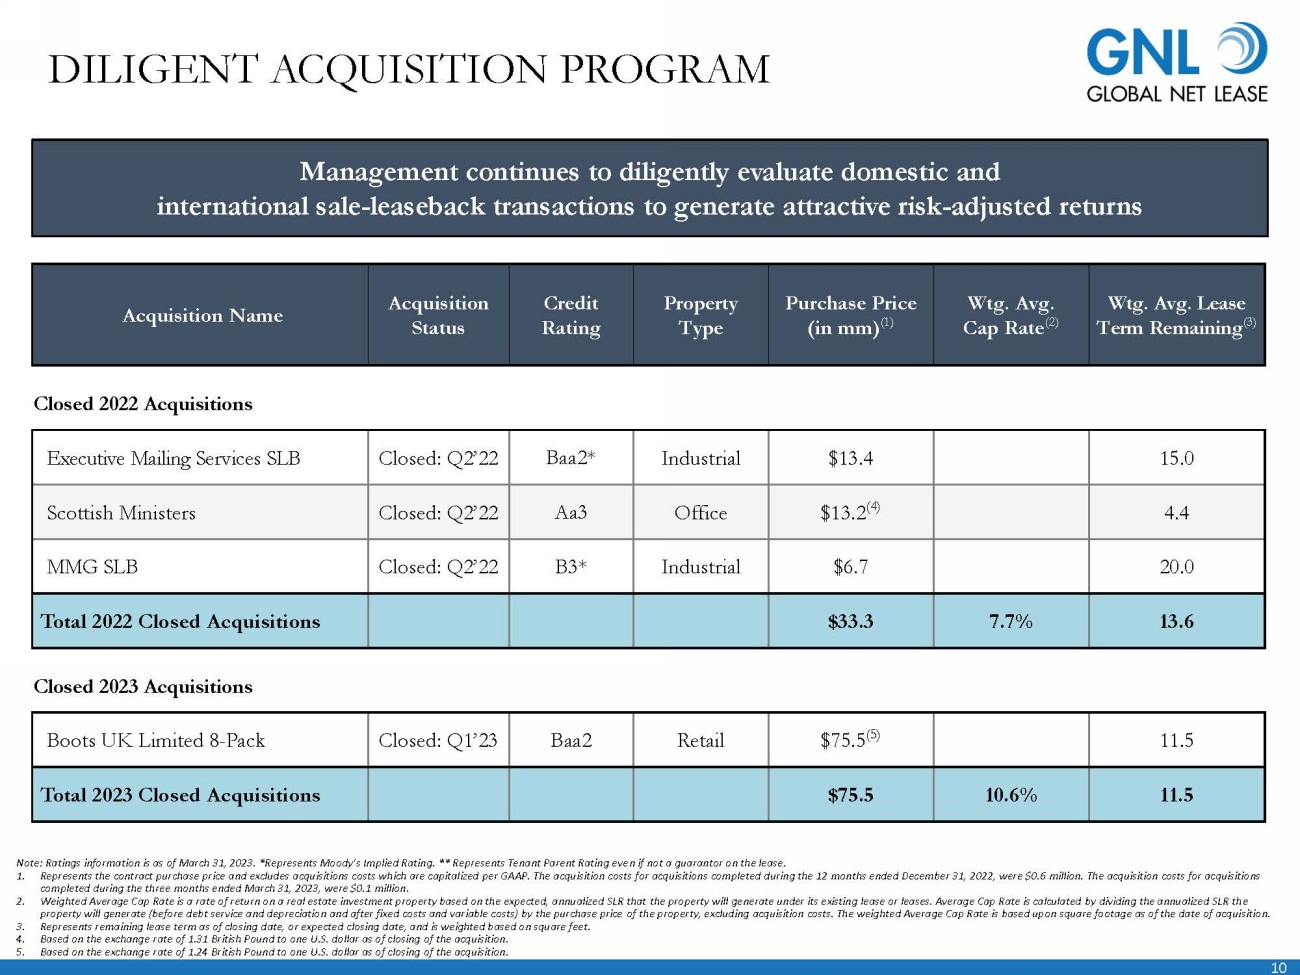
10 Note: Ratings information is as of March 31, 2023. *Represents Moody’s Implied Rating. ** Represents Tenant Parent Rating eve n i f not a guarantor on the lease. 1. Represents the contract purchase price and excludes acquisitions costs which are capitalized per GAAP. The acquisition costs for acquisitions completed during the 12 months ended December 31, 2022, were $0.6 million. The acquisition costs for acquisitions completed during the three months ended March 31, 2023, were $0.1 million. 2. Weighted Average Cap Rate is a rate of return on a real estate investment property based on the expected, annualized SLR that th e property will generate under its existing lease or leases. Average Cap Rate is calculated by dividing the annualized SLR th e property will generate (before debt service and depreciation and after fixed costs and variable costs) by the purchase price of the property, excluding acquisition costs. The weighted Average Cap Rate is based upon square footage as of the date of acqui sit ion. 3. Represents remaining lease term as of closing date, or expected closing date, and is weighted based on square feet. 4. Based on the exchange rate of 1.31 British Pound to one U.S. dollar as of closing of the acquisition. 5. Based on the exchange rate of 1.24 British Pound to one U.S. dollar as of closing of the acquisition. Management continues to diligently evaluate domestic and international sale - leaseback transactions to generate attractive risk - adjusted returns A cquisition Name A cquisition Status Credit Rating Property Type Purchase Price (in mm) (1) Wtg. Avg. Cap Rate (2) Wtg. Avg. Lease Term Remaining (3) Closed 2022 Acquisitions Executive Mailing Services SLB Closed: Q2’22 Baa2* Industrial $13.4 15.0 Scottish Ministers Closed: Q2’22 Aa3 Office $13.2 (4) 4.4 MMG SLB Closed: Q2’22 B3* Industrial $6.7 20.0 Total 2022 Closed Acquisitions $33.3 7.7% 13.6 Closed 2023 Acquisitions Boots UK Limited 8 - Pack Closed: Q1’23 Baa2 Retail $75.5 (5) 11.5 Total 2023 Closed Acquisitions $75.5 10.6% 11.5 DILIGENT ACQUISITION PROGRAM
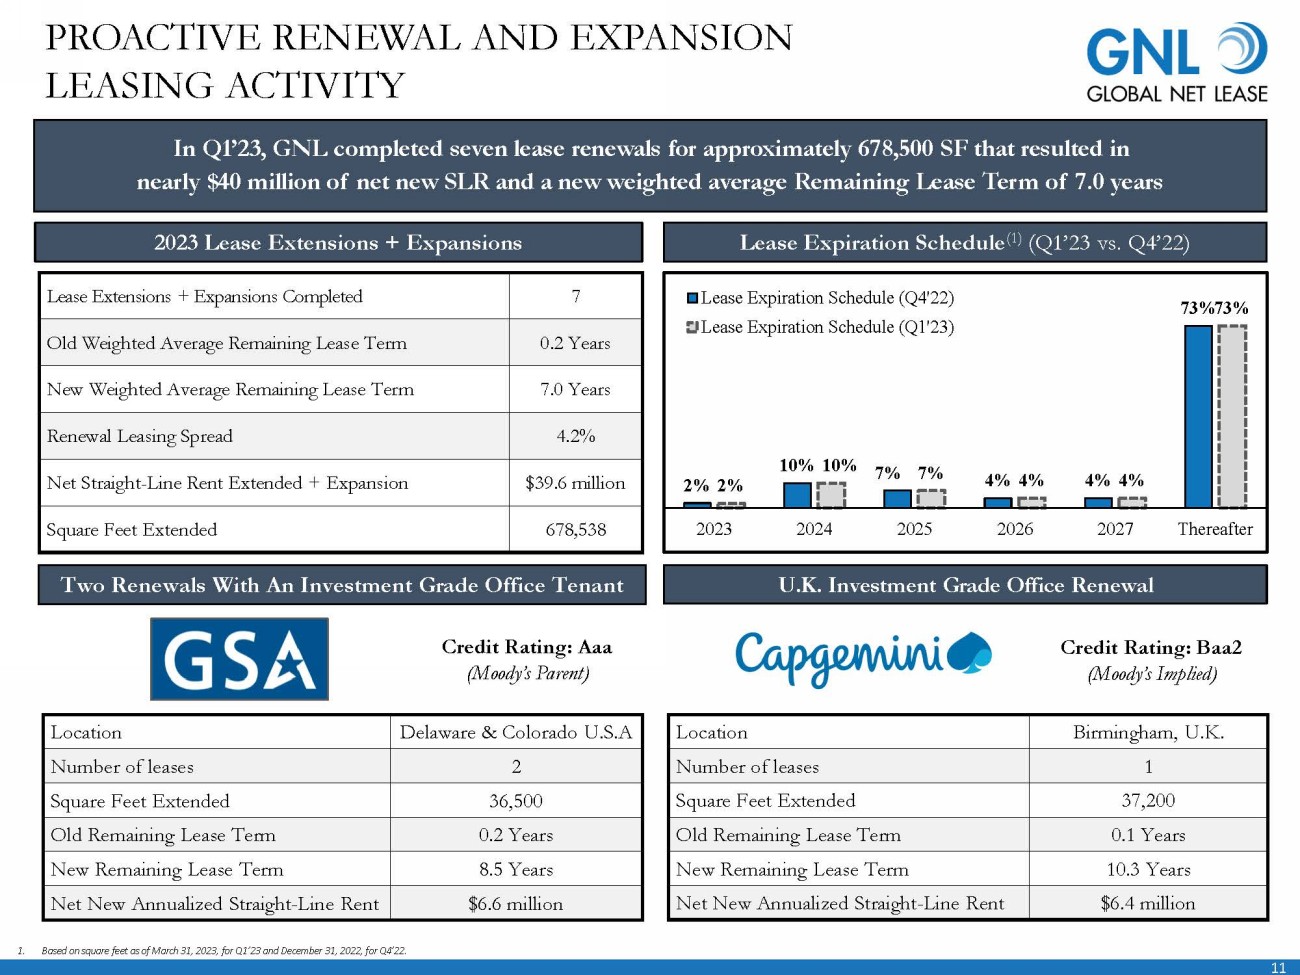
11 In Q1’23, GNL completed seven lease renewals for approximately 678,500 SF that resulted in nearly $40 million of net new SLR and a new weighted average Remaining Lease Term of 7.0 years 2023 Lease Extensions + Expansions Lease Expiration Schedule (1) (Q1’23 vs. Q4’22) Lease Extensions + Expansions Completed 7 Old Weighted Average Remaining Lease Term 0.2 Years New Weighted Average Remaining Lease Term 7.0 Years Renewal Leasing Spread 4.2% Net Straight - Line Rent Extended + Expansion $39.6 million Square Feet Extended 678,538 2% 10% 7% 4% 4% 73% 2% 10% 7% 4% 4% 73% 2023 2024 2025 2026 2027 Thereafter Lease Expiration Schedule (Q4'22) Lease Expiration Schedule (Q1'23) 1. Based on square feet as of March 31, 2023, for Q1’23 and December 31, 2022, for Q4’22. Two Renewals With An Investment Grade Office Tenant U.K. Investment Grade Office Renewal Location Delaware & Colorado U.S.A Number of leases 2 Square Feet Extended 36,500 Old Remaining Lease Term 0.2 Years New Remaining Lease Term 8.5 Years Net New Annualized Straight - Line Rent $6.6 million Credit Rating: Baa2 (Moody’s Implied) Location Birmingham, U.K. Number of leases 1 Square Feet Extended 37,200 Old Remaining Lease Term 0.1 Years New Remaining Lease Term 10.3 Years Net New Annualized Straight - Line Rent $6.4 million PROACTIVE RENEWAL AND EXPANSION LEASING ACTIVITY Credit Rating: Aaa (Moody’s Parent)
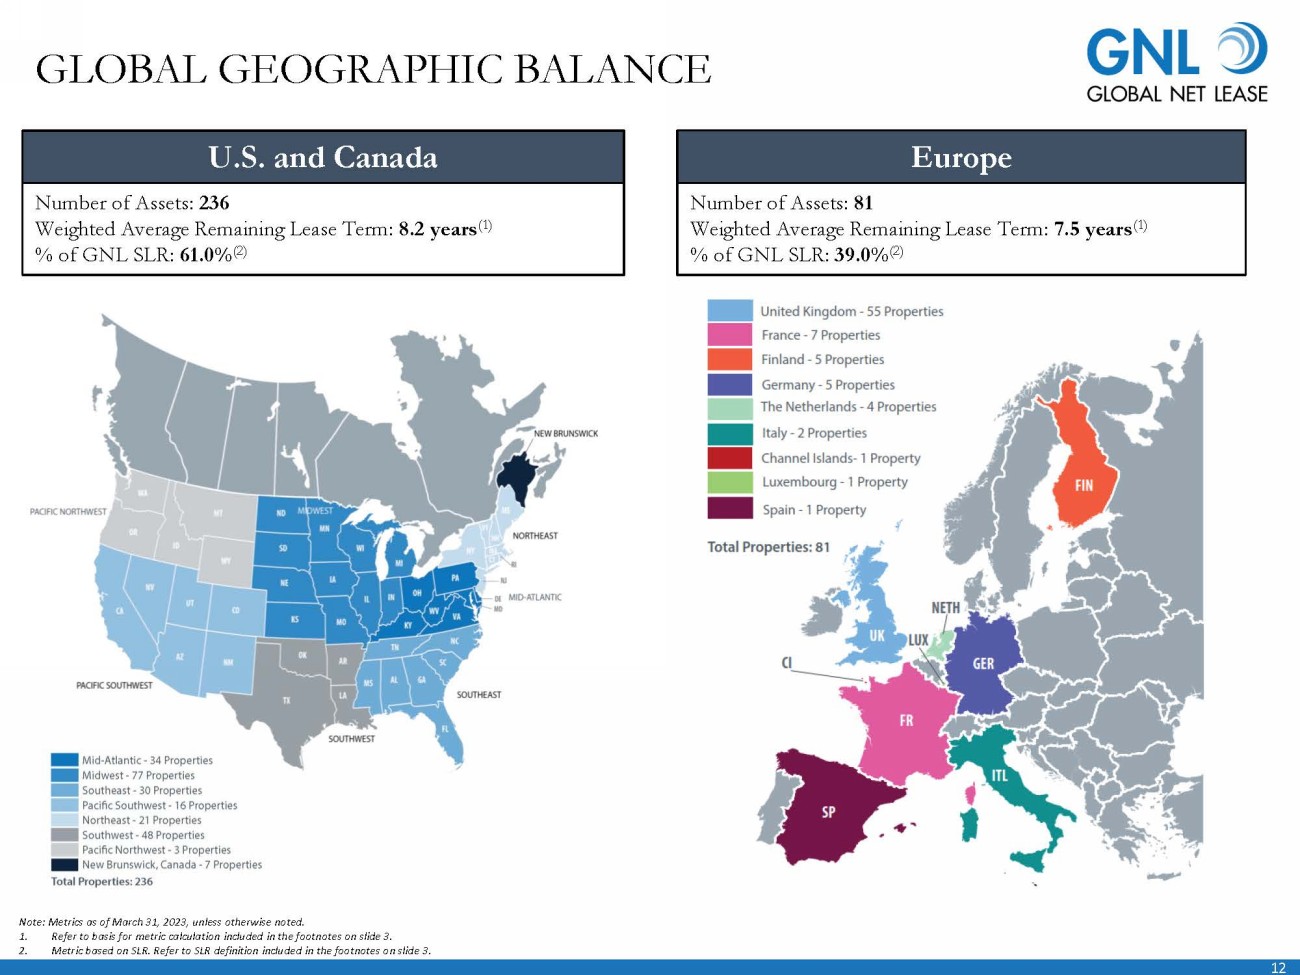
12 GLOBAL GEOGRAPHIC BALANCE Note: Metrics as of March 31, 2023, unless otherwise noted. 1. Refer to basis for metric calculation included in the footnotes on slide 3. 2. Metric based on SLR. Refer to SLR definition included in the footnotes on slide 3. U.S. and Canada Number of Assets: 236 Weighted Average Remaining Lease Term: 8.2 years (1) % of GNL SLR: 61.0% (2) Europe Number of Assets: 81 Weighted Average Remaining Lease Term: 7.5 years (1) % of GNL SLR: 39.0 % (2)
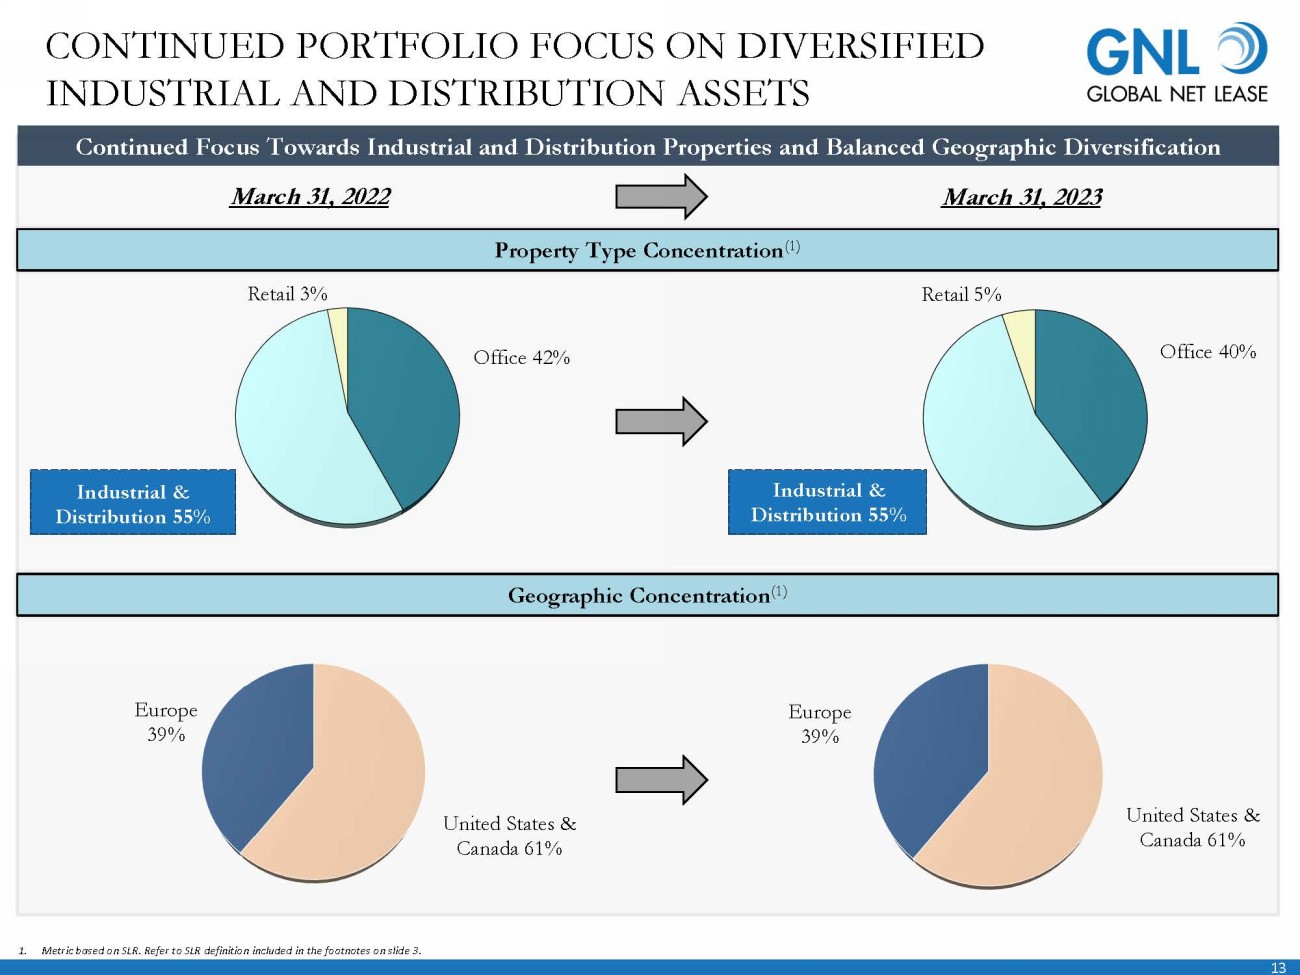
13 Office 40% Industrial & Distribution 55% Retail 5% Office 42% Industrial & Distribution 55% Retail 3% United States & Canada 61% Europe 39% Continued Focus Towards Industrial and Distribution Properties and Balanced Geographic Diversification United States & Canada 61% Europe 39% March 31, 2022 1. Metric based on SLR. Refer to SLR definition included in the footnotes on slide 3. CONTINUED PORTFOLIO FOCUS ON DIVERSIFIED INDUSTRIAL AND DISTRIBUTION ASSETS March 31, 2023 Property Type Concentration (1) Geographic Concentration (1)

14 Key Operating Highlights • In Q1’23, GNL closed on an eight - property portfolio leased to Boots UK Limited, a subsidiary of Walgreens Boots Alliance who has a Moody’s credit rating of Baa2, for $75.5 million and at a 10.6% Weighted Average Cap Rate with a weighted average Remaining Lease Term of 11.5 years • In Q1’23, GNL completed approximately 678,500 square feet of renewal leasing activity. The renewal leases were completed at S LR rates 4.2% greater than the prior leases and are expected to generate $39.6 million of net new straight - line rent over the new weighte d average Remaining Lease Term of 7.0 years • 95% of GNL’s leases featured annual cash base rental increases averaging 1.2%, which increase the cash rent due under these l eas es over time, including, based on straight - line rent, 61% that are fixed - rate increases and 27% that are based on the Consumer Price Ind ex and may include certain floors or caps on rental increases • GNL’s comprehensive hedging program utilizes interest rate swaps and locks in fixed rates through forward contracts and conve rts foreign currencies into USD quarterly, including hedging 100% of GNL’s 2023 net cash flow from its U.K. properties • Collected 100% of Original Cash Rent due across the portfolio for the tenth consecutive quarter • As of March 31, 2023, GNL had ample liquidity of $184 million, including $119 million of cash and cash equivalents and $65 mi lli on available for future borrowings under the Company's revolving credit facility (1) FIRST QUARTER 2023 PERFORMANCE HIGHLIGHTS 1. GNL is required to maintain unrestricted cash and cash equivalents (or amounts available for future borrowings under its cred it facility) in an amount equal to approximately $24 million. 2. Adjusted Funds from Operations (“AFFO”) is a non - GAAP measure. See Definitions on slides 21, 22, and 23 for a description of AFFO and slides 25 and 26 for a reconciliation of AFFO to net income, the most directly comparable GAAP Financial measure. 3. Constant Currency is a non - GAAP measure. See Definitions on slides 21, 22, and 23 for a description of Constant Currency and sli des 24 and 25 for a reconciliation of Revenue (on a constant currency) basis to Revenue, the most directly comparable GAAP Financial measure. 4. Average exchanges rates were 1.12 for the Euro to one U.S. dollar , 1.34 for the British Pound to one U.S. dollar , and 0.79 for the U.S. dollar to one Canadian Dollar. ($ in millions, except for per share data) Q1’23 Revenue From Tenants $94.3 Net Loss ($0.9) Adjusted Funds From Operations (2) $39.8 Adjusted Funds From Operations per Share (2) $0.38 Dividends Paid to Common Stockholders $41.7 Weighted Average Shares Outstanding, Fully Diluted 103.8 On a constant currency basis (3) , using average foreign currency exchange rates (4) for the first quarter of 2022, Revenue from Tenants would have been up by $3.2 million to $97.5 million
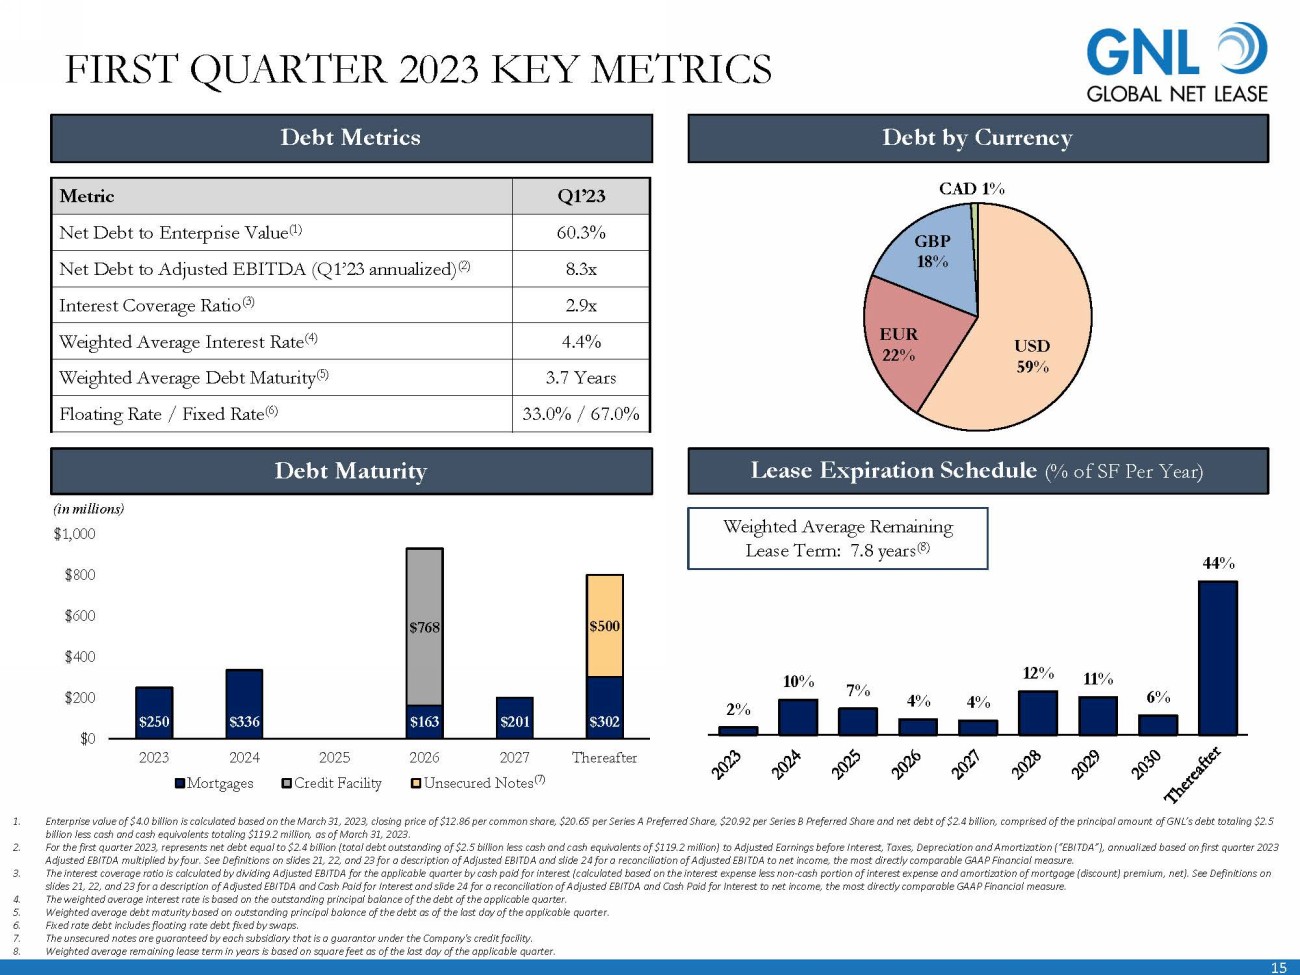
15 $250 $336 $0 $163 $201 $302 $768 $ 500 $0 $200 $400 $600 $800 $1,000 2023 2024 2025 2026 2027 Thereafter Mortgages Credit Facility Unsecured Notes 2% 10% 7% 4% 4% 12% 11% 6% 44% FIRST QUARTER 2023 KEY METRICS Metric Q1’23 Net Debt to Enterprise Value (1) 60.3% Net Debt to Adjusted EBITDA (Q1’23 annualized) (2) 8.3x Interest Coverage Ratio (3) 2.9x Weighted Average Interest Rate (4) 4.4% Weighted Average Debt Maturity (5) 3.7 Years Floating Rate / Fixed Rate (6) 33.0% / 6 7.0 % Debt Metrics Debt by Currency Debt Maturity 1. Enterprise value of $4.0 billion is calculated based on the March 31, 2023, closing price of $12.86 per common share, $20.65 per Series A Preferred Share, $20.92 per Series B Preferred Share and net debt of $2.4 billion, comprised of the principal amount o f GNL’s debt totaling $2.5 billion less cash and cash equivalents totaling $119.2 million, as of March 31, 2023. 2. For the first quarter 2023, represents net debt equal to $2.4 billion (total debt outstanding of $2.5 billion less cash and c ash equivalents of $119.2 million) to Adjusted Earnings before Interest, Taxes, Depreciation and Amortization (“EBITDA”), annuali ze d based on first quarter 2023 Adjusted EBITDA multiplied by four. See Definitions on slides 21, 22, and 23 for a description of Adjusted EBITDA and slide 2 4 f or a reconciliation of Adjusted EBITDA to net income, the most directly comparable GAAP Financial measure. 3. The interest coverage ratio is calculated by dividing Adjusted EBITDA for the applicable quarter by cash paid for interest (c alc ulated based on the interest expense less non - cash portion of interest expense and amortization of mortgage (discount) premium, net). See Definitions on slides 21, 22, and 23 for a description of Adjusted EBITDA and Cash Paid for Interest and slide 24 for a reconciliation of Ad jus ted EBITDA and Cash Paid for Interest to net income, the most directly comparable GAAP Financial measure. 4. The weighted average interest rate is based on the outstanding principal balance of the debt of the applicable quarter. 5. Weighted average debt maturity based on outstanding principal balance of the debt as of the last day of the applicable quarte r. 6. Fixed rate debt includes floating rate debt fixed by swaps. 7. The unsecured notes are guaranteed by each subsidiary that is a guarantor under the Company's credit facility. 8. Weighted average remaining lease term in years is based on square feet as of the last day of the applicable quarter. Weighted Average Remaining Lease Term: 7.8 years (8) Lease Expiration Schedule (% of SF Per Year ) (in millions) USD 59% EUR 22% GBP 18% CAD 1% (7)

16 Management structure fully aligned to compensate based on operational outperformance, in turn delivering increased value to shareholders James L. Nelson Chief Executive Officer and President No transactional fees allows for low general and administrative costs, which allows AR Global to provide greater resources at a lower cost (1) Lower Overhead Costs AR Global has sponsored or co - sponsored 15 REITs which have acquired more than $40 billion of real estate since 2007 Experience The audit, compensation, nominating and corporate governance and conflicts committees are comprised of independent directors Corporate Governance Company is supported by a dedicated financial accounting and reporting team, and maintains its own financial reporting processes, controls, and procedures Operational Efficiencies • Currently serves as Chief Financial Officer of American Strategic Investment Co. • Previously served as Chief Accounting Officer of Global Net Lease • Past experience includes accounting positions with Goldman Sachs and KPMG • Certified Public Accountant in New York State 1. As compared to fees associated with the prior management contract. Chris Masterson 16 FULLY ALIGNED MANAGEMENT STRUCTURE Fully integrated external management team creates a highly scalable platform with a proven, global sale - leaseback origination network Chief Financial Officer, Treasurer and Secretary • Joined GNL as an Independent Board Member in March 2017 • Currently serves Chairman of the Board of Directors for Xerox Holdings Corporation. He also currently serves as an independent director and chair of the audit committee for Chewy, Inc. • Previously served as CEO of Orbitex Management and Eaglescliff Corporation and in various roles on the Boards of Herbalife Nutrition Ltd., Caesars Entertainment Inc., Icahn Enterprises, and Take Two Interactive Software, Inc. Performance Alignment
17 The statements in this presentation that are not historical facts may be forward - looking statements . These forward - looking statements involve risks and uncertainties that could cause actual results or events to be materially different . In addition, words such as “may,” “will,” “seeks,” “anticipates,” “believes,” “estimates,” “expects,” “plans,” “intends,” “would,” or similar expressions indicate a forward - looking statement, although not all forward - looking statements contain these identifying words . Any statements referring to the future value of an investment in GNL, as well as the success that GNL may have in executing its business plan, are also forward - looking statements . There are a number of risks, uncertainties and other important factors that could cause GNL’s actual results to differ materially from those contemplated by such forward - looking statements, including those risks, uncertainties and other important factors set forth in the “Risk Factors” and “Management’s Discussion and Analysis of Financial Condition and Results of Operations” sections of GNL’s Annual Report on Form 10 - K for the year ended December 31 , 2022 filed with the SEC on February 23 , 2023 and all other filings with the SEC after that date, as such risks, uncertainties and other important factors may be updated from time to time in GNL’s subsequent reports . Further, forward - looking statements speak only as of the date they are made, and GNL undertakes no obligation to update or revise forward - looking statements to reflect changed assumptions, the occurrence of unanticipated events or changes to future operating results over time, except as required by law . This presentation contains certain statements that are the Company’s and Management’s hopes, intentions, beliefs, expectations, or projections of the future and might be considered to be forward - looking statements under federal securities laws . Prospective investors are cautioned that any such forward - looking statements are not guarantees of future performance, and involve risks and uncertainties . The Company’s actual future results may differ significantly from the matters discussed in these forward - looking statements, and we may not release revisions to these forward - looking statements to reflect changes after we have made the statements . FORWARD LOOKING STATEMENTS
18 RISK FACTORS The following are some of the risks and uncertainties, although not all risks and uncertainties, that could cause our actual results to differ materially from those presented in our forward - looking statements . • We may be unable to acquire properties on advantageous terms or our property acquisitions may not perform as we expect . • Our ability to continue implementing our growth strategy depends on our ability to access additional debt or equity financing on attractive terms, and there can be no assurance we will be able to so on favorable terms or at all . • We face the uncertainties and costs associated with a proxy contest and related litigation . • Recent challenges in the banking industry may adversely impact us or our tenants . • Certain of the agreements governing our indebtedness may limit our ability to pay dividends on our common stock, $ 0 . 01 par value per share (“Common Stock”), our 7 . 25 % Series A Cumulative Redeemable Preferred Stock, $ 0 . 01 par value per share (“Series A Preferred Stock”), our 6 . 875 % Series B Cumulative Redeemable Perpetual Preferred Stock, $ 0 . 01 par value per share (“Series B Preferred Stock”), or any other stock we may issue . • If we are not able to generate sufficient cash from operations, we may have to reduce the amount of dividends we pay or identify other financing sources . • Funding dividends from other sources such as borrowings, asset sales or equity issuances limits the amount we can use for property acquisitions, investments and other corporate purposes . • Market and economic challenges experienced by the U . S . and global economies may adversely impact our operating results and financial condition . • We are subject to risks associated with our international investments, including compliance with and changes in foreign laws and fluctuations in foreign currency exchange rates . • Inflation and continuing increases in the inflation rate will have an adverse effect on our investments and results of operations . • We are subject to risks associated with a pandemic, epidemic or outbreak of a contagious disease, such as the COVID - 19 pandemic, including negative impacts on our tenants and their respective businesses . • We depend on tenants for our rental revenue and, accordingly, our rental revenue depends upon the success and economic viability of our tenants . If a tenant or lease guarantor declares bankruptcy or becomes insolvent, we may be unable to collect balances due under relevant leases .
19 RISK FACTORS (CONTINUED) • Our tenants may not be diversified including by industry type or geographic location . • In owning properties we may experience, among other things, unforeseen costs associated with complying with laws and regulations and other costs, potential difficulties selling properties and potential damages or losses resulting from climate change . • We depend on the Advisor and Property Manager to provide us with executive officers, key personnel and all services required for us to conduct our operations . • All of our executive officers face conflicts of interest, such as conflicts created by the terms of our agreements with the Advisor and compensation payable thereunder, conflicts allocating investment opportunities to us, and conflicts in allocating their time and attention to our matters . Conflicts that arise may not be resolved in our favor and could result in actions that are adverse to us . • We have long - term agreements with our Advisor and its affiliates that may be terminated only in limited circumstances and may require us to pay a termination fee in some cases . • We have substantial indebtedness and may be unable to repay, refinance, restructure or extend our indebtedness as it becomes due . Increases in interest rates could increase the amount of our debt payments . We may continue to incur additional indebtedness in the future . • The stockholder rights plan adopted by our board of directors, our classified board and other aspects of our corporate structure and Maryland law may discourage a third party from acquiring us in a manner that might result in a premium price to our stockholders . • Restrictions on share ownership contained in our charter may inhibit market activity in shares of our stock and restrict our business combination opportunities . • We may fail to continue to qualify as a REIT .
20 DISCLAIMERS • This presentation includes estimated projections of future operating results . These projections were not prepared in accordance with published guidelines of the SEC or the guidelines established by the American Institute of Certified Public Accountants for preparation and presentation of financial projections . This information is not fact and should not be relied upon as being necessarily indicative of future results ; the projections were prepared in good faith by management and are based on numerous assumptions that may prove to be wrong . Important factors that may affect actual results and cause the projections to not be achieved include, but are not limited to, risks and uncertainties relating to the company and other factors described in the “Risk Factors” and “Management’s Discussion and Analysis of Financial Condition and Results of Operations” sections of GNL’s Annual Report on Form 10 - K for the year ended December 31 , 2022 filed with the SEC on February 23 , 2023 and subsequent Quarterly Reports on Form 10 - Q and Current Reports on Form 8 - K filed with the SEC . The projections also reflect assumptions as to certain business decisions that are subject to change . As a result, actual results may differ materially from those contained in the estimates . Accordingly, there can be no assurance that the estimates will be realized . • This presentation contains estimates and information concerning the Company’s industry and the Company’s peer companies that are based on industry publications, reports and peer company public filings . The Company has not independently verified the accuracy of the data contained in these industry publications, reports and peer company public filings . These estimates and information involve a number of assumptions and limitations, and you are cautioned not to rely on or give undue weight to this information . • All of the concessions granted to the Company's tenants as a result of the COVID - 19 pandemic were rent deferrals with the original lease term unchanged and collection of deferred rent deemed probable . The Company's revenue recognition policy requires that it must be probable that the Company will collect virtually all of the lease payments due and does not provide for partial reserves, or the ability to assume partial recovery . In light of the COVID - 19 pandemic, the FASB and SEC agreed that for leases where the total lease cash flows will remain substantially the same or less than those after the COVID - 19 related effects, companies may choose to forgo the evaluation of the enforceable rights and obligations of the original lease contract as a practical expedient and account for rent concessions as if they were part of the enforceable rights and obligations of the parties under the existing lease contract . As a result, rental revenue used to calculate Net Income and FFO has not been significantly impacted by deferrals the Company has entered into . In addition, since these deferral amounts were collectable, the Company has excluded from the increase in straight - line rent for AFFO purposes the amounts recognized under GAAP relating to rent deferrals . • A securities rating is not a recommendation to buy, sell or hold securities and may be subject to revision or withdrawal at any time . Each rating agency has its own methodology for assigning ratings and, accordingly, each rating should be evaluated independently of any other rating .
21 DEFINITIONS • Due to certain unique operating characteristics of real estate companies, as discussed below, the National Association of Real Estate Investment Trusts ("NAREIT"), an industry trade group, has promulgated a measure known as funds from operations ("FFO"), which we believe to be an appropriate supplemental measure to reflect the operating performance of a REIT . FFO is not equivalent to net income or loss as determined under accounting principles generally accepted in the United States ("GAAP") . • We calculate FFO, a non - GAAP measure, consistent with the standards established over time by the Board of Governors of NAREIT, as restated in a White Paper approved by the Board of Governors of NAREIT effective in December 2018 (the "White Paper") . The White Paper defines FFO as net income or loss computed in accordance with GAAP, excluding depreciation and amortization related to real estate, gain and loss from the sale of certain real estate assets, gain and loss from change in control and impairment write - downs of certain real estate assets and investments in entities when the impairment is directly attributable to decreases in the value of depreciable real estate held by the entity . Our FFO calculation complies with NAREIT's definition . • The historical accounting convention used for real estate assets requires straight - line depreciation of buildings and improvements, and straight - line amortization of intangibles, which implies that the value of a real estate asset diminishes predictably over time . We believe that, because real estate values historically rise and fall with market conditions, including inflation, interest rates, unemployment and consumer spending, presentations of operating results for a REIT using historical accounting for depreciation and certain other items may be less informative . Historical accounting for real estate involves the use of GAAP . Any other method of accounting for real estate such as the fair value method cannot be construed to be any more accurate or relevant than the comparable methodologies of real estate valuation found in GAAP . Nevertheless, we believe that the use of FFO, which excludes the impact of real estate related depreciation and amortization, among other things, provides a more complete understanding of our performance to investors and to management, and, when compared year over year, reflects the impact on our operations from trends in occupancy rates, rental rates, operating costs, general and administrative expenses, and interest costs, which may not be immediately apparent from net income . However, FFO, core funds from operations ("Core FFO") and adjusted funds from operations (“AFFO”), as described below, should not be construed to be more relevant or accurate than the current GAAP methodology in calculating net income or in its applicability in evaluating our operating performance . The method utilized to evaluate the value and performance of real estate under GAAP should be construed as a more relevant measure of operational performance and considered more prominently than the non - GAAP FFO, Core FFO and AFFO measures and the adjustments to GAAP in calculating FFO, Core FFO and AFFO . Other REITs may not define FFO in accordance with the current NAREIT definition (as we do) or may interpret the current NAREIT definition differently than we do or calculate Core FFO or AFFO differently than we do . Consequently, our presentation of FFO, Core FFO and AFFO may not be comparable to other similarly titled measures presented by other REITs . Adjustments for unconsolidated partnerships and joint ventures are calculated to reflect the proportionate share of adjustments for non - controlling interest to arrive at FFO, Core FFO and AFFO, as applicable . • We consider FFO, Core FFO and AFFO useful indicators of our performance . Because FFO, Core FFO and AFFO calculations exclude such factors as depreciation and amortization of real estate assets and gain or loss from sales of operating real estate assets (which can vary among owners of identical assets in similar conditions based on historical cost accounting and useful - life estimates), FFO, Core FFO and AFFO presentations facilitate comparisons of operating performance between periods and between other REITs .
22 DEFINITIONS (CONTINUED) • In calculating Core FFO, we start with FFO, then we exclude certain non - core items such as acquisition, transaction and other costs, as well as certain other costs that are considered to be non - core, such as debt extinguishment costs, fire loss and other costs related to damages at our properties . The purchase of properties, and the corresponding expenses associated with that process, is a key operational feature of our core business plan to generate operational income and cash flows in order to make dividend payments to stockholders . In evaluating investments in real estate, we differentiate the costs to acquire the investment from the subsequent operations of the investment . We also add back non - cash write - offs of deferred financing costs and prepayment penalties incurred with the early extinguishment of debt which are included in net income but are considered financing cash flows when paid in the statement of cash flows . We consider these write - offs and prepayment penalties to be capital transactions and not indicative of operations . By excluding expensed acquisition, transaction and other costs as well as non - core costs, we believe Core FFO provides useful supplemental information that is comparable for each type of real estate investment and is consistent with management’s analysis of the investing and operating performance of our properties . • In calculating AFFO, we start with Core FFO, then we exclude certain income or expense items from AFFO that we consider more reflective of investing activities, other non - cash income and expense items and the income and expense effects of other activities that are not a fundamental attribute of our business plan . These items include early extinguishment of debt and other items excluded in Core FFO as well as unrealized gain and loss, which may not ultimately be realized, such as gain or loss on derivative instruments, gain or loss on foreign currency transactions, and gain or loss on investments . In addition, by excluding non - cash income and expense items such as amortization of above - market and below - market leases intangibles, amortization of deferred financing costs, straight - line rent and equity - based compensation from AFFO, we believe we provide useful information regarding income and expense items which have a direct impact on our ongoing operating performance . We also exclude revenue attributable to the reimbursement by third parties of financing costs that we originally incurred because these revenues are not, in our view, related to operating performance . We also include the realized gain or loss on foreign currency exchange contracts for AFFO as such items are part of our ongoing operations and affect our current operating performance . • In calculating AFFO, we exclude certain expenses which under GAAP are characterized as operating expenses in determining operating net income . All paid and accrued acquisition, transaction and other costs (including prepayment penalties for debt extinguishments) and certain other expenses, including general and administrative expenses incurred for our 2023 proxy contest and related litigation, negatively impact our operating performance during the period in which expenses are incurred or properties are acquired and will also have negative effects on returns to investors, but are not reflective of on - going performance . Further, under GAAP, certain contemplated non - cash fair value and other non - cash adjustments are considered operating non - cash adjustments to net income . In addition, as discussed above, we view gain and loss from fair value adjustments as items which are unrealized and may not ultimately be realized and not reflective of ongoing operations and are therefore typically adjusted for when assessing operating performance . Excluding income and expense items detailed above from our calculation of AFFO provides information consistent with management’s analysis of our operating performance . Additionally, fair value adjustments, which are based on the impact of current market fluctuations and underlying assessments of general market conditions, but can also result from operational factors such as rental and occupancy rates, may not be directly related or attributable to our current operating performance . By excluding such changes that may reflect anticipated and unrealized gain or loss, we believe AFFO provides useful supplemental information . By providing AFFO, we believe we are presenting useful information that can be used to, among other things, assess our performance without the impact of transactions or other items that are not related to our portfolio of properties . AFFO presented by us may not be comparable to AFFO reported by other REITs that define AFFO differently . Furthermore, we believe that in order to facilitate a clear understanding of our operating results, AFFO should be examined in conjunction with net income (loss) calculated in accordance with GAAP and presented in our consolidated financial statements . AFFO should not be considered as an alternative to net income (loss) as an indication of our performance or to cash flows as a measure of our liquidity or ability to make distributions .
23 DEFINITIONS (CONTINUED) • As a result, we believe that the use of FFO, Core FFO and AFFO, together with the required GAAP presentations, provide a more complete understanding of our operating performance including relative to our peers and a more informed and appropriate basis on which to make decisions involving operating, financing, and investing activities . However, FFO, Core FFO and AFFO are not indicative of cash available to fund ongoing cash needs, including the ability to make cash distributions . Investors are cautioned that FFO, Core FFO and AFFO should only be used to assess the sustainability of our operating performance excluding these activities, as they exclude certain costs that have a negative effect on our operating performance during the periods in which these costs are incurred . • Constant currency results exclude any benefit or loss caused by foreign exchange fluctuations between foreign currencies and the United States dollar which would not have occurred if there had been a constant exchange rate . Revenue from tenants on a Constant Currency basis is calculated by applying the average monthly currency rates from the prior comparable period to Revenues from tenants from the applicable period . We believe that this measure provides investors with information about revenue results and trends that eliminates currency volatility while increasing the comparability of our underlying results and trends . • We believe that earnings before interest, taxes, depreciation and amortization (“EBITDA”) adjusted for acquisition, transaction and other costs, other non - cash items and including our pro - rata share from unconsolidated joint ventures (“Adjusted EBITDA”) is an appropriate measure of our ability to incur and service debt . Adjusted EBITDA should not be considered as an alternative to cash flows from operating activities, as a measure of our liquidity or as an alternative to net income as an indicator of our operating activities . Other REITs may calculate Adjusted EBITDA differently and our calculation should not be compared to that of other REITs . • NOI is a non - GAAP financial measure equal to net income (loss), the most directly comparable GAAP financial measure, less discontinued operations, interest, other income and income from preferred equity investments and investment securities, plus corporate general and administrative expense, acquisition, transaction and other costs, depreciation and amortization, other non - cash expenses and interest expense . We use NOI internally as a performance measure and believe NOI provides useful information to investors regarding our financial condition and results of operations because it reflects only those income and expense items that are incurred at the property level . Therefore, we believe NOI is a useful measure for evaluating the operating performance of our real estate assets and to make decisions about resource allocations . Further, we believe NOI is useful to investors as a performance measure because, when compared across periods, NOI reflects the impact on operations from trends in occupancy rates, rental rates, operating costs and acquisition activity on an unlevered basis, providing perspective not immediately apparent from net income . NOI excludes certain components from net income in order to provide results that are more closely related to a property's results of operations . For example, interest expense is not necessarily linked to the operating performance of a real estate asset and is often incurred at the corporate level as opposed to the property level . In addition, depreciation and amortization, because of historical cost accounting and useful life estimates, may distort operating performance at the property level . NOI presented by us may not be comparable to NOI reported by other REITs that define NOI differently . We believe that in order to facilitate a clear understanding of our operating results, NOI should be examined in conjunction with net income (loss) as presented in our consolidated financial statements . NOI should not be considered as an alternative to net income (loss) as an indication of our performance or to cash flows as a measure of our liquidity . • Cash NOI, is a non - GAAP financial measure that is intended to reflect the performance of our properties . We define Cash NOI as net operating income (which is separately defined herein) excluding amortization of above/below market lease intangibles and straight - line adjustments that are included in GAAP lease revenues . We believe that Cash NOI is a helpful measure that both investors and management can use to evaluate the current financial performance of our properties and it allows for comparison of our operating performance between periods and to other REITs . Cash NOI should not be considered as an alternative to net income, as an indication of our financial performance, or to cash flows as a measure of liquidity or our ability to fund all needs . The method by which we calculate and present Cash NOI may not be directly comparable to the way other REITs present Cash NOI . • Cash Paid for Interest is calculated based on the interest expense less non - cash portion of interest expense and amortization of mortgage (discount) premium, net . Management believes that Cash Paid for Interest provides useful information to investors to assess our overall solvency and financial flexibility . Cash Paid for Interest should not be considered as an alternative to interest expense as determined in accordance with GAAP or any other GAAP financial measures and should only be considered together with and as a supplement to our financial information prepared in accordance with GAAP .

24 NON – GAAP RECONCILIATIONS (Amounts in thousands) Three Months Ended March 31, 2023 March 31, 2022 EBITDA: Net (loss) income $ (890) $ 10,541 Depreciation and amortization 37,029 39,889 Interest expense 26,965 24,123 Income tax expense 2,707 3,095 EBITDA (1) 65,811 77,648 Impairment charges – 230 Equity based compensation 2,925 2,727 Acquisition, transaction and other costs 99 8 Gain on dispositions of real estate investments 1,656 (4,615) Other income (66) (295) Expense attributable to 2023 proxy contest and related litigation (2) 1,716 – Adjusted EBITDA (1) 72,141 75,703 Operating fees to related parties 10,101 10,076 General and administrative 5,660 3,894 Expenses attributable to 2023 proxy contest and related litigation (2) (1,716) – NOI (1) 86,186 89,673 Amortization of above - and below - market leases and ground lease assets and liabilities, net 955 330 Straight - line rent (1,888) (2,853) Cash NOI (1) $ 85,253 $ 87,150 Cash Paid for Interest: Interest Expense $ 26,965 $ 24,123 Non - cash portion of interest expense (2,085) (2,596) Amortization of mortgage discounts premiums, net (227) (251) Total Cash Paid for Interest $ 24,653 $ 21,276 1. For the three months ended March 31, 2022 includes income from a lease termination fee of $0.3 million, which is recorded in rev enue from tenants in the consolidated statement of operations. 2. Amount relates to general and administrative expenses incurred for the 2023 proxy contest and related Blackwells litigation. The Company does not consider these expenses to be part of its normal operating performance. Due to the increase in these expenses as a portion of its general and administrative expenses in the first quarter of 2023, the Company began including th is adjustment to arrive at Adjusted EBITDA in order to better reflect its operating performance. The first quarter of 2022 did not have any of these expenses.

25 NON – GAAP RECONCILIATIONS Revenue from tenants – Quarter Ended March 31, 2023 $ 94,332 _ Foreign currency translation impact (using average foreign currency exchange rates for the first quarter of 2022) 3,176 _ Revenue from Tenants (year over year constant currency adjusted): $ 97,508 _ (Amounts in thousands) Three Months Ended March 31, 2023 March 31, 2022 Funds from operations (FFO): Net (loss) income attributable to common stockholders (in accordance with GAAP) $ (5,989) $ 5,483 Impairment charges – 230 Depreciation and amortization 37,029 39,889 FFO (as defined by NAREIT) attributable to stockholders (1) 31,040 45,602 Acquisition, transaction and other costs 99 8 Core FFO attributable to stockholders (1) 31,139 45,610 Non - cash equity based compensation 2,925 2,727 Non - cash portion of interest expense 2,085 2,596 Amortization related to above - and below - market lease intangibles and right - of - use assets, net 955 330 Straight - line rent (1,888) (2,853) Straight - line rent (rent deferral agreement) (2) – (120) Eliminate unrealized gains on foreign currency transactions (3) 2,647 (4,210) Amortization of mortgage discounts 227 251 Expenses attributable to 2023 proxy contest and related litigation (4) 1,716 – Adjusted funds from operations (AFFO) attributable to stockholders (1) $ 39,806 $ 44,331 Basic weighted - average shares outstanding 103,783 103,596 Diluted weighted - average shares outstanding 103,783 103,596 Net (loss) income per share attributable to common stockholders $ (0.06) $ 0.05 FFO per share $ 0.30 $ 0.44 Core FFO per share $ 0.30 $ 0.44 AFFO per share $ 0.38 $ 0.43 Dividends declared $ 41,677 $ 41,566 1. FFO, Core FFO and AFFO for the three months ended March 31, 2022 include income from a lease termination fee of $0.3 million, wh ich is recorded in revenue from tenants in the consolidated statement of operations. The termination fee of approximately $9.0 million which was paid by the tenant at the end of the lease term on January 4, 2022 was earned and record ed as income evenly over the period from September 3, 2021 through January 4, 2022. 2. Represents amounts related to deferred rent pursuant to lease negotiations which qualify for FASB relief for which rent was d efe rred but not reduced. These amounts are included in the straight - line rent receivable on our balance sheet but are considered to be earned revenue attributed to the current period for rent that was deferred, for purposes of AFFO, as they ar e e xpected to be collected. Accordingly, when the deferred amounts are collected, the amounts reduce AFFO. As of March 31, 2023, the Company has collected all previously deferred rents. 3. For AFFO purposes, we add back unrealized (gain) loss. For the three months ended March 31, 2023, the loss on derivative inst rum ents was $1.7 million which consisted of unrealized losses of $2.6 million and realized gains of $0.9 million. For the three months ended March 31, 2022, the gain on derivative instruments was $4.6 million which consisted of unrealized gains of $4 .2 million and realized gains of $0.4 million. 4. Amount relates to general and administrative expenses incurred for the 2023 proxy contest and related Blackwells litigation. The Company does not consider these expenses to be part of its normal operating performance and has, accordingly, increased its AFFO for this amount.