Exhibit 99.1
Global Net Lease September 2023 Pictured – McLaren Campus in Woking, U.K. |
1 FORWARD LOOKING STATEMENTS The statements in this presentation that are not historical facts may be forward-looking statements. These forward-looking statements involve risks and uncertainties that could cause actual results or events to be materially different. In addition, words such as “may,” “will,” “seeks,” “anticipates,” “believes,” “estimates,” "expects,” “plans,” “intends,” “would,” or similar expressions indicate a forward-looking statement, although not all forward-looking statements contain these identifying words. Any statements referring to the future value of an investment in GNL, including the adjustments giving effect to the merger with The Necessity Retail REIT ("RTL") (the “REIT Merger”) and GNL and RTL becoming internally managed (the “Internalization Merger” and, together with the REIT Merger, the “Transactions”), all completed on September 12, 2023 as described in GNL's current report on Form 8-K also filed on September 12, 2023, are also forward-looking statements. There are a number of risks, uncertainties and other important factors that could cause GNL’s actual results, or GNL’s actual results after making adjustments to give effect to the REIT Merger and the Internalization Merger, to differ materially from those contemplated by such forward-looking statements, including but not limited to: (i) significant transaction costs or unknown or inestimable liabilities, (ii) the risk that RTL’s business will not be integrated successfully or that such integration may be more difficult, time-consuming or costly than expected, (iii) risks related to future opportunities and plans for GNL post-closing, including the uncertainty of expected future financial performance and results of GNL post-closing following completion of the Transactions, (iv) the effect of the announcement of the proposed transaction on the ability of GNL and RTL to operate their respective businesses and retain and hire key personnel and to maintain favorable business relationships, (v) the effect of any downgrade of GNL’s or RTL’s corporate rating or to any of their respective debt or equity securities including the outstanding notes under the RTL Indenture; (vi) risks related to the market value of the GNL Common Stock, (vii) other risks related to the completion of the Proposed Transactions, (viii) potential adverse effects of the ongoing global COVID-19 pandemic, including actions taken to contain or treat COVID-19, on RTL, RTL's tenants and the global economy and financial market, as well as the additional risks, uncertainties and other important factors set forth in the “Risk Factors” and “Management’s Discussion and Analysis of Financial Condition and Results of Operations” sections of GNL’s Annual Report on Form 10-K for the year ended December 31, 2022 filed with the SEC on February 23, 2023, and all other filings with the SEC after that date, as such risks, uncertainties and other important factors may be updated from time to time in GNL’s subsequent reports. Further, forward-looking statements speak only as of the date they are made, and the Company undertakes no obligation to update or revise forward-looking statements to reflect changed assumptions, the occurrence of unanticipated events or changes to future operating results over time, except as required by law. This presentation contains certain statements that reflect the Company’s hopes, intentions, beliefs, expectations, or projections of the future and might be considered to be forward-looking statements under federal securities laws. Investors and others are cautioned that any such forward-looking statements are not guarantees of future performance, and involve risks and uncertainties. The Company’s actual future results may differ significantly from the matters discussed in these forward-looking statements, and we may not release revisions to these forward-looking statements to reflect changes after we have made the statements. If the Company updates one or more forward-looking statements, no inference should be drawn that the Company will make additional updates with respect to those or other forward-looking statements. |
2 This presentation also includes estimated projections of future operating results. These projections are not prepared in accordance with published guidelines of the SEC or the guidelines established by the American Institute of Certified Public Accountants for preparation and presentation of financial projections. This information is not fact and should not be relied upon as being necessarily indicative of future results; the projections were prepared in good faith by management and are based on numerous assumptions that may prove to be wrong. All such statements, including but not limited to estimates of value accretion, synergies, run-rate figures and results of future operations after making adjustments to give effect to the Transactions reflect assumptions as to certain business decisions and events that are subject to change. As a result, actual results may differ materially from those contained in the estimates. Accordingly, there can be no assurance that the estimates will be realized, or that the transactions described in this presentation, including but not limited to the Transactions, will be realized at all. Important factors that may affect actual results and cause the projections to not be achieved include, but are not limited to, risks and uncertainties relating to the Company and other factors described in the “Risk Factors” and “Management’s Discussion and Analysis of Financial Condition and Results of Operations” sections of the Company’s Annual Report on Form 10-K for the year ended December 31, 2022 filed with the SEC on February 23, 2023, and all other filings with the SEC after that date, as such risks, uncertainties and other important factors may be updated from time to time in the Company’s subsequent reports. This presentation also contains estimates and information concerning our industry and tenants, including market position, market size and growth rates of the markets in which we operate, that are based on industry publications and other third-party reports. This information involves a number of assumptions and limitations, and you are cautioned not to give undue weight to these estimates. We have not independently verified the accuracy or completeness of the data contained in these publications and reports. The industry in which we operate is subject to a high degree of uncertainty and risk due to a variety of factors, including those described in the “Risk Factors” and “Management’s Discussion and Analysis of Financial Condition and Results of Operations” sections of the Company’s Annual Report on Form 10-K for the year ended December 31, 2022 filed with the SEC on February 23, 2023, and all other filings with the SEC after that date, as such risks, uncertainties and other important factors may be updated from time to time in the Company’s subsequent reports. Credit Ratings A securities rating is not a recommendation to buy, sell or hold securities and may be subject to revision or withdrawal at any time. Each rating agency has its own methodology of assigning ratings and, accordingly, each rating should be evaluated independently of any other rating. PROJECTIONS |
3 MERGER & INTERNALIZATION UPDATE I |
REIT MERGER AND INTERNALIZATION UPDATE 4 1. For more information, refer to the Company's filings with the Securities and Exchange Commission, including the updated risk factors on a Form 8-K filed on September 18, 2023. 2. The Q4’23 projected AFFO was calculated using projected cash revenues less projected operating expenses, general and administrative expenses, cash interest, preferred equity dividends, and income taxes and the final calculation includes all revenue and expenses that are included in our historical calculation of AFFO. The projection did not calculate expense items that are not included in the calculation of AFFO as they are not relevant and as a result it would take unreasonable effort to calculate them for reconciliation purposes. 3. The Q4’23 projected Adjusted EBITDA was calculated using projected revenue less projected general and administrative expenses and the final calculation includes all revenue and expenses that are included in our historical calculation of Adjusted EBITDA. The projection did not calculate expense items that are not included in the calculation of Adjusted EBITDA and as a result it would take unreasonable effort to calculate them for reconciliation purposes. REIT Merger and Internalization Update(1) ▪ The Merger and Internalization transactions closed on September 12, 2023 ▪ Highly differentiated, global net lease platform benefiting from substantial scale and cost savings ▪ Accretive transaction has created the third largest listed net lease REIT with global presence ▪ Internalized management and further enhanced corporate governance ▪ Approximately $75 million in expected annual cost savings ▪ 9% accretive to annualized AFFO per share in the first quarter after closing, compared to Q1’23(2) ▪ Net debt to adjusted annualized EBITDA expected to be reduced to 7.6x in Q4’23(3) GNL has completed its merger with RTL, internalized management, and enhanced corporate governance |
5 STRATEGIC RATIONALE AND BENEFITS OF MERGER AND INTERNALIZATION Sector Leading Diversified Net Lease REIT • Considerably increased size, scale, and prominence of Global Net Lease, Inc. (“GNL”) with $9.5 billion of real estate assets on a combined company basis(1)(5) • GNL is the 3rd largest publicly-traded net lease REIT with a global presence and the 4th largest publicly-traded net lease REIT(5) Enhanced Portfolio • Greater diversity by geography, asset type, tenant, and industry, spanning industrial, retail, and office assets across North America and Europe • Concentration risk mitigated through new tenants, property types, and markets with limited integration risk Positioned for Growth • Deeper tenant relationships and the ability to leverage GNL and RTL track records of sourcing additional acquisitions and strong leasing growth • Larger asset base allows for greater balance sheet flexibility and ability to grow and optimize portfolio • Scaled capital structure enables greater access to capital Immediate AFFO Accretion and Reduced Leverage • +9% accretive relative to GNL’s Q1’23 AFFO per share on an annualized basis(2)(5)(6)(7)(8) • Net debt to adj. annualized EBITDA reduced from 8.3x in Q2’23 to estimated 7.6x in Q4’23(3)(5)(6)(8) Enhanced Corporate Governance • Opted out of the classified board provision of the Maryland Unsolicited Takeovers Act (“MUTA”) • Declassified Board of Directors, seven of the nine directors now stand for election to annual terms at the 2024 annual meeting of stockholders, and all nine directors will stand for election to annual terms at the 2025 annual meeting • Company’s Stockholder Rights Plan Repealed (commonly referred to in the industry as a “poison pill”) • Amended bylaws to delete the requirement that up to two board members to be “managing directors” Internalization of Management(5) • Supplements accretion from Merger synergies through elimination of all management fees • Significantly reduced operating expense increases cash flow to fund debt repayment, acquisitions, and increase dividend coverage • Internally managed peers trade at a 12.8x 2024E AFFO multiple compared to 8.4x for externally managed net lease REITs(4)(7) Source: FactSet. Note: Balance sheet and portfolio metrics as of June 30, 2023, and giving effect to the merger for GNL, unless otherwise noted. Market data as of September 13, 2023. 1. Based on total gross book value of real estate of the combined company. 2. % accretion based on estimated Q4'23 annualized AFFO per share, which gives effect to Merger and Internalization. 3. Estimated Q4’23 net debt to annualized adjusted EBITDA affected by the Merger and Internalization. 4. Internally managed peers include ADC, BNL, GTY, EPRT, FCPT, LXP, NNN, NTST, O, SRC, and WPC. Externally managed net lease REITs include GOOD, OPI, and PINE. 5. Please see Disclaimers at the front of this presentation for important information regarding as adjusted figures giving effect to the Merger and the Internalization. There can be no assurance that any of these projected synergies, value accretion estimates or combined future results of operations will be realized. 6. Please see Disclaimers at back of this presentation for a definition of all non-GAAP measures and a reconciliation to the Company's nearest GAAP measure. 7. Please see Disclaimers at the back of this presentation for a definition of AFFO. While we consider AFFO a useful indicator of our performance, we do not consider AFFO as an alternative to net income (loss) or as a measure of liquidity. Furthermore, other REITs may define AFFO differently than we do. Projected AFFO per share data included in this presentation is for informational purposes only and should not be relied upon as indicative of future dividends or as a measure of future liquidity. 8. Refer to Q4’23 projected AFFO and Q4’23 projected Adjusted EBITDA definitions included in the footnotes on slide 4. |
6 • Approximately $54mm cost efficiency created from elimination of all management fees, supplementing accretion from Merger synergies • Significantly reduced operating expense to increase cash flow to fund debt repayment, acquisitions, and increase dividend coverage • Seamless transition of asset management, property management, acquisitions, leasing, capital markets, accounting, and executive teams totaling approximately 75 employees • Internally managed REITs historically trade at higher AFFO multiples and have higher institutional investor ownership • Potential trading multiple expansion would reduce GNL cost of capital and increase spread between WACC and acquisition yields 100% 100% 100% 97% 99% 96% 95% 91% 89% 81% 65% 77% 78% 69% 47% Average: 92% Average: 65% NTST ADC EPRT FCPT SRC LXP GTY NNN BNL O WPC GNL OPI PINE GOOD 15.0x 14.6x 14.0x 13.4x 13.3x 13.2x 13.0x 11.5x 11.5x 11.0x 9.9x 6.7x 10.9x 10.3x Average: 12.8x 3.9x Average: 8.4x LXP ADC FCPT EPRT NTST O GTY NNN WPC BNL SRC GNL GOOD PINE OPI Source: Company filings, FactSet, S&P Global. Note: Market data as of September 13, 2023. 1. Please see Disclaimers at the front of this presentation for important information regarding as adjusted figures giving effect to the Merger and the Internalization. There can be no assurance that any of these projected synergies, value accretion estimates or combined future results of operations will be realized. 2. Internalization occurred substantially concurrently with the closing of the Merger. 3. Internal versus external management status as identified by public company filings. 4. Please see Disclaimers at the back of this presentation for a definition of AFFO. While we consider AFFO a useful indicator of our performance, we do not consider AFFO as an alternative to net income (loss) or as a measure of liquidity. Furthermore, other REITs may define AFFO differently than we do. Projected AFFO per share data included in this presentation is for informational purposes only and should not be relied upon as indicative of future dividends or as a measure of future liquidity. 5. 2024E AFFO multiples based on mean of consensus estimates. 6. Calculated based on institutional ownership divided by the company’s total float. Institutional ownership greater than 100% is illustratively capped at 100% and attributed to shares sold short, misrepresented positions in filings, and / or overlapping filing periods. INTERNALIZATION OVERVIEW Benefits of Internalization(1) GNL realized significant costs savings following its internalization of management and may benefit from potential trading multiple expansion Price to 2024E AFFO Multiples(4)(5) Institutional Investor Ownership(6) Externally Managed REITs(3) Internally Managed Peers(3) |
7 Category Estimated Annual Savings Description Internalization Savings Approximately $54 million in annual cost savings realized at transaction close(2) • Elimination of asset management fees, property management fees, incentive fees, equity issuance fees, and reimbursable expenses net of internalized employee compensation, rent and overhead, and retained 3rd party services Merger Synergies Approximately $21 million run-rate realized over the next 12 months(2) • Corporate consolidation, public company cost savings, and elimination of other duplicative services Net Savings Approximately $75 million Note: Balance sheets as of June 30, 2023, and giving effect to the merger for GNL, unless otherwise noted. 1. Calculated using June 30, 2023 general and administrative (“G&A”) expense, annualized, divided by straight-line rent for GNL and annualized base rent for peers. GNL G&A represents estimated next twelve months G&A as of 09/30/2023E giving effect to the Merger and the Internalization. 2. Please see Disclaimers at the front of this presentation for important information regarding as adjusted figures giving effect to the Merger and the Internalization. There can be no assurance that any of these projected synergies, value accretion estimates or combined future results of operations will be realized. SUBSTANTIAL MERGER SYNERGIES AND INTERNALIZATION SAVINGS G&A Efficiency(1)(2) 4% 5% 6% 7% 7% 9% 9% 10% 11% 13% 15% 18% O NNN PF GNL ADC WPC SRC EPRT BNL FCPT LXP GTY NTST 100% of synergies realized immediately upon Internalization and over the next 12 months(2) (2) |
8 GLOBAL NET LEASE TODAY II |
9 $46,664 $19,675 $9,932 $9,511 $8,810 $6,567 $4,954 $4,472 $4,220 $2,830 $1,637 $1,455 SECTOR LEADING NET LEASE REIT Source: Company filings, company websites, FactSet, S&P Global. Note: Balance sheets as of June 30, 2023 and giving effect to the merger for GNL, unless otherwise noted. 1. Based on gross book value of real estate as of June 30, 2023. GNL is the 3rd largest net lease REIT with a global presence(1) Gross Book Value of Real Estate ($ in millions) REITs with Global Presence |
10 15.2x 15.1x 14.6x 14.3x 13.8x 13.8x 13.3x 11.7x 11.7x 11.4x 10.1x 6.9x Average: 12.8x 85% 81% 81% 80% 79% 77% 76% 74% 74% Average: 75% 70% 68% 68% 13% 6% 5% 7% 7% 6% 6% 5% 7% 6% 5% 5% Expect GNL’s quarterly dividend policy to be set at $0.354 per share ($1.42 per share, annualized) Q4’23 AFFO expected to be $0.42 per share ($1.68 per share, annualized)(1)(3)(4) Opportunity for potential capital appreciation should multiple move closer to peers Increased flexibility to deploy savings to further de-lever the balance sheet ATTRACTIVE YIELD WITH EMBEDDED POTENTIAL UPSIDE Source: Company filings, company websites, FactSet, S&P Global. Note: Market data as of September 13, 2023. 1. Please see Disclaimers at the front of this presentation for important information regarding as adjusted figures giving effect to the Merger and the Internalization. There can be no assurance that any of these projected synergies, value accretion estimates or combined future results of operations will be realized. 2. 2023E AFFO multiples based on mean of consensus estimates. 2023E AFFO payout ratio based on most recent period dividend per share, annualized, divided by 2023E AFFO multiples. GNL 2023E AFFO multiple and payout based on estimated Q4’23 annualized dividend and AFFO per share. 3. Refer to Q4’23 projected AFFO definition included in the footnotes on slide 4. 4. Please see Disclaimers at the back of this presentation for a definition of AFFO. While we consider AFFO a useful indicator of our performance, we do not consider AFFO as an alternative to net income (loss) or as a measure of liquidity. Furthermore, other REITs may define AFFO differently than we do. Projected AFFO per share data included in this presentation is for informational purposes only and should not be relied upon as indicative of future dividends or as a measure of future liquidity. Dividend Policy Price to 2023E AFFO Multiples(1)(2)(3) 2023E AFFO Payout Ratio(1)(2)(3)(4) Dividend Yield |
11 WELL POSITIONED PORTFOLIO WITH STRONG KEY METRICS Note: Portfolio metrics as of June 30, 2023, and giving effect to the merger for GNL, unless otherwise noted. 1. Please see Disclaimers at the front of this presentation for important information regarding as adjusted figures giving effect to the Merger and the Internalization. There can be no assurance that any of these projected synergies, value accretion estimates or combined future results of operations will be realized. 2. For Q2’23, calculated as of June 30, 2023, using annualized straight-line rent (“SLR”) converted from local currency into USD as of June 30, 2023 for the in-place lease on the property on a straight-line basis, includes tenant concessions such as free rent, as applicable. 3. For Q2’23, calculated as of June 30, 2023, using square feet. 4. Metric based on annualized SLR as of June 30, 2023. 5. As used herein, Investment Grade includes both actual investment grade ratings of the tenant or guarantor, if available, or implied investment grade. Implied investment grade may include actual ratings of tenant parent, guarantor parent (regardless of whether or not the parent has guaranteed the tenant’s obligation under the lease) or by using a proprietary Moody’s analytical tool, which generates an implied rating by measuring a company’s probability of default. The term “parent” for these purposes includes any entity, including any governmental entity, owning more than 50% of the voting stock in a tenant. Multi-tenant portfolio includes credit ratings for tenants who occupy 10,000 square feet or more. Number of Properties Square Feet (millions) Straight-Line Rent ($ millions)(2) % Leased Weighted Average Remaining Lease Term(3) % Investment Grade Tenants(4)(5) Industrial + + + 218 33.6 $228 99% 8.1 Years 55% Industrial 91 8.9 $149 93% 5.0 Years 70% Office 890 8.0 $151 97% 8.4 Years 64% Single-Tenant Retail 109 16.4 $201 89% 4.8 Years 37% Multi-Tenant Retail 1,308 66.9 $729 96% 6.9 Years 57% Total Portfolio(1) |
12 MIDWEST NC FL GA AL MS LA TX NM AZ CA NV UT OR WA ID MT WY CO ND SD NE KS OK AR MO IA MN WI MI IL IN OH KY TN SC NC WV VA PA NY VT NH ME MA NJ CT MD DE DC RI NB PACIFIC SOUTHWEST SOUTHWEST MID-ATLANTIC NEW PACIFIC BRUNSWICK NORTHWEST SOUTH EAST AK NORTHEAST THIRD LARGEST NET LEASE REIT WITH A GLOBAL PRESENCE GNL Geographic Exposure(1) Source: Company filings. Note: Portfolio metrics as of June 30, 2023, and giving effect to the merger for GNL, unless otherwise noted. 1. Please see Disclaimers at the front of this presentation for important information regarding as adjusted figures giving effect to the Merger and the Internalization. There can be no assurance that any of these projected synergies, value accretion estimates or combined future results of operations will be realized. SP FR UK ITL GER LUX NETH FIN CI United States / Canada US / Canada Total – 80.3% of SLR ⚫ Southeast – 23.4% of SLR ⚫ Midwest – 20.5% of SLR ⚫ Mid-Atlantic – 12.3% of SLR ⚫ Southwest – 10.8% of SLR ⚫ Northeast – 5.9% of SLR ⚫ Pacific Southwest – 6.4% of SLR ⚫ Pacific Northwest – 0.6% of SLR ⚫ New Brunswick, – 0.4% of SLR Canada Europe Europe Total – 19.7% of SLR ⚫ United Kingdom – 11.1% of SLR ⚫ Netherlands – 2.2% of SLR ⚫ Finland – 2.0% of SLR ⚫ Germany – 1.4% of SLR ⚫ France – 1.1% of SLR ⚫ Channel Islands – 0.8% of SLR ⚫ Luxembourg – 0.8% of SLR ⚫ Italy – 0.3% of SLR ⚫ Spain – 0.1% of SLR |
13 Single-Tenant Industrial / Distribution 31% Single-Tenant Retail 21% Single-Tenant Office 20% Multi-Tenant Retail 28% Total Portfolio Annualized SLR by Segment Industry Exposure(1)(3) Credit Rating Asset Diversification(3) (1)(2)(3) Note: Portfolio metrics as of June 30, 2023 and giving effect to the merger for GNL, unless otherwise noted. 1. Metric based on annualized SLR as of June 30, 2023. Refer to SLR definition included in the footnotes on slide 11. 2. Refer to Investment Grade Rating definition included in the footnotes on slide 11. 3. Please see Disclaimers at the front of this presentation for important information regarding as adjusted figures giving effect to the Merger and the Internalization. There can be no assurance that any of these projected synergies, value accretion estimates or combined future results of operations will be realized. DIVERSIFIED AND STABLE TENANT BASE Single-Tenant Portfolio Multi-Tenant Portfolio Power Center 58% Anchored Center 22% Grocery Anchored 21% Industrial / Distribution 43% Retail 29% Office 28% $728.9 million $528.0 million $200.8 million Financial Services, 6% Healthcare, 6% Auto Manufacturing, 6% Discount Retail, 5% Specialty Retail, 5% Gas/Convenience, 4% Home Improvement, 3% Freight, 3% Consumer Goods, 3% Quick Service Restaurant, 3% All Other, 56% Investment Grade 57% Non-Investment Grade 35% Not Rated 9% |
14 DIVERSIFIED AND STABLE TENANT BASE (CONT’D) Note: Ratings information is as of June 30, 2023 and giving effect to the merger for GNL, unless otherwise noted. *Represents Implied Rating. ** Represents Tenant Parent Rating even if not a guarantor on the lease. 1. Metric based on annualized SLR as of June 30, 2023. Refer to SLR definition included in the footnotes on slide 11. 2. Based on Annualized Straight-Line Rent. Ratings information as of June 30, 2023. For GNL, 54.2% of the rated tenants were actual Investment Grade rated and 24.4% of the rated tenants were implied Investment Grade rated. Implied Investment Grade includes ratings of the tenant’s parent (regardless of whether or not the parent has guaranteed the tenant’s obligation under the lease) or lease guarantor. Refer to Investment Grade Rating definition included in the footnotes on slide 11. Top ten tenants represent 19.7% of SLR with no single tenant accounting for more than 2.7% Tenant Credit Rating Country Property Type % of SLR(1) Caa1 / B- U.K. Industrial 2.7% Baa2** U.S. / Canada Distribution 2.7% Baa2* U.S. Retail 2.1% Baa3 U.S. Retail 2.0% Baa1 U.S. / Italy Industrial / Distribution 1.8% A2 U.S. Retail 1.8% Baa3 U.S. Distribution 1.7% Aaa** U.S. Office 1.7% A2 U.S. Retail 1.6% B1* U.K. Office 1.5% Top 10 Tenants 78.6% IG Rated(2) 19.7% Top Ten Tenants |
15 6% 10% 11% 12% 16% 17% 17% 17% 20% 23% 70% 81% 18% 19% 19% 20% 22% 25% 30% 32% 38% 51% 70% 74% DIVERSIFIED AND STABLE TENANT BASE (CONT’D) Top 10 Tenants Percentage of Total SLR(1)(2) Source: Company filings, company websites, FactSet, S&P Global. Note: Portfolios metrics as of June 30, 2023, and giving effect to the merger for GNL, unless otherwise noted. 1. Please see Disclaimers at the front of this presentation for important information regarding as adjusted figures giving effect to the Merger and the Internalization. There can be no assurance that any of these projected synergies, value accretion estimates or combined future results of operations will be realized. 2. Refer to SLR definition included in the footnotes on slide 11. Metric based on annualized SLR for GNL as of June 30, 2023. peers based on annualized base rent. 3. Industries as identified by each REIT. Industry Diversification by Total SLR(1)(2)(3) GNL’s sector leading industry diversification and low tenant concentration risk are favorable relative to peers |
16 2023 ACQUISITION ACTIVITY Note: Ratings information is as of September 15, 2023. *Represents Moody’s Implied Rating. ** Represents Tenant Parent Rating even if not a guarantor on the lease. 1. Weighted Average Cap Rate is a rate of return on a real estate investment property based on the expected, annualized SLR that the property will generate under its existing lease or leases. Average Cap Rate is calculated by dividing the annualized SLR the property will generate (before debt service and depreciation and after fixed costs and variable costs) by the purchase price of the property, excluding acquisition costs. The weighted Average Cap Rate is based upon square footage as of the date of acquisition. 2. Represents remaining lease term as of closing date, or expected closing date, and is weighted based on square feet. 3. Based on the exchange rate of 1.2369 U.S. dollars to one British pound as of closing of the acquisition. 4. Based on information as of September 15, 2023. The LOIs are non-binding and may not be completed on their contemplated terms, or at all. Acquisition Name Acquisition Status Credit Rating Property Type Purchase Price (in mm) Wtg. Avg. Cap Rate(1) Wtg. Avg. Lease Term Remaining(2) Closed 2023 Acquisitions Boots (Walgreens) 8-Property Portfolio (UK) Closed: Q1’23 Baa2 Pharmacy Retail $75.5(3) 11.5 Total 2023 Closed Acquisitions $75.5 10.6% 11.5 Acquisition Pipeline(4) FedEx Ground Marion, IL Signed PSA Expected Close: Q4’23 Baa2 Distribution $52.7 9.4 Dollar General 8-Property Portfolio Signed PSA Expected Close: Q4’23 & Q1’24 Baa2 Discount Retail $15.5 15.0 Tidal Wave Car Wash 10-Property Portfolio Sale Leaseback Signed LOI Expected Close: Q4’23 Caa3* Car Wash $45.2 20.0 High Quality Retail 19-Property Portfolio (7-Eleven, Walgreens, Food Lion, DaVita) Signed LOI Expected Close: Q1’24 65% IG Retail $71.5 7.0 Total Closed Plus Q3’23 Acquisition Pipeline $260.3 8.3% 10.2 Management continues to diligently evaluate domestic and international transactions focused on industrial, distribution and retail assets |
17 GNL continued leasing momentum generated in Q1’23 and has completed over 158 lease renewals and tenant expansions through July 2023(1). GNL’s leasing activity totaled 3.4 million square feet and nearly $85.5 million of net new straight-line rent 2023(1) Lease Extensions+ Expansion Project Updates GNL ST Industrial and Office GNL Multi-Tenant Portfolio Lease Extensions, Expansions, and New Leases Completed 21 137 2023 Renewal Leasing Spread 0.7% 9.5%(2) Net Straight-Line Rent Extended + Expansion + New Leases $64.1 million $21.4 million Square Feet Extended + Expansion + New Leases 1,662,330 1,706,610 1. Leasing activity from 1/1/2023 through 7/20/2023 for GNL. Leasing activity from 1/1/2023 through 7/31/2023 for acquired assets. 2. Reflects weighted average leasing spreads for year-to-date 2023, weighted on square feet extended or expanded for Q1’23 and Q2’23. 3. Based on square feet as of June 30, 2023 for Q2’23. CONTINUED PROACTIVE LEASING RENEWAL AND EXPANSION ACTIVITY GNL Lease Expiration Schedule Following Merger(3) (Q2’23) 1% 8% 9% 7% 11% 65% 2023 2024 2025 2026 2027 Thereafter GNL Lease Expiration Schedule |
18 Plan to maintain conservative financial and credit policies and expect to further de-lever the balance sheet through operating expense savings, potential non-core asset sales, organic NOI growth, and dividend policy revision Operating expense savings from Merger and Internalization to reduce leverage over time Focus on transitioning to a predominantly unsecured capital structure Multi-currency and majority fixed rate debt reduces balance sheet risk(1) Q2’23 weighted average debt maturity of 3.8 years and interest rate of 4.7% after giving effect to the Merger and Internalization(2)(3) GNL CAPITALIZATION AND BALANCE SHEET STRATEGY $1,693 $500 $500 $97 $404 $707 $116 $163 $1,098 2023 2024 2025 2026 2027 Thereafter Credit Facility Senior Notes Mortgages Q2’23 Debt Maturity Schedule Following Merger and Internalization(2) % of Total Debt 1.8% 7.7% 13.4% 34.3% 12.6% 30.3% Balance Sheet Highlights Net Debt to Adjusted Annualized EBITDA(4)(6)(7) ($ in millions) 1. Fixed rate debt includes floating rate debt fixed by swaps. 2. Q2-23 capital structure is based on RTL and GNL outstanding principal balance and effective interest rates as of June 30, 2023 adjusted for the Merger and Internalization. Merger and Internalization adjustments include the assumption of all RTL debt aside from RTL’s credit facility. GNL amended its credit facility, exercised the accordion, and drew $654mm to fund repayment of RTL credit facility and internalization payment. Other transaction costs not included. 3. Weighted average debt maturity based on outstanding principal balance of the debt as of June 30, 2023. 4. GNL Pre-Transactions represents Q2’23 net debt to annualized adjusted EBITDA. 5. Represents estimated period end Q4’23 net debt to annualized adjusted EBITDA with affect for the Merger and Internalization. 6. Please see Disclaimers at the front of this presentation for important information regarding as adjusted figures giving effect to the Merger and the Internalization. There can be no assurance that any of these projected synergies, value accretion estimates or combined future results of operations will be realized. 7. Please see Disclaimers at back of this presentation for a definition of all non-GAAP measures and a reconciliation to the Company's most directly comparable GAAP measure. 8.3x 7.6x Q4’23 Pre (5) -Transactions |
19 GNL’s corporate governance is aligned with its industry peers GNL GOVERNANCE RELATIVE TO PEERS Source: Company filings, company websites, FactSet 1. Market data reflects REITs that have made public announcements of opting out of the Maryland Unsolicited Takeovers Act (“MUTA”). 2. Market data reflects REITs that have made public announcements of requiring Managing Directors to sit on the Board. No Shareholder Rights Plan (No Poison Pill in force) Opted out of the Maryland Unsolicited Takeovers Act (“MUTA”)(1) Declassified Board No Managing Director Required on Board(2) Shareholders Can Call Special Meetings No Cumulative Voting |
20 LEADERSHIP OVERVIEW Management Board of Directors Michael Weil, Director Refer to “Management” section for Michael Weil’s biography Michael Weil, Co-Chief Executive Officer Previously served as Senior VP of sales and leasing for American Financial Realty Trust Served as president of the Board of Directors of the Real Estate Investment Securities Association (n/k/a ADISA) James Nelson, Co-Chief Executive Officer Joined GNL Board in March 2017 Currently serves Chairman of the Board of Xerox Holdings Corporation. Also currently serves as an independent director and chair of the audit committee for Chewy, Inc. Chris Masterson, Chief Financial Officer Previously served as Chief Accounting Officer of GNL Past experience includes accounting positions with Goldman Sachs and KPMG Sue Perrotty, Non-Executive Chairperson of the Board of Directors Currently serves as President and Chief Executive Officer of AFM Financial Services and Tower Health James Nelson, Director Refer to “Management” section for James Nelson’s biography Edward Rendell, Independent Director Previously served as the 45th Governor of the Commonwealth of Pennsylvania and as the Mayor of Philadelphia Lisa Kabnick, Independent Director Currently serves as senior advisor for Troutman Pepper Hamilton Sanders LLP Therese Antone, Independent Director Currently serves as the Chancellor of Salve Regina University since her appointment in 2009 Abby Wenzel, Independent Director Previously served as co-chair of Cozen O’Connor’s Real Estate Group Leslie Michelson, Independent Director Currently serves as lead independent director of Franklin BSP Franklin Lending Corporation Stanley Perla, Independent Director Previously served as a member of the board of directors and the chair of the audit committee of Madison Harbor Balanced Strategies, Inc Highly experienced leadership team and majority independent Board of Directors Independent Directors Inside Directors |
21 FINANCIAL DEFINITIONS Non-GAAP Financial Measures This section discusses non-GAAP financial measures we use to evaluate our performance, including Funds from Operations (“FFO”), Core Funds from Operations (“Core FFO”), Adjusted Funds from Operations (“AFFO”), Adjusted Earnings before Interest, Taxes, Depreciation and Amortization (“Adjusted EBITDA”), Net Operating Income (“NOI”), Cash Net Operating Income (“Cash NOI”), and Constant Currency. While NOI is a property-level measure, AFFO is based on total Company performance and therefore reflects the impact of other items not specifically associated with NOI such as, interest expense, general and administrative expenses and operating fees to related parties. Additionally, NOI as defined herein, does not reflect an adjustment for straight-line rent but AFFO does include this adjustment. A description of these non-GAAP measures and reconciliations to the most directly comparable GAAP measure, which is net income, is provided below. Caution on Use of Non-GAAP Measures FFO, Core FFO, AFFO, Adjusted EBITDA, NOI, Cash NOI, and Constant Currency should not be construed to be more relevant or accurate than the current GAAP methodology in calculating net income or in its applicability in evaluating our operating performance. The method utilized to evaluate the value and performance of real estate under GAAP should be construed as a more relevant measure of operational performance and considered more prominently than the non-GAAP measures. Other REITs may not define FFO in accordance with the current National Association of Real Estate Investment Trusts (“NAREIT”) definition (as we do), or may interpret the current NAREIT definition differently than we do, or may calculate Core FFO or AFFO differently than we do. Consequently, our presentation of FFO, Core FFO and AFFO may not be comparable to other similarly-titled measures presented by other REITs. We consider FFO, Core FFO and AFFO useful indicators of our performance. Because FFO, Core FFO and AFFO calculations exclude such factors as depreciation and amortization of real estate assets and gain or loss from sales of operating real estate assets (which can vary among owners of identical assets in similar conditions based on historical cost accounting and useful-life estimates), FFO, Core FFO and AFFO presentations facilitate comparisons of operating performance between periods and between other REITs in our peer group. |
22 FINANCIAL DEFINITIONS Caution on Use of Non-GAAP Measures (cont’d) We consider FFO, Core FFO and AFFO useful indicators of our performance. Because FFO, Core FFO and AFFO calculations exclude such factors as depreciation and amortization of real estate assets and gain or loss from sales of operating real estate assets (which can vary among owners of identical assets in similar conditions based on historical cost accounting and useful-life estimates), FFO, Core FFO and AFFO presentations facilitate comparisons of operating performance between periods and between other REITs in our peer group. Constant currency results exclude any benefit or loss caused by foreign exchange fluctuations between foreign currencies and the United States dollar which would not have occurred if there had been a constant exchange rate. Revenue from tenants on a Constant Currency basis is calculated by applying the average monthly currency rates from prior comparable period to Revenues from tenants from the applicable period. We believe that this measure provides investors with information about revenue results and trends that eliminates currency volatility while increasing the comparability of our underlying results and trends. Funds from Operations, Core Funds from Operations and Adjusted Funds from Operations Funds From Operations Due to certain unique operating characteristics of real estate companies, as discussed below, NAREIT, an industry trade group, has promulgated a measure known as FFO, which we believe to be an appropriate supplemental measure to reflect the operating performance of a REIT. FFO is not equivalent to net income or loss as determined under GAAP. We calculate FFO, a non-GAAP measure, consistent with the standards established over time by the Board of Governors of NAREIT, as restated in a White Paper approved by the Board of Governors of NAREIT effective in December 2018 (the “White Paper”). The White Paper defines FFO as net income or loss computed in accordance with GAAP, excluding depreciation and amortization related to real estate, gain and loss from the sale of certain real estate assets, gain and loss from change in control and impairment write-downs of certain real estate assets and investments in entities when the impairment is directly attributable to decreases in the value of depreciable real estate held by the entity. Adjustments for unconsolidated partnerships and joint ventures are calculated to exclude the proportionate share of the non-controlling interest to arrive at FFO, Core FFO, AFFO and NOI attributable to stockholders, as applicable. Our FFO calculation complies with NAREIT’s definition. |
23 FINANCIAL DEFINITIONS Funds from Operations, Core Funds from Operations and Adjusted Funds from Operations (Cont’d) Funds From Operations (Cont’d) Due to certain unique operating characteristics of real estate companies, as discussed below, NAREIT, an industry trade group, has promulgated a measure known as FFO, which we believe to be an appropriate supplemental measure to reflect the operating performance of a REIT. FFO is not equivalent to net income or loss as determined under GAAP. We calculate FFO, a non-GAAP measure, consistent with the standards established over time by the Board of Governors of NAREIT, as restated in a White Paper approved by the Board of Governors of NAREIT effective in December 2018 (the “White Paper”). The White Paper defines FFO as net income or loss computed in accordance with GAAP, excluding depreciation and amortization related to real estate, gain and loss from the sale of certain real estate assets, gain and loss from change in control and impairment write-downs of certain real estate assets and investments in entities when the impairment is directly attributable to decreases in the value of depreciable real estate held by the entity. Adjustments for unconsolidated partnerships and joint ventures are calculated to exclude the proportionate share of the non-controlling interest to arrive at FFO, Core FFO, AFFO and NOI attributable to stockholders, as applicable. Our FFO calculation complies with NAREIT’s definition. The historical accounting convention used for real estate assets requires straight-line depreciation of buildings and improvements, and straight-line amortization of intangibles, which implies that the value of a real estate asset diminishes predictably over time. We believe that, because real estate values historically rise and fall with market conditions, including inflation, interest rates, unemployment and consumer spending, presentations of operating results for a REIT using historical accounting for depreciation and certain other items may be less informative. Historical accounting for real estate involves the use of GAAP. Any other method of accounting for real estate such as the fair value method cannot be construed to be any more accurate or relevant than the comparable methodologies of real estate valuation found in GAAP. Nevertheless, we believe that the use of FFO, which excludes the impact of real estate related depreciation and amortization, among other things, provides a more complete understanding of our performance to investors and to management, and, when compared year over year, reflects the impact on our operations from trends in occupancy rates, rental rates, operating costs, general and administrative expenses, and interest costs, which may not be immediately apparent from net income. |
24 FINANCIAL DEFINITIONS Funds from Operations, Core Funds from Operations and Adjusted Funds from Operations (Cont’d) Core Funds From Operations In calculating Core FFO, we start with FFO, then we exclude certain non-core items such as merger, transaction and other costs, settlement costs related to our Blackwells/Related Parties litigation, as well as certain other costs that are considered to be non-core, such as debt extinguishment costs, fire loss and other costs related to damages at our properties. The purchase of properties, and the corresponding expenses associated with that process, is a key operational feature of our core business plan to generate operational income and cash flows in order to make dividend payments to stockholders. In evaluating investments in real estate, we differentiate the costs to acquire the investment from the subsequent operations of the investment. We also add back non-cash write-offs of deferred financing costs and prepayment penalties incurred with the early extinguishment of debt which are included in net income but are considered financing cash flows when paid in the statement of cash flows. We consider these write-offs and prepayment penalties to be capital transactions and not indicative of operations. By excluding expensed acquisition, transaction and other costs as well as non-core costs, we believe Core FFO provides useful supplemental information that is comparable for each type of real estate investment and is consistent with management’s analysis of the investing and operating performance of our properties. Adjusted Funds From Operations In calculating AFFO, we start with Core FFO, then we exclude certain income or expense items from AFFO that we consider more reflective of investing activities, other non-cash income and expense items and the income and expense effects of other activities that are not a fundamental attribute of our business plan. These items include early extinguishment of debt and other items excluded in Core FFO as well as unrealized gain and loss, which may not ultimately be realized, such as gain or loss on derivative instruments, gain or loss on foreign currency transactions, and gain or loss on investments. In addition, by excluding non-cash income and expense items such as amortization of above-market and below-market leases intangibles, amortization of deferred financing costs, straight-line rent and equity-based compensation from AFFO, we believe we provide useful information regarding income and expense items which have a direct impact on our ongoing operating performance. We also exclude revenue attributable to the reimbursement by third parties of financing costs that we originally incurred because these revenues are not, in our view, related to operating performance. We also include the realized gain or loss on foreign currency exchange contracts for AFFO as such items are part of our ongoing operations and affect our current operating performance. |
25 FINANCIAL DEFINITIONS Funds from Operations, Core Funds from Operations and Adjusted Funds from Operations (Cont’d) Adjusted Funds From Operations (cont’d) In calculating AFFO, we exclude certain expenses which under GAAP are characterized as operating expenses in determining operating net income. All paid and accrued acquisition, transaction and other costs (including prepayment penalties for debt extinguishments) and certain other expenses, including general and administrative expenses incurred for the 2023 proxy contest and related Blackwells/Related Parties litigation, negatively impact our operating performance during the period in which expenses are incurred or properties are acquired and will also have negative effects on returns to investors, but are excluded by us as we believe they are not reflective of our on-going performance. Further, under GAAP, certain contemplated non-cash fair value and other non-cash adjustments are considered operating non-cash adjustments to net income. In addition, as discussed above, we view gain and loss from fair value adjustments as items which are unrealized and may not ultimately be realized and not reflective of ongoing operations and are therefore typically adjusted for when assessing operating performance. Excluding income and expense items detailed above from our calculation of AFFO provides information consistent with management’s analysis of our operating performance. Additionally, fair value adjustments, which are based on the impact of current market fluctuations and underlying assessments of general market conditions, but can also result from operational factors such as rental and occupancy rates, may not be directly related or attributable to our current operating performance. By excluding such changes that may reflect anticipated and unrealized gain or loss, we believe AFFO provides useful supplemental information. By providing AFFO, we believe we are presenting useful information that can be used to, among other things, assess our performance without the impact of transactions or other items that are not related to our portfolio of properties. AFFO presented by us may not be comparable to AFFO reported by other REITs that define AFFO differently. Furthermore, we believe that in order to facilitate a clear understanding of our operating results, AFFO should be examined in conjunction with net income (loss) calculated in accordance with GAAP and presented in our consolidated financial statements. AFFO should not be considered as an alternative to net income (loss) as an indication of our performance or to cash flows as a measure of our liquidity or ability to make distributions. |
26 FINANCIAL DEFINITIONS Adjusted Earnings before Interest, Taxes, Depreciation and Amortization, Net Operating Income, Cash Net Operating Income, and Constant Currency. We believe that Adjusted EBITDA, which is defined as earnings before interest, taxes, depreciation and amortization adjusted for acquisition, transaction and other costs, other non-cash items and including our pro-rata share from unconsolidated joint ventures, is an appropriate measure of our ability to incur and service debt. We also exclude revenue attributable to the reimbursement by third parties of financing costs that we originally incurred because these revenues are not, in our view, related to operating performance. All paid and accrued acquisition, transaction and other costs (including prepayment penalties for debt extinguishments) and certain other expenses, including general and administrative expenses incurred for the 2023 proxy contest and related Blackwells/Related Parties litigation, negatively impact our operating performance during the period in which expenses are incurred or properties are acquired and will also have negative effects on returns to investors, but are not reflective of on-going performance. Due to the increase in general and administrative expenses as a result of the 2023 proxy contest and related litigation as a portion of our total general and administrative expenses in the first quarter of 2023, we began including this adjustment to arrive at Adjusted EBITDA in order to better reflect our operating performance. Adjusted EBITDA for the fourth quarter of 2022 (the only prior period with these types of costs) has been conformed to this presentation. Adjusted EBITDA should not be considered as an alternative to cash flows from operating activities, as a measure of our liquidity or as an alternative to net income as an indicator of our operating activities. Other REITs may calculate Adjusted EBITDA differently and our calculation should not be compared to that of other REITs. |
27 FINANCIAL DEFINITIONS Adjusted Earnings before Interest, Taxes, Depreciation and Amortization, Net Operating Income, Cash Net Operating Income, and Constant Currency. (Cont’d) NOI is a non-GAAP financial measure equal to net income (loss), the most directly comparable GAAP financial measure, less discontinued operations, interest, other income and income from preferred equity investments and investment securities, plus corporate general and administrative expense, acquisition, transaction and other costs, depreciation and amortization, other noncash expenses and interest expense. We use NOI internally as a performance measure and believe NOI provides useful information to investors regarding our financial condition and results of operations because it reflects only those income and expense items that are incurred at the property level. Therefore, we believe NOI is a useful measure for evaluating the operating performance of our real estate assets and to make decisions about resource allocations. Further, we believe NOI is useful to investors as a performance measure because, when compared across periods, NOI reflects the impact on operations from trends in occupancy rates, rental rates, operating costs and acquisition activity on an unlevered basis, providing perspective not immediately apparent from net income. NOI excludes certain components from net income in order to provide results that are more closely related to a property’s results of operations. For example, interest expense is not necessarily linked to the operating performance of a real estate asset and is often incurred at the corporate level as opposed to the property level. In addition, depreciation and amortization, because of historical cost accounting and useful life estimates, may distort operating performance at the property level. NOI presented by us may not be comparable to NOI reported by other REITs that define NOI differently. We believe that in order to facilitate a clear understanding of our operating results, NOI should be examined in conjunction with net income (loss) as presented in our consolidated financial statements. NOI should not be considered as an alternative to net income (loss) as an indication of our performance or to cash flows as a measure of our liquidity Cash NOI is a non-GAAP financial measure that is intended to reflect the performance of our properties. We define Cash NOI as net operating income (which is separately defined herein) excluding amortization of above/below market lease intangibles and straight-line adjustments that are included in GAAP lease revenues. We believe that Cash NOI is a helpful measure that both investors and management can use to evaluate the current financial performance of our properties and it allows for comparison of our operating performance between periods and to other REITs. Cash NOI should not be considered as an alternative to net income, as an indication of our financial performance, or to cash flows as a measure of liquidity or our ability to fund all needs. The method by which we calculate and present Cash NOI may not be directly comparable to the way other REITs calculate and present Cash NOI. |
28 FINANCIAL DEFINITIONS Adjusted Earnings before Interest, Taxes, Depreciation and Amortization, Net Operating Income, Cash Net Operating Income, and Constant Currency. (Cont’d) Cash Paid for Interest is calculated based on the interest expense less non-cash portion of interest expense and amortization of mortgage (discount) premium, net. Management believes that Cash Paid for Interest provides useful information to investors to assess our overall solvency and financial flexibility. Cash Paid for Interest should not be considered as an alternative to interest expense as determined in accordance with GAAP or any other GAAP financial measures and should only be considered together with and as a supplement to our financial information prepared in accordance with GAAP. Constant currency results exclude any benefit or loss caused by foreign exchange fluctuations between foreign currencies and the United States dollar which would not have occurred if there had been a constant exchange rate. Revenue from tenants on a Constant Currency basis is calculated by applying the average monthly currency rates from prior comparable period to Revenues from tenants from the applicable period. We believe that this measure provides investors with information about revenue results and trends that eliminates currency volatility while increasing the comparability of our underlying results and trends. |
29 NON – GAAP RECONCILIATIONS (Amounts in thousands) Three Months Ended March 31, 2023 March 31, 2022 EBITDA: Net loss $ (890) $ 10,541 Depreciation and amortization 37,029 39,889 Interest expense 26,965 24,123 Income tax expense 2,707 3,095 EBITDA 65,811 77,648 Impairment charges – 230 Equity based compensation 2,925 2,727 Acquisition, transaction and other costs 99 8 Gain on dispositions of real estate investments 1,656 (4,615) Other income (66) (295) Expense attributable to 2023 proxy contest and related litigation(2) 1,716 – Adjusted EBITDA(1) 72,141 75,703 Operating fees to related parties 10,101 10,076 General and administrative 5,660 3,894 Expenses attributable to 2023 proxy contest and related litigation(2) (1,716) – NOI 86,186 89,673 Amortization of above- and below- market leases and ground lease assets and liabilities, net 955 330 Straight-line rent (1,888) (2,853) Cash NOI $ 85,253 $ 87,150 Cash Paid for Interest: Interest Expense $ 26,965 $ 24,123 Non-cash portion of interest expense (2,085) (2,596) Amortization of mortgage discounts premiums, net (227) (251) Total Cash Paid for Interest $ 24,653 $ 21,276 1. For the three months ended March 31, 2022 includes income from a lease termination fee of $0.3 million, which is recorded in revenue from tenants in the consolidated statement of operations. 2. Amount relates to general and administrative expenses incurred for the 2023 proxy contest and related Blackwells litigation. The Company does not consider these expenses to be part of its normal operating performance. Due to the increase in these expenses as a portion of its general and administrative expenses in the first quarter of 2023, the Company began including this adjustment to arrive at Adjusted EBITDA in order to better reflect its operating performance. The first quarter of 2022 did not have any of these expenses. |
30 NON – GAAP RECONCILIATIONS (Amounts in thousands) Three Months Ended March 31, 2023 March 31, 2022 Funds from operations (FFO): Net (loss) income attributable to common stockholders (in accordance with GAAP) $ (5,989) $ 5,483 Impairment charges – 230 Depreciation and amortization 37,029 39,889 FFO (as defined by NAREIT) attributable to stockholders(1) 31,040 45,602 Acquisition, transaction and other costs 99 8 Core FFO attributable to stockholders(1) 31,139 45,610 Non-cash equity based compensation 2,925 2,727 Non-cash portion of interest expense 2,085 2,596 Amortization related to above- and below- market lease intangibles and right-of-use assets, net 955 330 Straight-line rent (1,888) (2,853) Straight-line rent (rent deferral agreement)(2) – (120) Eliminate unrealized gains on foreign currency transactions(3) 2,647 (4,210) Amortization of mortgage discounts 227 251 Expenses attributable to 2023 proxy contest and related litigation(4) 1,716 – Adjusted funds from operations (AFFO) attributable to stockholders(1) $ 39,806 $ 44,331 Basic weighted-average shares outstanding 103,783 103,596 Diluted weighted-average shares outstanding 103,783 103,596 Net (loss) income per share attributable to common stockholders $ (0.06) $ 0.05 FFO per share $ 0.30 $ 0.44 Core FFO per share $ 0.30 $ 0.44 AFFO per share $ 0.38 $ 0.43 Dividends declared $ 41,677 $ 41,566 Revenue from tenants - Quarter Ended March 31, 2023 $ 94,332 Foreign currency translation impact (using average foreign currency exchange rates for the first quarter of 2022) 3,176 Revenue from Tenants (year over year constant currency adjusted): $ 97,508 (Amounts in thousands) 1. FFO, Core FFO and AFFO for the three months ended March 31, 2022 include income from a lease termination fee of $0.3 million, which is recorded in revenue from tenants in the consolidated statement of operations. The termination fee of approximately $9.0 million which was paid by the tenant at the end of the lease term on January 4, 2022 was earned and record ed as income evenly over the period from September 3, 2021 through January 4, 2022. 2. Represents amounts related to deferred rent pursuant to lease negotiations which qualify for FASB relief for which rent was deferred but not reduced. These amounts are included in the straight-line rent receivable on our balance sheet but are considered to be earned revenue attributed to the current period for rent that was deferred, for purposes of AFFO, as they are expected to be collected. Accordingly, when the deferred amounts are collected, the amounts reduce AFFO. As of March 31, 2023, the Company has collected all previously deferred rents. 3. For AFFO purposes, we add back unrealized (gain) loss. For the three months ended March 31, 2023, the loss on derivative instruments was $1.7 million which consisted of unrealized losses of $2.6 million and realized gains of $0.9 million. For the three months ended March 31, 2022, the gain on derivative instruments was $4.6 million which consisted of unrealized gains of $4 .2 million and realized gains of $0.4 million. 4. Amount relates to general and administrative expenses incurred for the 2023 proxy contest and related Blackwells litigation. The Company does not consider these expenses to be part of its normal operating performance and has, accordingly, increased its AFFO for this amount. |
31 NON – GAAP RECONCILIATIONS (Amounts in thousands) Three Months Ended June 30, 2023 June 30, 2022 EBITDA: Net loss $ (26,258) $ (716) Depreciation and amortization 37,297 39,359 Interest expense 27,710 23,449 Income tax expense 3,508 2,515 EBITDA 42,257 64,607 Impairment charges – 16,031 Equity based compensation 2,870 3,358 Merger, transaction and other costs 6,279 133 Settlement costs 15,084 – Gain on dispositions of real estate investments – (62) Loss (gain) on derivative instruments 774 (7,798) Unrealized income on undesignated foreign currency advances and other hedge ineffectiveness – (2,439) Loss on extinguishment of debt 404 342 Other income (1,650) (549) Expenses attributable to 2023 proxy contest and related litigation(1) 7,371 – Adjusted EBITDA 73,389 73,623 Operating fees to related parties 10,110 10,081 General and administrative 10,683 3,675 Expenses attributable to 2023 proxy contest and related litigation(1) (7,371) – NOI 86,811 87,379 Amortization of above- and below- market leases and ground lease assets and liabilities, net 1,297 273 Straight-line rent (1,786) (2,342) Cash NOI $ 86,322 $ 85,310 Cash Paid for Interest: Interest Expense $ 27,710 $ 23,449 Non-cash portion of interest expense (2,083) (2,336) Amortization of mortgage discounts premiums, net (237) (238) Total Cash Paid for Interest $ 25,390 $ 20,875 1. Amounts relate to general and administrative expenses incurred for the 2023 proxy contest and related Blackwells litigation. The Company does not consider these expenses to be part of its normal operating performance. Due to the increase in these expenses as a portion of its general and administrative expenses in the first quarter of 2023, the Company began including this adjustment to arrive at Adjusted EBITDA in order to better reflect its operating performance. The second quarter of 2022 did not have any of these expenses. |
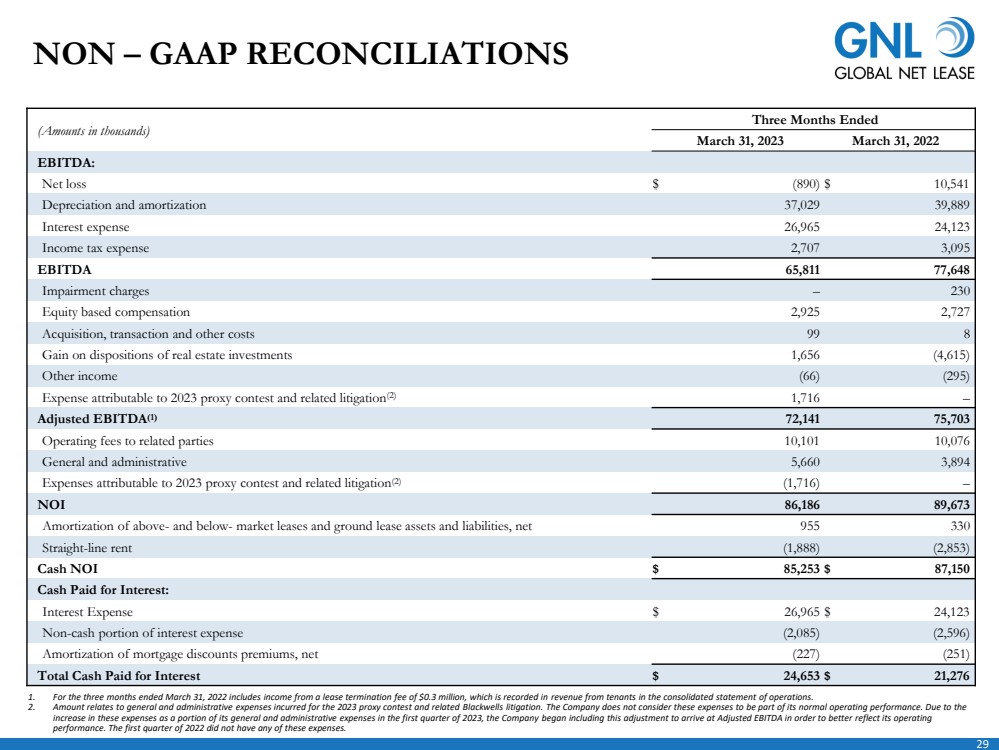
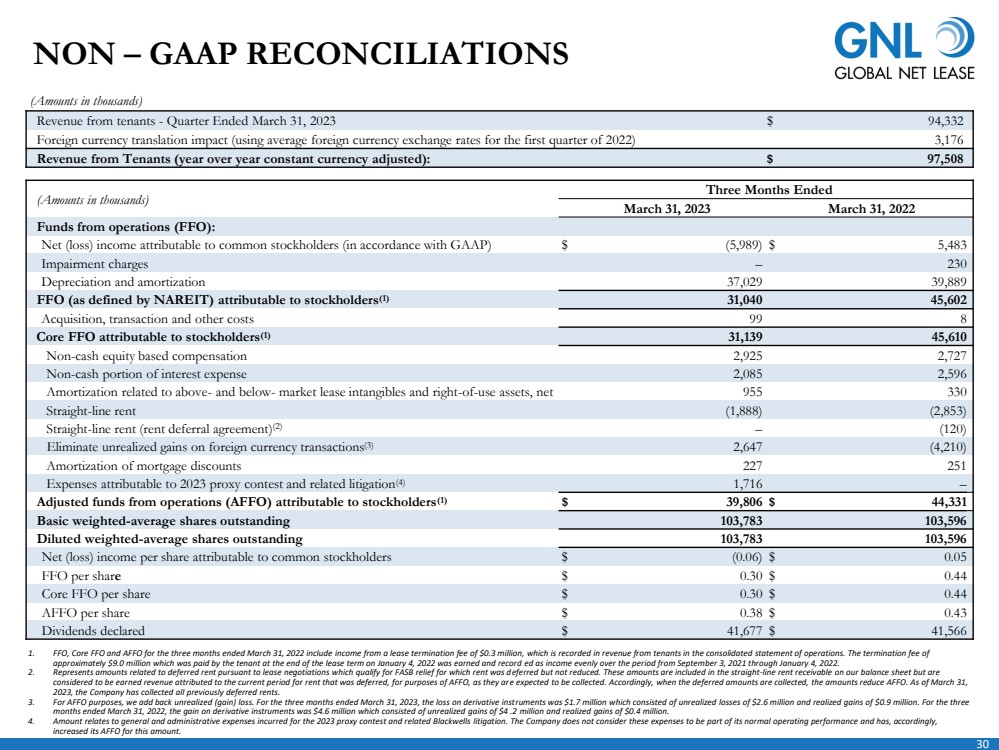
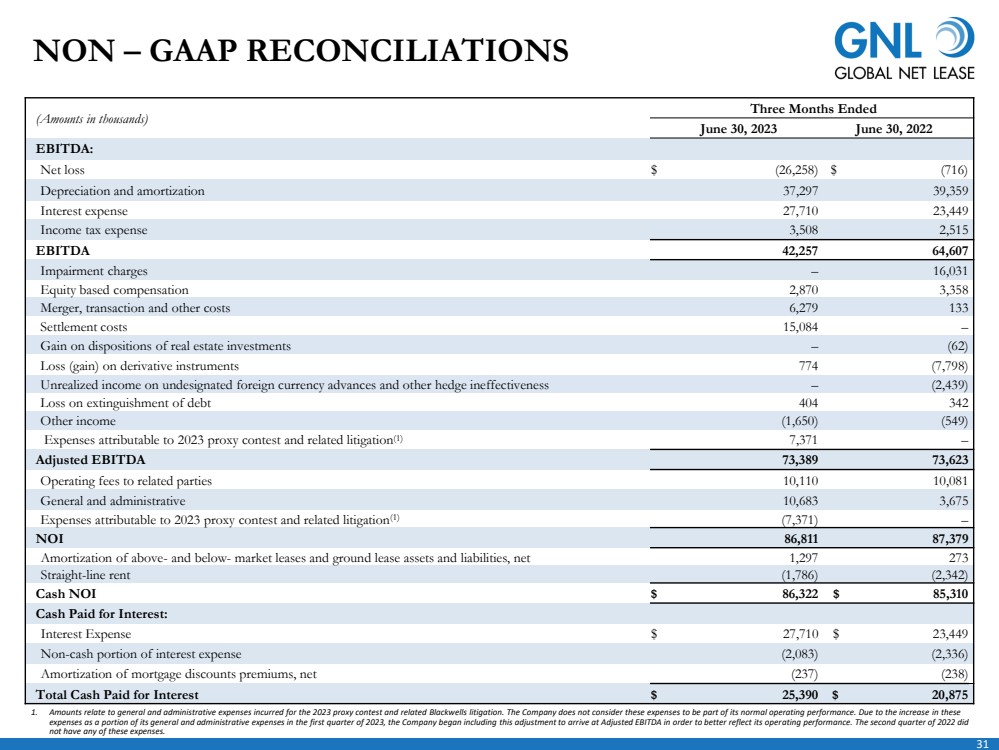
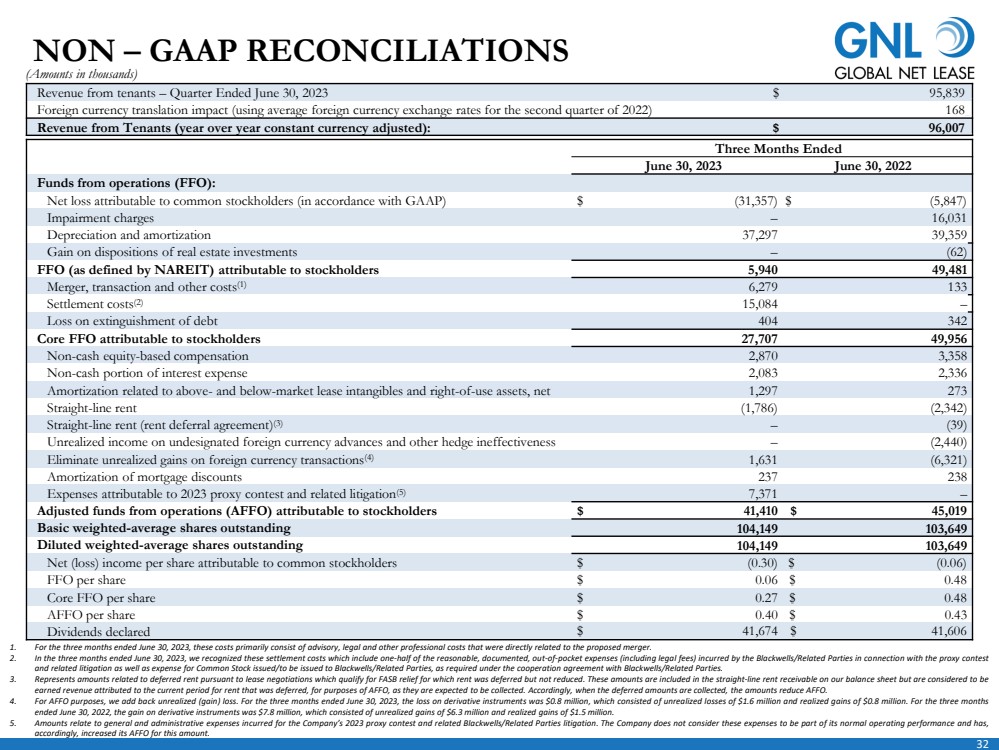
32 NON – GAAP RECONCILIATIONS Revenue from tenants – Quarter Ended June 30, 2023 $ 95,839_ Foreign currency translation impact (using average foreign currency exchange rates for the second quarter of 2022) 168_ Revenue from Tenants (year over year constant currency adjusted): $ 96,007_ (Amounts in thousands) Three Months Ended June 30, 2023 June 30, 2022 Funds from operations (FFO): Net loss attributable to common stockholders (in accordance with GAAP) $ (31,357) $ (5,847) Impairment charges – 16,031 Depreciation and amortization 37,297 39,359 Gain on dispositions of real estate investments – (62) FFO (as defined by NAREIT) attributable to stockholders 5,940 49,481 Merger, transaction and other costs(1) 6,279 133 Settlement costs(2) 15,084 – Loss on extinguishment of debt 404 342 Core FFO attributable to stockholders 27,707 49,956 Non-cash equity-based compensation 2,870 3,358 Non-cash portion of interest expense 2,083 2,336 Amortization related to above- and below-market lease intangibles and right-of-use assets, net 1,297 273 Straight-line rent (1,786) (2,342) Straight-line rent (rent deferral agreement)(3) – (39) Unrealized income on undesignated foreign currency advances and other hedge ineffectiveness – (2,440) Eliminate unrealized gains on foreign currency transactions(4) 1,631 (6,321) Amortization of mortgage discounts 237 238 Expenses attributable to 2023 proxy contest and related litigation(5) 7,371 – Adjusted funds from operations (AFFO) attributable to stockholders $ 41,410 $ 45,019 Basic weighted-average shares outstanding 104,149 103,649 Diluted weighted-average shares outstanding 104,149 103,649 Net (loss) income per share attributable to common stockholders $ (0.30) $ (0.06) FFO per share $ 0.06 $ 0.48 Core FFO per share $ 0.27 $ 0.48 AFFO per share $ 0.40 $ 0.43 Dividends declared $ 41,674 $ 41,606 1. For the three months ended June 30, 2023, these costs primarily consist of advisory, legal and other professional costs that were directly related to the proposed merger. 2. In the three months ended June 30, 2023, we recognized these settlement costs which include one-half of the reasonable, documented, out-of-pocket expenses (including legal fees) incurred by the Blackwells/Related Parties in connection with the proxy contest and related litigation as well as expense for Common Stock issued/to be issued to Blackwells/Related Parties, as required under the cooperation agreement with Blackwells/Related Parties. 3. Represents amounts related to deferred rent pursuant to lease negotiations which qualify for FASB relief for which rent was deferred but not reduced. These amounts are included in the straight-line rent receivable on our balance sheet but are considered to be earned revenue attributed to the current period for rent that was deferred, for purposes of AFFO, as they are expected to be collected. Accordingly, when the deferred amounts are collected, the amounts reduce AFFO. 4. For AFFO purposes, we add back unrealized (gain) loss. For the three months ended June 30, 2023, the loss on derivative instruments was $0.8 million, which consisted of unrealized losses of $1.6 million and realized gains of $0.8 million. For the three months ended June 30, 2022, the gain on derivative instruments was $7.8 million, which consisted of unrealized gains of $6.3 million and realized gains of $1.5 million. 5. Amounts relate to general and administrative expenses incurred for the Company’s 2023 proxy contest and related Blackwells/Related Parties litigation. The Company does not consider these expenses to be part of its normal operating performance and has, accordingly, increased its AFFO for this amount. |