Global Net Lease, Inc.
Supplemental Information
Quarter ended September 30, 2015 (unaudited)
| Global Net Lease, Inc. |
| Supplemental Information |
| Quarter ended September 30, 2015 (unaudited) |
Table of Contents
| Item | | Page |
| Non-GAAP Definitions | | 3 |
| Key Metrics | | 7 |
| Consolidated Balance Sheets | | 8 |
| Consolidated Statements of Income | | 9 |
| Non-GAAP Measures | | 10 |
| Debt Overview | | 12 |
| Investment Activity | | 13 |
| Top Ten Tenants | | 14 |
| Diversification by Property Type | | 15 |
| Diversification by Tenant Industry | | 16 |
| Diversification by Geography | | 17 |
| Lease Expirations | | 18 |
Forward-looking Statements:
This supplemental package includes “forward looking statements”. Forward-looking statements may be identified by the use of words such as “believes,” “expects,” “may,” “will,” “should,” “seeks,” “approximately,” “intends,” “plans,” “pro forma,” “estimates,” “contemplates,” “aims,” “continues,” “would” or “anticipates” or the negative of these words and phrases or similar words or phrases. The following factors, among others, could cause actual results and future events to differ materially from those set forth or contemplated in the forward-looking statements: the factors included in (i) the Annual Report on Form 10-K for the year ended December 31, 2014 of Global Net Lease, Inc. (the “Company”), including those set forth under the headings “Risk Factors,” “Management’s Discussion and Analysis of Financial Condition and Results of Operations,” and “Business,” and (ii) in future periodic reports filed by the Company under the Securities Exchange Act of 1934, as amended. While forward-looking statements reflect the Company’s good faith beliefs, they are not guarantees of future performance. The Company disclaims any obligation to publicly update or revise any forward-looking statement to reflect changes in underlying assumptions or factors, new information, data or methods, future events or other changes after the date of this press release, except as required by applicable law. For a further discussion of these and other factors that could impact the Company’s future results, performance or transactions, see the section entitled “Risk Factors” in the Annual Report on Form 10-K for the year ended December 31, 2014, and other risks described in documents subsequently filed by the Company from time to time with the Securities and Exchange Commission. Prospective investors should not place undue reliance on any forward-looking statements, which are based only on information currently available to the Company (or to third parties making the forward-looking statements).
| Global Net Lease, Inc. |
| Supplemental Information |
| Quarter ended September 30, 2015 (unaudited) |
| Non-GAAP Definitions |
| |
| This section includes non-GAAP financial measures, including Funds from Operations, Core Funds from Operations, Adjusted Funds from Operations, Adjusted Earnings Before Interest, Taxes, Depreciation and Amortization, Net Operating Income, and Cash Net Operating Income. A description of these non-GAAP measures and reconciliations to the most directly comparable GAAP measure, which is net income, is provided below. |
| Funds from Operations, Core Funds from Operations and Adjusted Funds from Operations |
| |
| Due to certain unique operating characteristics of real estate companies, as discussed below, the National Association of Real Estate Investment Trusts ("NAREIT"), an industry trade group, has promulgated a measure known as funds from operations ("FFO"), which we believe to be an appropriate supplemental measure to reflect the operating performance of a REIT. The use of FFO is recommended by the REIT industry as a supplemental performance measure. FFO is not equivalent to net income or loss as determined under accounting principles generally accepted in the United States ("GAAP"). |
| |
| We define FFO, a non-GAAP measure, consistent with the standards established by the White Paper on FFO approved by the Board of Governors of NAREIT, as revised in February 2004 (the "White Paper"). The White Paper defines FFO as net income or loss computed in accordance with GAAP, excluding gains or losses from sales of property but including asset impairment writedowns, plus depreciation and amortization, and after adjustments for unconsolidated partnerships and joint ventures. Adjustments for unconsolidated partnerships and joint ventures are calculated to reflect FFO. Our FFO calculation complies with NAREIT's definition. |
| |
| The historical accounting convention used for real estate assets requires straight-line depreciation of buildings and improvements, and straight-line amortization of intangibles, which implies that the value of a real estate asset diminishes predictably over time, especially if not adequately maintained or repaired and renovated as required by relevant circumstances or as requested or required by lessees for operational purposes in order to maintain the value disclosed. We believe that, because real estate values historically rise and fall with market conditions, including inflation, interest rates, the business cycle, unemployment and consumer spending, presentations of operating results for a REIT using historical accounting for depreciation and certain other items may be less informative. Historical accounting for real estate involves the use of GAAP. Any other method of accounting for real estate such as the fair value method cannot be construed to be any more accurate or relevant than the comparable methodologies of real estate valuation found in GAAP. Nevertheless, we believe that the use of FFO, which excludes the impact of real estate related depreciation and amortization, among other things, provides a more complete understanding of our performance to investors and to management, and when compared year over year, reflects the impact on our operations from trends in occupancy rates, rental rates, operating costs, general and administrative expenses, and interest costs, which may not be immediately apparent from net income. However, FFO, core funds from operations ("Core FFO") and adjusted funds from operations (“AFFO”), as described below, should not be construed to be more relevant or accurate than the current GAAP methodology in calculating net income or in its applicability in evaluating our operating performance. The method utilized to evaluate the value and performance of real estate under GAAP should be construed as a more relevant measure of operational performance and considered more prominently than the non-GAAP FFO, Core FFO and AFFO measures and the adjustments to GAAP in calculating FFO, Core FFO and AFFO. Other REITs may not define FFO in accordance with the current NAREIT definition (as we do) or may interpret the current NAREIT definition differently than we do and/or calculate Core FFO and/or AFFO differently than we do. Consequently, our presentation of FFO, Core FFO and AFFO may not be comparable to other similarly titled measures presented by other REITs. |
| Global Net Lease, Inc. |
| Supplemental Information |
| Quarter ended September 30, 2015 (unaudited) |
Non-GAAP Definitions
| We consider FFO, Core FFO and AFFO useful indicators of our performance. Because FFO calculations exclude such factors as depreciation and amortization of real estate assets and gains or losses from sales of operating real estate assets (which can vary among owners of identical assets in similar conditions based on historical cost accounting and useful-life estimates), FFO facilitates comparisons of operating performance between periods and between other REITs in our peer group. |
| |
| Changes in the accounting and reporting promulgations under GAAP (for acquisition fees and expenses from a capitalization/depreciation model to an expensed-as-incurred model) that were put into effect in 2009 and other changes to GAAP accounting for real estate subsequent to the establishment of NAREIT's definition of FFO have prompted an increase in cash-settled expenses, specifically acquisition fees and expenses for all industries as items that are expensed under GAAP, that are typically accounted for as operating expenses. |
| |
| Core FFO is FFO, excluding acquisition and transaction related costs as well as certain other costs that are considered to be non-core, such as charges relating to the Listing Note and listing related fees. The purchase of properties, and the corresponding expenses associated with that process, is a key operational feature of our business plan to generate operational income and cash flows in order to make dividend payments to stockholders. In evaluating investments in real estate, we differentiate the costs to acquire the investment from the operations derived from the investment. By excluding expensed acquisition and transaction related costs as well as non-core costs, we believe Core FFO provides useful supplemental information that is comparable for each type of real estate investment and is consistent with management's analysis of the investing and operating performance of our properties. |
| |
| We exclude certain income or expense items from AFFO that we consider more reflective of investing activities, other non-cash income and expense items and the income and expense effects of other activities that are not a fundamental attribute of our business plan. These items include unrealized gains and losses, which may not ultimately be realized, such as gains or losses on contingent valuation rights, gains and losses on investments and early extinguishment of debt. We also exclude dividends on Class B Units as the related shares are assumed to have converted to common stock in our calculation of fully diluted weighted average shares of common stock. In addition, by excluding non-cash income and expense items such as amortization of above-market and below-market leases intangibles, amortization of deferred financing costs, straight-line rent and equity-based compensation from AFFO, we believe we provide useful information regarding income and expense items which have no cash impact and do not provide liquidity to the company or require capital resources of the company. By providing AFFO, we believe we are presenting useful information that assists investors and analysts to better assess the sustainability of our ongoing operating performance without the impacts of transactions that are not related to the ongoing profitability of our portfolio of properties. We also believe that AFFO is a recognized measure of sustainable operating performance by the REIT industry. Further, we believe AFFO is useful in comparing the sustainability of our operating performance with the sustainability of the operating performance of other real estate companies that are not making a significant number of acquisitions. Investors are cautioned that AFFO should only be used to assess the sustainability of our operating performance excluding these activities, as it excludes certain costs that have a negative effect on our operating performance during the periods in which these costs are incurred. |
| Global Net Lease, Inc. |
| Supplemental Information |
| Quarter ended September 30, 2015 (unaudited) |
Non-GAAP Definitions
| In calculating AFFO, we exclude certain expenses, which under GAAP are characterized as operating expenses in determining operating net income. These expenses are paid in cash by us, and therefore such funds will not be available to distribute to investors. All paid and accrued merger, acquisition and transaction related fees and certain other expenses negatively impact our operating performance during the period in which expenses are incurred or properties are acquired will also have negative effects on returns to investors, the ability to fund dividends or distributions in the future, and cash flows generated by us, unless earnings from operations or net sales proceeds from the disposition of other properties are generated to cover the purchase price of the property and certain other expenses. AFFO that excludes such costs and expenses would only be comparable to companies that did not have such activities. Further, under GAAP, certain contemplated non-cash fair value and other non-cash adjustments are considered operating non-cash adjustments to net income in determining cash flow from operating activities. In addition, we view fair value adjustments as items which are unrealized and may not ultimately be realized. We view both gains and losses from fair value adjustments as items which are not reflective of ongoing operations and are therefore typically adjusted for when assessing operating performance. Excluding income and expense items detailed above from our calculation of AFFO provides information consistent with management's analysis of the operating performance of the properties. Additionally, fair value adjustments, which are based on the impact of current market fluctuations and underlying assessments of general market conditions, but can also result from operational factors such as rental and occupancy rates, may not be directly related or attributable to our current operating performance. By excluding such changes that may reflect anticipated and unrealized gains or losses, we believe AFFO provides useful supplemental information. |
| |
| As a result, we believe that the use of FFO, Core FFO and AFFO, together with the required GAAP presentations, provide a more complete understanding of our performance relative to our peers and a more informed and appropriate basis on which to make decisions involving operating, financing, and investing activities. |
| Global Net Lease, Inc. |
| Supplemental Information |
| Quarter ended September 30, 2015 (unaudited) |
Non-GAAP Definitions
| Adjusted Earnings before Interest, Taxes, Depreciation and Amortization, Net Operating Income, Cash Net Operating Income and Adjusted Cash Net Operating Income. |
| |
| We believe that earnings before interest, taxes, depreciation and amortization adjusted for acquisition and transaction-related expenses, other non-cash items and including our pro-rata share from unconsolidated joint ventures ("Adjusted EBITDA") is an appropriate measure of our ability to incur and service debt. Adjusted EBITDA should not be considered as an alternative to cash flows from operating activities, as a measure of our liquidity or as an alternative to net income as an indicator of our operating activities. Other REITs may calculate Adjusted EBITDA differently and our calculation should not be compared to that of other REITs. |
| |
| Net operating income ("NOI") is a non-GAAP financial measure equal to net income (loss), the most directly comparable GAAP financial measure, less discontinued operations, interest, other income and income from preferred equity investments and investment securities, plus corporate general and administrative expense, acquisition and transaction-related expenses, depreciation and amortization, other non-cash expenses and interest expense. NOI is adjusted to include our pro rata share of NOI from unconsolidated joint ventures. We use NOI internally as a performance measure and believe NOI provides useful information to investors regarding our financial condition and results of operations because it reflects only those income and expense items that are incurred at the property level. Therefore, we believe NOI is a useful measure for evaluating the operating performance of our real estate assets and to make decisions about resource allocations. Further, we believe NOI is useful to investors as a performance measure because, when compared across periods, NOI reflects the impact on operations from trends in occupancy rates, rental rates, operating costs and acquisition activity on an unlevered basis, providing perspective not immediately apparent from net income. NOI excludes certain components from net income in order to provide results that are more closely related to a property's results of operations. For example, interest expense is not necessarily linked to the operating performance of a real estate asset and is often incurred at the corporate level as opposed to the property level. In addition, depreciation and amortization, because of historical cost accounting and useful life estimates, may distort operating performance at the property level. NOI presented by us may not be comparable to NOI reported by other REITs that define NOI differently. We believe that in order to facilitate a clear understanding of our operating results, NOI should be examined in conjunction with net income (loss) as presented in our consolidated financial statements. NOI should not be considered as an alternative to net income (loss) as an indication of our performance or to cash flows as a measure of our liquidity. |
| |
| Cash NOI is NOI presented on a cash basis, which is NOI after eliminating the effects of straight-lining of rent and the amortization of above and below market leases. |
| Global Net Lease, Inc. |
| Supplemental Information |
| Quarter ended September 30, 2015 (unaudited) |
| Key Metrics |
| As of and for the three months ended September 30, 2015 |
| Amounts in thousands, except per share data, ratios and percentages |
| Financial Results | |
| | | Rental income | $ 47,836 |
| | Net income attributable to stockholders | 5,432 |
| | | | Net income attributable to stockholders per diluted share | $ 0.03 |
| | | | Cash NOI | 43,294 |
| | Adjusted EBITDA | 39,981 |
| | AFFO | 31,162 |
| | | | AFFO per diluted share | 0.18 |
| | | | | |
| | Distributions declared per share - third quarter | 0.18 |
| | | | Dividend yield - annualized, based on quarter end share price of $9.20 | 7.7% |
| | | | Dividend payout ratio - third quarter | 97.3% |
| Balance Sheet and Capitalization | |
| | | | Equity market capitalization - based on quarter end share price of $9.20 | $ 1,554,217 |
| | | | Net debt | 1,213,502 |
| | | | Enterprise value | 2,767,719 |
| | | | | |
| | Total capitalization | 2,799,799 |
| | | | | |
| | Total consolidated debt | 1,244,784 |
| | Gross assets | 2,562,238 |
| | Liquidity | 36,680 |
| | | | | |
| | | | Common shares outstanding as of Sep 30, 2015 (thousands) | 168,937 |
| | | | Share price, end of quarter | $ 9.20 |
| | | | | |
| | | | Net debt to enterprise value | 43.3% |
| | | | Net debt to adjusted EBITDA | 7.6x |
| | | | | |
| | | | Weighted-average interest rate cost | 2.5% |
| | | | Weighted-average debt maturity (years)[1] | 3.3 |
| Real Estate Portfolio | |
| | | | Number of properties | 329 |
| | | | Number of tenants | 86 |
| | | | | |
| | | | Square footage (millions) | 18.7 |
| | | | Occupancy | 100.0% |
| | | | Weighted-average remaining lease term (years) | 11.5 |
| | | | | |
| | | | Acqusitions - third quarter | $ 207,824 |
Footnotes:
[1] Credit facility has an initial maturity date of July 25, 2016 with two one-year extensions, subject to certain conditions. Weighted-average debt maturity assumes that the extensions are exercised.
| Global Net Lease, Inc. |
| Supplemental Information |
| Quarter ended September 30, 2015 (unaudited) |
| Consolidated Balance Sheets |
| Amounts in thousands |
| | | Sep 30, 2015 | | | Dec 31, 2014 | |
| Assets | | | | | | | | |
| Real estate investments, at cost: | | | | | | | | |
| Land | | $ | 344,767 | | | $ | 326,696 | |
| Buildings, fixtures and improvements | | | 1,702,345 | | | | 1,519,558 | |
| Construction in progress | | | 28 | | | | 9,706 | |
| Acquired intangible lease assets | | | 524,264 | | | | 484,079 | |
| Total real estate investments, at cost | | | 2,571,404 | | | | 2,340,039 | |
| Less accumulated depreciation and amortization | | | (109,922 | ) | | | (42,568 | ) |
| Total real estate investments, net | | | 2,461,482 | | | | 2,297,471 | |
| Cash and cash equivalents | | | 32,080 | | | | 64,684 | |
| Restricted cash | | | 4,076 | | | | 6,104 | |
| Derivatives, at fair value | | | 5,451 | | | | 13,638 | |
| Investment securities, at fair value | | | - | | | | 490 | |
| Prepaid expenses and other assets | | | 39,016 | | | | 24,873 | |
| Due from affiliates | | | 53 | | | | 500 | |
| Deferred tax assets | | | 2,905 | | | | 2,102 | |
| Goodwill and other intangible assets, net | | | 3,390 | | | | 3,665 | |
| Deferred financing costs, net | | | 13,785 | | | | 15,270 | |
| Total assets | | $ | 2,562,238 | | | $ | 2,428,797 | |
| | | | | | | | | |
| Liabilities and Equity | | | | | | | | |
| Mortgage notes payable | | $ | 509,427 | | | $ | 281,186 | |
| Mortgage premium, net | | | 798 | | | | 1,165 | |
| Credit facility | | | 735,357 | | | | 659,268 | |
| Below-market lease liabilities, net | | | 28,878 | | | | 21,676 | |
| Derivatives, at fair value | | | 7,256 | | | | 6,115 | |
| Listing note, at fair value | | | 3,380 | | | | - | |
| Due to affiliates | | | 943 | | | | 400 | |
| Accounts payable and accrued expenses | | | 22,698 | | | | 19,357 | |
| Deferred rent and other liabilities | | | 12,890 | | | | 12,252 | |
| Current taxes payable | | | 3,166 | | | | - | |
| Dividends payable | | | 249 | | | | 10,709 | |
| Total liabilities | | | 1,325,042 | | | | 1,012,128 | |
| | | | | | | | | |
| Common stock | | | 1,692 | | | | 1,782 | |
| Additional paid in capital | | | 1,479,879 | | | | 1,575,592 | |
| Accumulated other comprehensive (loss) income | | | (4,277 | ) | | | (5,589 | ) |
| Accumulated earnings (deficit) | | | (255,460 | ) | | | (155,116 | ) |
| Total shareholders' equity | | | 1,221,834 | | | | 1,416,669 | |
| Non-controlling interests | | | 15,362 | | | | - | |
| Total equity | | | 1,237,196 | | | | 1,416,669 | |
| Total liabilities and equity | | $ | 2,562,238 | | | $ | 2,428,797 | |
| Global Net Lease, Inc. |
| Supplemental Information |
| Quarter ended September 30, 2015 (unaudited) |
| Consolidated Statements of Income |
| Amounts in thousands, except per share data and ratios |
| | | Three Months Ended | | | YTD | |
| | | Sep 30, 2015 | | | Jun 30, 2015 | | | Mar 31, 2015 | | | Sep 30, 2015 | |
| | | | | | | | | | | | | |
| Revenues | | | | | | | | | | | | | | | | |
| Rental income | | $ | 47,836 | | | $ | 47,234 | | | $ | 47,432 | | | $ | 142,502 | |
| Operating expense reimbursement | | | 2,416 | | | | 1,834 | | | | 2,537 | | | | 6,787 | |
| Total revenues | | | 50,252 | | | | 49,068 | | | | 49,969 | | | | 149,289 | |
| | | | | | | | | | | | | | | | | |
| Expenses: | | | | | | | | | | | | | | | | |
| Property operating | | | 3,355 | | | | 3,377 | | | | 4,059 | | | | 10,791 | |
| Operating fees to affiliates | | | 4,902 | | | | 4,065 | | | | 1,244 | | | | 10,211 | |
| Acquisition and transaction related | | | 4,680 | | | | 212 | | | | 1,085 | | | | 5,977 | |
| Listing Fees | | | - | | | | 18,503 | | | | - | | | | 18,503 | |
| Vesting of class B units | | | - | | | | 14,480 | | | | - | | | | 14,480 | |
| Change in fair value of listing note | | | (1,050 | ) | | | 4,430 | | | | - | | | | 3,380 | |
| General and administrative | | | 2,014 | | | | 1,885 | | | | 1,739 | | | | 5,638 | |
| Equity based compension | | | 1,917 | | | | 510 | | | | 8 | | | | 2,435 | |
| Depreciation and amortization | | | 22,949 | | | | 22,089 | | | | 21,114 | | | | 66,152 | |
| Total expenses | | | 38,767 | | | | 69,551 | | | | 29,249 | | | | 137,567 | |
| Operating income (loss) | | | 11,485 | | | | (20,483 | ) | | | 20,720 | | | | 11,722 | |
| Other income (expense): | | | | | | | | | | | | | | | | |
| Interest expense | | | (9,041 | ) | | | (7,947 | ) | | | (7,811 | ) | | | (24,799 | ) |
| Income from investments | | | 8 | | | | - | | | | 7 | | | | 15 | |
| Losses on foreign currency | | | - | | | | - | | | | - | | | | - | |
| Realized losses on investment securities | | | (66 | ) | | | - | | | | - | | | | (66 | ) |
| Gains (losses) on derivative instruments | | | 2,310 | | | | (3,736 | ) | | | 4,211 | | | | 2,785 | |
| Gains (losses) hedging instrument deemed ineffective | | | 1,505 | | | | (508 | ) | | | 1,448 | | | | 2,445 | |
| Unrealized gains (losses) on non-functional foreign currency advances not designated as net investment hedges | | | - | | | | (11,842 | ) | | | 8,907 | | | | (2,935 | ) |
| Other (expense) income | | | (10 | ) | | | 12 | | | | 13 | | | | 15 | |
| Total other (expense) income, net | | | (5,294 | ) | | | (24,021 | ) | | | 6,775 | | | | (22,540 | ) |
| Net income (loss) before income taxes | | | 6,191 | | | | (44,504 | ) | | | 27,495 | | | | (10,818 | ) |
| Income taxes (expense) benefit | | | (703 | ) | | | (1,303 | ) | | | (1,640 | ) | | | (3,646 | ) |
| Net income (loss) | | | 5,488 | | | | (45,807 | ) | | | 25,855 | | | | (14,464 | ) |
| Non-controlling interest | | | (56 | ) | | | 143 | | | | - | | | | 87 | |
| Net income (loss) attributable to stockholders | | $ | 5,432 | | | $ | (45,664 | ) | | $ | 25,855 | | | $ | (14,377 | ) |
| | | | | | | | | | | | | | | | | |
| Basic and Diluted Earnings Per Share: | | | | | | | | | | | | | | | | |
| Basic and diluted net income (loss) per share attributable to stockholders | $ | 0.03 | | | $ | (0.25 | ) | | $ | 0.14 | | | $ | (0.08 | ) |
| Basic and diluted weighted average shares outstanding (thousands) | | | 168,948 | | | | 180,380 | | | | 179,156 | | | | 176,124 | |
| Global Net Lease, Inc. |
| Supplemental Information |
| Quarter ended September 30, 2015 (unaudited) |
| Non-GAAP Measures |
| Amounts in thousands, except per share data and ratios |
| | | Three Months Ended | | | YTD | |
| | | Sep 30, 2015 | | | Jun 30, 2015 | | | Mar 31, 2015 | | | Sep 30, 2015 | |
| | | | | | | | | | | | | |
| EBITDA: | | | | | | | | | | | | | | | | |
| Net income (loss) | | $ | 5,488 | | | $ | (45,807 | ) | | $ | 25,855 | | | $ | (14,464 | ) |
| Listing Fees | | | - | | | | 18,503 | | | | - | | | | 18,503 | |
| Vesting of class B units | | | - | | | | 14,480 | | | | - | | | | 14,480 | |
| Change in fair value of listing note | | | (1,050 | ) | | | 4,430 | | | | - | | | | 3,380 | |
| Equity based compension | | | 1,917 | | | | 510 | | | | 8 | | | | 2,435 | |
| Acquisition and transaction related | | | 4,680 | | | | 212 | | | | 1,085 | | | | 5,977 | |
| Depreciation and amortization | | | 22,949 | | | | 22,089 | | | | 21,114 | | | | 66,152 | |
| Interest expense | | | 9,041 | | | | 7,947 | | | | 7,811 | | | | 24,799 | |
| Income tax expense | | | 703 | | | | 1,303 | | | | 1,640 | | | | 3,646 | |
| EBITDA | | $ | 43,728 | | | $ | 23,667 | | | $ | 57,513 | | | $ | 124,908 | |
| | | | | | | | | | | | | | | | | |
| Adjusted EBITDA: | | | | | | | | | | | | | | | | |
| Income from investments | | $ | (8 | ) | | $ | - | | | $ | (7 | ) | | $ | (15 | ) |
| Gain (loss) on foreign currency | | | - | | | | - | | | | - | | | | - | |
| Realized gain (loss) on investment securities | | | 66 | | | | - | | | | - | | | | 66 | |
| Gain (loss) on derivative instruments | | | (2,310 | ) | | | 3,736 | | | | (4,211 | ) | | | (2,785 | ) |
| Gains (losses) hedging instrument deemed ineffective | | | (1,505 | ) | | | 508 | | | | (1,448 | ) | | | (2,445 | ) |
| Unrealized gains (losses) on non-functional foreign currency advances not designated as net investment hedges | | | - | | | | 11,842 | | | | (8,907 | ) | | | 2,935 | |
| Other (expense) income | | | 10 | | | | (12 | ) | | | (13 | ) | | | (15 | ) |
| Adjusted EBITDA | | $ | 39,981 | | | $ | 39,741 | | | $ | 42,927 | | | $ | 122,649 | |
| | | | | | | | | | | | | | | | | |
| Net Operating Income (NOI): | | | | | | | | | | | | | | | | |
| Operating fees to affiliates | | $ | 4,902 | | | $ | 4,065 | | | $ | 1,244 | | | $ | 10,211 | |
| General and administrative | | | 2,014 | | | | 1,885 | | | | 1,739 | | | | 5,638 | |
| NOI | | $ | 46,897 | | | $ | 45,691 | | | $ | 45,910 | | | $ | 138,498 | |
| | | | | | | | | | | | | | | | | |
| Cash Net Operating Income (Cash NOI): | | | | | | | | | | | | | | | | |
| Amortization of above/below market lease assets and liabilities | | | 94 | | | | 102 | | | | 109 | | | | 305 | |
| Straight-line rent | | | (3,697 | ) | | | (3,437 | ) | | | (4,439 | ) | | | (11,573 | ) |
| Cash NOI | | | 43,294 | | | | 42,356 | | | | 41,580 | | | | 127,230 | |
| Global Net Lease, Inc. |
| Supplemental Information |
| Quarter ended September 30, 2015 (unaudited) |
| Non-GAAP Measures |
| Amounts in thousands, except per share data and ratios |
| | | Three Months Ended | | | YTD | |
| | | Sep 30, 2015 | | | Jun 30, 2015 | | | Mar 31, 2015 | | | Sep 30, 2015 | |
| | | | | | | | | | | | | |
| Funds from operations (FFO): | | | | | | | | | | | | | | | | |
| Net income (loss) attributable to stockholders in accordance with GAAP | | $ | 5,432 | | | $ | (45,664 | ) | | $ | 25,855 | | | $ | (14,377 | ) |
| Depreciation and amortization | | | 22,949 | | | | 22,089 | | | | 21,114 | | | | 66,152 | |
| FFO (as defined by NAREIT) | | $ | 28,381 | | | $ | (23,575 | ) | | $ | 46,969 | | | $ | 51,775 | |
| Acquisition fees and expenses | | | 4,680 | | | | 212 | | | | 1,085 | | | | 5,977 | |
| Listing Fees | | | - | | | | 18,503 | | | | - | | | | 18,503 | |
| Vesting of class B units | | | - | | | | 14,480 | | | | - | | | | 14,480 | |
| Change in fair value of listing note | | | (1,050 | ) | | | 4,430 | | | | - | | | | 3,380 | |
| Core FFO | | $ | 32,011 | | | $ | 14,050 | | | $ | 48,054 | | | $ | 94,115 | |
| Non-cash equity based compensation | | | 1,917 | | | | 510 | | | | 8 | | | | 2,435 | |
| Non-cash portion of interest expense | | | 2,306 | | | | 1,994 | | | | 1,944 | | | | 6,244 | |
| Realized gain (loss) on investment securities | | | 66 | | | | - | | | | - | | | | 66 | |
| Nonrecurring general and administrative expenses[1] | | | 188 | | | | - | | | | - | | | | 188 | |
| Distributions on Class B units | | | (94 | ) | | | 309 | | | | 124 | | | | 339 | |
| Amortization of above-market lease assets and liabilities, net | | | 94 | | | | 101 | | | | 109 | | | | 304 | |
| Straight-line rent | | | (3,697 | ) | | | (3,437 | ) | | | (4,439 | ) | | | (11,573 | ) |
| Gains (losses) on derivative instruments[2] | | | - | | | | - | | | | - | | | | - | |
| (Gains) losses on hedging instruments deemed ineffective | | | (1,505 | ) | | | 508 | | | | (1,448 | ) | | | (2,445 | ) |
| Unrealized gains (losses) on non-functional foreign currency advances not designated as net investment hedges | | | - | | | | 11,842 | | | | (8,907 | ) | | | 2,935 | |
| Accretion of discount/amortization of premiums | | | (123 | ) | | | (202 | ) | | | (42 | ) | | | (367 | ) |
| Adjusted funds from operations (AFFO) | | $ | 31,163 | | | $ | 25,675 | | | $ | 35,403 | | | $ | 92,241 | |
| | | | | | | | | | | | | | | | | |
| Fully diluted shares outstanding[3] (thousands) | | | 170,934 | | | | 182,190 | | | | 179,156 | | | | | |
| | | | | | | | | | | | | | | | | |
| FFO per diluted share | | $ | 0.17 | | | $ | (0.13 | ) | | $ | 0.26 | | | | | |
| | | | | | | | | | | | | | | | | |
| Core FFO per diluted share | | | 0.19 | | | | 0.08 | | | | 0.27 | | | | | |
| | | | | | | | | | | | | | | | | |
| AFFO per diluted share | | | 0.18 | | | | 0.14 | | | | 0.20 | | | | | |
| | | | | | | | | | | | | | | | | |
| Dividends declared | | $ | 30,308 | | | $ | 24,294 | | | $ | 31,364 | | | | | |
Footnotes:
| [1] Represents our estimate of non-recurring internal audit service fees. |
| |
| [2] During the third quarter 2015, we no longer adjust AFFO for (gains) losses on derivative instruments. As a result of this change, we revised the prior period amounts in our reconciliation of AFFO. AFFO for three months ended June 30, 2015 and March 31, 2015 were previously reported as $29,411 and $31,192, respectively, when including the (gains) losses on derivative instruments of $3,736 and $(4,211) for each of these respective periods. |
| |
| [3] Fully diluted shares outstanding represents common shares outstanding and all participating common share equivalents (OP units and unvested restricted stock units) as of each respective reporting period. |
| Global Net Lease, Inc. |
| Supplemental Information |
| Quarter ended September 30, 2015 (unaudited) |
| Debt Overview |
| As of September 30, 2015 |
| Amounts in thousands, except per share data, ratios and percentages |
| Year of Maturity | | Number of Properties | | | Weighted-Average Debt Maturity (Years) | | | Weighted-Average Interest Rate[2] | | | Total Outstanding Balance | | | Percent | |
| Non-Recourse Debt | | | | | | | | | | | | | | | | | | | | |
| Remaining 2015 | | | - | | | | - | | | | - | | | $ | - | | | | | |
| 2016 | | | - | | | | - | | | | - | | | | - | | | | | |
| 2017 | | | 19 | | | | 1.7 | | | | 6.24 | % | | | 23,322 | | | | | |
| 2018 | | | 8 | | | | 2.9 | | | | 2.83 | % | | | 84,264 | | | | | |
| 2019 | | | 10 | | | | 3.8 | | | | 2.63 | % | | | 195,306 | | | | | |
| 2020 | | | 34 | | | | 4.9 | | | | 3.03 | % | | | 188,479 | | | | | |
| 2021 | | | 1 | | | | 5.8 | | | | 5.32 | % | | | 18,056 | | | | | |
| Total Non-Recourse Debt | | | 72 | | | | 4.0 | | | | 3.07 | % | | $ | 509,427 | | | | 41 | % |
| | | | | | | | | | | | | | | | | | | | | |
| Recourse Debt | | | | | | | | | | | | | | | | | | | | |
| Senior Unsecured Credit Facility[1] | | | | | | | 2.8 | | | | 2.10 | % | | $ | 735,357 | | | | | |
| Total Recourse Debt | | | | | | | 2.8 | | | | 2.10 | % | | $ | 735,357 | | | | 59 | % |
| | | | | | | | | | | | | | | | | | | | | |
| Total Debt | | | | | | | 3.3 | | | | 2.50 | % | | $ | 1,244,784 | | | | 100 | % |
| | | | | | | | | | | | | | | | | | | | | |
| Total Debt by Currency | | | | | | | | | | | | | | Percent | | | | | |
| USD | | | | | | | | | | | | | | | 21 | % | | | | |
| EUR | | | | | | | | | | | | | | | 41 | % | | | | |
| GBP | | | | | | | | | | | | | | | 38 | % | | | | |
| Total | | | | | | | | | | | | | | | 100 | % | | | | |
Footnotes:
| [1] Credit facility has an initial maturity date of July 25, 2016 with two one-year extensions, subject to certain conditions. Weighted average debt maturity assumes that the extensions are exercised. |
| |
| [2] As of September 30, 2015, the Company’s total combined debt had a weighted average interest rate cost of 2.5%, of which 67.8% was fixed rate or swapped to a fixed rate and 32.2% at floating rate. |
| Global Net Lease, Inc. |
| Supplemental Information |
| Quarter ended September 30, 2015 (unaudited) |
| Investment Activity |
| As of September 30, 2015 |
| Amounts in thousands, except per share data, ratios and percentages |
2015 Acquisitions
| Property | | Property Location(s) | | Purchase
Price[1] | | | Closing Date | | Property
Type(s) | | Gross Square Footage | |
| 1Q15 | | | | | | | | | | | | |
| C&J Energy | | 3990 Rogerdale, Houston, TX | | $ | 34,320 | | | Mar 05, 2015 | | Office | | | 125 | |
| FedEx Ground Package System, Inc. | | 603 West b1550 South, Salina, UT | | | 4,335 | | | Mar 12, 2015 | | Distribution | | | 12 | |
| 1Q15 Total | | | | $ | 38,655 | | | | | | | | 137 | |
| | | | | | | | | | | | | | | |
| 2Q15 | | | | | | | | | | | | | | |
| FedEx Ground Package System, Inc. | | 3815 Airport Road, Pierre, SD | | | 4,500 | | | Apr 09, 2015 | | Distribution | | | 26 | |
| Fresenius | | 520 Physicians Lane, Sumter, SC | | | 4,029 | | | May 01, 2015 | | Office | | | 10 | |
| 2Q15 Total | | | | $ | 8,529 | | | | | | | | 36 | |
| | | | | | | | | | | | | | | |
| 3Q15 | | | | | | | | | | | | | | |
| Fresenius | | 3801 Woodlake Dr, Hephzibah, GA | | | 2,778 | | | Jul 15, 2015 | | Office | | | 6 | |
| Crowne Group | | 24358 Groesbeck Highway, Warren, MI | | | 4,361 | | | Aug 03, 2015 | | Industrial | | | 92 | |
| Crowne Group | | 576 Beck Street, Jonesville, MI | | | 4,104 | | | Aug 03, 2015 | | Industrial | | | 89 | |
| Crowne Group | | 18401 Malyn Blvd, Fraser, MI | | | 5,223 | | | Aug 03, 2015 | | Industrial | | | 115 | |
| Crowne Group | | 3108 Highway 76 East, Marion, SC | | | 10,263 | | | Aug 31, 2015 | | Industrial | | | 225 | |
| Crowne Group | | 4004 North US 421, Madison, IN | | | 10,587 | | | Aug 31, 2015 | | Industrial | | | 232 | |
| Crowne Group | | 101 East Industrial Blvd, Logansport, IN | | | 8,462 | | | Aug 31, 2015 | | Industrial | | | 186 | |
| JIT Steel | | 610 Manufacturers Way, Chattanooga, TN | | | 3,976 | | | Sep 08, 2015 | | Industrial | | | 76 | |
| JIT Steel | | 530 Manufacturers Way, Chattanooga, TN | | | 2,635 | | | Sep 08, 2015 | | Industrial | | | 51 | |
| Mapes & Sprowl | | 1100 East Devon Avenue, Elk Grove Village, IL | 6,194 | | | Sep 08, 2015 | | Industrial | | | 61 | |
| Beacon Health | | 3355 Douglas Rd, South Bend, IN | | | 10,890 | | | Sep 16, 2015 | | Office | | | 50 | |
| National Oilwell | | 4612 County Road 430, Pleasanton, TX | | | 4,000 | | | Sep 17, 2015 | | Industrial | | | 16 | |
| Office Depot | | Columbusweg 33, Venlo, The Netherlands | | | 24,019 | | | Sep 22, 2015 | | Office | | | 206 | |
| Finnair | | Helsinki Airport, Helsinki, Finland | | | 88,490 | | | Sep 23, 2015 | | Industrial | | | 656 | |
| Hannibal | | 6501 Bimgle Rd, Houston, TX | | | 14,389 | | | Sep 24, 2015 | | Industrial | | | 109 | |
| FedEx | | 1730 Energy Drive, Mankato, MN | | | 7,452 | | | Sep 25, 2015 | | Industrial | | | 91 | |
| 3Q15 Total | | | | $ | 207,823 | | | | | | | | 2,261 | |
| Year-to-Date Total Acqusitions | | | | $ | 255,007 | | | | | | | | 2,434 | |
Footnotes:
[1] Purchase price, excluding acquisition related costs, based on the exchange rate at the date of purchase, where applicable.
| Global Net Lease, Inc. |
| Supplemental Information |
| Quarter ended September 30, 2015 (unaudited) |
| Top Ten Tenants |
| As of September 30, 2015 |
| Amounts in thousands, except per share data, ratios and percentages |
| Tenant / Lease Guarantor | | Property Type | | Tenant Industry | | GAAP NOI[1] | | | Percent | |
| RWE AG | | Office | | Utilities | | $ | 10,717 | | | | 5 | % |
| FedEx Ground Package System, Inc. | | Distribution | | Freight | | | 9,620 | | | | 5 | % |
| Family Dollar | | Retail | | Discount Retail | | | 8,825 | | | | 4 | % |
| Finnair | | Industrial | | Aerospace | | | 8,810 | | | | 4 | % |
| Government Services Administration (GSA) | | Office | | Government | | | 8,684 | | | | 4 | % |
| Quest Diagnostics, Inc. | | Office | | Healthcare | | | 6,308 | | | | 3 | % |
| Crown Crest | | Distribution | | Retail | | | 6,034 | | | | 3 | % |
| Tokmanni | | Office | | Discount Retail | | | 5,791 | | | | 3 | % |
| Fujitsu Office Properties | | Office | | Technology | | | 4,896 | | | | 2 | % |
| Trinity Health | | Office | | Healthcare | | | 4,927 | | | | 2 | % |
| Subtotal | | | | | | $ | 74,612 | | | | 35 | % |
| | | | | | | | | | | | | |
| Remaining portfolio | | | | | | | 127,673 | | | | 65 | % |
| | | | | | | | | | | | | |
| Total Portfolio | | | | | | $ | 202,285 | | | | 100 | % |
Footnotes:
[1] GAAP NOI is on an annualized basis and is based on foreign currency exchange rates as of September 30, 2015.
| Global Net Lease, Inc. |
| Supplemental Information |
| Quarter ended September 30, 2015 (unaudited) |
| Diversification by Property Type |
| As of September 30, 2015 |
| Amounts in thousands, except per share data, ratios and percentages |
| | | Total Portfolio | | | | Unencumbered Portfolio | |
| Property Type | | GAAP NOI[1] | | | GAAP NOI Percent | | | Square Footage | | | Sq. ft. Percent | | | | GAAP NOI[1] | | | GAAP NOI Percent | | | Square Footage | | | Sq. ft. Percent | |
| Office | | $ | 107,588 | | | | 53 | % | | | 7,075 | | | | 38 | % | | | $ | 55,553 | | | | 48 | % | | | 3,812 | | | | 31 | % |
| Industrial | | | 39,183 | | | | 20 | % | | | 5,004 | | | | 27 | % | | | | 26,819 | | | | 23 | % | | | 3,762 | | | | 31 | % |
| Retail | | | 30,655 | | | | 15 | % | | | 2,920 | | | | 16 | % | | | | 15,887 | | | | 14 | % | | | 1,796 | | | | 16 | % |
| Distribution | | | 22,520 | | | | 11 | % | | | 3,683 | | | | 19 | % | | | | 15,476 | | | | 13 | % | | | 2,702 | | | | 22 | % |
| Other | | | 2,339 | | | | 1 | % | | | 58 | | | | 0 | % | | | | 2,339 | | | | 2 | % | | | 57 | | | | 0 | % |
| Total | | $ | 202,285 | | | | 100 | % | | | 18,740 | | | | 100 | % | | | $ | 116,074 | | | | 100 | % | | | 12,129 | | | | 100 | % |
Footnotes:
[1] GAAP NOI is on an annualized basis and is based on foreign currency exchange rates as of September 30, 2015.
| Global Net Lease, Inc. |
| Supplemental Information |
| Quarter ended September 30, 2015 (unaudited) |
| Diversification by Tenant Industry |
| As of September 30, 2015 |
| Amounts in thousands, except per share data, ratios and percentages |
| | | Total Portfolio | | | | Unencumbered Portfolio | |
| Industry Type | | GAAP NOI[1] | | | GAAP NOI Percent | | | Square Footage | | | Sq. ft. Percent | | | | GAAP NOI[1] | | | GAAP NOI Percent | | | Square Footage | | | Sq. ft.
Percent | |
| Discount Retail | | $ | 18,422 | | | | 9 | % | | | 2,032 | | | | 11 | % | | | $ | 12,630 | | | | 11 | % | | | 1,231 | | | | 10 | % |
| Technology | | | 16,632 | | | | 8 | % | | | 892 | | | | 5 | % | | | | 5,517 | | | | 5 | % | | | 253 | | | | 2 | % |
| Financial Services | | | 16,410 | | | | 8 | % | | | 1,014 | | | | 5 | % | | | | 5,136 | | | | 4 | % | | | 559 | | | | 5 | % |
| Aerospace | | | 14,587 | | | | 7 | % | | | 1,258 | | | | 7 | % | | | | 5,777 | | | | 5 | % | | | 602 | | | | 5 | % |
| Energy | | | 14,097 | | | | 7 | % | | | 1,043 | | | | 6 | % | | | | 14,097 | | | | 12 | % | | | 1,043 | | | | 9 | % |
| Utilities | | | 12,655 | | | | 6 | % | | | 673 | | | | 4 | % | | | | - | | | | - | | | | - | | | | - | |
| Healthcare | | | 12,566 | | | | 6 | % | | | 664 | | | | 4 | % | | | | 6,258 | | | | 5 | % | | | 440 | | | | 4 | % |
| Freight | | | 11,087 | | | | 6 | % | | | 1,164 | | | | 6 | % | | | | 11,087 | | | | 10 | % | | | 1,164 | | | | 10 | % |
| Retail | | | 10,349 | | | | 5 | % | | | 1,442 | | | | 8 | % | | | | - | | | | - | | | | - | | | | - | |
| Pharmaceuticals | | | 9,789 | | | | 5 | % | | | 390 | | | | 2 | % | | | | 9,789 | | | | 8 | % | | | 390 | | | | 3 | % |
| Telecommunications | | | 8,928 | | | | 4 | % | | | 648 | | | | 3 | % | | | | 6,707 | | | | 6 | % | | | 535 | | | | 4 | % |
| Government | | | 8,684 | | | | 4 | % | | | 333 | | | | 2 | % | | | | 8,684 | | | | 7 | % | | | 333 | | | | 3 | % |
| Auto Manufacturer | | | 3,827 | | | | 2 | % | | | 939 | | | | 5 | % | | | | 3,827 | | | | 3 | % | | | 939 | | | | 8 | % |
| Specialty Retail | | | 3,473 | | | | 2 | % | | | 280 | | | | 1 | % | | | | - | | | | - | | | | - | | | | - | |
| Automotive Parts Supplier | | | 3,444 | | | | 2 | % | | | 411 | | | | 2 | % | | | | 1,311 | | | | 1 | % | | | 91 | | | | 1 | % |
| Restaurant - Quick Service | | | 3,424 | | | | 2 | % | | | 74 | | | | 0 | % | | | | - | | | | - | | | | - | | | | - | |
| Home Decor | | | 3,256 | | | | 2 | % | | | 565 | | | | 3 | % | | | | 3,256 | | | | 3 | % | | | 565 | | | | 4 | % |
| Metal Processing | | | 2,862 | | | | 1 | % | | | 448 | | | | 2 | % | | | | 2,862 | | | | 3 | % | | | 448 | | | | 4 | % |
| Auto Manufacturing | | | 2,729 | | | | 1 | % | | | 1,001 | | | | 5 | % | | | | 2,729 | | | | 2 | % | | | 1,001 | | | | 8 | % |
| Home Maintenance | | | 2,513 | | | | 1 | % | | | 231 | | | | 1 | % | | | | - | | | | - | | | | - | | | | - | |
| Foot Apparel | | | 2,141 | | | | 1 | % | | | 589 | | | | 3 | % | | | | 2,141 | | | | 2 | % | | | 589 | | | | 5 | % |
| Metal Fabrication | | | 2,120 | | | | 1 | % | | | 297 | | | | 2 | % | | | | 2,120 | | | | 2 | % | | | 297 | | | | 2 | % |
| Consumer Goods | | | 2,060 | | | | 1 | % | | | 272 | | | | 1 | % | | | | 1,049 | | | | 1 | % | | | 96 | | | | 1 | % |
| Other | | | 16,230 | | | | 9 | % | | | 2,080 | | | | 12 | % | | | | 11,097 | | | | 10 | % | | | 1,553 | | | | 12 | % |
| Total | | $ | 202,285 | | | | 100 | % | | | 18,740 | | | | 100 | % | | | $ | 116,074 | | | | 100 | % | | | 12,129 | | | | 100 | % |
Footnotes:
[1] GAAP NOI is on an annualized basis and is based on foreign currency exchange rates as of September 30, 2015.
| Global Net Lease, Inc. |
| Supplemental Information |
| Quarter ended September 30, 2015 (unaudited) |
| Diversification by Geography |
| As of September 30, 2015 |
| Amounts in thousands, except per share data, ratios and percentages |
| | | Total Portfolio | | | | Unencumbered Portfolio | |
| Region | | GAAP NOI[1] | | | GAAP NOI Percent | | | Square Footage | | | Sq. ft. Percent | | | | GAAP NOI[1] | | | GAAP NOI Percent | | | Square Footage | | | Sq. ft. Percent | |
| United States | | $ | 120,801 | | | | 59.6 | % | | | 12,151 | | | | 64.7 | % | | | $ | 108,869 | | | | 93.8 | % | | | 11,575 | | | | 95.4 | % |
| Texas | | | 23,238 | | | | 11.5 | % | | | 2,010 | | | | 10.7 | % | | | | 23,238 | | | | 20.0 | % | | | 2,010 | | | | 16.6 | % |
| Michigan | | | 16,238 | | | | 8.0 | % | | | 2,296 | | | | 12.3 | % | | | | 16,238 | | | | 14.0 | % | | | 2,296 | | | | 18.9 | % |
| California | | | 12,890 | | | | 6.4 | % | | | 675 | | | | 3.6 | % | | | | 4,170 | | | | 3.6 | % | | | 165 | | | | 1.4 | % |
| New Jersey | | | 8,505 | | | | 4.2 | % | | | 349 | | | | 1.9 | % | | | | 8,505 | | | | 7.3 | % | | | 349 | | | | 2.9 | % |
| Tennessee | | | 5,875 | | | | 2.9 | % | | | 789 | | | | 4.2 | % | | | | 5,875 | | | | 5.1 | % | | | 789 | | | | 6.5 | % |
| Indiana | | | 4,563 | | | | 2.3 | % | | | 1,114 | | | | 5.9 | % | | | | 4,563 | | | | 3.9 | % | | | 1,114 | | | | 9.2 | % |
| Ohio | | | 4,203 | | | | 2.1 | % | | | 508 | | | | 2.7 | % | | | | 4,203 | | | | 3.6 | % | | | 508 | | | | 4.2 | % |
| Pennsylvania | | | 3,753 | | | | 1.9 | % | | | 376 | | | | 2.0 | % | | | | 3,753 | | | | 3.2 | % | | | 376 | | | | 3.1 | % |
| Kentucky | | | 3,687 | | | | 1.8 | % | | | 517 | | | | 2.8 | % | | | | 3,687 | | | | 3.2 | % | | | 517 | | | | 4.3 | % |
| South Carolina | | | 3,587 | | | | 1.8 | % | | | 424 | | | | 2.3 | % | | | | 3,587 | | | | 3.1 | % | | | 424 | | | | 3.5 | % |
| Florida | | | 3,421 | | | | 1.7 | % | | | 244 | | | | 1.3 | % | | | | 3,421 | | | | 2.9 | % | | | 244 | | | | 2.0 | % |
| Puerto Rico | | | 3,212 | | | | 1.6 | % | | | 65 | | | | 0.3 | % | | | | - | | | | - | | | | - | | | | - | |
| Illinois | | | 2,629 | | | | 1.3 | % | | | 571 | | | | 3.0 | % | | | | 2,629 | | | | 2.3 | % | | | 571 | | | | 4.7 | % |
| Missouri | | | 2,582 | | | | 1.3 | % | | | 139 | | | | 0.7 | % | | | | 2,582 | | | | 2.2 | % | | | 139 | | | | 1.1 | % |
| New York | | | 2,398 | | | | 1.2 | % | | | 221 | | | | 1.2 | % | | | | 2,398 | | | | 2.1 | % | | | 221 | | | | 1.8 | % |
| Minnesota | | | 1,854 | | | | 0.9 | % | | | 150 | | | | 0.8 | % | | | | 1,854 | | | | 1.6 | % | | | 150 | | | | 1.2 | % |
| Massachusetts | | | 1,772 | | | | 0.9 | % | | | 127 | | | | 0.7 | % | | | | 1,772 | | | | 1.5 | % | | | 127 | | | | 1.1 | % |
| Oklahoma | | | 1,617 | | | | 0.8 | % | | | 159 | | | | 0.8 | % | | | | 1,617 | | | | 1.4 | % | | | 159 | | | | 1.3 | % |
| Maine | | | 1,511 | | | | 0.7 | % | | | 50 | | | | 0.3 | % | | | | 1,511 | | | | 1.3 | % | | | 50 | | | | 0.4 | % |
| North Carolina | | | 1,467 | | | | 0.7 | % | | | 243 | | | | 1.3 | % | | | | 1,467 | | | | 1.3 | % | | | 243 | | | | 2.0 | % |
| Kansas | | | 1,275 | | | | 0.6 | % | | | 179 | | | | 1.0 | % | | | | 1,275 | | | | 1.1 | % | | | 179 | | | | 1.5 | % |
| Louisiana | | | 1,260 | | | | 0.6 | % | | | 137 | | | | 0.7 | % | | | | 1,260 | | | | 1.1 | % | | | 137 | | | | 1.1 | % |
| South Dakota | | | 1,126 | | | | 0.6 | % | | | 54 | | | | 0.3 | % | | | | 1,126 | | | | 1.0 | % | | | 54 | | | | 0.4 | % |
| Arizona | | | 982 | | | | 0.5 | % | | | 159 | | | | 0.8 | % | | | | 982 | | | | 0.8 | % | | | 159 | | | | 1.3 | % |
| North Dakota | | | 884 | | | | 0.4 | % | | | 47 | | | | 0.3 | % | | | | 884 | | | | 0.8 | % | | | 47 | | | | 0.4 | % |
| Colorado | | | 866 | | | | 0.4 | % | | | 27 | | | | 0.1 | % | | | | 866 | | | | 0.7 | % | | | 27 | | | | 0.2 | % |
| Mississippi | | | 800 | | | | 0.4 | % | | | 81 | | | | 0.4 | % | | | | 800 | | | | 0.7 | % | | | 81 | | | | 0.7 | % |
| Alabama | | | 791 | | | | 0.4 | % | | | 74 | | | | 0.4 | % | | | | 791 | | | | 0.7 | % | | | 74 | | | | 0.6 | % |
| Maryland | | | 785 | | | | 0.4 | % | | | 120 | | | | 0.6 | % | | | | 785 | | | | 0.7 | % | | | 120 | | | | 1.0 | % |
| Georgia | | | 670 | | | | 0.3 | % | | | 48 | | | | 0.3 | % | | | | 670 | | | | 0.6 | % | | | 48 | | | | 0.4 | % |
| Nebraska | | | 564 | | | | 0.3 | % | | | 58 | | | | 0.3 | % | | | | 564 | | | | 0.5 | % | | | 58 | | | | 0.5 | % |
| New Mexico | | | 470 | | | | 0.2 | % | | | 46 | | | | 0.2 | % | | | | 470 | | | | 0.4 | % | | | 46 | | | | 0.4 | % |
| Utah | | | 395 | | | | 0.2 | % | | | 20 | | | | 0.1 | % | | | | 395 | | | | 0.3 | % | | | 20 | | | | 0.2 | % |
| Iowa | | | 296 | | | | 0.1 | % | | | 32 | | | | 0.2 | % | | | | 296 | | | | 0.3 | % | | | 32 | | | | 0.3 | % |
| Delaware | | | 269 | | | | 0.1 | % | | | 10 | | | | 0.1 | % | | | | 269 | | | | 0.2 | % | | | 10 | | | | 0.1 | % |
| Idaho | | | 201 | | | | 0.1 | % | | | 16 | | | | 0.1 | % | | | | 201 | | | | 0.1 | % | | | 16 | | | | 0.1 | % |
| Arkansas | | | 89 | | | | 0.0 | % | | | 8 | | | | 0.0 | % | | | | 89 | | | | 0.1 | % | | | 8 | | | | 0.0 | % |
| Virginia | | | 76 | | | | 0.0 | % | | | 8 | | | | 0.0 | % | | | | 76 | | | | 0.1 | % | | | 7 | | | | 0.0 | % |
| International: | | | - | | | | - | | | | - | | | | - | | | | | - | | | | - | | | | - | | | | - | |
| United Kingdom | | | 40,496 | | | | 20.1 | % | | | 2,708 | | | | 14.5 | % | | | | - | | | | - | | | | - | | | | - | |
| Germany | | | 19,182 | | | | 9.5 | % | | | 1,870 | | | | 10.0 | % | | | | - | | | | - | | | | - | | | | - | |
| Finland | | | 14,601 | | | | 7.2 | % | | | 1,457 | | | | 7.8 | % | | | | - | | | | - | | | | - | | | | - | |
| The Netherlands | | | 7,205 | | | | 3.6 | % | | | 554 | | | | 3.0 | % | | | | 7,205 | | | | 6.2 | % | | | 554 | | | | 4.6 | % |
| Total | | $ | 202,285 | | | | 100 | % | | | 18,740 | | | | 100 | % | | | $ | 116,074 | | | | 100 | % | | | 12,129 | | | | 100 | % |
Footnotes:
[1] GAAP NOI is on an annualized basis and is based on foreign currency exchange rates as of September 30, 2015.
| Global Net Lease, Inc. |
| Supplemental Information |
| Quarter ended September 30, 2015 (unaudited) |
| Lease Expirations |
| As of September 30, 2015 |
| Amounts in thousands, except per share data, ratios and percentages |
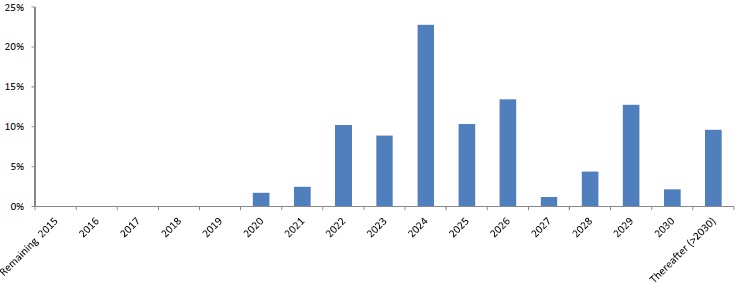
| Year of Expiration | | Number of Leases Expiring | | | GAAP NOI[1] | | | GAAP NOI Percent | | | Leased Rentable Square Feet | | | Percent of Rentable Square Feet Expiring | |
| Remaining 2015 | | | - | | | $ | - | | | | - | | | | - | | | | - | |
| 2016 | | | - | | | | - | | | | - | | | | - | | | | - | |
| 2017 | | | - | | | | - | | | | - | | | | - | | | | - | |
| 2018 | | | - | | | | - | | | | - | | | | - | | | | - | |
| 2019 | | | - | | | | - | | | | - | | | | - | | | | - | |
| 2020 | | | 2 | | | | 3,482 | | | | 1.7 | % | | | 386 | | | | 2.1 | % |
| 2021 | | | 2 | | | | 5,003 | | | | 2.5 | % | | | 323 | | | | 1.7 | % |
| 2022 | | | 16 | | | | 20,672 | | | | 10.2 | % | | | 1,553 | | | | 8.3 | % |
| 2023 | | | 25 | | | | 18,027 | | | | 8.9 | % | | | 1,891 | | | | 10.1 | % |
| 2024 | | | 39 | | | | 46,059 | | | | 22.8 | % | | | 3,868 | | | | 20.6 | % |
| 2025 | | | 35 | | | | 20,892 | | | | 10.3 | % | | | 1,758 | | | | 9.4 | % |
| 2026 | | | 17 | | | | 27,188 | | | | 13.4 | % | | | 2,035 | | | | 10.9 | % |
| 2027 | | | 10 | | | | 2,413 | | | | 1.2 | % | | | 163 | | | | 0.9 | % |
| 2028 | | | 47 | | | | 8,896 | | | | 4.4 | % | | | 1,058 | | | | 5.6 | % |
| 2029 | | | 118 | | | | 25,803 | | | | 12.8 | % | | | 2,732 | | | | 14.6 | % |
| 2030 | | | 9 | | | | 4,361 | | | | 2.2 | % | | | 312 | | | | 1.7 | % |
| Thereafter (>2030) | | | 9 | | | | 19,489 | | | | 9.6 | % | | | 2,661 | | | | 14.1 | % |
| Total | | | 329 | | | $ | 202,285 | | | | 100 | % | | | 18,740 | | | | 100 | % |
Annualized GAAP NOI by Year of Lease Expiration as a Percentage of Total GAAP NOI
Footnotes:
[1] GAAP NOI is on an annualized basis and is based on foreign currency exchange rates as of September 30, 2015.