Exhibit 99.1

Global Net Lease Second Quarter Investor Presentation
2 OVERVIEW Differentiated Strategy with International Exposure 1. As used herein, investment grade includes both actual investment grade ratings of the tenant or guarantor, if available, or i mpl ied investment grade. Implied investment grade may include actual ratings of tenant parent, guarantor parent (regardless of whether or not the parent has guaranteed the tenant’s obligation under the lease) or by using a proprie tar y Moody’s analytical tool, which generates an implied rating by measuring a company’s probability of default. Ratings information is as of June 30, 2019. Proactive Asset Management Program to Drive Long Term Portfolio Value Experienced Management Team Ability to Capitalize on Imbalance Between U.S. and European Markets Deliver Superior Risk Adjusted Returns High - Quality, Mission Critical, Net Lease Focused Portfolio Long Duration Leases to Primarily Investment Grade Rated Tenants (1)
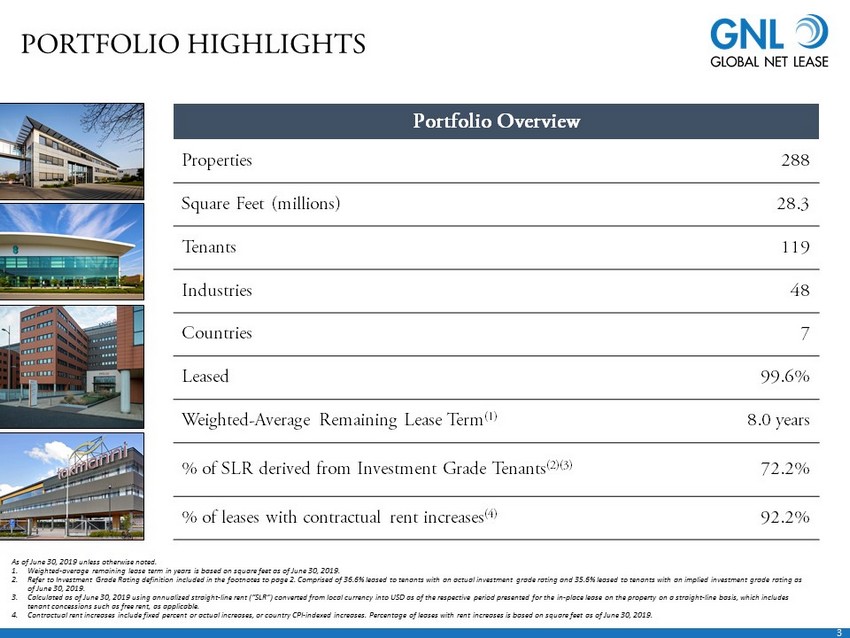
3 PORTFOLIO HIGHLIGHTS Properties 288 Square Feet (millions) 28.3 Tenants 119 Industries 48 Countries 7 Leased 99.6% Weighted - Average Remaining Lease Term (1) 8.0 years % of SLR derived from Investment Grade Tenants (2)(3) 72.2% % of leases with contractual rent increases (4) 92.2% Portfolio Overview As of June 30, 2019 unless otherwise noted. 1. Weighted - average remaining lease term in years is based on square feet as of June 30, 2019. 2. Refer to Investment Grade Rating definition included in the footnotes to page 2. Comprised of 36.6% leased to tenants with an ac tual investment grade rating and 35.6% leased to tenants with an implied investment grade rating as of June 30, 2019. 3. Calculated as of June 30, 2019 using annualized straight - line rent (“SLR”) converted from local currency into USD as of the respective period presented for the in - place lease on the property on a straight - line basis, which includes tenant concessions such as free rent, as applicable. 4. Contractual rent increases include fixed percent or actual increases, or country CPI - indexed increases. Percentage of leases wit h rent increases is based on square feet as of June 30, 2019.

4 Non Investment Grade 25.6% Investment Grade 72.2% Not Rated 2.2% WELL BALANCED PORTFOLIO As of June 30, 2019 1. Metric based on SLR. Refer to SLR definition included in the footnotes on page 3. 2. Refer to Investment Grade Rating definition included in the footnotes on page 2. Credit Rating (1) Tenant Industry (1) Geography (1) Asset Type (1) (2) Industrial/Distribution 41% Retail 6% Office 53% United States 58% United Kingdom 18% Germany 7% The Netherlands 6% Finland 5% France 4% Luxembourg 2% Financial Services 12% Healthcare 7% Technology 6% Aerospace 6% Telecommunications 5% Government Services 5% Logistics 5% Freight 5% Metal Processing 5% Utilities 4% Energy 4% Discount Retail 4% All Other 32%
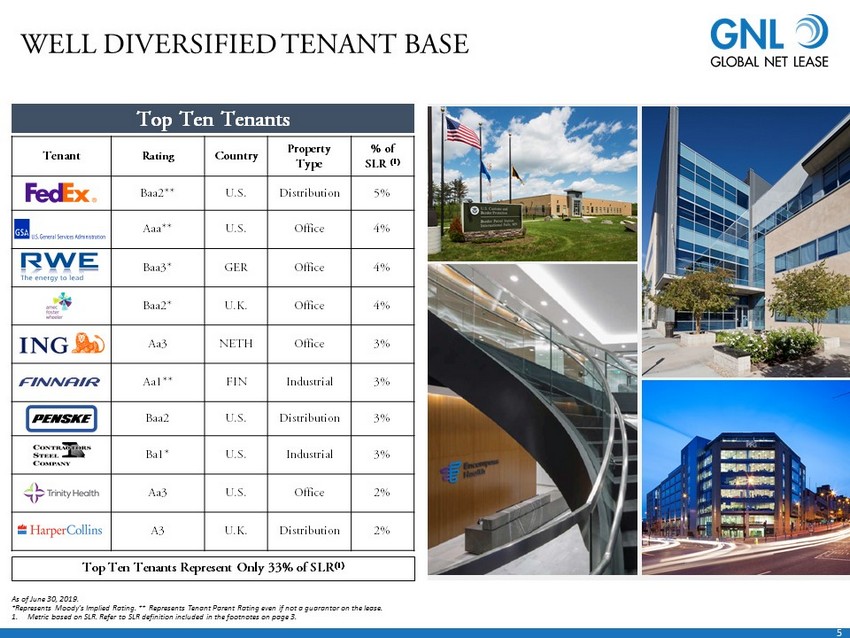
5 Tenant Rating Country Property Type % of SLR (1) Baa2** U.S. Distribution 5% Aaa** U.S. Office 4% Baa3* GER Office 4% Baa2* U.K. Office 4% Aa3 NETH Office 3% Aa1** FIN Industrial 3% Baa2 U.S. Distribution 3% Ba1* U.S. Industrial 3% Aa3 U.S. Office 2% A3 U.K. Distribution 2% WELL DIVERSIFIED TENANT BASE Top Ten Tenants As of June 30, 2019. *Represents Moody’s Implied Rating. ** Represents Tenant Parent Rating even if not a guarantor on the lease. 1. Metric based on SLR. Refer to SLR definition included in the footnotes on page 3. Top Ten Tenants Represent Only 33 % of SLR (1)

6 Office Distribution Industrial FOCUS ON HIGH - QUALITY TENANTS Only Focused on Markets with Quality Sovereign Debt Ratings (S&P) U.S. Luxembourg Germany The Netherlands Finland U.K. France AA+ AAA AAA AAA AA+ AA AA Best - in - class portfolio leased to largely Investment Grade Rated Tenants (1) in well established markets in the U.S. and Europe 1. Refer to Investment Grade Rating definition included in the footnotes on page 2.

7 DIFFERENTIATED INVESTMENT STRATEGY Geography Asset Type Property Fundamentals Credit Quality Structure and Pricing Focused on single - tenant commercial properties to generate superior risk - adjusted returns • Focus on the U.S. and strong sovereign debt rated countries in Continental Europe • Critical company operational single tenant net lease sites and headquarters • Strategically located industrial and distribution facilities • In - house financial and business model review using Moody’s analytics • Continuous monitoring of improving or deteriorating credit quality for asset management opportunities • Analysis of property condition as well as local market conditions and changes • Concentration on long term net leases with contractual rent increases • Deposits and covenants help to further protect deployment of capital
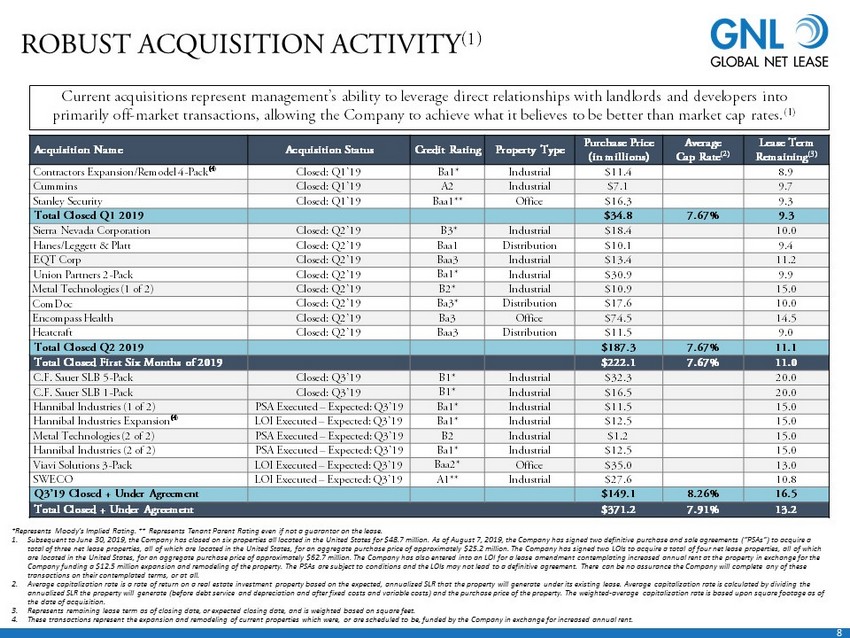
8 *Represents Moody’s Implied Rating. ** Represents Tenant Parent Rating even if not a guarantor on the lease . 1. Subsequent to June 30, 2019, the Company has closed on six properties all located in the United States for $48.7 million. As of August 7, 2019, the Company has signed two definitive purchase and sale agreements (“PSAs”) to acquire a total of three net lease properties, all of which are located in the United States, for an aggregate purchase price of approx ima tely $25.2 million. The Company has signed two LOIs to acquire a total of four net lease properties, all of which are located in the United States, for an aggregate purchase price of approximately $62.7 million. The Company has also entere d i nto an LOI for a lease amendment contemplating increased annual rent at the property in exchange for the Company funding a $12.5 million expansion and remodeling of the property. The PSAs are subject to conditions and the LOIs may no t lead to a definitive agreement. There can be no assurance the Company will complete any of these transactions on their contemplated terms, or at all. 2. Average capitalization rate is a rate of return on a real estate investment property based on the expected, annualized SLR th at the property will generate under its existing lease. Average capitalization rate is calculated by dividing the annualized SLR the property will generate (before debt service and depreciation and after fixed costs and variable costs) and th e purchase price of the property. The weighted - average capitalization rate is based upon square footage as of the date of acquisition. 3. Represents remaining lease term as of closing date, or expected closing date, and is weighted based on square feet. 4. These transactions represent the expansion and remodeling of current properties which were, or are scheduled to be, funded by th e Company in exchange for increased annual rent. Current acquisitions represent management’s ability to leverage direct relationships with landlords and developers into primarily off - market transactions, allowing the Company to achieve what it believes to be better than market cap rates. (1) A cquisition Name A cquisition Status Credit Rating Property Type Purchase Price (in millions) Average Cap Rate (2) Lease Term Remaining (3) Contractors Expansion/Remodel 4 - Pack (4 ) Closed: Q1’19 Ba1* Industrial $11.4 8.9 Cummins Closed: Q1’19 A2 Industrial $7.1 9.7 Stanley Security Closed: Q1’19 Baa1** Office $16.3 9.3 Total Closed Q1 2019 $34.8 7.67% 9.3 Sierra Nevada Corporation Closed: Q2’19 B3* Industrial $18.4 10.0 Hanes/Leggett & Platt Closed: Q2’19 Baa1 Distribution $10.1 9.4 EQT Corp Closed: Q2’19 Baa3 Industrial $13.4 11.2 Union Partners 2 - Pack Closed: Q2’19 Ba1* Industrial $30.9 9.9 Metal Technologies (1 of 2) Closed: Q2’19 B2* Industrial $10.9 15.0 ComDoc Closed: Q2’19 Ba3* Distribution $17.6 10.0 Encompass Health Closed: Q2’19 Ba3 Office $74.5 14.5 Heatcraft Closed: Q2’19 Baa3 Distribution $11.5 9.0 Total Closed Q2 2019 $187.3 7.67% 11.1 Total Closed First Six Months of 2019 $222.1 7.67% 11.0 C.F. Sauer SLB 5 - Pack Closed: Q3’19 B1* Industrial $32.3 20.0 C.F. Sauer SLB 1 - Pack Closed: Q3’19 B1* Industrial $16.5 20.0 Hannibal Industries (1 of 2) PSA Executed – Expected: Q3’19 Ba1* Industrial $11.5 15.0 Hannibal Industries Expansion (4 ) LOI Executed – Expected: Q3’19 Ba1* Industrial $12.5 15.0 Metal Technologies (2 of 2) PSA Executed – Expected: Q3’19 B2 Industrial $1.2 15.0 Hannibal Industries (2 of 2) PSA Executed – Expected: Q3’19 Ba1* Industrial $12.5 15.0 Viavi Solutions 3 - Pack LOI Executed – Expected: Q3’19 Baa2* Office $35.0 13.0 SWECO LOI Executed – Expected: Q3’19 A1** Industrial $27.6 10.8 Q3’19 Closed + Under Agreement $149.1 8.26% 16.5 Total Closed + Under Agreement $371.2 7.91% 13.2 ROBUST ACQUISITION ACTIVITY (1)
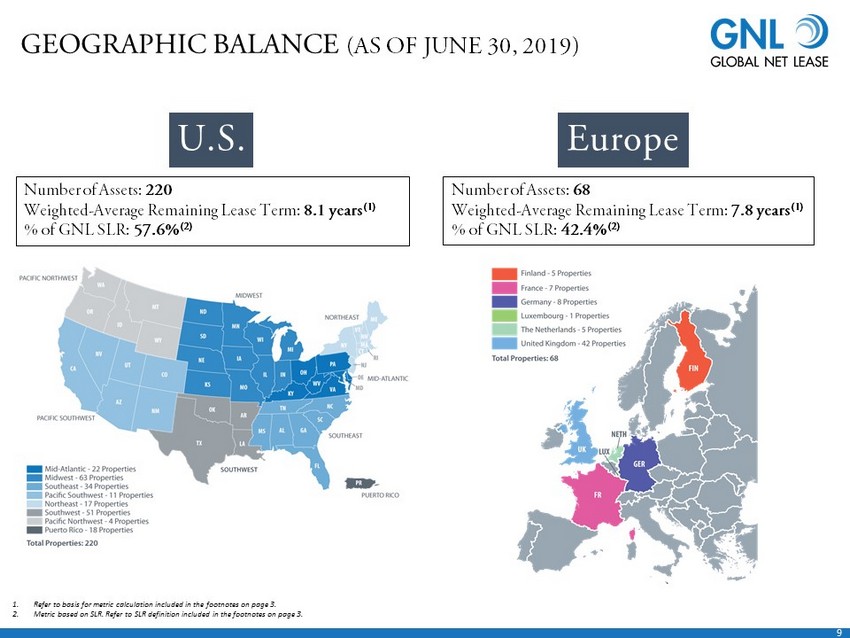
9 GEOGRAPHIC BALANCE (AS OF JUNE 30, 2019) 1. Refer to basis for metric calculation included in the footnotes on page 3. 2. Metric based on SLR. Refer to SLR definition included in the footnotes on page 3. U.S. Number of Assets: 220 Weighted - Average Remaining Lease Term: 8.1 years (1) % of GNL SLR: 57.6% (2) Europe Number of Assets: 68 Weighted - Average Remaining Lease Term: 7.8 years (1) % of GNL SLR: 42.4% (2)

10 Office 53% Industrial/Distribution 41% Retail 6% PORTFOLIO COMPARISON: Q2 2019 VS Q2 2018 Continued Focus towards United States Industrial and Distribution Properties Office 56% Industrial/Distribution 35% Retail 9% United States 51% Europe 49% Property Type Concentration (1) Geographic Concentration (1) As of June 30, 2018 As of June 30, 2018 As of June 30, 2019 2019 vs 2018: Industrial / Distribution increased by 6% up to 41% United States 58% Europe 42% As of June 30, 2019 2019 vs 2018: United States increased by 7% up to 58% as spreads in Europe tightened. GNL took advantage of attractive opportunities in the U.S. and will continue to monitor and explore potential European Acquisitions. 1. Metric based on SLR. Refer to SLR definition included in the footnotes on page 3.
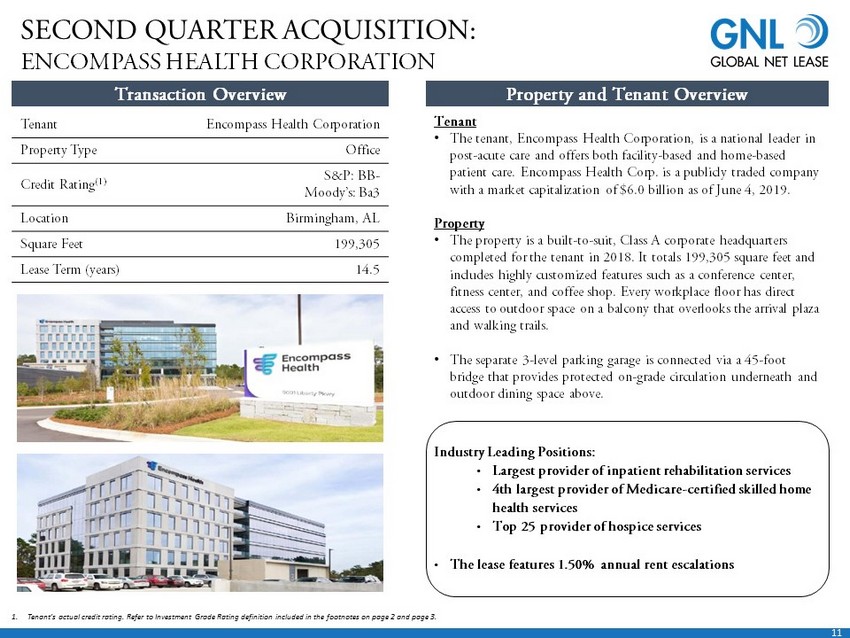
11 1. Tenant’s actual credit rating. Refer to Investment Grade Rating definition included in the footnotes on page 2 and page 3. Transaction Overview Tenant Encompass Health Corporation Property Type Office Credit Rating (1) S&P: BB - Moody’s: Ba3 Location Birmingham, AL Square Feet 199,305 Lease Term (years) 14.5 Tenant • The tenant, Encompass Health Corporation, is a national leader in post - acute care and offers both facility - based and home - based patient care. Encompass Health Corp. is a publicly traded company with a market capitalization of $6.0 billion as of June 4, 2019. Property • The property is a built - to - suit, Class A corporate headquarters completed for the tenant in 2018. It totals 199,305 square feet and includes highly customized features such as a conference center, fitness center, and coffee shop. Every workplace floor has direct access to outdoor space on a balcony that overlooks the arrival plaza and walking trails. • The separate 3 - level parking garage is connected via a 45 - foot bridge that provides protected on - grade circulation underneath and outdoor dining space above. SECOND QUARTER ACQUISITION: ENCOMPASS HEALTH CORPORATION Property and Tenant Overview Industry Leading Positions: • Largest provider of inpatient rehabilitation services • 4th largest provider of Medicare - certified skilled home health services • Top 25 provider of hospice services • The lease features 1.50% annual rent escalations
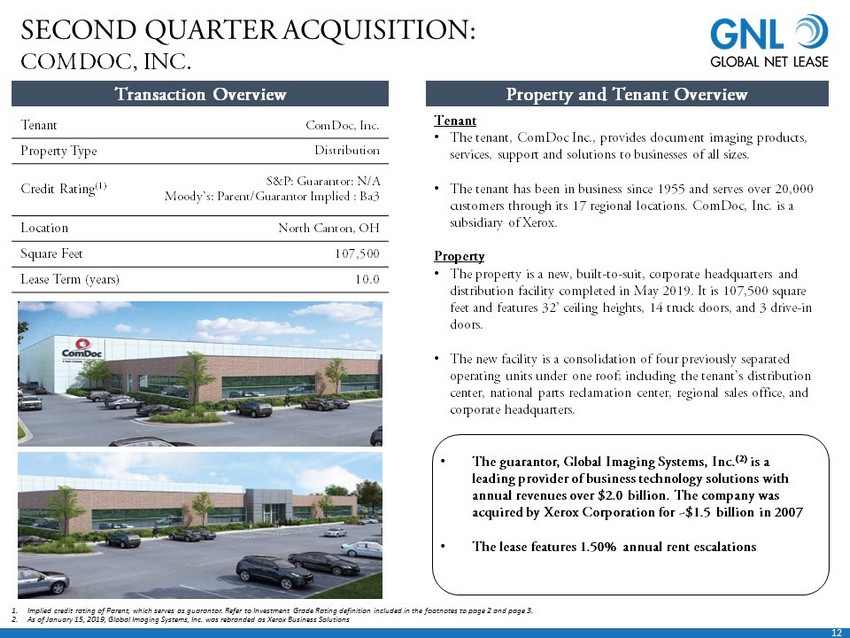
12 Transaction Overview SECOND QUARTER ACQUISITION: COMDOC, INC. Property and Tenant Overview Tenant ComDoc, Inc. Property Type Distribution Credit Rating (1) S&P: Guarantor: N/A Moody’s: Parent/Guarantor Implied : Ba3 Location North Canton, OH Square Feet 107,500 Lease Term (years) 10.0 Tenant • The tenant, ComDoc Inc., provides document imaging products, services, support and solutions to businesses of all sizes. • The tenant has been in business since 1955 and serves over 20,000 customers through its 17 regional locations. ComDoc, Inc. is a subsidiary of Xerox. Property • The property is a new, built - to - suit, corporate headquarters and distribution facility completed in May 2019. It is 107,500 square feet and features 32’ ceiling heights, 14 truck doors, and 3 drive - in doors. • The new facility is a consolidation of four previously separated operating units under one roof; including the tenant’s distribution center, national parts reclamation center, regional sales office, and corporate headquarters. • The guarantor, Global Imaging Systems, Inc. (2) is a leading provider of business technology solutions with annual revenues over $2.0 billion. The company was acquired by Xerox Corporation for ~$1.5 billion in 2007 • The lease features 1.50% annual rent escalations 1. Implied credit rating of Parent, which serves as guarantor. Refer to Investment Grade Rating definition included in the footn ote s to page 2 and page 3. 2. As of January 15, 2019, Global Imaging Systems, Inc. was rebranded as Xerox Business Solutions

13 Chris Masterson Chief Financial Officer, Treasurer and Secretary FULLY ALIGNED MANAGEMENT STRUCTURE Fully integrated external management team creates highly scalable platform with an acquisition pipeline generated by a proven, country - focused origination network No transactional fees allows for low general and administrative costs, which allows AR Global to provide greater resources at a lower cost (1) Lower Overhead Costs AR Global has sponsored or co - sponsored 15 REITs which have acquired more than $40 billion of real estate since 2007 Experience The audit, compensation, nominating and corporate governance committees are comprised of independent directors Corporate Governance Performance Alignment Management structure aligned to compensate based on operational outperformance, in turn delivering increased value to shareholders Company is supported by a financial accounting and reporting team, and maintains its own financial reporting processes, controls, and procedures Operational Efficiencies • Previously served as Chief Accounting Officer of Global Net Lease • Past experience includes accounting positions with Goldman Sachs and KPMG • Certified Public Accountant in New York State 1. As compared to fees associated with the prior management contract • Joined GNL as an Independent Board Member on March 2017 • Mr. Nelson currently serves as a Board and Audit committee Member for Caesars Entertainment Corp. (since 2019) and lead director of Herbalife Nutrition Ltd. (board member since 2014) and previously a Board and Audit committee Member of Icahn Enterprises from 2001 - 2019 • Previously served as CEO of Orbitex Management, a financial services company, and Eaglescliff Corporation, a specialty investment banking, consulting and wealth management company James L. Nelson Chief Executive Officer and President

14 GNL CAPITAL STRUCTURE GNL continued to improve its capital structure during the second quarter of 2019 by extending debt maturities, maintaining a low cost of debt and optimizing the debt structure for continued future growth Debt Maturity and Interest Expense by Quarter (1) GNL Capital Structure by Quarter (1) (in millions) (years) (WAVG interest expense) 1. As of final day of the applicable quarter or for the applicable quarter . $1,375 $1,503 $1,341 $1,585 $1,645 $139 $136 $134 $141 $152 $983 $984 $1,140 $1,141 $1,300 $686 $742 $646 $537 $540 $0 $500 $1,000 $1,500 $2,000 $2,500 $3,000 $3,500 $4,000 Q2 2018 Q3 2018 Q4 2018 Q1 2019 Q2 2019 Equity Preferred Equity Mortgage Debt Line of Credit 3.3 3.8 4.2 4.2 4.6 3.1% 3.0% 3.1% 3.0% 3.0% 0.0% 1.0% 2.0% 3.0% 4.0% 5.0% 0.0 0.5 1.0 1.5 2.0 2.5 3.0 3.5 4.0 4.5 5.0 Q2 2018 Q3 2018 Q4 2018 Q1 2019 Q2 2019 Weighted-Average Maturity Weighted-Average Interest Rate

15 PERFORMANCE METRICS 1. See page 8 for further details. 2. Adjusted Funds from Operations (“AFFO”). See “Non - GAAP measures” on pages 26 for a description of AFFO and pages 27 for a reconc iliation of AFFO to net income, the most directly comparable GAAP Financial measure. 3. On April 5, 2019, the board of directors approved a change in the Common Stock dividend policy to pay future dividends on a q uar terly basis in arrears on the 15 th day of the first month following the end of each fiscal quarter. This change has no impact on the annualized dividend rate of $2.13. Q2 2019 Q2 2018 Revenue from Tenants $76.1 million $71.0 million Net Income $15.3 million $7.7 million AFFO (2) $40.1 million $35.5 million Dividends Paid to Common Shareholders (3) $14.9 million $35.8 million Weighted - Average Shares Outstanding 85.2 million 67.3 million Q2 2019 Financials: Key Takeaways • $371.2 million of closed and pipeline acquisitions at a weighted average cap rate of 7.91% (1) • Weighted average debt maturity extended to 4.6 years in Q2’19 from 3.3 years in Q2’18 Refinancings: • CMBS Financing: GNL completed a CMBS financing for $97.5 million secured by 16 of the Company’s single tenant net leased offi ce and industrial properties located in 12 states • Associated properties were simultaneously removed from the borrowing base • $90 million was used to repay outstanding indebtedness under the Credit Facility • Netherlands and Luxembourg (Benelux): Borrowed €120.0 million secured by three properties and repaid €80.3 million that encum ber ed two of the properties, interest rate lowered from 1.58% to 1.38%
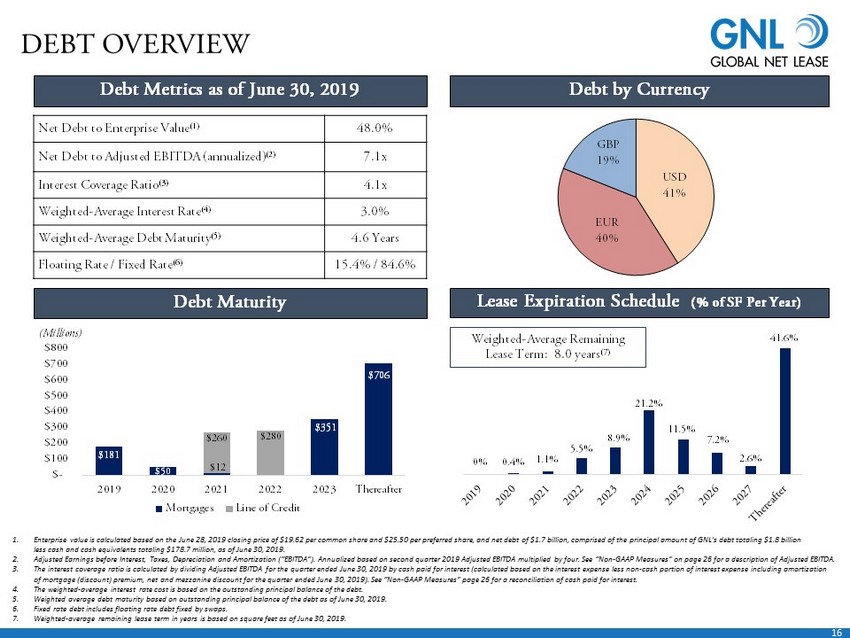
16 $181 $50 $12 $351 $706 $260 $280 $- $100 $200 $300 $400 $500 $600 $700 $800 2019 2020 2021 2022 2023 Thereafter Mortgages Line of Credit 0% 0.4% 1.1% 5.5% 8.9% 21.2% 11.5% 7.2% 2.6% 41.6% DEBT OVERVIEW Net Debt to Enterprise Value (1) 48.0% Net Debt to Adjusted EBITDA (annualized) (2) 7.1x Interest Coverage Ratio (3) 4.1x Weighted - Average Interest Rate (4) 3.0% Weighted - Average Debt Maturity (5) 4.6 Years Floating Rate / Fixed Rate (6) 15.4% / 84.6% Debt Metrics as of June 30 , 2019 Debt by Currency Debt Maturity 1. Enterprise value is calculated based on the June 28 , 2019 closing price of $19.62 per common share and $25.50 per preferred share, and net debt of $1.7 billion, comprised of th e p rincipal amount of GNL’s debt totaling $1.8 billion less cash and cash equivalents totaling $ 178.7 million , as of June 30 , 2019 . 2. Adjusted Earnings before Interest, Taxes, Depreciation and Amortization (“EBITDA ”). Annualized based on second quarter 2019 Adjusted EBITDA multiplied by four. See “Non - GAAP Measures” on page 26 for a description of Adjusted EBITDA. 3. The interest coverage ratio is calculated by dividing Adjusted EBITDA for the quarter ended June 30, 2019 by cash paid for interest (calculated based on the interest expense less non - cash portion of interest expense including amortiza tion of mortgage (discount) premium, net and mezzanine discount for the quarter ended June 30, 2019). See “Non - GAAP Measures” page 26 for a reconciliation of cash paid for interest. 4. The weighted - average interest rate cost is based on the outstanding principal balance of the debt. 5. Weighted average debt maturity based on outstanding principal balance of the debt as of June 30, 2019. 6. Fixed rate debt includes floating rate debt fixed by swaps. 7. Weighted - average remaining lease term in years is based on square feet as of June 30 , 2019. (Millions) Weighted - Average Remaining Lease Term: 8.0 years (7) Lease Expiration Schedule (% of SF Per Year) USD 41% EUR 40% GBP 19%
17 COMPREHENSIVE HEDGING PROGRAM Hedging Foreign Currency Exchange Risk (“Cash Flow Hedging Instruments”) • Provides protection against unfavorable movements in EUR and GBP versus the U.S. Dollar (“USD”) associated with the Company’s foreign property operations Interest Rate Swaps: Fixing Interest on Floating Rate Debt • Cost effective tools that mitigate against adverse fluctuations in interest rates; effectively acting to convert variable rate debt into fixed rate debt resulting in reduced exposure to variability in cash flows related to interest payments Net Investment Hedges: Asset – Liability Matching • Matches the value of assets with liabilities in the same currency (EUR or GBP), creating a “natural hedge” on the value of GNL assets against movement in FX rates vs USD GNL continues to employ a comprehensive hedging program, with a number of components designed to limit the impact of currency and interest rate movements to its European portfolio
18 The statements in this presentation that are not historical facts may be forward - looking statements . These forward - looking statements involve risks and uncertainties that could cause actual results or events to be materially different . In addition, words such as “may,” “will,” “seeks,” “anticipates,” “believes,” “estimates,” “expects,” “plans,” “intends,” “would,” or similar expressions indicate a forward - looking statement, although not all forward - looking statements contain these identifying words . Any statements referring to the future value of an investment in GNL, as well as the success that GNL may have in executing its business plan, are also forward - looking statements . There are a number of risks, uncertainties and other important factors that could cause GNL’s actual results to differ materially from those contemplated by such forward - looking statements, including those risks, uncertainties and other important factors set forth in the “Risk Factors” and “Management’s Discussion and Analysis of Financial Condition and Results of Operations” sections of GNL’s Annual Report on Form 10 - K for the year ended December 31 , 2018 filed with the SEC on February 28 , 2019 , and all other filings with the SEC after that date, as such risks, uncertainties and other important factors may be updated from time to time in GNL’s subsequent reports . Further, forward looking statements speak only as of the date they are made, and GNL undertakes no obligation to update or revise forward - looking statements to reflect changed assumptions, the occurrence of unanticipated events or changes to future operating results over time, except as required by law . This presentation contains certain statements that are the Company’s and Management’s hopes, intentions, beliefs, expectations, or projections of the future and might be considered to be forward - looking statements under Federal Securities laws . Prospective investors are cautioned that any such forward - looking statements are not guarantees of future performance, and involve risks and uncertainties . The company’s actual future results may differ significantly from the matters discussed in these forward - looking statements, and we may not release revisions to these forward - looking statements to reflect changes after we’ve made the statements . FORWARD LOOKING STATEMENTS
19 RISK FACTORS The following are some of the risks and uncertainties, although not all risks and uncertainties, that could cause our actual results to differ materially from those presented in our forward - looking statements . • All of our executive officers are also officers, managers, employees or holders of a direct or indirect controlling interest in the Advisor and other entities affiliated with AR Global Investments, LLC ("AR Global") . As a result, our executive officers, the Advisor and its affiliates face conflicts of interest, including significant conflicts created by the Advisor's compensation arrangements with us and other investment programs advised by AR Global affiliates and conflicts in allocating time among these investment programs and us . These conflicts could result in unanticipated actions . Because investment opportunities that are suitable for us may also be suitable for other investment programs advised by affiliates of AR Global, the Advisor and its affiliates face conflicts of interest relating to the purchase of properties and other investments and these conflicts may not be resolved in our favor . • We are obligated to pay fees which may be substantial to the Advisor and its affiliates . • We depend on tenants for our rental revenue and, accordingly, our rental revenue is dependent upon the success and economic viability of our tenants . • Increases in interest rates could increase the amount of our debt payments . • Adverse changes in exchange rates may reduce the net income and cash flow associated with our properties located outside of the United States ("U . S . ") . • The Advisor may not be able to identify a sufficient number of property acquisitions satisfying our investment objectives on a timely basis and on acceptable terms and prices, or at all . • We may be unable to continue to raise additional debt or equity financing on attractive terms, or at all, and there can be no assurance we will be able to fund future acquisitions . • We may be unable to repay, refinance, restructure or extend our indebtedness as it becomes due . • Adverse changes in exchange rates may reduce the value of our properties located outside of the United States ("U . S . ") . • Provisions in our credit facility may limit our ability to pay dividends on our common stock, $ 0 . 01 par value per share (“Common Stock”), our 7 . 25 % Series A Cumulative Redeemable Preferred Stock, $ 0 . 01 par value per share (“Series A Preferred Stock”) or any other stock we may issue .

20 RISK FACTORS (CONTINUED) • If we are not able to increase the amount of cash we have available to pay dividends, including through additional cash flows we expect to generate from completing acquisitions, we may have to reduce dividend payments or identify other financing sources to fund the payment of dividends at their current levels . • There can be no assurance we will complete acquisitions on a timely basis or on acceptable terms and conditions, if at all . • We may be unable to pay or maintain cash dividends or increase dividends over time . • We may not generate cash flows sufficient to pay dividends to our stockholders or fund our operations, and, as such, we may be forced to borrow at unfavorable rates to pay dividends to our stockholders or fund our operations . • Any dividends that we pay on our Common Stock, Series A Preferred Stock or any other stock we may issue may exceed cash flow from operations, reducing the amount of capital available to invest in properties and other permitted investments . • We are subject to risks associated with our international investments, including risks associated with compliance with and changes in foreign laws, fluctuations in foreign currency exchange rates and inflation . • We are subject to risks associated with any dislocations or liquidity disruptions that may exist or occur in the credit markets of the U . S . and Europe from time to time . • We may fail to continue to qualify, as a real estate investment trust for U . S . federal income tax purposes ("REIT"), which would result in higher taxes, may adversely affect operations and would reduce the trading price of our Common Stock and Series A Preferred Stock and our cash available for dividends . • We may be exposed to risks due to a lack of tenant diversity, investment types and geographic diversity . • We are exposed to changes in general economic, business and political conditions, including the possibility of intensified international hostilities, acts of terrorism, and changes in conditions of U . S . or international lending, capital and financing markets, including as a result of the U . K . 's potential or actual withdrawal from the European Union or any other events that create, or give the impression they could create, economic or political instability in Europe, which may cause the revenue derived from, and the market value of, properties located in the United Kingdom and continental Europe to decline .
21 PROJECTIONS • This presentation includes estimated projections of future operating results . These projections were not prepared in accordance with published guidelines of the SEC or the guidelines established by the American Institute of Certified Public Accountants for preparation and presentation of financial projections . This information is not fact and should not be relied upon as being necessarily indicative of future results ; the projections were prepared in good faith by management and are based on numerous assumptions that may prove to be wrong . Important factors that may affect actual results and cause the projections to not be achieved include, but are not limited to, risks and uncertainties relating to the company and other factors described in the “Risk Factors” and “Management’s Discussion and Analysis of Financial Condition and Results of Operations” sections of GNL’s Annual Report on Form 10 - K for the year ended December 31 , 2018 filed with the SEC on February 28 , 2019 , and subsequent Quarterly Reports on Form 10 - Q filed with the SEC . The projections also reflect assumptions as to certain business decisions that are subject to change . As a result, actual results may differ materially from those contained in the estimates . Accordingly, there can be no assurance that the estimates will be realized . • This presentation also contains estimates and information concerning our industry, including market position, market size, and growth rates of the markets in which we participate, that are based on industry publications and reports . This information involves a number of assumptions and limitations, and you are cautioned not to give undue weight to these estimates . We have not independently verified the accuracy or completeness of the data contained in these industry publications and reports . The industry in which we operate is subject to a high degree of uncertainty and risk due to variety of factors, including those described in the “Risk Factors” and “Management’s Discussion and Analysis of Financial Condition and Results of Operations” sections of GNL’s Annual Report on Form 10 - K for the year ended December 31 , 2018 filed with the SEC on February 28 , 2019 , and subsequent Quarterly Reports on Form 10 - Q filed with the SEC . These and other factors could cause results to differ materially from those expressed in these publications and reports .
22 DEFINITIONS • Due to certain unique operating characteristics of real estate companies, as discussed below, the National Association of Real Estate Investment Trusts ("NAREIT"), an industry trade group, has promulgated a measure known as funds from operations ("FFO"), which we believe to be an appropriate supplemental measure to reflect the operating performance of a REIT . FFO is not equivalent to net income or loss as determined under accounting principles generally accepted in the United States ("GAAP") . • We calculate FFO, a non - GAAP measure, consistent with the standards established over time by the Board of Governors of NAREIT, as restated in a White Paper approved by the Board of Governors of NAREIT effective in December 2018 (the "White Paper") . The White Paper defines FFO as net income or loss computed in accordance with GAAP, excluding depreciation and amortization related to real estate, gains and losses from the sale of certain real estate assets, gains and losses from change in control and impairment write - downs of certain real estate assets and investments in entities when the impairment is directly attributable to decreases in the value of depreciable real estate held by the entity . Adjustments for unconsolidated partnerships and joint ventures are calculated to reflect FFO . Our FFO calculation complies with NAREIT's definition . • The historical accounting convention used for real estate assets requires straight - line depreciation of buildings and improvements, and straight - line amortization of intangibles, which implies that the value of a real estate asset diminishes predictably over time, especially if not adequately maintained or repaired and renovated as required by relevant circumstances or as requested or required by lessees for operational purposes in order to maintain the value disclosed . We believe that, because real estate values historically rise and fall with market conditions, including inflation, interest rates, unemployment and consumer spending, presentations of operating results for a REIT using historical accounting for depreciation and certain other items may be less informative . Historical accounting for real estate involves the use of GAAP . Any other method of accounting for real estate such as the fair value method cannot be construed to be any more accurate or relevant than the comparable methodologies of real estate valuation found in GAAP . Nevertheless, we believe that the use of FFO, which excludes the impact of real estate related depreciation and amortization, among other things, provides a more complete understanding of our performance to investors and to management, and when compared year over year, reflects the impact on our operations from trends in occupancy rates, rental rates, operating costs, general and administrative expenses, and interest costs, which may not be immediately apparent from net income . However, FFO, core funds from operations ("Core FFO") and adjusted funds from operations (“AFFO”), as described below, should not be construed to be more relevant or accurate than the current GAAP methodology in calculating net income or in its applicability in evaluating our operating performance . The method utilized to evaluate the value and performance of real estate under GAAP should be construed as a more relevant measure of operational performance and considered more prominently than the non - GAAP FFO, Core FFO and AFFO measures and the adjustments to GAAP in calculating FFO, Core FFO and AFFO . Other REITs may not define FFO in accordance with the current NAREIT definition (as we do) or may interpret the current NAREIT definition differently than we do or calculate Core FFO or AFFO differently than we do . Consequently, our presentation of FFO, Core FFO and AFFO may not be comparable to other similarly titled measures presented by other REITs . • We consider FFO, Core FFO and AFFO useful indicators of our performance . Because FFO calculations exclude such factors as depreciation and amortization of real estate assets and gains or losses from sales of operating real estate assets (which can vary among owners of identical assets in similar conditions based on historical cost accounting and useful - life estimates), FFO facilitates comparisons of operating performance between periods and between other REITs in our peer group .

23 DEFINITIONS (CONTINUED) • Changes in the accounting and reporting promulgations under GAAP (for acquisition fees and expenses from a capitalization/depreciation model to an expensed - as - incurred model) that were put into effect in 2009 and other changes to GAAP accounting for real estate subsequent to the establishment of NAREIT's definition of FFO have prompted an increase in cash - settled expenses, specifically acquisition fees and expenses for all industries as items that are expensed under GAAP . • In calculating Core FFO, we start with FFO, then we exclude certain non - core items such as acquisition, transaction and other costs, as well as certain other costs that are considered to be non - core, such as debt extinguishment costs, fire loss and other costs related to damages at our properties . The purchase of properties, and the corresponding expenses associated with that process, is a key operational feature of our core business plan to generate operational income and cash flows in order to make dividend payments to stockholders . In evaluating investments in real estate, we differentiate the costs to acquire the investment from the operations derived from the investment . We also add back non - cash write - offs of deferred financing costs and prepayment penalties incurred with the early extinguishment of debt which are included in net income but are considered financing cash flows when paid in the statement of cash flows . We consider these write - offs and prepayment penalties to be capital transactions and not indicative of operations . By excluding expensed acquisition, transaction and other costs as well as non - core costs, we believe Core FFO provides useful supplemental information that is comparable for each type of real estate investment and is consistent with management's analysis of the investing and operating performance of our properties . • In calculating AFFO, we start with Core FFO, then we exclude certain income or expense items from AFFO that we consider more reflective of investing activities, other non - cash income and expense items and the income and expense effects of other activities that are not a fundamental attribute of our business plan . These items include early extinguishment of debt (adjustment included in Core FFO) and unrealized gain and loss, which may not ultimately be realized, such as gain or loss on derivative instruments, gain or loss on foreign currency transactions, and gain or loss on investments . In addition, by excluding non - cash income and expense items such as amortization of above - market and below - market leases intangibles, amortization of deferred financing costs, straight - line rent and equity - based compensation from AFFO, we believe we provide useful information regarding income and expense items which have a direct impact on our ongoing operating performance . We also include the realized gain or loss on foreign currency exchange contracts for AFFO as such items are part of our ongoing operations and affect the current operating performance of the Company . By providing AFFO, we believe we are presenting useful information that can be used to better assess the sustainability of our ongoing operating performance without the impact of transactions or other items that are not related to the ongoing performance of our portfolio of properties . AFFO presented by us may not be comparable to AFFO reported by other REITs that define AFFO differently . • In calculating AFFO, we exclude certain expenses, which under GAAP are characterized as operating expenses in determining operating net income . All paid and accrued merger, acquisition, transaction and other costs (including prepayment penalties for debt extinguishment) and certain other expenses negatively impact our operating performance during the period in which expenses are incurred or properties are acquired will also have negative effects on returns to investors, but are not reflective of our on - going performance . AFFO that excludes such costs and expenses would only be comparable to companies that did not have such activities . Further, under GAAP, certain contemplated non - cash fair value and other non - cash adjustments are considered operating non - cash adjustments to net income . In addition, as discussed above, we view gains and losses from fair value adjustments as items which are unrealized and may not ultimately be realized and not reflective of ongoing operations and are therefore typically adjusted for when assessing operating performance .
24 DEFINITIONS (CONTINUED) • Excluding income and expense items detailed above from our calculation of AFFO provides information consistent with management's analysis of the operating performance of the Company . Additionally, fair value adjustments, which are based on the impact of current market fluctuations and underlying assessments of general market conditions, but can also result from operational factors such as rental and occupancy rates, may not be directly related or attributable to our current operating performance . By excluding such changes that may reflect anticipated and unrealized gains or losses, we believe AFFO provides useful supplemental information . • As a result, we believe that the use of FFO, Core FFO and AFFO, together with the required GAAP presentations, provide a more complete understanding of our performance including relative to our peers and a more informed and appropriate basis on which to make decisions involving operating, financing, and investing activities . • We believe that earnings before interest, taxes, depreciation and amortization (“EBITDA”) adjusted for acquisition and transaction - related expenses, other non - cash items and including our pro - rata share from unconsolidated joint ventures ("Adjusted EBITDA") is an appropriate measure of our ability to incur and service debt . Adjusted EBITDA should not be considered as an alternative to cash flows from operating activities, as a measure of our liquidity or as an alternative to net income as an indicator of our operating activities . Other REITs may calculate Adjusted EBITDA differently and our calculation should not be compared to that of other REITs . • NOI is a non - GAAP financial measure equal to net income (loss), the most directly comparable GAAP financial measure, less discontinued operations, interest, other income and income from preferred equity investments and investment securities, plus corporate general and administrative expense, acquisition and transaction - related expenses, depreciation and amortization, other non - cash expenses and interest expense . NOI is adjusted to include our pro rata share of NOI from unconsolidated joint ventures . We use NOI internally as a performance measure and believe NOI provides useful information to investors regarding our financial condition and results of operations because it reflects only those income and expense items that are incurred at the property level . Therefore, we believe NOI is a useful measure for evaluating the operating performance of our real estate assets and to make decisions about resource allocations . Further, we believe NOI is useful to investors as a performance measure because, when compared across periods, NOI reflects the impact on operations from trends in occupancy rates, rental rates, operating costs and acquisition activity on an unlevered basis, providing perspective not immediately apparent from net income . NOI excludes certain components from net income in order to provide results that are more closely related to a property's results of operations . For example, interest expense is not necessarily linked to the operating performance of a real estate asset and is often incurred at the corporate level as opposed to the property level . In addition, depreciation and amortization, because of historical cost accounting and useful life estimates, may distort operating performance at the property level . NOI presented by us may not be comparable to NOI reported by other REITs that define NOI differently . We believe that in order to facilitate a clear understanding of our operating results, NOI should be examined in conjunction with net income (loss) as presented in our consolidated financial statements . NOI should not be considered as an alternative to net income (loss) as an indication of our performance or to cash flows as a measure of our liquidity . • Cash NOI, is a non - GAAP financial measure that is intended to reflect the performance of our properties . We define Cash NOI as net operating income (which is separately defined herein) excluding amortization of above/below market lease intangibles and straight - line adjustments that are included in GAAP lease revenues . We believe that Cash NOI is a helpful measure that both investors and management can use to evaluate the current financial performance of our properties and it allows for comparison of our operating performance between periods and to other REITs . Cash NOI should not be considered as an alternative to net income, as an indication of our financial performance, or to cash flows as a measure of liquidity or our ability to fund all needs . The method by which we calculate and present Cash NOI may not be directly comparable to the way other REITs present Cash NOI .
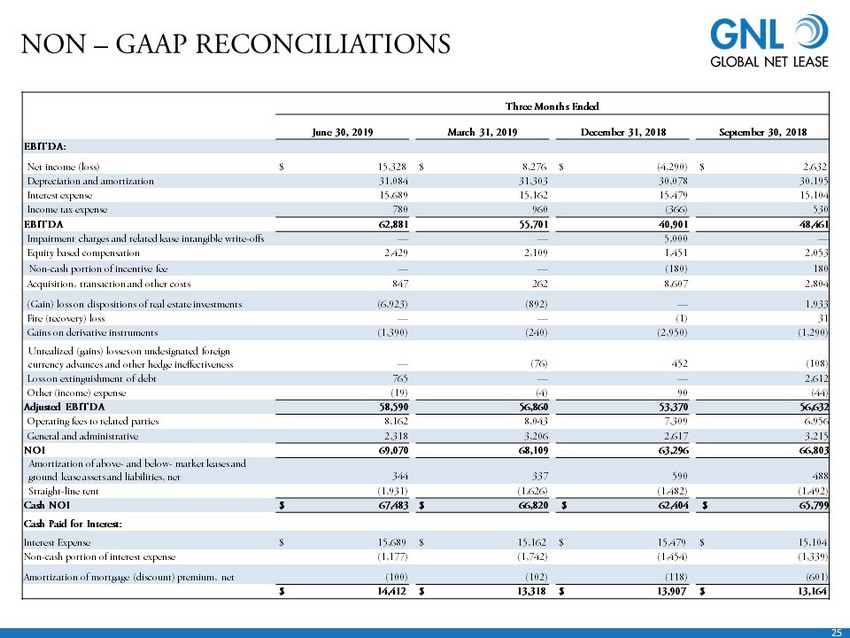
25 NON – GAAP RECONCILIATIONS Three Months Ended June 30, 2019 March 31, 2019 December 31, 2018 September 30, 2018 EBITDA: Net income (loss) $ 15,328 $ 8,276 $ (4,290) $ 2,632 Depreciation and amortization 31,084 31,303 30,078 30,195 Interest expense 15,689 15,162 15,479 15,104 Income tax expense 780 960 (366) 530 EBITDA 62,881 55,701 40,901 48,461 Impairment charges and related lease intangible write - offs — — 5,000 — Equity based compensation 2,429 2,109 1,451 2,053 Non - cash portion of incentive fee — — (180) 180 Acquisition, transaction and other costs 847 262 8,607 2,804 (Gain) loss on dispositions of real estate investments (6,923) (892) — 1,933 Fire (recovery) loss — — (1) 31 Gains on derivative instruments (1,390) (240) (2,950) (1,290) Unrealized (gains) losses on undesignated foreign currency advances and other hedge ineffectiveness — (76) 452 (108) Loss on extinguishment of debt 765 — — 2,612 Other (income) expense (19) (4) 90 (44) Adjusted EBITDA 58,590 56,860 53,370 56,632 Operating fees to related parties 8,162 8,043 7,309 6,956 General and administrative 2,318 3,206 2,617 3,215 NOI 69,070 68,109 63,296 66,803 Amortization of above - and below - market leases and ground lease assets and liabilities, net 344 337 590 488 Straight - line rent (1,931) (1,626) (1,482) (1,492) Cash NOI $ 67,483 $ 66,820 $ 62,404 $ 65,799 Cash Paid for Interest: Interest Expense $ 15,689 $ 15,162 $ 15,479 $ 15,104 Non - cash portion of interest expense (1,177) (1,742) (1,454) (1,339) Amortization of mortgage (discount) premium, net (100) (102) (118) (601) $ 14,412 $ 13,318 $ 13,907 $ 13,164

26 FFO AND AFFO RECONCILIATIONS Three Months Ended June 30, 2019 March 31, 2019 December 31, 2018 September 30, 2018 June 30, 2018 Funds from operations (FFO): Net income (loss) attributable to common stockholders (in accordance with GAAP) $ 12,621 $ 5,791 $ (6,744) $ 177 $ 5,288 Impairment charges — — 5,000 — — Depreciation and amortization 31,084 31,303 30,078 30,195 29,813 (Gain) loss on dispositions of real estate investments (6,923) (892) — 1,933 3,818 FFO (as defined by NAREIT) attributable to stockholders 36,782 36,202 28,334 32,305 38,919 Acquisition, transaction and other costs (1) 847 262 8,607 2,804 1,114 Loss on extinguishment of debt (2) 765 — — 2,612 1,285 Fire (recovery) loss (3) — — (1) 31 (1) Core FFO attributable to stockholders 38,394 36,464 36,940 37,752 41,317 Non - cash equity based compensation 2,429 2,109 1,451 2,053 (23) Non - cash portion of incentive fee — — (180) 180 — Non - cash portion of interest expense 1,177 1,742 1,454 1,339 1,499 Amortization of above and below - market leases and ground lease assets and liabilities, net 344 337 590 488 500 Straight - line rent (1,931) (1,626) (1,482) (1,492) (1,833) Unrealized (gain) loss on undesignated foreign currency advances and other hedge ineffectiveness — (76) 452 (108) 47 Eliminate unrealized (gains) losses on foreign currency transactions (4) (455) 452 (2,206) (1,215) (6,256) Amortization of mortgage discounts and premiums, net 100 102 118 601 263 Adjusted funds from operations (AFFO) attributable to stockholders (5) $ 40,058 $ 39,504 $ 37,137 $ 39,598 $ 35,514 Basic weighted - average shares outstanding 83,847 81,475 73,554 69,442 67,292 Diluted weighted - average shares outstanding 85,166 82,798 74,001 69,442 67,292 FFO per share $ 0.43 $ 0.44 $ 0.38 $ 0.47 $ 0.58 Core FFO per share $ 0.45 $ 0.44 $ 0.50 $ 0.54 $ 0.61 Dividends declared (6) $ 14,940 $ 43,297 $ 39,119 $ 36,769 $ 35,828 1. Primarily includes litigation costs resulting from the termination of the Former Service Provider, costs to refinance foreign de bt and fees associated with the exploration of a potential equity offering. 2. For the three months ended June 30, 2019, includes non - cash write - off of deferred financing costs. For the three months ended Se ptember 30, 2018, includes non - cash write - off of deferred financing costs of $1.5 million and prepayment penalties paid on early extinguishment of debt of $1.1 million. Prepayment penalties paid on early extinguishment of debt of $1.3 million that occurred during the three months ended June 30, 2018 were previously classified as acquisition and transaction fees and have been reclassified as loss on extinguishment of debt in the table abov e. 3. (Recovery) loss arising from clean - up costs related to a fire sustained at one of our office properties. 4. For AFFO purposes, we add back unrealized (gain) loss. For the three months ended June 30, 2019, gains on derivative instrume nts were $1.4 million, which consisted of unrealized gains of $0.5 million and realized gains of $0.9 million. For the three months ended March 31, 2019, gains on derivative instruments were $0.2 million, which consisted o f u nrealized losses of $0.5 million and realized gains of $0.7 million. For the three months ended December 31, 2018, gains on derivative instruments were $3.0 million, which were comprised of unrealized gains of $2.2 millio n a nd realized gains of $0.8 million. For the three months ended September 30, 2018, gains on derivative instruments were $1.3 million which consisted of unrealized gains of $1.2 million and realized gains of $0.1 milli on. For the three months ended June 30, 2018, gains on derivative instruments were $6.3 million which primarily comprised of unrealized gains. 5. AFFO for the three months ended September 30, 2018 includes income from a lease termination fee of $3.0 million, which was re cor ded in rental income in the unaudited consolidated statements of operations, related to a real estate asset sold during the three months ended September 30, 2018. 6. Dividends declared to common stockholders only, and do not include distributions to non - controlling interest holders or holders of Series A Preferred Stock. See slide 15 for discussion on change of common stock dividend policy.

INVESTOR INQUIRIES 1 - 866 - 902 - 0063 investorrelations@globalnetlease.com www.GlobalNetLease.com