EXHIBIT 99.2
Global Net Lease, Inc.
Supplemental Information
Quarter ended June 30, 2019 (unaudited)
|
| | |
| Global Net Lease, Inc. |
| Supplemental Information |
| Quarter ended June 30, 2019 (Unaudited) |
|
| | |
| Table of Contents | | |
| | | |
| Item | | Page |
| Non-GAAP Definitions | | 3 |
| Key Metrics | | 6 |
| Consolidated Balance Sheets | | 7 |
| Consolidated Statements of Operations | | 8 |
| Non-GAAP Measures | | 9 |
| Debt Overview | | 11 |
| Future Minimum Lease Rents | | 12 |
| Top Ten Tenants | | 13 |
| Diversification by Property Type | | 14 |
| Diversification by Tenant Industry | | 15 |
| Diversification by Geography | | 16 |
| Lease Expirations | | 17 |
| | | |
| Please note that totals may not add due to rounding. | | |
Forward-looking Statements:
This supplemental package includes “forward looking statements”. These forward-looking statements involve risks and uncertainties that could cause actual results or events to be materially different. In addition, words such as “may,” “will,” “seeks,” “anticipates,” “believes,” “estimates,” “expects,” “plans,” “intends,” “would,” or similar expressions indicate a forward-looking statement, although not all forward-looking statements contain these identifying words. Any statements referring to the future value of an investment in GNL, as well as the success that GNL may have in executing its business plan, are also forward-looking statements. There are a number of risks, uncertainties and other important factors that could cause GNL’s actual results to differ materially from those contemplated by such forward-looking statements, including those risks, uncertainties and other important factors set forth in the “Risk Factors” and “Management’s Discussion and Analysis of Financial Condition and Results of Operations” sections of GNL’s Annual Report on Form 10-K for the year ended December 31, 2018 filed on February 28, 2019 and all other filings with the SEC after that date, as such risks, uncertainties and other important factors may be updated from time to time in GNL’s subsequent reports. Further, forward looking statements speak only as of the date they are made, and GNL undertakes no obligation to update or revise forward-looking statements to reflect changed assumptions, the occurrence of unanticipated events or changes to future operating results over time, except as required by law. Prospective investors should not place undue reliance on any forward-looking statements, which are based only on information currently available to the Company (or to third parties making the forward-looking statements).
|
| | |
| Global Net Lease, Inc. |
| Supplemental Information |
| Quarter ended June 30, 2019 (Unaudited) |
Non-GAAP Financial Measures
This section includes non-GAAP financial measures, including Funds from Operations (“FFO”), Core Funds from Operations (“Core FFO”) and Adjusted Funds from Operations (“AFFO”), Adjusted Earnings before Interest, Taxes, Depreciation and Amortization (“Adjusted EBITDA”), Net Operating Income (“NOI”), and Cash Net Operating Income (“Cash NOI”). A description of these non-GAAP measures and reconciliations to the most directly comparable GAAP measure, which is net income, is provided below.
Caution on Use of Non-GAAP Measures
FFO, Core FFO, AFFO, Adjusted EBITDA, NOI, and Cash NOI should not be construed to be more relevant or accurate than the current GAAP methodology in calculating net income or in its applicability in evaluating our operating performance. The method utilized to evaluate the value and performance of real estate under GAAP should be construed as a more relevant measure of operational performance and considered more prominently than the non-GAAP measures.
Other REITs may not define FFO in accordance with the current National Association of Real Estate Investment Trusts (“NAREIT”) definition (as we do), or may interpret the current NAREIT definition differently than we do, or may calculate Core FFO or AFFO differently than we do. Consequently, our presentation of FFO, Core FFO and AFFO may not be comparable to other similarly-titled measures presented by other REITs.
We consider FFO, Core FFO and AFFO useful indicators of our performance. Because FFO, Core FFO and AFFO calculations exclude such factors as depreciation and amortization of real estate assets and gains or losses from sales of operating real estate assets (which can vary among owners of identical assets in similar conditions based on historical cost accounting and useful-life estimates), FFO, Core FFO and AFFO presentations facilitate comparisons of operating performance between periods and between other REITs.
As a result, we believe that the use of FFO, Core FFO and AFFO, together with the required GAAP presentations, provide a more complete understanding of our operating performance including relative to our peers and a more informed and appropriate basis on which to make decisions involving operating, financing, and investing activities. However, FFO, Core FFO and AFFO are not indicative of cash available to fund ongoing cash needs, including the ability to make cash distributions. Investors are cautioned that FFO, Core FFO and AFFO should only be used to assess the sustainability of our operating performance excluding these activities, as they exclude certain costs that have a negative effect on our operating performance during the periods in which these costs are incurred.
Funds from Operations, Core Funds from Operations and Adjusted Funds from Operations
Funds From Operations
Due to certain unique operating characteristics of real estate companies, as discussed below, NAREIT, an industry trade group, has promulgated a measure known as FFO, which we believe to be an appropriate supplemental measure to reflect the operating performance of a REIT. FFO is not equivalent to net income or loss as determined under GAAP.
We define FFO, a non-GAAP measure, consistent with the standards established over time by the Board of Governors of NAREIT, as restated in a White Paper approved by the Board of Governors of NAREIT effective in December 2018 (the “White Paper”). The White Paper defines FFO as net income or loss computed in accordance with GAAP, excluding depreciation and amortization related to real estate, gains and losses from the sale of certain real estate assets, gains and losses from change in control and impairment write-downs of certain real estate assets and investments in entities when the impairment is directly attributable to decreases in the value of depreciable real estate held by the entity. Adjustments for unconsolidated partnerships and joint ventures are calculated to reflect FFO. Our FFO calculation complies with NAREIT’s definition.
The historical accounting convention used for real estate assets requires straight-line depreciation of buildings and improvements, and straight-line amortization of intangibles, which implies that the value of a real estate asset diminishes predictably over time, especially if not adequately maintained or repaired and renovated as required by relevant circumstances or as requested or required by lessees for operational purposes in order to maintain the value disclosed. We believe that, because real estate values historically rise and fall with market conditions, including inflation, interest rates, unemployment and consumer spending, presentations of operating results for a REIT using historical accounting for depreciation and certain other items may be less informative. Historical accounting for real estate involves the use of GAAP. Any other method of accounting for real estate such as the fair value method cannot be construed to be any more accurate or relevant than the comparable methodologies of real estate valuation found in GAAP. Nevertheless, we believe that the use of FFO, which excludes the impact of real estate related depreciation and amortization, among other things, provides a more complete understanding of our performance to investors and to management, and when compared year over year, reflects the impact on our operations from trends in occupancy rates, rental rates, operating costs, general and administrative expenses, and interest costs, which may not be immediately apparent from net income.
|
| | |
| Global Net Lease, Inc. |
| Supplemental Information |
| Quarter ended June 30, 2019 (Unaudited) |
Core Funds From Operations
In calculating Core FFO, we start with FFO, then we exclude certain non-core items such as acquisition, transaction and other costs, as well as certain other costs that are considered to be non-core, such as debt extinguishment costs, fire loss and other costs related to damages at our properties. The purchase of properties, and the corresponding expenses associated with that process, is a key operational feature of our core business plan to generate operational income and cash flows in order to make dividend payments to stockholders. In evaluating investments in real estate, we differentiate the costs to acquire the investment from the operations derived from the investment. We also add back non-cash write-offs of deferred financing costs and prepayment penalties incurred with the early extinguishment of debt which are included in net income but are considered financing cash flows when paid in the statement of cash flows. We consider these write-offs and prepayment penalties to be capital transactions and not indicative of operations. By excluding expensed acquisition, transaction and other costs as well as non-core costs, we believe Core FFO provides useful supplemental information that is comparable for each type of real estate investment and is consistent with management’s analysis of the investing and operating performance of our properties.
Adjusted Funds From Operations
In calculating AFFO, we start with Core FFO, then we exclude certain income or expense items from AFFO that we consider more reflective of investing activities, other non-cash income and expense items and the income and expense effects of other activities that are not a fundamental attribute of our business plan. These items include early extinguishment of debt (adjustment included in Core FFO) and unrealized gains and losses, which may not ultimately be realized, such as gains or losses on derivative instruments, gains and losses on foreign currency transactions, and gains and losses on investments. In addition, by excluding non-cash income and expense items such as amortization of above-market and below-market leases intangibles, amortization of deferred financing costs, straight-line rent and equity-based compensation from AFFO, we believe we provide useful information regarding income and expense items which have a direct impact on our ongoing operating performance. We also include the realized gains or losses on foreign currency exchange contracts for AFFO as such items are part of our ongoing operations and affect our current operating performance. By providing AFFO, we believe we are presenting useful information that can be used to better assess the sustainability of our ongoing operating performance without the impacts of transactions that are not related to the ongoing profitability of our portfolio of properties. AFFO presented by us may not be comparable to AFFO reported by other REITs that define AFFO differently.
In calculating AFFO, we exclude certain expenses which under GAAP are characterized as operating expenses in determining operating net income. All paid and accrued merger, acquisition, transaction and other costs (including prepayment penalties for debt extinguishments) and certain other expenses negatively impact our operating performance during the period in which expenses are incurred or properties are acquired will also have negative effects on returns to investors, but are not reflective of on-going performance. Further, under GAAP, certain contemplated non-cash fair value and other non-cash adjustments are considered operating non-cash adjustments to net income. In addition, as discussed above, we view gains and losses from fair value adjustments as items which are unrealized and may not ultimately be realized and not reflective of ongoing operations and are therefore typically adjusted for when assessing operating performance. Excluding income and expense items detailed above from our calculation of AFFO provides information consistent with management’s analysis of our operating performance. Additionally, fair value adjustments, which are based on the impact of current market fluctuations and underlying assessments of general market conditions, but can also result from operational factors such as rental and occupancy rates, may not be directly related or attributable to our current operating performance. By excluding such changes that may reflect anticipated and unrealized gains or losses, we believe AFFO provides useful supplemental information. We believe that in order to facilitate a clear understanding of our operating results, AFFO should be examined in conjunction with net income (loss) as presented in our consolidated financial statements. AFFO should not be considered as an alternative to net income (loss) as an indication of our performance or to cash flows as a measure of our liquidity or ability to make distributions.
Adjusted Earnings before Interest, Taxes, Depreciation and Amortization, Net Operating Income, and Cash Net Operating Income.
We believe that Adjusted EBITDA, which is defined as earnings before interest, taxes, depreciation and amortization adjusted for acquisition, transaction and other costs, other non-cash items and including our pro-rata share from unconsolidated joint ventures, is an appropriate measure of our ability to incur and service debt. Adjusted EBITDA should not be considered as an alternative to cash flows from operating activities, as a measure of our liquidity or as an alternative to net income as an indicator of our operating activities. Other REITs may calculate Adjusted EBITDA differently and our calculation should not be compared to that of other REITs.
NOI is a non-GAAP financial measure equal to net income (loss), the most directly comparable GAAP financial measure, less discontinued operations, interest, other income and income from preferred equity investments and investment securities, plus corporate general and administrative expense, acquisition, transaction and other costs, depreciation and amortization, other non-
|
| | |
| Global Net Lease, Inc. |
| Supplemental Information |
| Quarter ended June 30, 2019 (Unaudited) |
cash expenses and interest expense. NOI is adjusted to include our pro rata share of NOI from unconsolidated joint ventures. We use NOI internally as a performance measure and believe NOI provides useful information to investors regarding our financial condition and results of operations because it reflects only those income and expense items that are incurred at the property level. Therefore, we believe NOI is a useful measure for evaluating the operating performance of our real estate assets and to make decisions about resource allocations. Further, we believe NOI is useful to investors as a performance measure because, when compared across periods, NOI reflects the impact on operations from trends in occupancy rates, rental rates, operating costs and acquisition activity on an unlevered basis, providing perspective not immediately apparent from net income. NOI excludes certain components from net income in order to provide results that are more closely related to a property’s results of operations. For example, interest expense is not necessarily linked to the operating performance of a real estate asset and is often incurred at the corporate level as opposed to the property level. In addition, depreciation and amortization, because of historical cost accounting and useful life estimates, may distort operating performance at the property level. NOI presented by us may not be comparable to NOI reported by other REITs that define NOI differently. We believe that in order to facilitate a clear understanding of our operating results, NOI should be examined in conjunction with net income (loss) as presented in our consolidated financial statements. NOI should not be considered as an alternative to net income (loss) as an indication of our performance or to cash flows as a measure of our liquidity.
Cash NOI, is a non-GAAP financial measure that is intended to reflect the performance of our properties. We define Cash NOI as net operating income (which is separately defined herein) excluding amortization of above/below market lease intangibles and straight-line adjustments that are included in GAAP lease revenues. We believe that Cash NOI is a helpful measure that both investors and management can use to evaluate the current financial performance of our properties and it allows for comparison of our operating performance between periods and to other REITs. Cash NOI should not be considered as an alternative to net income, as an indication of our financial performance, or to cash flows as a measure of liquidity or our ability to fund all needs. The method by which we calculate and present Cash NOI may not be directly comparable to the way other REITs present Cash NOI.
|
| | |
| Global Net Lease, Inc. |
| Supplemental Information |
| Quarter ended June 30, 2019 (Unaudited) |
Key Metrics
As of and for the three months ended June 30, 2019
Amounts in thousands, except per share data, ratios and percentages
|
| | | | |
| Financial Results | | |
| Revenue from tenants | | $ | 76,119 |
|
| Net income attributable to common stockholders | | $ | 12,621 |
|
Basic and diluted net income per share attributable to common stockholders [1] | | $ | 0.15 |
|
Cash NOI [2] | | $ | 67,483 |
|
Adjusted EBITDA [2] | | $ | 58,590 |
|
AFFO attributable to common stockholders [2] | | $ | 40,058 |
|
Dividends per share - second quarter [3] | | $ | 0.53 |
|
| Dividend yield - annualized, based on quarter end share price | | 10.8 | % |
| | | |
| Balance Sheet and Capitalization | | |
| Equity market capitalization - based on quarter end share price of $19.62 for common shares and $25.50 for preferred shares | | $ | 1,797,295 |
|
Net debt [4] [5] | | 1,660,723 |
|
| Enterprise value | | 3,458,018 |
|
| | | |
| Total capitalization | | 3,636,740 |
|
| | | |
Total consolidated debt [5] | | 1,839,445 |
|
| Total assets | | 3,494,759 |
|
Liquidity [6] | | 269,441 |
|
| | | |
| Common shares outstanding as of June 30, 2019 (thousands) | | 83,862 |
|
| Share price, end of quarter | | $ | 19.62 |
|
| | | |
| Net debt to enterprise value | | 48.0 | % |
| Net debt to adjusted EBITDA (annualized) | | 7.1 | x |
| | | |
Weighted-average interest rate cost [7] | | 3.0 | % |
Weighted-average debt maturity (years) [8] | | 4.6 |
|
Interest Coverage Ratio [9] | | 4.1 | x |
| | | |
| Real Estate Portfolio | | |
| Number of properties | | 288 |
|
| Number of tenants | | 119 |
|
| | | |
| Square footage (millions) | | 28.3 |
|
| Leased | | 99.6 | % |
Weighted-average remaining lease term (years) [10] | | 8.0 |
|
Footnotes:
[1] Adjusted for net income (loss) attributable to common stockholders for common share equivalents.
[2] This Non-GAAP metric is reconciled below.
[3] Represents quarterly dividend per share rate based off the annualized dividend rate of $2.13.
[4] Includes the effect of cash and cash equivalents.
[5] Excludes the effect of deferred financing costs, net and mortgage (discount) premium, net.
[6] Liquidity includes $90.7 million of availability under the credit facility and cash and cash equivalents.
[7] The weighted average interest rate cost is based on the outstanding principal balance of the debt.
[8] The weighted average debt maturity is based on the outstanding principal balance of the debt.
[9] The interest coverage ratio is calculated by dividing adjusted EBITDA by cash paid for interest (interest expense less non cash portion of interest expense and amortization of mortgage (discount) premium, net) for the quarter ended June 30, 2019. Adjusted EBITDA and cash paid for interest are Non-GAAP metrics and are reconciled below.
[10] The weighted-average remaining lease term (years) is based on square feet.
|
| | |
| Global Net Lease, Inc. |
| Supplemental Information |
| Quarter ended June 30, 2019 |
Consolidated Balance Sheets
Amounts in thousands
|
| | | | | | | | |
| | | June 30,
2019 | | December 31,
2018 |
| | | (Unaudited) | | |
| ASSETS | | | | |
| Real estate investments, at cost: | | | | |
| Land | | $ | 389,589 |
| | $ | 398,911 |
|
| Buildings, fixtures and improvements | | 2,441,341 |
| | 2,345,202 |
|
| Construction in progress | | 12,821 |
| | 1,235 |
|
| Acquired intangible lease assets | | 653,665 |
| | 675,551 |
|
| Total real estate investments, at cost | | 3,497,416 |
| | 3,420,899 |
|
| Less accumulated depreciation and amortization | | (481,639 | ) | | (437,974 | ) |
| Total real estate investments, net | | 3,015,777 |
| | 2,982,925 |
|
| Assets held for sale | | 121,064 |
| | 112,902 |
|
| Cash and cash equivalents | | 178,722 |
| | 100,324 |
|
| Restricted cash | | 12,953 |
| | 3,369 |
|
| Derivative assets, at fair value | | 5,658 |
| | 8,730 |
|
| Unbilled straight-line rent | | 50,613 |
| | 47,183 |
|
| Prepaid expenses and other assets | | 79,476 |
| | 22,245 |
|
| Due from related parties | | 20 |
| | 16 |
|
| Deferred tax assets | | 3,288 |
| | 3,293 |
|
| Goodwill and other intangible assets, net | | 22,098 |
| | 22,180 |
|
| Deferred financing costs, net | | 5,090 |
| | 6,311 |
|
| Total Assets | | $ | 3,494,759 |
| | $ | 3,309,478 |
|
| | | | | |
| LIABILITIES AND EQUITY | | | | |
| Mortgage notes payable, net | | $ | 1,286,033 |
| | $ | 1,129,807 |
|
| Revolving credit facility | | 259,527 |
| | 363,894 |
|
| Term loan, net | | 277,403 |
| | 278,727 |
|
| Acquired intangible lease liabilities, net | | 32,724 |
| | 35,757 |
|
| Derivative liabilities, at fair value | | 7,204 |
| | 3,886 |
|
| Due to related parties | | 124 |
| | 790 |
|
| Accounts payable and accrued expenses | | 46,244 |
| | 31,529 |
|
| Prepaid rent | | 21,119 |
| | 16,223 |
|
| Deferred tax liability | | 15,140 |
| | 15,227 |
|
| Taxes payable | | 613 |
| | 2,228 |
|
| Dividends payable | | 3,001 |
| | 2,664 |
|
| Total Liabilities | | 1,949,132 |
| | 1,880,732 |
|
| Commitments and contingencies | | — |
| | — |
|
| Stockholders’ Equity: | | | | |
7.25% Series A cumulative redeemable preferred shares
| | 59 |
| | 54 |
|
| Common stock | | 2,169 |
| | 2,091 |
|
| Additional paid-in capital | | 2,196,183 |
| | 2,031,981 |
|
| Accumulated other comprehensive (loss) income | | (3,982 | ) | | 6,810 |
|
| Accumulated deficit | | (656,411 | ) | | (615,448 | ) |
| Total Stockholders’ Equity | | 1,538,018 |
| | 1,425,488 |
|
| Non-controlling interest | | 7,609 |
| | 3,258 |
|
| Total Equity | | 1,545,627 |
| | 1,428,746 |
|
| Total Liabilities and Equity | | $ | 3,494,759 |
| | $ | 3,309,478 |
|
|
| | |
| Global Net Lease, Inc. |
| Supplemental Information |
| Quarter ended June 30, 2019 (Unaudited) |
Consolidated Statements of Operations
Amounts in thousands, except per share data
|
| | | | | | | | | | | | | | | | |
| | | Three Months Ended |
| | | June 30,
2019 | | March 31,
2019 | | December 31, 2018 | | September 30,
2018 |
| Revenue from tenants | | $ | 76,119 |
| | $ | 75,468 |
| | $ | 71,226 |
| | $ | 71,924 |
|
| | | | | | | | | |
| Expenses: | | | | | | | | |
| Property operating | | 7,049 |
| | 7,359 |
| | 7,750 |
| | 5,301 |
|
| Fire (recovery) loss | | — |
| | — |
| | (1 | ) | | 31 |
|
| Operating fees to related parties | | 8,162 |
| | 8,043 |
| | 7,309 |
| | 6,956 |
|
| Impairment charges and related lease intangible write-offs | | — |
| | — |
| | 5,000 |
| | — |
|
| Acquisition, transaction and other costs | | 847 |
| | 262 |
| | 8,607 |
| | 2,804 |
|
| General and administrative | | 2,318 |
| | 3,206 |
| | 2,617 |
| | 3,215 |
|
| Equity-based compensation | | 2,429 |
| | 2,109 |
| | 1,451 |
| | 2,053 |
|
| Depreciation and amortization | | 31,084 |
| | 31,303 |
| | 30,078 |
| | 30,195 |
|
| Total expenses | | 51,889 |
| | 52,282 |
| | 62,811 |
| | 50,555 |
|
| Operating income before loss on dispositions of real estate investments | | 24,230 |
| | 23,186 |
| | 8,415 |
| | 21,369 |
|
| Gain (loss) on dispositions of real estate investments | | 6,923 |
| | 892 |
| | — |
| | (1,933 | ) |
| Operating income | | 31,153 |
| | 24,078 |
| | 8,415 |
| | 19,436 |
|
| Other income (expense): | | | | | | | | |
| Interest expense | | (15,689 | ) | | (15,162 | ) | | (15,479 | ) | | (15,104 | ) |
| Loss on extinguishment of debt | | (765 | ) | | — |
| | — |
| | (2,612 | ) |
| Gain on derivative instruments | | 1,390 |
| | 240 |
| | 2,950 |
| | 1,290 |
|
| Unrealized gain (loss) on undesignated foreign currency advances and other hedge ineffectiveness | | — |
| | 76 |
| | (452 | ) | | 108 |
|
| Other income (expense) | | 19 |
| | 4 |
| | (90 | ) | | 44 |
|
| Total other expense, net | | (15,045 | ) | | (14,842 | ) | | (13,071 | ) | | (16,274 | ) |
| Net income (loss) before income taxes | | 16,108 |
| | 9,236 |
| | (4,656 | ) | | 3,162 |
|
| Income tax (expense) benefit | | (780 | ) | | (960 | ) | | 366 |
| | (530 | ) |
| Net income (loss) | | 15,328 |
| | 8,276 |
| | (4,290 | ) | | 2,632 |
|
| Preferred stock dividends | | (2,707 | ) | | (2,485 | ) | | (2,454 | ) | | (2,455 | ) |
| Net income (loss) attributable to common stockholders | | $ | 12,621 |
| | $ | 5,791 |
| | $ | (6,744 | ) | | $ | 177 |
|
| | | | | | | | | |
| Basic and Diluted Earnings Per Share: | | | | | | | | |
| Basic and diluted net income (loss) per share attributable to common stockholders | | $ | 0.15 |
| | $ | 0.07 |
| | $ | (0.09 | ) | | $ | — |
|
| Weighted average shares outstanding: | | | | | | | | |
| Basic | | 83,847 |
| | 81,475 |
| | 73,554 |
| | 69,442 |
|
| Diluted | | 85,166 |
| | 82,798 |
| | 74,001 |
| | 69,442 |
|
|
| | |
| Global Net Lease, Inc. |
| Supplemental Information |
| Quarter ended June 30, 2019 (Unaudited) |
Non-GAAP Measures
Amounts in thousands, except per share data
|
| | | | | | | | | | | | | | | | |
| | | Three Months Ended |
| | | June 30,
2019 | | March 31, 2019 | | December 31, 2018 | | September 30,
2018 |
| EBITDA: | | | | | | | | |
| Net income (loss) | | $ | 15,328 |
| | $ | 8,276 |
| | $ | (4,290 | ) | | $ | 2,632 |
|
| Depreciation and amortization | | 31,084 |
| | 31,303 |
| | 30,078 |
| | 30,195 |
|
| Interest expense | | 15,689 |
| | 15,162 |
| | 15,479 |
| | 15,104 |
|
| Income tax expense (benefit) | | 780 |
| | 960 |
| | (366 | ) | | 530 |
|
| EBITDA | | 62,881 |
| | 55,701 |
| | 40,901 |
| | 48,461 |
|
| Impairment related charges and related lease intangible write-offs | | — |
| | — |
| | 5,000 |
| | — |
|
| Equity-based compensation | | 2,429 |
| | 2,109 |
| | 1,451 |
| | 2,053 |
|
| Non-cash portion of incentive fee | | — |
| | — |
| | (180 | ) | | 180 |
|
| Acquisition, transaction and other costs | | 847 |
| | 262 |
| | 8,607 |
| | 2,804 |
|
| (Gain) loss on dispositions of real estate investments | | (6,923 | ) | | (892 | ) | | — |
| | 1,933 |
|
| Fire (recovery) loss | | — |
| | — |
| | (1 | ) | | 31 |
|
| Gain on derivative instruments | | (1,390 | ) | | (240 | ) | | (2,950 | ) | | (1,290 | ) |
| Unrealized (income) loss on undesignated foreign currency advances and other hedge ineffectiveness | | — |
| | (76 | ) | | 452 |
| | (108 | ) |
| Loss on extinguishment of debt | | 765 |
| | — |
| | — |
| | 2,612 |
|
| Other (income) expense | | (19 | ) | | (4 | ) | | 90 |
| | (44 | ) |
| Adjusted EBITDA | | 58,590 |
| | 56,860 |
| | 53,370 |
| | 56,632 |
|
| Operating fees to related parties | | 8,162 |
| | 8,043 |
| | 7,309 |
| | 6,956 |
|
| General and administrative | | 2,318 |
| | 3,206 |
| | 2,617 |
| | 3,215 |
|
| NOI | | 69,070 |
| | 68,109 |
| | 63,296 |
| | 66,803 |
|
| Amortization of above- and below- market leases and ground lease assets and liabilities, net | | 344 |
| | 337 |
| | 590 |
| | 488 |
|
| Straight-line rent | | (1,931 | ) | | (1,626 | ) | | (1,482 | ) | | (1,492 | ) |
| Cash NOI | | $ | 67,483 |
| | $ | 66,820 |
| | $ | 62,404 |
| | $ | 65,799 |
|
| | | | | | | | | |
| Cash Paid for Interest: | | | | | | | | |
| Interest Expense | | $ | 15,689 |
| | $ | 15,162 |
| | $ | 15,479 |
| | $ | 15,104 |
|
| Non-cash portion of interest expense | | (1,177 | ) | | (1,742 | ) | | (1,454 | ) | | (1,339 | ) |
| Amortization of mortgage (discount) premium, net | | (100 | ) | | (102 | ) | | (118 | ) | | (601 | ) |
| Total cash paid for interest | | $ | 14,412 |
| | $ | 13,318 |
| | $ | 13,907 |
| | $ | 13,164 |
|
|
| | |
| Global Net Lease, Inc. |
| Supplemental Information |
| Quarter ended June 30, 2019 (Unaudited) |
Non-GAAP Measures
Amounts in thousands, except per share data
|
| | | | | | | | | | | | | | | | |
| | | Three Months Ended |
| | | June 30,
2019 | | March 31,
2019 | | December 31,
2018 | | September 30,
2018 |
| Funds from operations (FFO): | | | | | | | | |
| Net income (loss) attributable to common stockholders (in accordance with GAAP) | | $ | 12,621 |
| | $ | 5,791 |
| | $ | (6,744 | ) | | $ | 177 |
|
| Impairment related charges and related lease intangible write-offs | | — |
| | — |
| | 5,000 |
| | — |
|
| Depreciation and amortization | | 31,084 |
| | 31,303 |
| | 30,078 |
| | 30,195 |
|
| (Gain) loss on dispositions of real estate investments | | (6,923 | ) | | (892 | ) | | — |
| | 1,933 |
|
| FFO (as defined by NAREIT) attributable to common stockholders | | 36,782 |
| | 36,202 |
| | 28,334 |
| | 32,305 |
|
Acquisition, transaction and other costs [1] | | 847 |
| | 262 |
| | 8,607 |
| | 2,804 |
|
Loss on extinguishment of debt [2] | | 765 |
| | — |
| | — |
| | 2,612 |
|
Fire (recovery) loss [3] | | — |
| | — |
| | (1 | ) | | 31 |
|
| Core FFO attributable to common stockholders | | 38,394 |
| | 36,464 |
| | 36,940 |
| | 37,752 |
|
| Non-cash equity-based compensation | | 2,429 |
| | 2,109 |
| | 1,451 |
| | 2,053 |
|
| Non-cash portion of incentive fee | | — |
| | — |
| | (180 | ) | | 180 |
|
| Non-cash portion of interest expense | | 1,177 |
| | 1,742 |
| | 1,454 |
| | 1,339 |
|
| Amortization of above and below-market leases and ground lease assets and liabilities, net | | 344 |
| | 337 |
| | 590 |
| | 488 |
|
| Straight-line rent | | (1,931 | ) | | (1,626 | ) | | (1,482 | ) | | (1,492 | ) |
| Unrealized (income) loss on undesignated foreign currency advances and other hedge ineffectiveness | | — |
| | (76 | ) | | 452 |
| | (108 | ) |
Eliminate unrealized (gains) losses on foreign currency transactions [4] | | (455 | ) | | 452 |
| | (2,206 | ) | | (1,215 | ) |
| Amortization of mortgage discounts and premiums, net | | 100 |
| | 102 |
| | 118 |
| | 601 |
|
Adjusted funds from operations (AFFO) attributable to common stockholders [5] | | $ | 40,058 |
| | $ | 39,504 |
| | $ | 37,137 |
| | $ | 39,598 |
|
| | | | | | | | | |
| Weighted average common shares outstanding - Basic | | 83,847 |
| | 81,475 |
| | 73,554 |
| | 69,442 |
|
| Weighted average common shares outstanding - Diluted | | 85,166 |
| | 82,798 |
| | 74,001 |
| | 69,442 |
|
| Net income per share attributable to common shareholders | | $ | 0.15 |
| | $ | 0.07 |
| | $ | (0.09 | ) | | $ | — |
|
| FFO per diluted common share | | $ | 0.43 |
| | $ | 0.44 |
| | $ | 0.38 |
| | $ | 0.47 |
|
| Core FFO per diluted common share | | $ | 0.45 |
| | $ | 0.44 |
| | $ | 0.50 |
| | $ | 0.54 |
|
| AFFO per diluted common share | | $ | 0.47 |
| | $ | 0.48 |
| | $ | 0.50 |
| | $ | 0.57 |
|
Dividends declared [6] | | $ | 14,940 |
| | $ | 43,297 |
| | $ | 39,119 |
| | $ | 36,769 |
|
Footnotes:
[1] Primarily includes litigation costs resulting from the termination of the Former Service Provider, costs to refinance foreign debt and fees associated with the exploration of a potential equity offering.
[2] For the three months ended September 30, 2018, includes non-cash write-off of deferred financing costs of $1.5 million and prepayment penalties paid on early extinguishment of debt of $1.1 million. Prepayment penalties paid on early extinguishment of debt of $1.3 million that occurred during the three months ended June 30, 2018 were previously classified as acquisition and transaction fees and have been reclassified as loss on extinguishment of debt in the table above.
[3] Loss (recovery) arising from clean-up costs related to a fire sustained at one of our office properties.
[4] For AFFO purposes, we add back unrealized (gain) loss. For the three months ended June 30, 2019, gains on derivative instruments were $1.4 million which consisted of unrealized gains of $0.5 million and realized gains of $0.9 million. For the three months ended March 31, 2019, gains on derivative instruments were $0.2 million which consisted of unrealized losses of $0.5 million and realized gains of $0.7 million. For the three months ended December 31, 2018, gains on derivative instruments were $3.0 million, which were comprised of unrealized gains of $2.2 million and realized gains of $0.8 million. For the three months ended September 30, 2018, gains on derivative instruments were $1.3 million which consisted of unrealized gains of $1.2 million and realized gains of $0.1 million.
[5] AFFO for the three months ended September 30, 2018 includes income from a lease termination fee of $3.0 million, which was recorded in rental income in the unaudited consolidated statements of operations, related to a real estate asset sold during the three months ended September 30, 2018.
[6] Dividends declared to common stockholders only, and do not include distributions to non-controlling interest holders or holders of Series
A Preferred Stock.
|
| | |
| Global Net Lease, Inc. |
| Supplemental Information |
| Quarter ended June 30, 2019 (Unaudited) |
Debt Overview
As of June 30, 2019
|
| | | | | | | | | | | | | | | | |
| Year of Maturity | | Number of Encumbered Properties | | Weighted-Average Debt Maturity (Years) | | Weighted-Average Interest Rate [1] | | Total Outstanding Balance [2] (In thousands) | | Percent |
| Non-Recourse Debt | | | | | | | | | | |
| 2019 (remainder) | | 7 |
| | 0.3 |
| | 2.5 | % | | $ | 180,723 |
| | |
| 2020 | | 3 |
| | 1.4 |
| | 1.9 | % | | 50,038 |
| | |
| 2021 | | 2 |
| | 1.9 |
| | 1.3 | % | | 11,939 |
| | |
| 2022 | | — |
| | — |
| | — | % | | — |
| | |
| 2023 | | 48 |
| | 4.1 |
| | 3.0 | % | | 350,598 |
| | |
| 2024 | | 8 |
| | 4.8 |
| | 1.5 | % | | 220,596 |
| | |
| Thereafter | | 44 |
| | 9 |
| | 4.6 | % | | 485,751 |
| | |
| Total Non-Recourse Debt | | 112 |
| | 5.4 |
| | 3.2 | % | | 1,299,645 |
| | 71 | % |
| | | | | | | | | | | |
| Recourse Debt | | | | | | | | | | |
| Revolving Credit Facility | | | | 2.1 |
| | 3.3 | % | | 259,527 |
| | |
| Term Loan | | | | 3.1 |
| | 1.9 | % | | 280,273 |
| | |
| Total Recourse Debt | | | | 2.6 |
| | 2.6 | % | | 539,800 |
| | 29 | % |
| | | | | | | | | | | |
| Total Debt | | | | 4.6 |
| | 3.0 | % | | $ | 1,839,445 |
| | 100 | % |
| | | | | | | | | | | |
| Total Debt by Currency | | | | | | | | Percent | | |
| USD | | | | | | | | 41 | % | | |
| EUR | | | | | | | | 40 | % | | |
| GBP | | | | | | | | 19 | % | | |
| Total | | | | | | | | 100 | % | | |
Footnotes:
[1] As of June 30, 2019, the Company’s total combined debt was 84.6% fixed rate or swapped to a fixed rate and 15.4% floating rate.
[2] Excludes the effect of deferred financing costs, net and mortgage (discount) premium, net. Current balances as of June 30, 2019 are shown in the year the debt matures.
|
| | |
| Global Net Lease, Inc. |
| Supplemental Information |
| Quarter ended June 30, 2019 (Unaudited) |
Future Minimum Lease Rents
As of June 30, 2019
Amounts in thousands
|
| | | | |
| | | Future Minimum
Base Rent Payments [1] |
| 2019 (remainder) | | $ | 142,050 |
|
| 2020 | | 286,480 |
|
| 2021 | | 287,630 |
|
| 2022 | | 278,744 |
|
| 2023 | | 256,504 |
|
| 2024 | | 212,866 |
|
| Thereafter | | 728,617 |
|
| Total | | $ | 2,192,891 |
|
Footnotes:
[1] Base rent assumes exchange rates of £1.00 to $1.27 for GBP and €1.00 to $1.14 for EUR as of June 30, 2019 for illustrative purposes, as applicable.
|
| | |
| Global Net Lease, Inc. |
| Supplemental Information |
| Quarter ended June 30, 2019 (Unaudited) |
Top Ten Tenants
As of June 30, 2019
Amounts in thousands, except percentages
|
| | | | | | | | | | | |
| Tenant / Lease Guarantor | | Property Type | | Tenant Industry | | Annualized SL Rent [1] | | SL Rent Percent |
| FedEx | | Distribution | | Freight | | $ | 13,495 |
| | 5 | % |
| Government Services Administration (GSA) | | Office | | Government | | 12,042 |
| | 4 | % |
| RWE AG | | Office | | Utilities | | 10,821 |
| | 4 | % |
| Foster Wheeler | | Office | | Engineering | | 10,787 |
| | 4 | % |
| ING Bank | | Office | | Financial Services | | 9,251 |
| | 3 | % |
| Finnair | | Industrial | | Aerospace | | 9,018 |
| | 3 | % |
| Penske | | Distribution | | Logistics | | 8,500 |
| | 3 | % |
| Contractors Steel | | Industrial | | Metal Processing | | 7,936 |
| | 3 | % |
| Trinity Health | | Office | | Healthcare | | 6,584 |
| | 2 | % |
| Harper Collins | | Distribution | | Publishing | | 6,516 |
| | 2 | % |
| Subtotal | | | | | | 94,950 |
| | 33 | % |
| | | | | | | | | |
| Remaining portfolio | | | | | | 195,476 |
| | 67 | % |
| | | | | | | | | |
| Total Portfolio | | | | | | $ | 290,426 |
| | 100 | % |
Footnotes:
[1] SL Rent (Straight-line rent) is on an annualized basis and assumes exchange rates of £1.00 to $1.27 for GBP and €1.00 to $1.14 for EUR as of June 30, 2019 for illustrative purposes, as applicable.
|
| | |
| Global Net Lease, Inc. |
| Supplemental Information |
| Quarter ended June 30, 2019 (Unaudited) |
Diversification by Property Type
As of June 30, 2019
Amounts in thousands, except percentages
|
| | | | | | | | | | | | | | | | | | | | | | | | | | | |
| | | Total Portfolio | | | Unencumbered Portfolio [2] |
| Property Type | | Annualized SL Rent [1] | | SL Rent Percent | | Square Feet | | Sq. ft. Percent | | | Annualized SL Rent [1] | | SL Rent Percent | | Square Feet | | Sq. ft. Percent |
| Office | | $ | 153,204 |
| | 53 | % | | 8,797 |
| | 31 | % | | | $ | 38,493 |
| | 38 | % | | 2,142 |
| | 20 | % |
| Industrial | | 71,979 |
| | 25 | % | | 11,197 |
| | 39 | % | | | 43,589 |
| | 42 | % | | 6,280 |
| | 59 | % |
| Distribution | | 46,741 |
| | 16 | % | | 6,747 |
| | 24 | % | | | 12,179 |
| | 12 | % | | 1,714 |
| | 16 | % |
| Retail | | 18,502 |
| | 6 | % | | 1,591 |
| | 6 | % | | | 7,951 |
| | 8 | % | | 532 |
| | 5 | % |
| Total | | $ | 290,426 |
| | 100 | % | | 28,332 |
| | 100 | % | | | $ | 102,212 |
| | 100 | % | | 10,668 |
| | 100 | % |
Footnotes:
[1] SL Rent (Straight-line rent) is on an annualized basis and assumes exchange rates of £1.00 to $1.27 for GBP and €1.00 to $1.14 for EUR as of June 30, 2019 for illustrative purposes, as applicable.
[2] Includes properties on the credit facility borrowing base.
|
| | |
| Global Net Lease, Inc. |
| Supplemental Information |
| Quarter ended June 30, 2019 (Unaudited) |
Diversification by Tenant Industry
As of June 30, 2019
Amounts in thousands, except percentages
|
| | | | | | | | | | | | | | | | | | | | | | | | | | | |
| | | Total Portfolio | | | Unencumbered Portfolio [3] |
| Industry Type | | Annualized SL Rent [1] | | SL Rent Percent | | Square Feet | | Sq. ft. Percent | | | Annualized SL Rent [1] | | SL Rent Percent | | Square Feet | | Sq. ft. Percent |
| Financial Services | | $ | 34,006 |
| | 12 | % | | 2,316 |
| | 8 | % | | | $ | 3,151 |
| | 3 | % | | 190 |
| | 2 | % |
| Healthcare | | 18,997 |
| | 7 | % | | 846 |
| | 3 | % | | | 12,689 |
| | 12 | % | | 623 |
| | 6 | % |
| Technology | | 18,360 |
| | 6 | % | | 906 |
| | 3 | % | | | — |
| | — | % | | — |
| | — | % |
| Aerospace | | 16,410 |
| | 6 | % | | 1,318 |
| | 5 | % | | | 4,606 |
| | 5 | % | | 293 |
| | 3 | % |
| Freight | | 14,433 |
| | 5 | % | | 1,446 |
| | 5 | % | | | 7,181 |
| | 7 | % | | 801 |
| | 8 | % |
| Government | | 14,397 |
| | 5 | % | | 536 |
| | 2 | % | | | 11,647 |
| | 11 | % | | 424 |
| | 4 | % |
| Metal Processing | | 14,283 |
| | 5 | % | | 2,472 |
| | 9 | % | | | 10,858 |
| | 11 | % | | 1,852 |
| | 17 | % |
| Logistics | | 14,151 |
| | 5 | % | | 2,269 |
| | 8 | % | | | 2,462 |
| | 2 | % | | 390 |
| | 4 | % |
| Telecommunications | | 13,594 |
| | 5 | % | | 865 |
| | 3 | % | | | — |
| | — | % | | — |
| | — | % |
| Energy | | 12,907 |
| | 4 | % | | 1,169 |
| | 4 | % | | | 10,069 |
| | 10 | % | | 928 |
| | 9 | % |
| Utilities | | 12,446 |
| | 4 | % | | 673 |
| | 2 | % | | | — |
| | — | % | | — |
| | — | % |
| Pharmaceuticals | | 10,808 |
| | 4 | % | | 476 |
| | 2 | % | | | 1,020 |
| | 1 | % | | 86 |
| | 1 | % |
| Engineering | | 10,787 |
| | 4 | % | | 366 |
| | 1 | % | | | — |
| | — | % | | — |
| | — | % |
| Discount Retail | | 10,596 |
| | 4 | % | | 1,267 |
| | 4 | % | | | 4,739 |
| | 5 | % | | 466 |
| | 4 | % |
| Retail Food Distribution | | 7,303 |
| | 3 | % | | 1,128 |
| | 4 | % | | | 825 |
| | 1 | % | | 170 |
| | 2 | % |
| Metal Fabrication | | 7,040 |
| | 2 | % | | 1,013 |
| | 4 | % | | | 3,261 |
| | 3 | % | | 529 |
| | 5 | % |
| Publishing | | 6,516 |
| | 2 | % | | 873 |
| | 3 | % | | | — |
| | — | % | | — |
| | — | % |
| Auto Manufacturing | | 6,472 |
| | 2 | % | | 1,743 |
| | 6 | % | | | 3,715 |
| | 4 | % | | 742 |
| | 7 | % |
| Automotive Parts Supplier | | 3,837 |
| | 1 | % | | 469 |
| | 2 | % | | | 1,631 |
| | 2 | % | | 149 |
| | 1 | % |
| Auto Manufacturer | | 3,767 |
| | 1 | % | | 360 |
| | 1 | % | | | 3,767 |
| | 4 | % | | 360 |
| | 3 | % |
| Consumer Goods | | 3,672 |
| | 1 | % | | 940 |
| | 3 | % | | | 1,049 |
| | 1 | % | | 96 |
| | 1 | % |
| Restaurant - Quick Service | | 3,390 |
| | 1 | % | | 74 |
| | — | % | | | 3,212 |
| | 3 | % | | 65 |
| | 1 | % |
| Specialty Retail | | 2,908 |
| | 1 | % | | 280 |
| | 1 | % | | | — |
| | — | % | | — |
| | — | % |
| Other [2] | | 29,346 |
| | 10 | % | | 4,527 |
| | 17 | % | | | 16,330 |
| | 15 | % | | 2,504 |
| | 22 | % |
| Total | | $ | 290,426 |
| | 100 | % | | 28,332 |
| | 100 | % | | | $ | 102,212 |
| | 100 | % | | 10,668 |
| | 100 | % |
Footnotes:
[1] SL Rent (Straight-line rent) is on an annualized basis and assumes exchange rates of £1.00 to $1.27 for GBP and €1.00 to $1.14 for EUR as of June 30, 2019 for illustrative purposes, as applicable.
[2] Other includes 25 industry types as of June 30, 2019.
[3] Includes properties on the credit facility borrowing base.
|
| | |
| Global Net Lease, Inc. |
| Supplemental Information |
| Quarter ended June 30, 2019 (Unaudited) |
Diversification by Geography
As of June 30, 2019
Amounts in thousands, except percentages
|
| | | | | | | | | | | | | | | | | | | | | | | | | | | |
| | | Total Portfolio | | | Unencumbered Portfolio [2] |
| Region | | Annualized SL Rent [1] | | SL Rent Percent | | Square Feet | | Sq. ft. Percent | | | Annualized SL Rent [1] | | SL Rent Percent | | Square Feet | | Sq. ft. Percent |
| United States | | $ | 164,003 |
| | 56.5 | % | | 17,774 |
| | 62.7 | % | | | $ | 93,516 |
| | 91.5 | % | | 10,206 |
| | 95.7 | % |
| Michigan | | 40,126 |
| | 13.8 | % | | 4,605 |
| | 16.0 | % | | | 23,421 |
| | 23.0 | % | | 2,687 |
| | 25.2 | % |
| Texas | | 23,863 |
| | 8.2 | % | | 1,913 |
| | 6.8 | % | | | 10,804 |
| | 10.6 | % | | 957 |
| | 9.0 | % |
| California | | 10,478 |
| | 3.6 | % | | 389 |
| | 1.4 | % | | | — |
| | — | % | | — |
| | — | % |
| New Jersey | | 9,012 |
| | 3.1 | % | | 397 |
| | 1.4 | % | | | 686 |
| | 0.7 | % | | 48 |
| | 0.5 | % |
| Ohio | | 8,010 |
| | 2.8 | % | | 1,545 |
| | 5.5 | % | | | 5,160 |
| | 5.0 | % | | 611 |
| | 5.7 | % |
| Indiana | | 6,826 |
| | 2.4 | % | | 1,490 |
| | 5.3 | % | | | 5,728 |
| | 5.6 | % | | 942 |
| | 8.8 | % |
| Tennessee | | 6,745 |
| | 2.3 | % | | 749 |
| | 2.6 | % | | | 5,011 |
| | 4.9 | % | | 287 |
| | 2.7 | % |
| Alabama | | 6,014 |
| | 2.1 | % | | 290 |
| | 1.0 | % | | | 6,014 |
| | 5.9 | % | | 290 |
| | 2.7 | % |
| Illinois | | 5,109 |
| | 1.8 | % | | 950 |
| | 3.4 | % | | | 4,533 |
| | 4.4 | % | | 874 |
| | 8.2 | % |
| Pennsylvania | | 3,994 |
| | 1.4 | % | | 447 |
| | 1.6 | % | | | 2,708 |
| | 2.6 | % | | 237 |
| | 2.2 | % |
| New York | | 3,959 |
| | 1.4 | % | | 677 |
| | 2.4 | % | | | 450 |
| | 0.4 | % | | 63 |
| | 0.6 | % |
| Missouri | | 3,427 |
| | 1.2 | % | | 309 |
| | 1.1 | % | | | 1,457 |
| | 1.4 | % | | 219 |
| | 2.0 | % |
| Colorado | | 2,703 |
| | 0.9 | % | | 87 |
| | 0.3 | % | | | 2,703 |
| | 2.6 | % | | 87 |
| | 0.8 | % |
| Kentucky | | 2,469 |
| | 0.9 | % | | 332 |
| | 1.2 | % | | | 1,561 |
| | 1.5 | % | | 255 |
| | 2.4 | % |
| Massachusetts | | 2,453 |
| | 0.8 | % | | 192 |
| | 0.7 | % | | | 2,453 |
| | 2.4 | % | | 192 |
| | 1.8 | % |
| Florida | | 2,385 |
| | 0.8 | % | | 156 |
| | 0.6 | % | | | 2,385 |
| | 2.3 | % | | 156 |
| | 1.5 | % |
| South Carolina | | 2,270 |
| | 0.8 | % | | 316 |
| | 1.1 | % | | | 2,270 |
| | 2.2 | % | | 316 |
| | 3.0 | % |
| Minnesota | | 2,142 |
| | 0.7 | % | | 150 |
| | 0.5 | % | | | 691 |
| | 0.7 | % | | 103 |
| | 1.0 | % |
| Mississippi | | 2,105 |
| | 0.7 | % | | 381 |
| | 1.3 | % | | | 808 |
| | 0.8 | % | | 81 |
| | 0.8 | % |
| Kansas | | 2,092 |
| | 0.7 | % | | 292 |
| | 1.0 | % | | | 1,896 |
| | 1.9 | % | | 277 |
| | 2.6 | % |
| Maine | | 1,988 |
| | 0.7 | % | | 59 |
| | 0.2 | % | | | 1,988 |
| | 1.9 | % | | 59 |
| | 0.6 | % |
| North Carolina | | 1,863 |
| | 0.6 | % | | 182 |
| | 0.6 | % | | | 1,118 |
| | 1.1 | % | | 153 |
| | 1.4 | % |
| Georgia | | 1,655 |
| | 0.6 | % | | 500 |
| | 1.8 | % | | | 1,655 |
| | 1.6 | % | | 500 |
| | 4.7 | % |
| South Dakota | | 1,294 |
| | 0.4 | % | | 54 |
| | 0.2 | % | | | 1,294 |
| | 1.3 | % | | 54 |
| | 0.5 | % |
| Vermont | | 1,166 |
| | 0.4 | % | | 213 |
| | 0.8 | % | | | — |
| | — | % | | — |
| | — | % |
| Nebraska | | 1,150 |
| | 0.4 | % | | 101 |
| | 0.4 | % | | | 278 |
| | 0.3 | % | | 27 |
| | 0.3 | % |
| Louisiana | | 1,107 |
| | 0.4 | % | | 121 |
| | 0.4 | % | | | 1,107 |
| | 1.1 | % | | 121 |
| | 1.1 | % |
| West Virginia | | 980 |
| | 0.3 | % | | 104 |
| | 0.4 | % | | | — |
| | — | % | | — |
| | — | % |
| North Dakota | | 884 |
| | 0.3 | % | | 47 |
| | 0.2 | % | | | 884 |
| | 0.9 | % | | 47 |
| | 0.4 | % |
| Iowa | | 848 |
| | 0.3 | % | | 225 |
| | 0.8 | % | | | 848 |
| | 0.8 | % | | 225 |
| | 2.1 | % |
| Oklahoma | | 825 |
| | 0.3 | % | | 89 |
| | 0.3 | % | | | 825 |
| | 0.8 | % | | 89 |
| | 0.8 | % |
| Maryland | | 785 |
| | 0.3 | % | | 120 |
| | 0.4 | % | | | 785 |
| | 0.8 | % | | 120 |
| | 1.1 | % |
| New Mexico | | 556 |
| | 0.2 | % | | 46 |
| | 0.2 | % | | | 556 |
| | 0.5 | % | | 46 |
| | 0.4 | % |
| Idaho | | 533 |
| | 0.2 | % | | 30 |
| | 0.1 | % | | | 92 |
| | 0.1 | % | | 8 |
| | 0.1 | % |
| Wyoming | | 498 |
| | 0.2 | % | | 37 |
| | 0.1 | % | | | 498 |
| | 0.5 | % | | 37 |
| | 0.3 | % |
| Montana | | 441 |
| | 0.2 | % | | 58 |
| | 0.2 | % | | | — |
| | — | % | | — |
| | — | % |
| New Hampshire | | 399 |
| | 0.1 | % | | 83 |
| | 0.3 | % | | | — |
| | — | % | | — |
| | — | % |
| Utah | | 397 |
| | 0.1 | % | | 20 |
| | 0.1 | % | | | 397 |
| | 0.4 | % | | 20 |
| | 0.2 | % |
| Delaware | | 361 |
| | 0.1 | % | | 10 |
| | — | % | | | 361 |
| | 0.4 | % | | 10 |
| | 0.1 | % |
| Arkansas | | 91 |
| | — | % | | 8 |
| | — | % | | | 91 |
| | 0.1 | % | | 8 |
| | 0.1 | % |
| United Kingdom | | 52,433 |
| | 18.1 | % | | 4,031 |
| | 14.2 | % | | | — |
| | — | % | | — |
| | — | % |
| Germany | | 20,537 |
| | 7.1 | % | | 2,178 |
| | 7.7 | % | | | — |
| | — | % | | — |
| | — | % |
| The Netherlands | | 17,057 |
| | 5.9 | % | | 1,039 |
| | 3.7 | % | | | 5,484 |
| | 5.4 | % | | 397 |
| | 3.7 | % |
| Finland | | 14,875 |
| | 5.1 | % | | 1,457 |
| | 5.1 | % | | | — |
| | — | % | | — |
| | — | % |
| France | | 12,804 |
| | 4.3 | % | | 1,632 |
| | 5.8 | % | | | — |
| | — | % | | — |
| | — | % |
| Luxembourg | | 5,505 |
| | 1.9 | % | | 156 |
| | 0.6 | % | | | — |
| | — | % | | — |
| | — | % |
| Puerto Rico | | 3,212 |
| | 1.1 | % | | 65 |
| | 0.2 | % | | | 3,212 |
| | 3.1 | % | | 65 |
| | 0.6 | % |
| Total | | $ | 290,426 |
| | 100 | % | | 28,332 |
| | 100 | % | | | $ | 102,212 |
| | 100 | % | | 10,668 |
| | 100 | % |
Footnotes:
[1] SL Rent (Straight-line rent) is on an annualized basis and assumes exchange rates of £1.00 to $1.27 for GBP and €1.00 to $1.14 for EUR as of June 30, 2019 for illustrative purposes, as applicable.
[2] Includes properties on the credit facility borrowing base.
|
| | |
| Global Net Lease, Inc. |
| Supplemental Information |
| Quarter ended June 30, 2019 (Unaudited) |
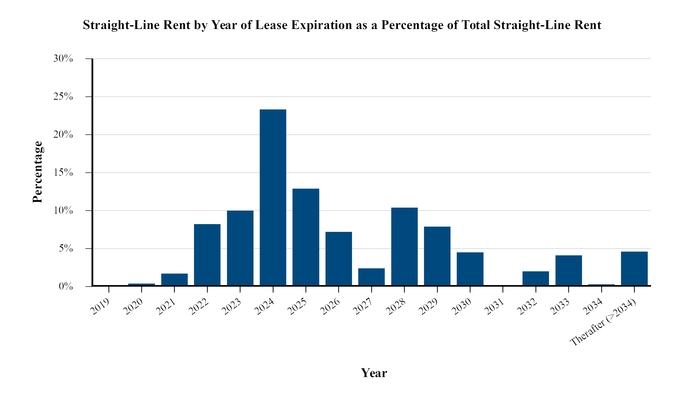
Lease Expirations
As of June 30, 2019
|
| | | | | | | | | | | | | | | |
| Year of Expiration | | Number of Leases Expiring | | Annualized SL Rent [1] | | Annualized SL Rent Percent | | Leased Rentable Square Feet | | Percent of Rentable Square Feet Expiring |
| | | | | (In thousands) | | | | (In thousands) | | |
| 2019 (Remaining) | | — | | $ | — |
| | — | % | | — |
| | — | % |
| 2020 | | 1 | | 1,055 |
| | 0.4 | % | | 100 |
| | 0.4 | % |
| 2021 | | 2 | | 4,950 |
| | 1.7 | % | | 323 |
| | 1.1 | % |
| 2022 | | 16 | | 23,761 |
| | 8.2 | % | | 1,553 |
| | 5.5 | % |
| 2023 | | 31 | | 29,017 |
| | 10.0 | % | | 2,510 |
| | 8.9 | % |
| 2024 | | 46 | | 67,811 |
| | 23.3 | % | | 5,976 |
| | 21.2 | % |
| 2025 | | 38 | | 37,369 |
| | 12.9 | % | | 3,237 |
| | 11.5 | % |
| 2026 | | 16 | | 20,945 |
| | 7.2 | % | | 2,042 |
| | 7.2 | % |
| 2027 | | 16 | | 7,075 |
| | 2.4 | % | | 745 |
| | 2.6 | % |
| 2028 | | 42 | | 30,279 |
| | 10.4 | % | | 4,220 |
| | 15.0 | % |
| 2029 | | 48 | | 22,807 |
| | 7.9 | % | | 2,751 |
| | 9.8 | % |
| 2030 | | 13 | | 13,108 |
| | 4.5 | % | | 791 |
| | 2.8 | % |
| 2031 | | 1 | | 320 |
| | 0.1 | % | | 58 |
| | 0.2 | % |
| 2032 | | 6 | | 5,773 |
| | 2.0 | % | | 677 |
| | 2.4 | % |
| 2033 | | 3 | | 11,919 |
| | 4.1 | % | | 1,029 |
| | 3.6 | % |
| 2034 | | 1 | | 923 |
| | 0.3 | % | | 228 |
| | 0.8 | % |
| Thereafter (>2034) | | 7 | | 13,314 |
| | 4.6 | % | | 1,966 |
| | 7.0 | % |
| Total | | 287 | | $ | 290,426 |
| | 100 | % | | 28,206 |
| | 100 | % |
[1] Annualized rental income converted from local currency into USD as of June 30, 2019 for the in-place lease in the property on a straight-line basis, which includes tenant concessions such as free rent, as applicable.