UNITED STATES
SECURITIES AND EXCHANGE COMMISSION
Washington, D.C. 20549
Form 10-K
☒ ANNUAL REPORT PURSUANT TO SECTION 13 OR 15(d) OF THE SECURITIES EXCHANGE ACT OF 1934
For the fiscal year ended December 31, 2024
OR
☐ TRANSITION REPORT PURSUANT TO SECTION 13 OR 15(d) OF THE SECURITIES EXCHANGE ACT OF 1934
For the transition period from to
Commission file number: 001-35362
TRIPADVISOR, INC.
(Exact name of registrant as specified in its charter)
| | |
Delaware |
| 80-0743202 |
(State or other jurisdiction of
incorporation or organization) |
| (I.R.S. Employer
Identification No.) |
400 1st Avenue
Needham, MA 02494
(Address of principal executive office) (Zip Code)
Registrant’s telephone number, including area code:
(781) 800-5000
Securities registered pursuant to Section 12(b) of the Act:
| | |
Title of each class | Trading Symbol | Name of each exchange on which registered |
Common stock | TRIP | The Nasdaq Global Select Market |
Securities registered pursuant to Section 12(g) of the Act: None
Indicate by check mark if the registrant is a well-known seasoned issuer, as defined in Rule 405 of the Securities Act. Yes ☒ No ☐
Indicate by check mark if the registrant is not required to file reports pursuant to Section 13 or Section 15(d) of the Act. Yes ☐ No ☒
Indicate by check mark whether the registrant (1) has filed all reports required to be filed by Section 13 or 15(d) of the Securities Exchange Act of 1934 during the preceding 12 months (or for such shorter period that the registrant was required to file such reports), and (2) has been subject to such filing requirements for the past 90 days. Yes ☒ No ☐
Indicate by check mark whether the registrant has submitted electronically every Interactive Data File required to be submitted pursuant to Rule 405 of Regulation S-T (§ 232.405 of this chapter) during the preceding 12 months (or for such shorter period that the registrant was required to submit such files). Yes ☒ No ☐
Indicate by check mark whether the registrant is a large accelerated filer, an accelerated filer, a non-accelerated filer, smaller reporting company, or an emerging growth company. See the definitions of “large accelerated filer,” “accelerated filer,” “smaller reporting company,” and “emerging growth company” in Rule 12b-2 of the Exchange Act.
| | | | | | |
Large accelerated filer |
| ☒ |
| Accelerated filer |
| ☐ |
Non-accelerated filer |
| ☐ |
| Smaller reporting company |
| ☐ |
Emerging growth company | | ☐ | | | | |
If an emerging growth company, indicate by check mark if the registrant has elected not to use the extended transition period for complying with any new or revised financial accounting standards provided pursuant to Section 13(a) of the Exchange Act. ☐
Indicate by check mark whether the registrant has filed a report on and attestation to its management’s assessment of the effectiveness of its internal control over financial reporting under Section 404(b) of the Sarbanes-Oxley Act (15 U.S.C. 7262(b)) by the registered public accounting firm that prepared or issued its audit report.☒
If securities are registered pursuant to Section 12(b) of the Act, indicate by check mark whether the financial statements of the registrant included in the filing reflect the correction of an error to previously issued financial statements. ☐
Indicate by check mark whether any of those error corrections are restatements that required a recovery analysis of incentive-based compensation received by any of the registrant’s executive officers during the relevant recovery period pursuant to §240.10D-1(b). ☐
Indicate by check mark whether the registrant is a shell company (as defined in Rule 12b-2 of the Exchange Act). Yes ☐ No ☒
The aggregate market value of our common stock held by non-affiliates of the registrant as of the last business day of the registrant’s most recently completed second fiscal quarter was $1,903,322,909 based on the closing price on The Nasdaq Global Select Market on such date.
| | |
Class |
| Outstanding Shares at February 11, 2025 |
Common Stock, $0.001 par value per share |
| 127,581,730 shares |
Class B common stock, $0.001 par value per share |
| 12,799,999 shares |
Documents Incorporated by Reference
The registrant intends to file a proxy statement pursuant to Regulation 14A not later than 120 days after the close of the fiscal year ended December 31, 2024. Portions of such proxy statement are incorporated by reference into Part III of this Annual Report on Form 10-K.
Table of Contents
We refer to Tripadvisor, Inc. and our wholly-owned subsidiaries as “Tripadvisor,” “Tripadvisor group,” “the Company,” “us,” “we” and “our” in this Annual Report on Form 10-K.
Cautionary Note Regarding Forward-Looking Statements
This Annual Report on Form 10-K contains “forward-looking statements” that involve risks and uncertainties, as well as assumptions that, if they never materialize or prove incorrect, could cause our results to differ materially from those expressed or implied by such forward-looking statements. The statements contained in this Annual Report that are not purely historical are forward-looking statements within the meaning of Section 27A of the Securities Act of 1933, as amended, or the Securities Act, and Section 21E of the Securities Exchange Act of 1934, as amended, or the Exchange Act. The following words, when used, are intended to identify forward-looking statements: “anticipate,” “believe,” “could,” “continue,” “estimate,” “expect,” “intend,” “likely,” “may,” “might,” “plan,” “project,” “target,” “result,” “should,” “will,” and similar expressions which do not relate solely to historical matters. We caution investors that any forward-looking statements in this report, or which management may make orally or in writing from time to time, are based on management’s beliefs and on assumptions made by, and information currently available to, management. Such statements are subject to risks, uncertainties and assumptions and are not guarantees of future performance, which may be affected by known and unknown risks, trends, uncertainties and factors that are beyond our control. Risks and uncertainties that may cause our actual results, performance or achievements to differ materially from those expressed or implied by forward-looking statements include, but are not limited to, those described in Part I. Item 1A. "Risk Factors." Moreover, we operate in a rapidly changing environment. New risk factors emerge from time to time and it is not possible for management to predict all such risk factors, nor can we assess the impact of all such risk factors on our business or the extent to which any factor, or combination of factors, may cause actual results to differ materially from those contained in any forward-looking statements. We caution you that, while forward-looking statements reflect our good faith beliefs, they are not guarantees of future performance and are impacted by actual events when they occur after we make such statements. We expressly disclaim any responsibility to update our forward-looking statements, whether as a result of new information, future events or otherwise.
Investors should also refer to our quarterly reports on Form 10-Q for future periods and current reports on Form 8-K as we file them with the U.S. Securities and Exchange Commission (the "SEC"), and to other materials we may furnish to the public from time to time through SEC filings.
PART I
Item 1. Business
Overview
The Tripadvisor group operates as a family of brands with the purpose of connecting people to experiences worth sharing. The Company's vision is to be the world’s most trusted source for travel and experiences. The Company operates across three business segments: Brand Tripadvisor, Viator, and TheFork. We leverage our brands, technology platforms, and capabilities to connect our large, global audience with partners by offering rich content, travel guidance products and services, and two-sided marketplaces for experiences, accommodations, restaurants, and other travel categories.
Brand Tripadvisor’s purpose is to empower everyone to be a better traveler by serving as the world’s most trusted and essential travel guidance platform. Since Tripadvisor’s founding in 2000, the Tripadvisor brand has developed a relationship of trust and community with travelers and experience seekers by providing an online global platform for travelers to discover, generate, and share authentic user-generated content (“UGC”) in the form of reviews and opinions for destinations, points-of-interest (“POIs”), experiences, accommodations, restaurants, and cruises in over 40 countries and in more than 20 languages across the world. Tripadvisor offers more than 1 billion user-generated reviews and opinions on over 9 million experiences, accommodations, restaurants, airlines, and cruises. Tripadvisor’s online platform attracts one of the world’s largest travel audiences, with hundreds of millions of visitors annually.
Viator’s purpose is to bring extraordinary, unexpected, and forever memorable experiences to more people, more often, wherever they are traveling. In doing so, Viator elevates tens of thousands of businesses, large and small. Viator delivers on its purpose by enabling travelers to discover and book iconic, unique and memorable experiences from operators around the globe. Our online marketplace is comprehensive and easy-to-use, connecting millions of travelers to the world’s largest supply of bookable tours, activities and attractions—nearly 400,000 experiences from more than 65,000 operators. Viator is a pure-play experiences online travel agency (“OTA”) singularly focused on the needs of both travelers and operators with the largest supply of bookable experiences available to travelers.
TheFork’s purpose is to deliver happiness through amazing dining experiences as the leading online restaurant booking platform in Europe. At the forefront of championing restaurant culture, TheFork harnesses technology to promote real life connections between diners and restaurateurs. With a network of approximately 55,000 partner restaurants across 11 countries, nearly 40 million app downloads and more than 20 million reviews, TheFork is a go-to platform for all food lovers to enjoy unforgettable restaurant experiences. Through TheFork, users can easily find restaurants according to their preferences, check real-time availability, instantly book online 24/7, benefit from special offers and pay directly to the restaurants. For restaurateurs, TheFork's technology enables them to optimize reservation management and occupancy rates, increase bookings and visibility, limit the impacts of no-shows, manage payments and streamline operations, all while accessing the broadest community of loyal diners.
Our Industry and Market Opportunity
We are one of the world’s largest online travel companies and our consolidated annual revenue in 2024 represents a small fraction of total worldwide travel spending, which highlights the potential size of our global market opportunity. Phocuswright, an independent travel, tourism and hospitality research firm, estimated global travel spending, exclusive of experiences, vacation rentals, and dining, at approximately $1.6 trillion in 2024. Phocuswright estimates global travel spending will reach approximately $1.9 trillion by 2027, with an expected increasing share booked through online channels each year.
We believe that we are a compelling leader in the global experiences industry and well positioned to capture increased share in a large and growing market that we estimate to reach approximately $365 billion by 2028 based on data from Arival’s October 2022 report (the “Arival Report”), a leading research provider on the in-destination experiences industry, and internal company projections. Moreover, we believe we are poised to benefit from
increased online adoption in the global experiences industry. Based on data from Phocuswright and Arival, we estimate online penetration in experiences is approximately half of other major travel categories, such as hotel accommodations, and we anticipate the total size of the online experiences market will continue to grow as travelers become increasingly aware of the category online and operators continue to shift their business online. In addition, OTAs are the fastest growing channel in the travel experiences market and are expected to undergo significant growth going forward, with the OTA channel expected to experience a compounded annual growth rate (“CAGR”) of 37% from 2022 to the end of 2025 according to the Arival Report.
Based on information in Euromonitor's February 2022 report, a leading provider of global business intelligence, market research data and analysis, we estimate the full-service European restaurants industry may reach approximately $250 billion by the end of 2025. In addition, based on this same data, this industry is exhibiting a similar trend as the experiences’ industry in terms of online adoption; the majority of restaurant reservation bookings still take place offline, but an increasing share is booked through online channels each year. We believe that we are still early in the global shift in consumer adoption towards booking experiences and restaurants online, which provides an exciting future market opportunity for our business.
Our Business Strategy
The Tripadvisor group operates in a unique position in the travel and experiences ecosystem as a result of the following:
•We operate in large, global, and growing addressable markets including travel, experiences, and digital advertising;
•We have a large, global, and engaged audience making meaningful contributions that reinforces a relationship of trust and community; and
•We possess a wealth of high-intent data that comes from serving our audience of travelers and experience seekers at different points along their journey - whether they are engaging on our platforms for inspiration on their next experience, planning a trip, or making a purchasing decision.
In the Brand Tripadvisor segment, we offer a compelling value proposition to both travelers and partners across a number of key offerings that include accommodations, experiences, dining, and media. This value proposition is delivered through a collection of durable assets that we believe are difficult to replicate: a trusted brand, authentic UGC, a large community of contributors, and one of the largest global travel audiences. Our strategy in this segment is to leverage these core assets as well as our technology capabilities to provide travelers with a compelling user experience to help make the best decisions in each phase of the travel journey, including pre-trip planning, in-destination, and post-trip sharing. We intend to drive new traveler acquisition and repeat audience engagement on our platform by offering meaningful travel guidance solutions and services that reduce friction in the traveler journey and create a deeper, more persistent relationship with travelers. We evaluate investment opportunities across data, product, marketing, and technology that we believe will improve and diversify the monetization of our audience through deeper engagement, which, we expect will, in turn, drive more value to our partners.
The Brand Tripadvisor segment plays an important role in our portfolio. For over two decades, we believe we have built difficult to replicate assets such as a trusted brand, authentic content, a large community of contributors, and one of the largest global travel audiences. Our long-term strategy for the Brand Tripadvisor segment builds on our heritage and the reasons hundreds of millions of travelers come to Tripadvisor each year. Fundamental to this strategy will be: (1) innovating and enhancing world-class travel guidance and planning products to help travelers make confident decisions in a world where it is hard to find advice you can trust; (2) prioritizing deeper engagement with travelers, increasing members, and repeat customers by leveraging our rich data and technology assets to provide more relevant, curated, and contextual content throughout the traveler journey; and (3) driving a step change in the value we can deliver to our partners by accelerating and diversifying the monetization of our valuable audience across key categories, including hotel meta, media advertising, experiences, and restaurants. As we continue to focus on offering a more compelling product and experience that better meets travelers’ needs across
their end-to-end travel journey, we believe we will be better able to drive deeper engagement through direct channel growth, including via our mobile app. As this direct engagement with users improves and scales, we will be able to collect valuable data and create more relevant opportunities to monetize, which we believe will result in a meaningfully higher average revenue per user over time.
In the Viator and TheFork segments, we provide two-sided marketplaces that connect travelers and diners to operators of bookable experiences and restaurants, respectively. Within the Viator and TheFork segments, we are investing in growth, future scale, and market share gains to accelerate our market leadership position, while working to improve unit economics on both sides of the marketplace with the goal of sustainable future profitability. This means driving awareness and higher quality audience engagement, which we believe will drive greater repeat bookings, more direct traffic, and translate into improved unit economics over time. Our investments on both sides of our marketplace, as well as in our primary offerings, are intended to deliver a differentiated value proposition that we believe will drive sustainable market leadership as our partners, operators, and travelers find themselves in an increasingly competitive marketplace environment. We are focused on continuing to grow both our supplier base and our user base by offering innovative tools and features on our branded platforms, and through continued awareness of our brand through marketing efforts.
We are focused on executing initiatives across Tripadvisor group through organic investment in data, products, marketing and technology to further enhance the value we deliver to travelers and partners across our brands, platforms, and segments. In addition, we may accelerate growth inorganically by opportunistically pursuing strategic acquisitions.
Our Business Models
We manage the Brand Tripadvisor segment primarily through the following revenue sources and related business models:
•Tripadvisor-branded Hotels Revenue. The largest source of Brand Tripadvisor segment revenue is generated from click-based advertising on our hotel meta platform (also referred to as our hotel auction), which consists primarily of contextually-relevant booking links to partner websites, which predominantly include OTAs and hotels. Click-based advertising is generally priced on a cost-per-click (“CPC”) basis, with payments from partners determined by the number of clicks generated on a commerce link multiplied by the CPC rate for each particular click. CPC rates are determined in a dynamic, competitive auction bidding process. We also generate click-based advertising revenue on a cost-per-acquisition (“CPA”) basis, with payments from partners determined by a contractual commission rate based on a traveler click generated on our platform that ultimately results in a hotel booking and stay via the partners’ websites.
We provide additional business-to-business (“B2B”) offerings to hotels and related accommodation partners that deliver other unique opportunities to further promote, advertise, and operate their businesses as well as merchandise their inventory on our platform. These include a subscription-based advertising solution, with revenue determined by a contractual fee and time duration, or other CPC-based advertising solutions through hotel sponsored placements on our platform.
•Media and Advertising Revenue. We offer endemic and non-endemic advertisers opportunities to promote their brands primarily through display-based advertising (or “media advertising”) placements across our brands on our platform. Our advertising clients are predominantly direct suppliers of hotels, airlines and cruises, as well as destination marketing organizations (“DMOs”), OTAs, and other travel related businesses. Display-based advertising placements are predominantly sold on a cost per thousand impressions (“CPM”) basis.
•Tripadvisor Experiences and Dining Revenue. We merchandise, on the Tripadvisor platform, bookable experiences available on Viator and bookable dining reservations available on TheFork and earn affiliate marketing commission revenue on bookings that are driven by our platform, which are fulfilled by Viator and TheFork, respectively. These transactions generate intercompany (intersegment) revenue which is eliminated on a consolidated basis. The nature and
economics of these transactions are consistent with the Viator segment and TheFork segment, as described below.
We provide additional B2B offerings to restaurant partners that deliver other unique opportunities to further promote, advertise, and operate their businesses as well as merchandise their businesses on our platform. These offerings can be subscription-based, with revenue determined by a contractual fee and time duration, or CPC-based advertising solutions through restaurant sponsored placements on our platform.
•Other Revenue. We provide travelers additional offerings across various other travel categories, including cruises, vacation rentals, flights, and rental cars. We provide these offerings across a collection of brands that complement and reinforce our segment strategy of providing differentiated guidance that helps travelers reduce friction and make better decisions. Our vacation rentals platform displays and promotes vacation rentals inventory, including contextually-relevant booking links to third-party booking partners, in exchange for which, we earn a commission when travelers complete a booking on the third-party booking partner's website. Our cruise, flight, and rental cars offerings generate revenue primarily through click-based and display-based advertising solutions.
The Viator segment offers travelers a comprehensive online marketplace that provides access to nearly 400,000 experiences and more than 65,000 experience operators. These experiences are instantly bookable online in over 200 countries. Viator's business model relies on the success of travelers and operators who join our marketplace and generate consistent bookings over time. As experience operators become more successful on our platform and as travelers return over time, we benefit from the recurring activity on our marketplace. We generate revenue through commissions for each booking transaction we facilitate directly and indirectly through our platform. Through Viator, we also power traveler experience bookings on behalf of third-party distribution partner websites, including the Tripadvisor platform as well as many of the world’s major OTAs, airlines, hotels, online and offline travel agencies, and other prominent content and eCommerce brands. For the majority of experience bookings, we collect the full amount charged to the traveler at the time of booking and remit the operator’s portion after the booked experience occurs. In addition, Viator offers our “Reserve Now, Pay Later” payment option, which allows our travelers the option to reserve certain experiences and defer payment until a date no later than two days before the experience date.
TheFork segment offers travelers and diners a comprehensive online marketplace that provides access to approximately 55,000 restaurants to discover and book reservations in 11 countries across the U.K., western and central Europe. We primarily generate revenue for each booking reservation we facilitate on our platform, calculated on a per seated diner fee basis and paid for by the restaurant partner. We also generate revenue on a subscription basis from restaurant partners by providing, for a fee, access to premium online reservation booking software and related services offerings to help them more effectively and efficiently manage their business, as well as, partnerships with non-restaurant partners providing dining experiences to elevate and unlock benefits for their users and members.
Seasonality
Consumer travel expenditures have historically followed a seasonal pattern. Correspondingly, travel partner advertising investments, and therefore our revenue and operating profits, have also historically followed a seasonal pattern. Our financial performance tends to be highest in the second and third quarters of a given year, which includes the seasonal peak in consumer demand, including traveler accommodation stays, and travel experiences taken, compared to the first and fourth quarters, which represent seasonal low points. In addition, during the first half of the year, experience bookings typically exceed the amount of completed experiences, resulting in higher cash flow related to working capital; while during the second half of the year, particularly in the third quarter, this pattern reverses and cash flows from these transactions are typically negative. Other factors may also impact typical seasonal fluctuations, such as significant shifts in our business mix, adverse economic conditions, public health-related events, as well as other factors.
Marketing
We have established world-renowned, widely used, and recognized brands through the innovative and efficient implementation of marketing and promotional campaigns. Particularly, we believe we have been successful with the strategic use of a number of cost effective online and offline marketing channels to reach travelers and diners, including our own platform channels (i.e., websites and apps), online search engines (primarily Google), social media, email, generative artificial intelligence (“AI”) platforms (i.e., chatgpt), media via public relations, partnerships, and content distribution. Our omni-channel marketing programs are intended to showcase the value of our industry-leading travel brands; increase user traffic; efficiently drive transactions and engagement; optimize ongoing traveler acquisition costs; and strategically position our brands in relation to one another as we continue to differentiate our offering versus those of our competitors. Our sustained scale and profitability depend on our ability to effectively maintain our costs and increase the overall number of users engaged on our platforms and their subsequent transactions. We continue to focus on our ability to attract and engage new and repeat users and encourage users to directly visit our websites and apps. We have the ability to manage our marketing investments across our portfolio of brands to optimize results for the Company. Our flexibility enables us to make decisions on a brand-by-brand, market-by-market, travel segment and customer basis that we think are appropriate based on the relative growth opportunity, the expected returns and the competitive environment.
Competition
We operate in a very competitive set of market environments that constantly evolve and change. Some of our current and potential competitors, listed below, have significantly more customers, data, and financial and other resources than we do, and may be able to leverage those strengths to compete more aggressively with us.
Across our three segments, we primarily compete, and in some cases partner, with the following businesses:
•General OTAs, such as Expedia, Booking Holdings Inc. (“Booking”), Airbnb, Traveloka, Despegar, Trip.com, and their respective subsidiaries and operating companies;
•Experiences OTAs, such as GetYourGuide, Klook, and TUI Musement;
•Hotel metasearch providers, such as trivago, Kayak and Skyscanner;
•Online search, social media, and marketplace platforms for advertising spend, such as Google, Facebook, X, Pinterest, and Snap;
•Global and regional travel, experiences, and restaurant brands seeking to promote direct bookings;
•Emerging online advertising businesses, such as ad-supported retail and entertainment platforms like Amazon, Spotify, and Walmart;
•AI driven travel curators;
•Traditional offline travel agencies; and
•Global and regional restaurant technology providers for reservation management and related services, such as OpenTable, Resy, and Tock.
Commercial Relationships
We have commercial relationships with a majority of the world’s leading OTAs, as well as thousands of other travel partners, pursuant to which these companies primarily purchase traveler leads from us, generally on a click-based advertising basis. Although these relationships are memorialized in agreements, many of these agreements are for limited terms or are terminable at will or on short notice. As a result, we seek to ensure the mutual success of these relationships.
For the year ended December 31, 2024, Booking (and its subsidiaries) accounted for 10% or more of our consolidated revenue, and together with Expedia (and its subsidiaries), our two most significant travel partners, accounted for approximately 22% of our consolidated revenue. For the years ended December 31, 2023 and 2022, Expedia and Booking each accounted for 10% or more of our consolidated revenue, and together accounted for approximately 25% and 31%, respectively. Nearly all of this concentration of revenue is recorded in our Brand Tripadvisor segment during these reporting periods.
Additionally, our business is dependent on relationships with third-party service operators that we rely on to fulfill service obligations to our customers where we are the merchant of record, such as our experience providers. However, no single operator’s inventory resulted in more than 10% of our revenue on a consolidated basis or at a reportable segment level in any period presented.
Operations and Technology
We have assembled a team of highly skilled software engineers, computer scientists, data scientists, network engineers and systems engineers whose expertise spans a broad range of technical areas, including a wide variety of open source operating systems, databases, languages, analytics, networking, scalable web architecture, operations and warehousing technologies. We make significant investments in product and feature development, data management, personalization technologies, scalable infrastructures, networking, data warehousing, and search engine technologies.
Our systems infrastructure for Tripadvisor-branded websites is in a "hybrid-cloud" configuration in which parts of it are housed at a colocation facility and managed by our operations team, while the rest is hosted on Amazon Web Services. Our infrastructure installations have multiple communication links as well as continuous monitoring and engineering support. The co-location facility is protected with both network-level and application-level defenses, using well known commercial solutions specifically tailored for such purposes. We make use of Amazon Web Services availability zones to provide redundancy for the cloud portions of our infrastructure. Substantially all of our software components, data, and content are replicated in multiple data centers and development centers, as well as backed up at offsite locations. Our systems are monitored and protected through multiple layers of security. Several of our individual subsidiaries and businesses have their own technology teams to support business growth while leveraging common assets, tools and processes for scale across the group.
Intellectual Property
Our intellectual property is an important component of our business. We rely on our intellectual property rights covering a number of assets, including our content, proprietary technology, software code, ratings indexes, and databases of reviews, forum content and other types of user-generated content. We have acquired some of our intellectual property rights through licenses and content agreements with third parties and these arrangements may place restrictions on the use of our intellectual property.
We protect our intellectual property by relying on our terms of use, confidentiality agreements and contractual provisions, as well as on international, national, federal, state and common law rights. We protect our brands by pursuing the trademark registration of our core brands, as appropriate, maintaining our trademark portfolio, securing contractual trademark rights protection when appropriate, and relying on common law trademark rights when appropriate. We also register copyrights and domain names as deemed appropriate. Additionally, we protect our trademarks, domain names and copyrights with the use of intellectual property licenses and an enforcement program.
We have considered, and will continue to consider, the appropriateness of filing for patents to protect future inventions, as circumstances may warrant. However, many patents protect only specific inventions and there can be no assurance that others may not create new products or methods that achieve similar results without infringing upon patents owned by us.
In connection with our copyrightable content, we post and institute procedures under the U.S. Digital Millennium Copyright Act and similar “host privilege” statutes worldwide to gain immunity from copyright liability for photographs, text and other content loaded on our platform by consumers. However, differences between statutes, limitations on immunity, political and regulatory efforts to amend relevant statutes, and moderation efforts in the many jurisdictions in which we operate may affect our ability to claim immunity.
From time to time, we may be subject to legal proceedings and claims in the ordinary course of our business, including claims of alleged infringement by us of the trademarks, copyrights, patents, and other intellectual property rights of third parties. In addition, litigation may be necessary in the future to enforce our intellectual property rights,
protect our trade secrets or determine the validity and scope of proprietary rights claimed by others. Any such litigation, regardless of outcome or merit, could result in substantial costs and diversion of management and technical resources, any of which could materially harm our business.
Regulation
We are subject to a number of laws and regulations that affect companies conducting business on the internet as well as some relating to the travel industry, the provision of travel services and the vacation rental industry. As we continue to expand the reach of our brands into additional international markets and expand our product offerings, we are increasingly subject to additional laws and regulations. This includes laws and regulations regarding privacy and data protection, libel and defamation, content, digital services, intellectual property, distribution, electronic contracts and other communications, consumer protection, taxation, online payment services and competition, among others. These laws and regulations are constantly evolving and can be subject to significant change. Many of these laws and regulations are being tested in courts, and could be interpreted by regulators and courts in ways that could harm our business. In addition, the application and interpretation of these laws and regulations is often uncertain, particularly in the new and rapidly-evolving industry in which we operate. In addition, we provide advertising services and conduct marketing activities that are subject to consumer protection laws that regulate unfair and deceptive practices, domestically and internationally, including, in some countries, pricing display requirements, licensing and registration requirements and industry specific value-added tax regimes. The U.S. (as well as individual states), the E.U. (as well as member states) and other countries have adopted legislation that regulates certain aspects of the internet, including online editorial and user-generated content, data privacy, behavioral targeting and online advertising, taxation, and liability for third-party activities. It is difficult to accurately predict how such legislation will be interpreted and applied or whether new taxes or regulations will be imposed on our services, and whether or how we might be affected. Increased regulation of the internet could increase the cost of doing business or otherwise materially adversely affect our business, financial condition or operating results.
We are subject to laws that require protection of user privacy and user data. As our business has evolved, we continue to receive and store a greater volume of personal information. This data is increasingly subject to laws and regulations in numerous jurisdictions around the world. For example, in 2018, both the E.U. and United Kingdom adopted the General Data Protection Regulation, or GDPR. GDPR, which imposes stringent requirements on the processing of health and other sensitive data.
In the U.S., at the federal level, failing to take appropriate steps to keep consumers’ personal information secure may constitute unfair acts or practices in or affecting commerce in violation of Section 5(a) of the Federal Trade Commission Act, 15 U.S.C § 45(a). Regulators and legislators in the U.S. are also increasingly scrutinizing and restricting certain sensitive personal data transfers and transactions involving foreign countries. Also, in the U.S., an increasing number of state laws govern privacy and security of personal information. For example, in California, the California Consumer Protection Act, or CCPA, establishes a comprehensive privacy framework for covered businesses similar to those established under GDPR. Similar laws have been passed in numerous other states. These new laws will add complexity, variation in requirements, restrictions and potential legal risks; require additional investment of resources in compliance programs; impact data practices and the availability of previously useful data; and could result in increased compliance costs and/or changes in business practices and policies.
Compliance with these laws, rules and regulations has not had, and is not expected to have, a material effect on our business, results of operations and financial condition. However, there are, and will likely continue to be, an increasing number of laws and regulations pertaining to the internet and online commerce and/or information retrieved from or transmitted over the internet, online editorial and user-generated content, user privacy, behavioral targeting and online advertising, liability for third-party activities. Likewise, the SEC, Department of Justice (“DOJ”) and Office of Foreign Assets Controls (“OFAC”), as well as foreign regulatory authorities, have continued to increase the enforcement of economic sanctions and trade regulations, anti-money laundering, and anti-corruption laws, across industries. As regulations continue to evolve and regulatory oversight continues to increase, we cannot guarantee that our programs and policies will be deemed compliant by all applicable regulatory authorities.
For additional information about the Regulation risks, see “Risk Factors” under the section entitled “A failure to comply with existing or new laws, rules and regulations or changes to such laws, rules and regulations and other
legal uncertainties may adversely affect our business or financial results” in Part I, Item 1A of this Annual Report on Form 10-K.
Corporate History, Equity Ownership and Voting Control
Tripadvisor was founded in February 2000. In April 2004, Tripadvisor was acquired by IAC/InterActiveCorp, or IAC. In August 2005, IAC spun-off its portfolio of travel brands, including Tripadvisor, into Expedia, at the time a separate newly-formed Delaware corporation. On December 20, 2011 Expedia completed a spin-off of Tripadvisor into a separate publicly-traded Delaware corporation. We refer to this second spin-off transaction as the “Spin-Off.” Following the Spin-Off, on December 21, 2011, Tripadvisor began trading on The Nasdaq Global Select Market, or Nasdaq, as an independent public company under the trading symbol “TRIP.”
On December 11, 2012, Liberty Interactive Corporation, or Liberty, purchased an aggregate of approximately 4.8 million shares of common stock of Tripadvisor from Barry Diller, our former Chairman of the Board of Directors and Senior Executive, and certain of his affiliates. As a result, Liberty beneficially owned approximately 18.2 million shares of our common stock and 12.8 million shares of our Class B common stock.
On August 27, 2014, the entire beneficial ownership of our common stock and Class B common stock held by Liberty was acquired by Liberty TripAdvisor Holdings, Inc., or LTRIP. Simultaneously, Liberty, LTRIP’s former parent company, distributed, by means of a dividend, to the holders of its Liberty Ventures common stock, Liberty’s entire equity interest in LTRIP. We refer to this transaction as the “Liberty Spin-Off.” As a result of the Liberty Spin-Off, effective August 27, 2014, LTRIP became a separate, publicly traded company holding 100% of Liberty’s interest in Tripadvisor.
As a result of these transactions, and as of December 31, 2024, LTRIP beneficially owned approximately 14.0 million shares of our common stock and approximately 12.8 million shares of our Class B common stock, which constitute approximately 11% of the outstanding shares of common stock and 100% of the outstanding shares of Class B common stock. Assuming the conversion of all of LTRIP’s shares of Class B common stock into common stock, LTRIP would beneficially own approximately 19% of the outstanding common stock. However, because each share of Class B common stock is entitled to ten votes per share and each share of common stock is entitled to one vote per share, LTRIP may be deemed to beneficially own equity securities representing approximately 56% of our voting power.
On December 18, 2024, the Company, LTRIP and Telluride Merger Sub Corp., a Delaware corporation (“Merger Sub”) and an indirect wholly-owned subsidiary of the Company, entered into an Agreement and Plan of Merger (the “Merger Agreement”), pursuant to which, and subject to the terms and conditions, (i) Merger Sub will be merged with and into LTRIP (the “Merger”), with LTRIP surviving the Merger as the surviving corporation and an indirect, wholly-owned subsidiary of the Company, and (ii) immediately following the Merger, LTRIP (as the surviving corporation in the Merger) will be merged with and into TellurideSub LLC, a Delaware limited liability company and a direct wholly-owned subsidiary of the Company (“ParentSub LLC”) (such merger, the “ParentSub LLC Merger”), with ParentSub LLC surviving the ParentSub LLC Merger as the surviving company and a wholly-owned subsidiary of the Company.
In connection with the Merger, (i) the shares of LTRIP Series A Common Stock and Series B Common Stock issued and outstanding immediately prior to the effective time of the Merger will be converted into the right to receive $0.2567 per share in cash (without interest), totaling approximately $20 million in the aggregate; (ii) all of the shares of LTRIP's 8% Series A Cumulative Redeemable Preferred Stock issued and outstanding immediately prior to the effective time of the Merger will be converted into the right to receive, in the aggregate, approximately $42 million in cash, without interest, and 3,037,959 validly issued, fully paid and non-assessable shares of the Company's common stock; and (iii) LTRIP's 0.50% Exchangeable Senior Debentures of approximately $330 million will be repaid in accordance with their terms. Pursuant to the Merger Agreement, the Company will provide a loan facility (the “TRIP Loan Facility”) to LTRIP of approximately $330 million, to repay LTRIP debentures prior to the closing of the Merger. The TRIP Loan Facility will be repaid on the earlier of (i) the closing of the Merger, and (ii) 15 business days after the valid termination of the Merger Agreement or (b) such later date as jointly agreed to by LTRIP and the Company.
Assets held by LTRIP substantially consist of the shares of the Company’s common stock described above. As a result, the Company views this transaction effectively as a repurchase of the Company's common stock held by LTRIP and, as such, the Merger will be substantially accounted for as a treasury stock repurchase transaction. Upon consummation of the Merger, the Company plans to retire the approximately 26.8 million shares of the Company's common stock held by LTRIP as reported on LTRIP's Form 13-D/A filed on December 20, 2024. Following the closing of the Merger, the Company will no longer have a controlling shareholder or be considered a “controlled company”.
The transaction is subject to various closing conditions, including LTRIP stockholder approval, regulatory clearances, and other customary conditions. There can be no assurance that the conditions to closing will be satisfied or that the transactions contemplated by the Merger Agreement will be completed on the contemplated terms or timeline, or at all.
Human Capital Management
Employees
As of December 31, 2024, the Company had approximately 2,860 employees, with approximately 60%, 35%, and 5% of employees based in Europe, the U.S., and the rest of world, respectively. Additionally, we use independent contractors to supplement our workforce. Our employees and independent contractors are subject to our Code of Business Conduct and Ethics, which sets forth a commitment to operate in accordance with the highest ethical, professional, and legal standards. We believe we have good relationships with our employees and contractors, including relationships with employees represented by international works councils or other similar organizations. Our Board of Directors, Compensation Committee, and Section 16 Committee have oversight of our human capital management.
Talent Acquisition and Development
We believe our employees are essential to our success and that the Company’s success depends on our ability to attract, develop and retain key talent. The skills, experience and industry knowledge of key employees significantly benefit our operations and performance. Competition for qualified personnel is intense, particularly for software engineers, computer scientists, and other technical staff, and constrained labor markets have increased competition for personnel across other parts of our business. The Company's management and Board of Directors oversee various initiatives for talent acquisition, retention and development.
Our talent philosophy is to both develop talent from within and to strategically recruit key external talent. This approach has yielded a deep understanding, among our employee base, of our business, our products, and our customers, while adding new employees and ideas in support of our continuous improvement mindset. Our overall talent acquisition and retention strategy is designed to attract and retain qualified candidates to enable the success of the Company and achievement of our performance goals. We recruit the best people for the job without regard to gender, ethnicity or other protected traits and it is our policy to comply fully with all domestic, foreign and local laws relating to discrimination in the workplace. Our talent acquisition team uses internal and external resources to recruit highly skilled and talented workers, and we encourage employee referrals for open positions.
We support and develop our employees through global training and development programs that build and strengthen employees’ leadership and professional skills. Leadership development includes programs for new leaders as well as programs designed to support more experienced leaders. We also partner with external training organizations to help provide current and future workers with the knowledge and skills they need to succeed.
It is important that our employees represent a mix of experiences and backgrounds in order to make our company stronger, more innovative and more inclusive. Inclusion is one of our core values. Our inclusion initiatives support our goal that everyone throughout the Company is engaged in creating an inclusive workplace. We offer leadership training and support to ensure that all employees are supported in their careers. Additionally, we also support a network of active Employee Resource Groups, which are open to all employees.
Total Rewards
As part of our compensation philosophy, we believe that we must offer and maintain market competitive total rewards programs for our employees in order to attract, motivate and retain superior talent. These programs not only include base wages and incentives in support of our pay for performance culture, but also health, welfare, and retirement benefits.
We design our benefit programs to meet the needs of our employees’ health while managing program costs for escalation rates at or below industry trend factors. Our programs include but are not limited to wellness, mental health services, telemedicine, and partnerships with service providers that support diverse family-care need solutions. We continuously refine, develop and implement proactive health care strategies and solutions that allow us to enhance employee health and well-being while curbing costs.
Health and Safety
The health and safety of our employees is of utmost importance to us. We conduct regular self-assessments and audits designed to ensure compliance with our health and safety guidelines and regulatory requirements.
For additional information about Human Capital Management risks, see “Risk Factors” under the section entitled “Our future success depends on the performance of our key employees and our ability to attract, retain and engage senior management and a highly skilled workforce” in Part I, Item 1A of this Annual Report on Form 10-K.
Additional Information
We maintain an Investor Relations website at http://ir.tripadvisor.com/investor-relations. Except as explicitly noted, the information on our website, as well as the websites of our various brands, is not incorporated by reference in this Annual Report on Form 10-K, or in any other filings with, or in any information furnished or submitted to, the SEC.
On our Investor Relations website (http://ir.tripadvisor.com/investor-relations), we provide our Annual Reports on Form 10-K, Quarterly Reports on Form 10-Q and Current Reports on Form 8-K, and amendments to these reports free of charge. These reports are available on our website as soon as reasonably practicable after we electronically file or furnish these reports to the SEC or publish through press releases, public conference calls and certain webcasts. All documents filed electronically with the SEC (including reports, proxy and information statements and other information) are also available at www.sec.gov. Investors and others should be aware that in addition to required filings with the SEC, we use our Investor Relations website (http://ir.tripadvisor.com/investor-relations) to announce material financial information to our investors as well as communicate with the public about our company, our results of operations and other information.
We post our code of business conduct and ethics, which applies to all directors, officers, employees, contractors, and consultants, on our Investor Relations website at http://ir.tripadvisor.com/corporate-governance. We intend to disclose any amendments or waivers of the code of ethics for our executive officers, senior financial officers or directors, on our Investor Relations website.
Item 1A. Risk Factors
You should consider carefully the risks described below together with all of the other information included in this Annual Report as they may impact our business, results of operations and/or financial condition. The risks and uncertainties described below are not the only ones we face. Additional risks and uncertainties not presently known to us or that we currently believe are immaterial may also impair our business, results of operations or financial condition. If any of the following risks occur, our business, financial condition, operating results and cash flows could be materially and adversely affected.
Risk Factors Summary
The following is a summary list of the principal risks that make an investment in our securities speculative or risky. For additional information, please refer to the detailed descriptions following the summary.
•Declines or disruptions in the worldwide travel industry, including health concerns, natural disasters, terrorist attacks, civil or political unrest or other events outside our control;
•Our performance marketing efficiency and the general effectiveness of our advertising and marketing efforts;
•Any change by our search and metasearch partners in how they present travel search results or conduct their auctions for search placement in a manner that is competitively disadvantageous to us;
•Consummation of the Merger with LTRP, or failure to do so, could have material impacts on our stock price and financial performance;
•Our ability to adjust to consumer adoption of mobile devices and/or new technologies and product offerings;
•Our ability to attract and retain qualified personnel;
•Our ability to successfully manage growth and expand our global business;
•Our ability to respond to and keep up with the rapid pace of technological and market changes;
•IT systems-related failures or security breaches and data privacy risks and obligations;
•Tax, legal and regulatory risks;
•Risks associated with the facilitation of payments from consumers, including fraud and compliance with evolving rules and regulations and reliance on third parties;
•Fluctuations in foreign currency exchange rates and other risks associated with doing business in multiple currencies and jurisdictions;
•Success of strategic initiatives, investments and acquisitions, including integration; and
•Financial risks including increased debt levels and stock price volatility.
Risks Related to Our Business and Industry
If we are unable to continue to attract a significant number of visitors to our platform, to cost-effectively convert these visitors into revenue-generating customers and to continue to engage consumers, our business and financial performance could be harmed. Our traffic and user engagement could be adversely affected by a number of factors including, but not limited to, inability to provide quality content, lack of inventory or supply in amounts or of sufficient quality to be attractive to our consumers, increasing use of metasearch engines which may impact the amount of traffic to our platform, declines or inefficiencies in traffic acquisition and reduced awareness of our brands. Certain of our competitors have advertising campaigns expressly designed to drive traffic directly to their websites, and these campaigns may negatively impact traffic to our platform. There can be no assurances that we will continue to provide content and products in a manner that meets rapidly changing demand. Any failure to obtain and manage content and products in a cost-effective manner that will engage consumers, or any failure to provide content and products that are perceived as useful, reliable and trustworthy, could adversely affect user experiences and their repeat behavior, reduce traffic to our platform and negatively impact our business and financial performance.
We rely on internet search engines, metasearch engines and application marketplaces to drive traffic to our platform, certain providers of which offer products and services that compete directly with ours. If we are unable to drive traffic cost-effectively, traffic to our platform could decline and our business would be negatively affected. The number of consumers we attract to our platform is due in large part to how and where information from, and links to, our platform are displayed on search engine results pages, or SERPs, and search aggregators, or
metasearch engines. The display, including rankings, of search results can be affected by a number of factors, many of which are not in our control. Search engines (including travel metasearch engines) frequently change the logic that determines the placement and display of the results of a user’s search, such that the purchased or algorithmic placement of links to our platform can be negatively affected. A search engine could alter its search algorithms or results causing our websites to place lower in search query results. For example, Google, a significant source of traffic to our platform, frequently promotes its own competing products in its search results, which has negatively impacted placement of references to our company and our platform on the SERP. If a major search engine changes its algorithms in a manner that negatively affects the search engine ranking of our websites or those of our travel partners, or if competitive dynamics impact the cost or effectiveness of Search Engine Optimization (“SEO”) or Search Engine Marketing (“SEM”) in a negative manner, our business and financial performance would be adversely affected. Furthermore, our failure to successfully manage our SEO and SEM strategies and/or other traffic acquisition strategies could result in a substantial decrease in traffic to our platform, as well as increased costs to the extent we replace free traffic with paid traffic.
We also rely on application marketplaces, or app stores such as Apple’s App Store and Google’s Play, to drive downloads of our apps. In the future, Apple, Google or other marketplace operators may make changes that make access to our products more difficult or may limit our access to information that would restrict our ability to provide the best user experience. For example, Google’s online travel offerings have continued to grow rapidly by linking travel search services to its dominant search functionality through flight, hotel and alternative accommodations meta-search products. Our apps may receive unfavorable treatment compared to the promotion and placement of competing apps, such as the order in which they appear within marketplaces. In addition, the app stores, including Apple, continue to issue privacy enhancing policies including requirements on developers to provide enhanced descriptions regarding their data handling practices and enhanced permission requirements for in-app tracking. These policies may negatively impact the effectiveness of our data tracking capabilities. Similarly, if problems arise in our relationships with providers of application marketplaces, traffic to our platform and our user growth could be harmed.
Our strategy may be unsuccessful and may expose us to additional risks. If our strategy does not achieve its expected benefits, there could be negative impacts to our business, financial condition and results of operations. We are implementing discrete strategies across each segment which are connected and reinforce a cohesive strategy across the Tripadvisor group as described in “Our Business Strategy” herein. There are no assurances that we will be successful in executing our strategies. Our efforts may prove more difficult than we currently anticipate. Further, we may not succeed in realizing the benefits of these efforts on our anticipated timeline or at all. In addition, as we implement our strategies, the macroeconomic environment, including but not limited to, inflationary pressures, higher labor costs, and changes in consumer and merchant behavior may make it more difficult to effectively execute our strategy. Even if fully implemented, our strategy may not result in growth or the other anticipated benefits to our business, financial condition and results of operations. If we are unable to effectively execute our strategy and realize its anticipated benefits, it could negatively impact our business, financial condition and results of operations.
We derive a substantial portion of our revenue from advertising and any significant reduction in spending by advertisers on our platform could harm our business. Our ability to grow advertising revenue with our existing or new travel partners is dependent in large part on our ability to provide value to them relative to other alternatives. Our ability to provide value to our travel partners depends on a number of factors, including, but not limited to, the following:
•Our ability to increase or maintain user engagement;
•Our ability to increase or maintain the quantity and quality of ads shown to consumers;
•The development of technologies that can block the display of our ads or our ad measurement tools;
•The effectiveness of our advertising and the extent to which it generates sales leads, customers, bookings or financial results on a cost-effective basis, including our mobile transaction conversion rate;
•The competitiveness of our products, traffic quality, perception of our platform, including mobile applications, and availability and accuracy of analytics and measurement solutions to demonstrate our value; and
•Adverse government actions or legal developments relating to advertising, including limitations on our ability to deliver targeted advertising.
Any of these or other factors could result in a reduction in demand for our ads, which may reduce the prices we receive for our ads, or cause marketers to stop advertising with us altogether, any of which would negatively affect our revenue and financial results.
Click-based advertising revenue accounts for the majority of our advertising revenue. Our pricing for click-based advertising depends, in part, on competition between advertisers. If our large advertisers become less competitive with each other, merge with each other or with our competitors, focus more on cost-per-click, or CPC, profit than on traffic volume, or are able to reduce CPCs, this could have an adverse impact on our advertising revenue which would, in turn, have an adverse effect on our business, financial condition and results of operations.
We rely on a relatively small number of significant travel partners and any reduction in spending by or loss of these partners could seriously harm our business. For the year ended December 31, 2024, our two most significant travel partners, Expedia and Booking (and their subsidiaries), accounted for a combined 22% of total revenue, with most of this revenue recorded within our Brand Tripadvisor segment. If any of our significant travel partners were to cease or significantly curtail advertising on our platform, we could experience a rapid decline in our revenue over a relatively short period of time which would have a material impact on our business. Similarly, if we are unable to identify or expand our relationships with new or existing travel partners, it could harm our ability to attract and engage visitors on our platform.
Our business depends on strong brands and any failure to maintain, protect or enhance our brands could hurt our ability to retain and expand our base of consumers and partners, the frequency with which consumers utilize our products and services and our ability to attract partners. Our ability to maintain and protect our brands depends, in part, on our ability to maintain consumer trust in our products and services and in the quality, integrity, reliability and usefulness of the content and other information found on our platform. If consumers do not view the content on our platform to be useful and reliable, they may seek other sources to obtain the information they are looking for and may not return to our platform as often or at all. We dedicate significant resources to protecting the quality of our content, primarily through our content guidelines, computer algorithms and human moderators that are focused on identifying and removing inappropriate, unreliable or deceptive content.
Media, legal, or regulatory scrutiny of our user content, advertising practices, and other issues may adversely affect our reputation and brand. Negative publicity about our company, including our content, technology and business practices, could diminish our reputation and confidence in our brand, thereby negatively affecting the use of our products and our financial performance. For example, in the past, certain media outlets have alleged that we have improperly filtered or screened reviews, that we have not properly verified reviews, or that we manipulate reviews, ranking and ratings in favor of our advertisers. We expend significant resources to ensure the integrity of our reviews and to ensure that the most relevant reviews are available to our consumers; we do not establish rankings and ratings in favor of our advertisers. Regulatory inquiries or investigations require management time and attention and could result in further negative publicity, regardless of their merits or ultimate outcomes.
In addition, unfavorable publicity regarding, for example, our practices relating to privacy and data protection could adversely affect our reputation with our consumers and our partners. Such negative publicity also could have an adverse effect on the size, engagement, and loyalty of our user base and result in decreased revenue.
Weak economic conditions, including those that cause declines or disruptions in the travel industry or reduce consumer discretionary spending have, in the past, had a material adverse impact on the Company’s business and financial performance and could have a material adverse impact on our businesses, financial performance and the market price of our common stock. Our business and financial performance are affected by the health of the worldwide travel industry, including macroeconomic conditions and events beyond our control. Events beyond our control, such as macroeconomic factors (including tightening of credit markets, elevated levels of inflation, and declines in consumer confidence), health concerns (including epidemics or pandemics), unusual or extreme weather or natural disasters, travel-related health concerns, restrictions related to travel, trade or immigration policies, regional hostilities or instability, wars, terrorism, sources of political uncertainty, foreign policy changes, regional hostilities, natural disasters, imposition of taxes or surcharges by regulatory authorities, significant increases in energy costs, labor unrest or travel-related accidents, can disrupt travel globally or otherwise result in declines in travel demand. For example, recent conflicts between Ukraine and Russia and Israel and Hamas have impacted travel to those regions and the surrounding regions.
Governments worldwide are increasingly implementing restrictive travel policies and enhanced border controls that could limit international mobility. These developments include, but are not limited to, the introduction
of digital travel authorization systems and increased visa requirements, enhanced security screening and background check requirements, regional travel blocks and reciprocal entry restrictions, health-related entry requirements and screening protocols, and environmental impact restrictions. These restrictions could reduce travel demand, increase the complexity and cost of international travel, or make certain destinations inaccessible to travelers from specific regions.
Sales of travel and/or leisure products tend to decline or grow more slowly during economic downturns and times of inflation when consumers engage in less discretionary spending, are concerned about unemployment or economic weakness, have reduced access to credit or experience other concerns that reduce their ability or willingness to travel. In addition, the uncertainty of macroeconomic factors and their impact on consumer behavior makes it more difficult to forecast industry and consumer trends, which in turn has in the past and could in the future adversely affect our ability to effectively manage our business. Leisure travel, which accounts for a substantial majority of our current business, is particularly dependent on discretionary consumer spending levels. For example, the United States and other countries have continued to experience elevated inflation which has created economic uncertainty and has impacted and may impact consumer demand in the travel industry. Economic downturn and adverse market conditions may also negatively impact our partners, our partners’ access to capital, cost of capital and ability to meet liquidity needs. These challenges faced in a prolonged economic downturn or deterioration in the travel industry could adversely impact our business, financial performance and share price. The extent and duration of such impacts remain largely uncertain and dependent on future developments that cannot be accurately predicted at this time.
We operate in a competitive global environment and our failure to compete effectively could reduce our market share and harm our financial performance. We compete with different types of companies in the various markets and geographies where we operate, including large and small companies in the travel and leisure space as well as broader service providers. We face competition for content, consumers, advertisers, online travel search and price comparison services and online reservations. We compete globally with both online and offline, established and emerging, providers of travel, lodging, experiences and restaurant reservation and related services. Current and new competitors can launch new services at a relatively low cost. More specifically:
•General OTAs, such as Expedia, Booking, Airbnb, Traveloka, Despegar, Trip.com, and their respective subsidiaries and operating companies;
•Experiences OTAs, such as GetYourGuide, Klook, and TUI Musement;
•Hotel metasearch providers, such as trivago, Kayak and Skyscanner;
•Online search, social media, and marketplace platforms for advertising spend, such as Google, Facebook, X, Pinterest, and Snap;
•Global and regional travel, experiences, and restaurant brands seeking to promote direct bookings;
•Emerging online advertising businesses, such as ad-supported retail and entertainment platforms like Amazon, Spotify, and Walmart;
•Artificial intelligence ("AI") driven travel curators, such as Travel Plan AI, Aitinerary, Wonderplan, Roam Around and similar websites;
•Traditional offline travel agencies; and
•Global and regional restaurant technology providers for reservation management and related services, such as OpenTable, Resy, and Tock.
There has been a proliferation of new channels through which service providers can offer accommodations, experiences and restaurant reservations. Metasearch services may lower the cost for new companies to enter the market by providing a distribution channel without the cost of promoting the new entrant’s brand to drive consumers directly to its website. Some of our competitors offer a variety of online services and, in some cases, are willing to make little or no profit on a transaction, or offer travel services at a loss, in order to gain market share. Many of our competitors have significantly greater financial, technical, marketing and other resources and have more expertise in developing online commerce and facilitating internet traffic as well as larger client bases. They also have the ability to leverage other aspects of their business to enable them to compete more effectively.
In addition, Google and other large, established companies with substantial resources and expertise have launched travel or travel-related search, metasearch and/or reservation booking services and may create additional inroads into online travel. Many of our competitors continue to expand their voice and AI capabilities, which may provide them with a competitive advantage in travel.
We compete with certain companies that we also do business with, including certain of our travel partners and related parties. The consolidation of our competitors and travel partners may affect our relative competitiveness and our travel partner relationships. Competition and consolidation could result in higher traffic acquisition costs, reduced margins on our advertising services, loss of market share, pricing pressure, reduced customer traffic to our platform and reduced advertising by travel companies on our platform.
We rely on information technology to operate our business and remain competitive, and any failure to adapt to technological developments or industry trends could harm our businesses. Our future success depends on our ability to continuously improve and upgrade our systems and infrastructure to meet rapidly evolving consumer trends and demands while at the same time maintaining the reliability and integrity of our systems and infrastructure. We may not be able to maintain or replace our existing systems or introduce new technologies and systems as quickly as we would like or in a cost-effective manner. We may not be successful, or as successful as our competitors, in developing technologies and systems that operate effectively across multiple devices and platforms in a way that is appealing to our consumers.
The markets in which we operate are characterized by rapidly changing technology, evolving industry standards, frequent new service announcements and enhancements, and changing consumer demands and preferences. Our future success will also depend on our ability to adapt to emerging technologies such as tokenization; chatbot; new authentication technologies, such as biometrics, distributed ledger and blockchain technologies; new and emerging payment methods, such as Alipay, Paytm and WeChat Pay; AI; virtual and augmented reality; and cloud technologies. For example, we incorporate AI in certain of our operations. In July 2023, we launched an AI-powered travel itinerary generator which creates personalized travel itineraries using OpenAI’s generative AI technology. AI-generated content and recommendations may contain errors, biases, or inappropriate content that could damage our brand reputation and user trust. The use of AI presents risks and challenges because in some instances we may make use of third-party foundational models that have been pre-trained on data which may be insufficient, erroneous, stale, contain biased information, or infringe IP rights. Additionally, the output produced by these models may be inaccurate, misleading, discriminatory, offensive, illegal or otherwise harmful. Such risks are heightened if we or third-party developers or vendors lack sufficient responsible AI development or governance practices. These deficiencies and other failures of AI systems could subject us to competitive harm, regulatory action, legal liability, and brand or reputational harm. In addition, there is no guarantee that our itinerary generator or other AI focused initiatives will be competitive or attract more consumers to our platform.
The emergence of alternative or new devices and the emergence of niche competitors who may be able to optimize products, services or strategies for such platforms will require additional investments in technology. New developments in other areas could also make it easier for competitors to enter our markets due to lower up-front technology costs. Many of our competitors, including major technology companies, are developing or deploying AI-powered travel planning and booking tools that could reduce reliance on traditional travel platforms. We may not be able to keep up with these rapid changes and our ability to integrate and develop new and evolving technologies will require increased financial and personnel investments that could have an adverse impact on our operations unless and until we achieve expected return on these investments. Our future success will depend on our ability to adapt to rapidly changing technologies, to adapt our services and platform to evolving industry standards and local preferences, and to continually innovate and improve the performance, features, and reliability of our services and online platforms in response to competitive service offerings and the evolving demands of the marketplace.
If we are unable to adapt to the evolving demands of our customers, we may not remain competitive, and our business and financial performance could suffer. Our competitors are continually developing innovations in services and features. As a result, we are continually working to improve the user experience on our platform in order to engage our consumers and drive user traffic and conversion rates for our partners and provide our business partners with the tools they need to succeed. We have invested, and expect to continue to invest, significant resources in developing and marketing these innovations. We can give no assurances that the changes we make will yield the benefits we expect and will not have unintended or adverse impacts. If we are unable to continue offering innovative products and services and quality features that customers want to use, existing customers may become dissatisfied and use competitors’ offerings and we may be unable to attract additional customers, which could adversely affect our business and financial performance.
Our dedication to making the consumer experience our highest priority may cause us to prioritize rapid innovation and consumer experience over short-term financial results. We strive to create the best experience for
our consumers. We believe that in doing so we will increase our traffic conversion (i.e., visitors converting into clicks and/or bookings), revenue and financial performance. We have taken actions in the past, and may continue to take actions in the future, that have the effect of reducing our short-term financial results if we believe the actions benefit the overall consumer experience. These decisions may not produce the long-term benefits we expect, new or enhanced products may fail to engage consumers and/or we may be unsuccessful in our efforts to monetize these initiatives, in which case our relationships with consumers and partners, and our business and financial performance could be harmed.
We are dependent upon the quality of traffic in our network to provide value to our partners, and any failure in our ability to deliver quality traffic and/or the metrics to demonstrate the value of the traffic could have a material and adverse impact on the value of our platform to our partners and adversely affect our revenue. We use technology and processes to monitor the quality of the internet traffic that we deliver to our partners and have identified metrics to demonstrate the quality of that traffic and identify low quality clicks such as non-human processes, including robots, spiders, the mechanical automation of clicking and other types of invalid clicks or click fraud. Even with such monitoring in place, there is a risk that a certain amount of low-quality traffic will be delivered to such online advertisers. The proliferation of AI technologies could significantly impact the quality of traffic to our platform and we face increasing risks related to automated and artificial traffic generation. Such low-quality or invalid traffic may be detrimental to our relationships with partners and could adversely affect our advertising pricing and revenue.
We rely on assumptions and estimates and data to calculate certain of our key metrics, and real or perceived inaccuracies in such metrics may harm our reputation and negatively affect our business. Certain metrics are key to our business; as both the industry in which we operate and our businesses continue to evolve, so too might the metrics by which we evaluate our businesses. While the calculation of the metrics we use is based on what we believe to be reasonable estimates, our internal tools are not independently verified by a third-party and have a number of limitations; furthermore, our methodologies for tracking these metrics may change over time. For example, a single person may have multiple accounts or browse the internet on multiple browsers or devices, some consumers may restrict our ability to accurately identify them across visits, some mobile apps automatically contact our servers for regular updates with no user action, and we are not always able to capture user information on our platform. As such, the calculations of our unique users may not accurately reflect the number of people actually visiting our platform. If the internal tools we use to track these metrics under-count or over-count performance or contain algorithms or other technical errors, the data we report may not be accurate. We continue to improve upon our tools and methodologies to capture data; however, the improvement of our tools and methodologies could cause inconsistency between current data and previously reported data, which could confuse investors or lead to questions about the integrity of our data. Finally, we may, in the future, identify new or other metrics that enable us to more accurately evaluate our business. Accordingly, investors should not place undue reliance on these metrics.
Our future success depends on the performance of our key employees and our ability to attract, retain and engage senior management and a highly skilled workforce. In particular, we are highly dependent on the services of our leadership team for the development of and our execution on our vision and strategy. Over the last few years, we have made several changes to our senior leadership group. Our future performance will depend, in part, on the successful integration of these new senior level executives into their roles. If we do not successfully manage these additions, it could be viewed negatively by our investors, employees, and partners, and could have an adverse impact on our business and results of operations. We also heavily rely on the continued service and performance of our senior management team, which provides leadership, contributes to the core areas of our business and helps us to efficiently execute on mission, vision and strategic initiatives. If we are unable to retain members of our senior management team, including our executive leadership, we may not be able to manage our business effectively and, as a result, our business and operating results could be harmed. If the senior management team fails to work together effectively and to execute our plans and strategies on a timely basis, then our business and future growth prospects could be harmed. Additionally, our ability to protect our competitive position may be limited by restrictions on the enforceability of non-competition provisions we have entered into with certain of our employees (including officers) in various jurisdictions, which could enable our former employees to more readily compete with us or use our confidential information at competing enterprises, potentially harming our business relationships and operational results.
The success of our operations and the quality of our services are also highly dependent on our ability to attract, retain and engage skilled personnel. For employees, we compete with companies that have far greater financial resources than we do as well as companies that promise short-term growth opportunities and/or other
benefits. If we do not succeed in attracting a well-qualified workforce or retaining or motivating existing talent, our business would be adversely affected.
The composition of our work force, in terms of geographic location, in person or remote and full-time employees or independent contractors, creates challenges and risks and failure to properly manage those risks could have a negative impact on our business. In response to the COVID-19 pandemic, much of our work force began working remotely and continue to work remotely today. In addition, following the COVID-19 pandemic, our work force has increasingly shifted outside the U.S. and to independent contractors versus full-time employees. Managing a remote and independent work force can give rise to cybersecurity, legal and regulatory issues and training and compliance issues, as well as create operational or other challenges, any of which could harm our business. For example, our workers are classified as either employees or non-employees (including as independent contractors or agency workers). Our employees in the U.S. are classified as either exempt from overtime or non-exempt (and therefore overtime eligible) and if we are found to have misclassified employees including as independent contractors, agency workers or independent contractors, agency workers or non-exempt employees as exempt, we could face penalties and have additional exposure under U.S. federal and state tax, workers’ compensation, unemployment benefits, labor, employment and tort laws, as well as similar international laws, including for prior periods, as well as potential liability for employee overtime and benefits and tax withholdings.
Acquisitions, investments, significant commercial arrangements and/or new business strategies could present new challenges and risks and disrupt our ongoing business. We have acquired, invested in and/or entered into significant commercial arrangements with a number of businesses in the past and our future growth may depend, in part, on future acquisitions, investments, commercial arrangements and/or changes in business strategies. Such endeavors have in the past and may in the future involve significant risks and uncertainties, including, but not limited to, the following:
•Costs incurred to identify, pursue and fund these endeavors that may or may not be successful and may limit other potential uses of cash;
•Diversion of management’s attention or other resources from our existing business;
•Difficulties and expenses in integrating the operations, products, technology or personnel;
•Difficulties in implementing and retaining uniform standards, controls, procedures, governance structure, policies and information systems;
•Assumption of debt and liabilities, including costs associated with litigation, cybersecurity risks, and other claims;
•Failure of any such strategy or target to achieve anticipated objectives, revenues or earnings;
•Limited management or operational control and heightened reputational risk with respect to minority investments;
•Entrance into markets in which we have no prior experience;
•Amortization expenses related to acquired intangible assets and other adverse accounting consequences; and
•Adverse market reaction to the transaction.
We have in the past invested, and may in the future invest, in privately-held companies. Such investments are inherently risky and our ability to liquidate any such investments is typically difficult. Valuations of such privately-held companies are inherently complex and uncertain due to the lack of liquid market for the companies’ securities. We cannot assure you that these investments will be successful or that such endeavors will result in the realization of the synergies, cost savings and innovation that may be possible within a reasonable period of time, if at all. We could lose the full amount of our investments; any impairment of our investments could have a material adverse effect on our financial results.
Risks Related to Legal and Regulatory Matters
We are a global company that operates in many different jurisdictions inside and outside the U.S. and these operations expose us to additional risks. Many regions have different economic conditions, languages, currencies, legislation, regulatory environments, levels of political stability, and consumer expectations. We are subject to risks typical of global businesses, including, but not limited to, the following:
•Compliance with additional laws and regulations, including but not limited to, those regarding data privacy, AI, labor and employment, advertising, anti-competition and tax;
•Difficulties in managing our human capital and operations due to distance, time zones, language, status as an independent contractor or agency worker versus employee and cultural differences;
•Restrictions on repatriation of cash and on investments in operations;
•Uncertainty regarding liability for services, content and intellectual property rights;
•Increased risk and limits on enforceability of intellectual property rights;
•Diminished ability to legally enforce contractual rights;
•Currency exchange rate fluctuations;
•Economic or political instability or laws involving economic or trade prohibitions, sanctions or travel restrictions; and
•Threatened or actual acts of terrorism.
Our strategy includes continued expansion in existing markets and potentially new markets. In addition to the risks mentioned above, international markets have strong local competitors with established brands and travel service providers or relationships that may make expansion in certain markets difficult and costly and take more time than anticipated. In some markets, legal and other regulatory requirements may prohibit or limit participation by foreign businesses, such as by making foreign ownership or management of internet or travel-related businesses illegal or difficult or may make direct participation in those markets uneconomic, which could make our entry or expansion in those markets difficult or impossible, require that we work with a local partner or result in higher operating costs. If we are unsuccessful in expanding in existing and potentially new markets and effectively managing that expansion, our business and financial results could be adversely affected.
We are regularly subject to claims, lawsuits, government investigations, and other proceedings which may result in adverse outcomes and, regardless of the outcome, result in legal costs, diversion of management resources, injunctions or damage awards, and other negative results. It is possible that a resolution of one or more such proceedings could result in substantial damages, fines or penalties that could adversely affect our business, financial results or financial position. These proceedings could also result in reputational harm, criminal sanctions or consent decrees, the release of confidential information or orders preventing us from offering certain features, functionalities, products, or services, requiring a change in our business practices. Any of these consequences could adversely affect our business and financial results.
A failure to comply with existing or new laws, rules and regulations or changes to such laws, rules and regulations and other legal uncertainties may adversely affect our business or financial results. Our business and financial results could be adversely affected by unfavorable changes in or interpretations of existing laws, rules and regulations or the promulgation of new laws, rules and regulations applicable to us and our business, including, but not limited to, those relating to internet and online commerce, internet advertising, consumer protection, intermediary liability, cybersecurity, data protection and privacy. These laws continue to evolve. For example, there is, and will likely continue to be, an increasing number of laws and regulations pertaining to internet and online commerce and payments, cybersecurity and privacy, artificial intelligence, and liability for information retrieved from or transmitted over the internet, online editorial and user-generated content, behavioral targeting and online advertising and liability for third-party activities. The use of AI in our operations also subjects us to evolving regulations and potential liability related to algorithmic decision-making, automated content generation, and AI governance requirements. Likewise, the SEC, DOJ and OFAC, as well as foreign regulatory authorities, have continued to increase the enforcement of economic sanctions and trade regulations, anti-money laundering, and anti-corruption laws, across industries. Operating in this dynamic regulatory environment requires significant management attention and financial resources. As regulations continue to evolve and regulatory oversight continues to increase, we cannot guarantee that our programs and policies will be deemed compliant by all applicable regulatory authorities. The failure of our businesses to comply with these laws and regulations could result in fines and/or proceedings against us by governmental agencies, regulatory authorities, courts and/or consumers, which, if material, could adversely affect our business and financial results.
The promulgation of new laws, rules and regulations, or the applicability or new interpretations of existing laws, rules and regulations, could require us to change certain aspects of our business, operations and relationships to ensure compliance, which could decrease demand for services, reduce revenues, increase costs and/or subject the Company to additional liabilities. For example, many jurisdictions have adopted, and many jurisdictions are considering adopting, privacy rights and consumer protections for their residents, which legislation will continue to change the landscape for the use and protection of data and could increase the cost and complexity of delivering our services. In addition, in the event we redomesticate, by conversion, from a corporation organized under the laws of
the State of Delaware to a corporation organized under the laws of the State of Nevada (the “Redomestication”), such Redomestication will result in changes to our charter documents and may result in changes to certain aspects of our corporate governance practices. Unfavorable changes could limit our marketing methods and capabilities, decrease demand for our products and services, impede development of new products, require significant management time, increase costs and/or subject us to additional liabilities. Violations of these laws and regulations could result in penalties, criminal sanctions and/or negative publicity against us, our officers or our employees and/or restrictions on the conduct of our business. Regardless of election results in any particular country, it is unknown at this time to what extent new legislation will be passed into law or pending or new regulatory proposals will be adopted, or the effect that such passage or adoption will have, positively or negatively, on our business.
We face risks related to our intellectual property. We rely on content, brands and technology, much of which is proprietary. We protect our content, brands and technology by, among other things, a combination of maintenance and enforcement of registered and unregistered intellectual property rights (e.g. trademarks, copyrights and trade secrets), technological solutions and contractual protections. Even with these precautions, it may be possible for another party to copy or otherwise obtain and use our intellectual property, without authorization or to independently develop similar content, brands or technology. Any misappropriation or violation of our rights could have a material adverse effect on our business.
Effective intellectual property protection may not be available in every jurisdiction in which our platform or services are made available and policing unauthorized use of our intellectual property can be difficult and expensive. Therefore, in certain jurisdictions, we may be unable to adequately protect our intellectual property against unauthorized third-party copying or use. We cannot be sure that the steps we have taken will prevent misappropriation or infringement of our intellectual property. Furthermore, we may need to go to court or other tribunals in order to enforce our rights or the proprietary rights that we have lawfully obtained from others. These proceedings might result in substantial costs and diversion of resources and management attention, and we cannot accurately predict the likelihood of success in such proceedings. Our failure to protect our intellectual property in an effective manner could have a material adverse effect on our business.
We currently license some of the intellectual property displayed on our platform from third parties. As we continue to introduce new services that incorporate new intellectual property, we may be required or elect to license additional intellectual property. We cannot be sure that such licenses will be available on commercially reasonable terms, if at all.
From time to time, in the ordinary course of our business, we have been subject to, and are currently subject to, legal proceedings and claims relating to third-party intellectual property rights, often related to user-generated content, and we expect that third parties will continue to assert intellectual property claims against us, particularly as we expand the complexity and scope of our platform and services. Successful intellectual property claims against us could result in significant monetary liability or prevent us from operating our business, or portions of our business, or require us to change business practices or develop non-infringing intellectual property, which could require significant effort and expense. In addition, resolution of claims may require us to obtain releases or licenses to use intellectual property assets belonging to third-parties, which may be expensive to procure, or possibly to cease using those assets altogether. Any of these events could have a material adverse effect on our business, results of operations and financial condition.
Greenhouse gas emissions are driving global climate change that is expected to have various impacts on travel, including the world’s transportation infrastructure and tourist destinations, and such impact could have a negative impact on our operations. The long-term effects of climate change on the global economy and the industry in which we operate and our business, in particular, are unclear; however, we recognize that there are inherent climate-related risks wherever business is conducted. For example, as climate change continues to warm the planet and make weather more extreme, much of the world’s transportation infrastructure will become less safe and reliable. Some of today’s popular tourist destinations may become intolerable as heat waves make some places unbearable and increase the chance of forest fires. Some may disappear altogether as rising seas flood low-lying islands and coastal areas. Venice, a UNESCO World Heritage site, has always been vulnerable to flooding, but in the last 20 years, there have been almost as many “high water” floods as during the previous 100 years. In other major cities, such as Amsterdam, Tokyo, Cape Town, Rio de Janeiro and New York, extreme flooding could also become a regular occurrence.
Cruise ship tourism has a larger carbon footprint than any other kind of travel and extreme weather such as intense hurricanes and storms is making cruising more dangerous. Rising sea levels can make it difficult for cruise
ships to dock at coastal ports because they are vulnerable to changing sea levels, as well as extreme weather. Rising seas also degrade beaches and pose significant risks to the very viability of some low-lying cruise destinations, such as Key West, Fla., Fiji, Palau, Seychelles, and the Maldives. Coastal tourism, the largest component of the tourism industry, is threatened also by the acidification of oceans. Half of the world’s coral reefs, which contribute billions annually to global tourism income each year, have already been lost or seriously damaged. Australia’s Great Barrier Reef, which has sustained serious damage from ocean acidification caused by the ocean’s uptake of CO2, coral bleaching, pollution, overfishing—and too much tourism—has lost more than half of its corals since 1995.
Shifts in consumer preferences and governmental policy developments have the potential individually or collectively to significantly disrupt travel and impact our business as well as negatively affect our suppliers, business partners and members. Experiencing or addressing the various physical, regulatory and adaptation/transition risks from climate change may impact our revenues and profitability.
Increased focus on environmental, social, and governance ("ESG") matters and our inability to meet expectations with respect to ESG may have an adverse impact on our reputation, employee retention and business. Certain institutional, individual, and other investors, consumers, employees and other stakeholders are increasingly focused on ESG practices of companies, which includes practices surrounding climate change, greenhouse gas emissions, human and civil rights, diversity, equity and inclusion, and a company’s overall corporate governance profile. Some investors may use these non-financial performance factors to guide their investment strategies and, in some cases, may choose not to invest in us if they believe our policies and actions relating to ESG are inadequate. Our disclosures on these matters, or a failure to meet evolving stakeholder expectations for ESG practices and reporting, may potentially harm our reputation and customer relationships. Organizations implementing ESG programs may face pushback from ESG opponents regarding their sustainability efforts or any modifications to these programs. There is also potential exposure to unfavorable reactions from regulatory bodies, such as anti-ESG legislation or regulatory measures, or from the public through means like consumer boycotts or negative press coverage, which could impact our standing, operations, and financial performance.
As ESG best practices and reporting standards continue to develop, we may incur increasing costs relating to ESG monitoring and reporting and complying with ESG initiatives. Ensuring there are systems and processes in place to comply with the various ESG tracking and reporting obligations may require management time and expense. As we look to respond to evolving standards for identifying, measuring, and reporting ESG metrics, our efforts may result in a significant increase in costs and may nonetheless not meet investor or other stakeholder expectations, which may negatively impact our financial results, our reputation, our ability to attract or retain employees, our attractiveness as a service provider, investment, or business partner, or expose us to, private litigation, and actions by stockholders or stakeholders. In addition, if our competitors’ ESG performance is perceived to be better than ours, potential or current investors may elect to invest with our competitors.
Risks Related to Information Security, Cybersecurity and Data Privacy
Our processing of personal information and other data subjects us to risks and laws and regulations and could give rise to cyberattacks and other risks, including damage to our reputation and value of our brands. Respecting user privacy and protecting personal information is essential to maintaining consumer and service provider confidence in our services and brands. We are subject to a variety of laws in the U.S. and abroad regarding privacy and the processing and protection of personal information, the scope of which are changing, subject to differing interpretations, and may be inconsistent between countries or conflict with other existing laws. The existence of comprehensive privacy laws in different states around the country would make our compliance obligations more complex and costly and may increase the likelihood that we could become subject to enforcement actions or otherwise incur liability for noncompliance.
All of these rapidly evolving compliance and operational requirements impose significant costs, which are likely to increase over time, such as costs related to organizational changes, implementing additional protection technologies, training employees and engaging consultants and legal advisors. In addition, such requirements may obligate us to modify our data processing practices and policies, utilize management’s time and/or divert resources from other initiatives and projects. Implementing and complying with these laws and regulations may be more costly or take longer than we anticipate, or could otherwise affect our operations. Any failure or perceived failure by us to comply with our privacy and information security policies, privacy-related obligations to consumers or other third parties, or privacy-related legal obligations, may result in fines, litigation or governmental enforcement actions that
could harm our reputation and cause our consumers and partners to lose trust in us, any of which could have an adverse effect on our business, brands, market share and financial results.
System security issues, data protection breaches, cyberattacks and system outage issues could disrupt our operations or services provided to our consumers, and any such disruption could damage our reputation and adversely affect our business, financial results and share price. Our reputation and ability to attract, retain and service our consumers and partners is dependent upon the reliable performance and security of our computer systems and those of third parties we utilize in our operations. Significant security issues, data breaches, cyberattacks and outages, interruptions or delays, in our systems or third-party systems upon which we rely, could impair our ability to display content or process transactions and significantly harm our business. Breaches of our security measures and those of our partners or the accidental loss, inadvertent disclosure or unapproved dissemination of proprietary information or sensitive or confidential data about us, our consumers or our partners, could expose us, our consumers and partners to a risk of loss or misuse of this information, damage our brand and reputation or otherwise harm our business and financial performance and could result in government enforcement actions and litigation and potential liability for us. The costs of enhancing infrastructure to attain improved stability and redundancy may be time consuming and expensive and may require resources and expertise that are difficult to obtain. In addition, to the extent that we do experience a data breach, remediation may be costly and we may not have adequate insurance to cover such costs.
We and our third party partners and vendors are at constant risk of cyber-attacks or cyber intrusions via viruses, worms, break-ins, malware, ransomware, phishing attacks, hacking, denial-of-service attacks or other attacks and similar disruptions from the unauthorized use of or access to computer systems (including from internal and external sources) that attack our products or otherwise exploit any vulnerabilities in our systems or those of our third party partners and vendors, or attempt to fraudulently induce our employees, consumers, third party partners and vendors or others to disclose passwords or other sensitive information or unwittingly provide access to our systems or data. Our increased use of AI products may create new attack methods for adversaries. These types of incidents continue to be prevalent and pervasive across industries, including in our industry, and such attacks on our systems have occurred in the past and are expected to occur in the future. In addition, we expect the amount and sophistication of the perpetrators of these attacks to continue to expand, which could include nation-state actors. Any such incident could lead to interruptions, delays or website outages, causing loss of critical data or the unauthorized disclosure or use of personally identifiable or other confidential information. In addition, sophisticated hardware and operating system software and applications that we produce or procure from third parties may contain defects in design or manufacture, including “bugs” and other problems that could unexpectedly interfere with the operation of the system. We have in the past and may in the future need to expend significant resources to protect against security breaches or to investigate and address problems caused by cyber or other security problems. There are no assurances that our programs and actions taken to protect against security breaches or to investigate and address problems related to cyber or other security problems will be sufficient to prevent or limit the impact of any cyber intrusion or related attack. Failure to adequately protect against attacks or intrusions, whether for our own systems or systems of vendors, could expose us to security breaches that could have an adverse impact on our financial performance. Our business policies and internal security controls may not keep pace as new threats and regulations emerge in jurisdictions worldwide.
Much of our business is conducted with third-party partners and vendors. A security breach at such third-party could be perceived by consumers as a security breach of our systems and could result in negative publicity or reputational damage, expose us to risk of loss or litigation and subject us to regulatory penalties and sanctions. In addition, such incidents may also result in a decline in our user base and client base or engagement levels.
Media coverage of data breaches and public exposure of consumer data rights has increased, in part because of the rise of enforcement actions, investigations and lawsuits. Similarly, the increase in privacy activist groups is likely to give rise to further scrutiny, investigative actions and publicity. Security breaches or the perceived threat of a breach or perceived breach could result in interruptions in service, negative publicity, damage to reputation, cause our users, suppliers and/or partners to cease doing business with us or do business with us less frequently, exposure to risk of loss and possible liability due to lawsuits, enforcement actions, investigations, regulatory penalties and sanctions. As this focus and attention on privacy and data protection increases, we also risk exposure to potential liabilities and costs resulting from the compliance with, or any failure to comply with, applicable legal requirements, conflicts among these legal requirements or differences in approaches to privacy and security. Security breaches could also cause travelers and consumers to lose confidence in our data security, which would have a negative effect on the value of our brand.
Evolving regulations, guidance and practices on the use of “pixels,” “cookies” and similar tracking technologies could negatively impact the way we do business. Pixels, cookies and similar technologies are common tools used by websites and apps, including ours, to store or gather information, improve site security, improve and personalize the customer experience, market to consumers and increase conversion. Companies such as Apple and Google continue to introduce new policies governing developers’ use of pixels, cookies and similar tracking technologies, including enhanced disclosure and opt in requirements. Similarly, many states and countries have adopted data protection laws and regulations governing the use of cookies and other similar tracking technologies by websites and app developers. Recent trends have included litigation by individual and class action plaintiffs focused on the use of such tracking technologies. Such regulations and litigation trends could limit our ability to serve certain customers in the manner we currently do, including with respect to retargeting or personalized advertising, impair our ability to improve and optimize performance on our platform, negatively affect a consumer's experience using our platform, which, in turn, could negatively impact our business.
Equally, privacy has been the impetus behind a move towards a cookie-less online ecosystem which poses a potential risk to our data practices and online advertising strategy.
We are subject to risks associated with processing payment transactions and failure to manage those risks may subject us to fines, penalties and/or additional costs and could have a negative impact on our business. We accept payments from consumers and our business partners using a variety of methods, including credit, debit and invoicing. As we offer new payments options to customers, we may be subject to additional regulations, compliance requirements and fraud. We rely on third parties to provide certain payment methods and payment processing services and our business could be disrupted if these companies become unwilling or unable to provide these services to us. We are subject to laws, regulations and compliance requirements relating to payments, international money transfers, privacy and information security and money laundering, including obligations to implement enhanced authentication processes. We are also subject to payment card association operating rules, including data security rules, certification requirements, and rules governing electronic funds transfers, which could change or be reinterpreted to make it difficult or impossible for us to comply. These laws, regulations and/or requirements result in significant costs. If we fail to comply or if our data security systems are breached or compromised, we may be liable for card issuing banks’ costs, subject to fines, penalties and higher transaction fees, and/or lose our ability to accept credit and debit card payments, process electronic funds transfers, or facilitate other types of online payments. In addition, for certain payment methods, including credit and debit cards, we pay interchange and other fees and we are subject to receivable holdbacks, which may increase over time and raise our operating costs and lower profitability.
Additionally, our marketplace activities in the U.K. and the European Union require us to obtain or operate under a payment institution license under the Payment Services Directive Two (“PSD2”). PSD2 requires a license to perform certain defined “payment services” in a European Economic Area (“EEA”) member state. Conditions for obtaining and complying with the license include minimum capital requirements, establishment of procedures for safeguarding funds, and certain governance and reporting requirements. Certain obligations relating to internal controls and the conduct of business, in particular, consumer disclosure requirements and certain rules regarding the timing and settlement of payments, must be met. We have obtained a payment institution license in the U.K. As a result of Brexit, we are no longer able to passport our U.K. license to the EEA. Although our EU application has been submitted during 2023 and currently under consideration by the EU, we may not receive the EU license on a timely basis if at all.
It is possible that we could become subject to regulatory enforcement or other proceedings in those states or other jurisdictions with money transmission, or other similar statutes or regulatory requirements, including an EEA member state, related to the handling or moving of money, which could in turn have a significant impact on our business, even if we were to ultimately prevail in such proceedings. If we are ultimately deemed to be in violation of one or more money transmitter or other similar statutes or regulatory requirements related to the handling or moving of money in the U.S., the EEA or other jurisdictions, we may be subject to the imposition of fines or restrictions on our business, our ability to offer some or all of our services in the relevant jurisdiction may be suspended, and we may be subject to civil or criminal liability and our business, results of operations and financial position could be materially adversely affected.
Risks Related to Financial Matters
We may fail to meet our publicly announced guidance or other expectations about our business and future operating results, which could cause our stock price to decline. From time to time, we release earnings guidance in our quarterly and annual earnings conference calls, quarterly and annual earnings releases, or otherwise, regarding our future performance that represents our management’s estimates as of the date of release. This guidance includes forward-looking statements based on projections prepared by our management. Projections are based upon a number of assumptions and estimates that are based on information known when they are issued, and, while presented with numerical specificity, are inherently subject to significant business, economic and competitive uncertainties and contingencies relating to our business, many of which are beyond our control and are based upon specific assumptions with respect to future business decisions, some of which will change. Guidance is necessarily speculative in nature, and some or all of the assumptions underlying the guidance furnished by us may not materialize or may vary significantly from actual outcomes. Accordingly, our guidance is only an estimate of what management believes is realizable as of the date of release. Actual results may vary from our guidance and the variations may be material. In light of the foregoing, investors are urged not to rely upon our guidance in making an investment decision regarding our common stock.
Our financial results are difficult to forecast; they have fluctuated in the past and will likely fluctuate in the future. Our financial results in any given quarter can be influenced by numerous factors, many of which we are unable to predict or are outside of our control, including:
•Our ability to maintain and grow our consumer base and to increase user engagement;
•Increases in marketing, sales and other expenses that we will incur to grow and expand our operations and to remain competitive;
•Fluctuations in the marketing spend of our travel partners due to seasonality, global or regional events or other factors;
•User behavior or product changes that may reduce traffic to features or products that we successfully monetize;
•System failure or outages, which would prevent us from serving ads for any period of time;
•Breaches of security or privacy and the costs associated with any such breaches and remediation;
•Fees paid to third parties for content or promotion of our products and services;
•Adverse litigation judgments, settlement or other litigation related costs;
•Changes in the legislative or regulatory environment or engagement by regulators;
•Changes in tax laws, which may significantly affect our tax rates and taxes due;
•Tax obligations that may arise from resolutions of tax examinations that may materially differ from the amounts we have anticipated;
•Fluctuations in currency exchange rates and changes in the proportion of our revenue and expenses denominated in foreign currencies;
•Changes in global business and macroeconomic conditions.
As a result, you should not rely upon our quarterly financial results as indicators of future performance.
If we are unable to successfully maintain effective internal control over financial reporting, investors may lose confidence in our reported financial information and our business and our share price may be adversely impacted. As a public company, we are required to maintain internal control over financial reporting and our management is required to evaluate the effectiveness of our internal control over financial reporting as of the end of each fiscal year. If we are not successful in maintaining effective internal control over financial reporting, there could be inaccuracies or omissions in the financial information we file with the SEC. Additionally, even if there are no inaccuracies or omissions, we could be required to publicly disclose our management’s conclusion that our internal control over financial reporting or disclosure controls and procedures are not effective. These events could cause investors to lose confidence in our reported financial information, result in increased costs to remediate any deficiencies, attract regulatory scrutiny or lawsuits that could be costly to resolve and distract management’s attention, limit our ability to access the capital markets, adversely impact our stock price, or cause our stock to be delisted from The Nasdaq or any other securities exchange on which we are then listed.
We have indebtedness which could adversely affect our business and financial condition. With respect to the 2026 Senior Notes and Term Loan B Facility, we are subject to risks relating to our existing or potential indebtedness that include:
•Requirement to dedicate a portion of our cash flow to principal and interest payments, thereby reducing the availability of cash to fund working capital, capital expenditures, acquisitions and investments and other general corporate purposes;
•Difficulties to optimally capitalize and manage the cash flow for our businesses;
•Possible competitive disadvantage compared to our competitors that have less debt;
•Limitations on our ability to borrow additional funds on acceptable terms or at all; and
•Exposure to increased interest rates to the extent our outstanding debt is subject to variable rates of interest.
Failure to comply with the various covenants contained in our Credit Agreement could have a material adverse effect on our business. The various covenants contained in the Credit Agreement include those that limit our ability to, among other things:
•Make certain investments, acquisitions, dispositions, distributions and other payments;
•Pay dividends on, redeem or repurchase our capital stock;
•Effect share repurchases;
•Enter into secured financing arrangements;
•Enter into sale and leaseback transactions; and
•Enter into unrelated businesses.
These covenants may limit our ability to optimally operate our business. The Credit Facility contains customary events of default and modifies the cross-default provision so that the Term Loan B Facility includes a customary cross-acceleration event of default with the Credit Facility. If an event of default occurs and is continuing, then, among other things, the lenders under the Credit Facility and/or the Term Loan B Facility, as applicable, may declare any outstanding Credit Facility and/or Term Loan B Facility obligations, as applicable, to be immediately due and payable and exercise their rights and remedies against the collateral.
We are subject to risks relating to our 2026 Senior Notes. If any of the conditions to the conversion of the 2026 Senior Notes is satisfied, then we may be required under applicable accounting standards to reclassify the liability carrying value of the 2026 Senior Notes as a current, rather than a long-term, liability, thereby materially reducing our reported working capital. This reclassification could be required even if no noteholders exchange their 2026 Senior Notes. Holders of our 2026 Senior Notes may convert the 2026 Senior Notes after the occurrence of certain dates or events. Settlement of the 2026 Senior Notes could adversely affect our liquidity. In addition, any failure to comply with the restrictions of our Credit Facility, Term Loan B Facility, or our 2026 Senior Notes may result in an event of default under the agreements governing such debt instruments and such default may allow the creditors to accelerate the debt incurred thereunder.
We are subject to risks relating to the Capped Calls. In connection with the issuance of the 2026 Senior Notes, we entered into privately negotiated capped call transactions (the “Capped Calls”) to reduce potential dilution to our common stock and/or offset cash payments we must make in excess of the principal amount, in each case, upon any conversion of the 2026 Senior Notes, with such offset subject to a cap. We are subject to the risk that one or more of the hedge counterparties may default under the Capped Calls. If any of the hedge counterparties become subject to insolvency proceedings, we will become an unsecured creditor with a claim equal to our exposure at that time under our transactions with such counterparties. Our exposure will depend on many factors but, generally, the increase in our exposure will be correlated to the increase in the market price and in the volatility of our common stock. In addition, upon a default by a hedge counterparty, we may suffer adverse tax consequences and more dilution than we currently anticipate with respect to our common stock.
We may have future capital needs and may not be able to obtain additional financing on acceptable terms. Pursuant to the Credit Facility, we agreed to pledge substantially all of our assets, including the equity interests of our subsidiaries. This agreement also includes restrictive covenants that may limit our ability to secure additional financing in the future on favorable terms, if at all. Our ability to secure additional financing will also depend upon
our future operating performance, which is subject to then prevailing general economic and credit market conditions, and financial, business and other factors, many of which are beyond our control.
Risks Relating to Pending Merger
In December 2024, we announced a plan to acquire and cancel all of the controlling shares that LTRIP currently holds in us. The consummation of the Merger, or failure to do so, could have material impacts on our stock price and financial performance. The proposed transactions contemplated by the Merger Agreement, which will ultimately result in eliminating LTRIP’s controlling interest, may not be completed, and if completed, may not achieve its anticipated benefits. The transaction is subject to various closing conditions, including LTRIP stockholder approval, regulatory clearances, and other customary conditions. There can be no assurance that the conditions to closing will be satisfied or that the transactions contemplated by the Merger Agreement will be completed on the contemplated terms or timeline, or at all. If the transaction is not completed, we would remain a controlled company with the associated governance implications, and we would remain obligated under our commitments to make available the Parent Loan Facility if needed by LTRIP. Failure to complete the Merger within the timeframe anticipated could adversely affect our business and the market price of our stock in a number of ways, including: a decline in the price of our stock, negative publicity, not realizing the benefits of the Merger related to the substantial time and resources the management team made and the payment of expenses for professional services in connection with the Merger. Our efforts to complete the Merger could cause substantial disruptions in, and create uncertainty surrounding, our business, which may materially adversely affect our business, financial condition or results of operations, or the price of our stock. For example, employee retention may be challenging, management and employees’ attention may be diverted from our regular operations and uncertainty could adversely affect our business and relationship with our business partners.
Following the closing of the Merger, we will no longer be a “controlled company” within the meaning of the Nasdaq Stock Market rules and will be subject to additional Nasdaq rules and requirements to which we are currently not subject. Subject to consummation of the Merger, LTRIP will no longer have a controlling interest in Tripadvisor and Tripadvisor will cease to be a “controlled company” within the meaning of the Nasdaq rules. The Nasdaq rules require that, subject to limited exceptions, within 90 days of the date we no longer qualified as a “controlled company,” we have a compensation committee consisting of a majority of independent directors and a director nominations process whereby directors are selected by a nominations committee consisting of a majority of independent directors or by a vote of the board of directors in which only independent directors participate, and that, within one year of the date we no longer qualify as a “controlled company,” we have a majority of independent directors on our board of directors as well as a compensation committee consisting solely of independent directors, and a director nominations process whereby directors are selected by a nominations committee consisting solely of independent directors or by a vote of the board of directors in which only independent directors participate. During these transition periods, we may continue to utilize the available exemptions from certain corporate governance requirements as permitted by the Nasdaq rules, and our compensation committee may not consist solely of independent directors. Accordingly, you may not have the same protections afforded to stockholders of companies that are subject to all of the Nasdaq rules during the transition period. In addition, even after the transition period, we may elect to rely on the Exceptional and Limited Circumstances exception under Nasdaq rules to permit one non-independent director to serve on our committees that would otherwise be required to solely have independent directors. In the event we do not have committees composed solely of independent directors in accordance with the Nasdaq rules due to the transition period from loss of controlled company status or the Exceptional and Limited Circumstances exception provided under the Nasdaq rules, our common stock may be less attractive to some investors or our trading price may be adversely affected.
We may provide a significant loan facility in connection with the Merger. Pursuant to the Merger Agreement, under certain circumstances, the Company will provide a loan facility (the “TRIP Loan Facility”) to LTRIP of approximately $330 million, to repay the Debentures prior to Closing, which facility, among other things: (i) will be a term loan, (ii) will have an interest rate equal to (A) the secured overnight financing rate as administrated by the Federal Reserve Bank of New York plus (B) 6.00%, which shall be repayable in kind (in lieu of payment in cash) on a quarterly basis (or such other time period as jointly agreed to by LTRIP and the Company), (iii) will mature on the earlier of (A) the Termination Date under the Merger Agreement and (B) 15 business days after the valid termination of the Merger Agreement (for reasons other than the Termination Date having been reached), or such later date as jointly agreed to by LTRIP and the Company, (iv) will not be prepayable without the prior written consent of TRIP and must be repaid at maturity in cash, (v) subject to customary exceptions and
exclusions, will be secured by substantially all of the assets of LTRIP and its subsidiaries, and (vi) shall contain customary rights and remedies of TRIP in connection with customary events of default to be agreed between LTRIP and TRIP.
We and LTRIP are and may continue to be targets of securities class action, derivative, and other stockholder lawsuits that could result in substantial costs and may delay or prevent the Merger from being completed. We and LTRIP are and may continue to be targets of securities class action, derivative, and other stockholder lawsuits as a result of our agreement to enter into the Merger transaction. For example, on January 28, 2025, a purported stockholder of the Company filed a complaint in the Court of Chancery of the State of Delaware seeking books and records of the Company relating to the Merger and, on January 30, 2025, a purported stockholder of LTRIP filed a complaint in the United States District Court for the Northern District of Illinois alleging claims under the federal securities laws relating to the preliminary proxy statement issued by LTRIP concerning the Merger. Securities class action, derivative, and other stockholder lawsuits are often brought against public companies that have entered into merger agreements. The outcome of litigation is uncertain and we may not be successful in defending against any present or future claims brought against us even if they are without merit. Regardless of the outcome of any lawsuits brought against us, such lawsuits could delay or prevent the Merger, divert the attention of our management and employees from our day-to-day business, result in substantial costs and otherwise adversely affect us financially. A potential adverse judgment could result in monetary damages, which could have a negative impact on our liquidity and financial condition. Additionally, if a plaintiff is successful in obtaining an injunction prohibiting completion of the Merger, that injunction may delay or prevent the Merger from being completed, or from being completed within the anticipated timeframe, which may adversely affect our business, financial condition or results of operations.
Risks Related to Tax Matters
Our effective income tax rate is impacted by a number of factors that could have a material impact on our financial results and could increase the volatility of those results. Due to the global nature of our business, we are subject to income taxes in the U.S. and other foreign jurisdictions. In the event we incur taxable income in certain jurisdictions but incur losses in other jurisdictions, we generally cannot offset the income from one jurisdiction with the loss from another. This lack of flexibility could affect our effective income tax rate. Furthermore, significant judgment is required to calculate our worldwide provision for income taxes and depends on our ability to operate our business in a manner consistent with our corporate structure and intercompany arrangements. In the ordinary course of our business, there are many transactions and calculations where the ultimate tax determination is uncertain. Our future income tax rates could be affected by a number of matters outside of our control, including but not limited to changes in the mix of earnings in countries with differing statutory tax rates, changes in the valuation of deferred tax assets or accounting for share-based compensation. If our effective income tax rates were to increase, our financial results and cash flows would be adversely affected.
Application of U.S. state and local or international tax laws, changes in tax laws or tax rulings, or the examination of our tax positions, could materially affect our financial position and results of operations. As an international business, we are subject to income taxes and non-income-based taxes in the U.S. and various other international jurisdictions. Tax laws are subject to change as new laws are passed and new interpretations of the laws are issued or applied. Due to economic and political conditions, tax rates and tax regimes may be subject to significant change and the tax benefits that we intend to eventually derive could be undermined due to changing tax laws. Governments are increasingly focused on ways to increase tax revenues, which has contributed to more aggressive positions taken by tax authorities and an increase in tax legislation. Any such additional taxes or other assessments may be in excess of our current tax provisions or may require us to modify our business practices in order to reduce our exposure to additional taxes going forward, any of which could have a material adverse effect on our business, results of operations and financial condition. Any changes to international tax laws or any additional reporting requirements may increase the complexity and costs associated with tax compliance and adversely affect our cash flows and results of operations.
Over recent years, the Organization for Economic Cooperation and Development (“OECD”) through its “Inclusive Framework” has been working on a “two-pillar” global tax consensus project that, if implemented, would result in certain changes to the current global tax regulatory framework. The OECD’s “Pillar One” initiative proposes to reallocate certain profits from the largest and most profitable multinational businesses to countries where the customers of those businesses are located, and the “Pillar Two” initiative proposes a global minimum income tax rate on corporations of 15%. In response to these proposals, certain jurisdictions have enacted legislation
to implement a global minimum income tax of 15%, which currently has no impact on our financial results, as well as legislation to impose new forms of gross receipts taxes, such as digital services taxes imposed on digital advertising and online marketplace platforms/services. If consensus is reached on Pillar One, unilateral digital services taxes should be repealed, however until such time we continue to be subject to these taxes. We are currently subject to unilateral digital services taxes, and during the years ended December 31, 2024, 2023 and 2022, we recorded $18 million, $18 million and $9 million, respectively, of digital service taxes to cost of sales on our consolidated statements of operations. While the future of the global tax regulatory landscape remains uncertain, we continue to monitor the OECD’s and members ongoing discussions to determine the current and potential impact on our consolidated financial statements.
We are routinely under audit by federal, state and foreign taxing authorities. The ultimate outcome of these examinations (including the Internal Revenue Service (“IRS”) audit described below) cannot be predicted with certainty but could be materially different from our income tax provisions and accruals and could have a material effect on our results of operations or cash flows in the period or periods for which that determination is made. Should the IRS or other taxing authorities assess additional taxes as a result of examinations, we may be required to record charges to our results of operations, which could harm our operating results and financial condition.
Changes in the tax treatment of companies engaged in e-commerce may adversely affect the commercial use of our platform and our financial results. Tax authorities at the international, federal, state and local levels are currently reviewing the appropriate treatment of companies engaged in e-commerce and it is possible that various jurisdictions may attempt to levy additional or new sales, income or other taxes relating to our activities. For example, Congress is considering various approaches to legislation that would require companies engaged in e-commerce to collect sales tax on internet revenue and a growing number of U.S. states and certain foreign jurisdictions have adopted or are considering proposals to impose obligations on remote sellers and online marketplaces to collect taxes on their behalf. An increasing number of states have considered or adopted laws that attempt to impose tax collection obligations on out-of-state companies. Additionally, the U.S. Supreme Court ruled in South Dakota v. Wayfair Inc. that remote sellers are not required to collect state and local sales taxes. In response to Wayfair or otherwise, state or local governments have adopted and may continue to adopt, or begin to enforce, laws requiring us to calculate, collect and remit taxes on sales in their jurisdictions. Also, as described in more detail above, certain U.S. states and countries in which we do business have enacted or proposed digital services tax initiatives. In addition, we are subject to taxes in foreign jurisdictions, such as value-added tax and goods and services tax, in connection with certain foreign sales transactions. New or revised international, federal, state or local tax regulations or court decisions may subject us or our customers to additional sales, occupancy, income and other taxes. We cannot predict the effect of these and other attempts to impose sales, income or other taxes on e-commerce; however, new or revised taxes and, in particular, sales taxes, occupancy taxes, value added taxes (“VAT”), and similar taxes would likely increase the cost of doing business online and decrease the attractiveness of selling products and services over the internet. New taxes could also create significant increases in internal costs necessary to capture data and collect and remit taxes. A successful assertion by one or more tax authorities requiring us to collect taxes where we presently do not do so, or to collect more taxes in a jurisdiction in which we currently do collect some taxes, could result in substantial tax liabilities, including taxes on past sales, as well as penalties and interest that we otherwise would have not accounted for in our financial statements. Any of these events could have a material adverse effect on our business, financial results and financial condition.
Taxing authorities have in the past and may successfully in the future assert that we should have collected or in the future should collect sales and use, occupancy, VAT or similar taxes, and we could be subject to liability with respect to past or future sales, which could adversely affect our operating results. We do not collect and remit sales and use, occupancy, VAT or similar taxes in all jurisdictions in which we have sales, based on our belief that such taxes are not applicable or legally required. Several states and other taxing jurisdictions have presented or threatened us with assessments, alleging that we are required to collect and remit certain taxes there. While we do not believe that we are subject to such taxes and intend to vigorously defend our position in these cases, we cannot be sure of the outcome of our discussions and/or appeals with these states. In the event of an adverse outcome, we could face assessments, plus any additional interest and penalties. We also expect additional jurisdictions may make similar assessments or pass similar new laws in the future, and any of the jurisdictions where we have sales may apply more rigorous enforcement efforts or take more aggressive positions in the future that could result in greater tax liability allegations. Such tax assessments, penalties and interest or future requirements may materially adversely affect our business, financial condition and operating results.
We face risks associated with fluctuations in foreign currency exchange rates. As a result, we face exposure to movements in foreign currency exchange rates including, but not limited to, re-measurement of gains and losses from changes in the value of foreign denominated assets and liabilities; translation gains and losses on foreign subsidiary financial results that are translated into U.S. dollars upon consolidation; and planning risk related to changes in exchange rates between the time we prepare our annual and quarterly forecasts and when actual results occur. For example, in the event that one or more European countries were to replace the Euro with another currency, our sales into such countries, or into Europe generally, would likely be adversely affected until stable exchange rates are established. Accordingly, fluctuations in foreign currency exchange rates, such as the strengthening of the U.S. dollar against the Euro or the British pound, have in the past and could in the future adversely affect our revenue growth in future periods.
In the event of severe volatility in exchange rates, the impact of these exposures can increase and the impact on results of operations can be more pronounced. In addition, the current environment and the increasingly global nature of our business have made hedging these exposures more complex. We hedge certain short-term foreign currency exposures with the purchase of forward exchange contracts. These forward exchange contracts only help mitigate the impact of changes in foreign currency rates that occur during the term of the related contract period and carry risks of counter-party failure. There can be no assurance that our forward exchange contracts will have their intended effects.
Risks Related to Ownership of our Common Stock
Liberty TripAdvisor Holdings, Inc. currently is a controlling stockholder. Liberty TripAdvisor Holdings, Inc., or LTRIP, effectively controls the outcome of all matters submitted to a vote or for the consent of our stockholders (other than with respect to the election by the holders of our common stock of 25% of the members of our Board of Directors and matters as to which Delaware law requires separate class votes). Our Chairman, Gregory Maffei, and Director Albert Rosenthaler, also serve as officers and directors of LTRIP. LTRIP may have interests that differ from those of our other stockholders and may vote in a way with which our other stockholders may not agree or that may be adverse to other stockholders’ interests. LTRIP is not restricted from investing in other businesses related to our business. LTRIP’s control of us, as well as the provisions of our organizational documents and Delaware law, may discourage or prevent a change of control that might otherwise be beneficial, which may reduce the market price of our common stock.
The market price and trading volume of our common stock has experienced, and could continue to experience in the future, substantial volatility. The market price of our common stock is affected by a number of factors, including:
•Quarterly variations in our or our competitors’ results of operations;
•Changes in earnings estimates or recommendations by securities analysts;
•Failure to meet market expectations;
•The announcement of new products or product enhancements by us or our competitors;
•Repurchases of our common stock;
•Developments in our industry, including changes in governmental regulations; and
•General market conditions and other factors, such as macroeconomic conditions and geopolitical events.
In the past, the stock market has experienced price and volume fluctuations that have affected and continue to affect the market prices of equity securities of many companies. These fluctuations often have been unrelated or disproportionate to the operating performance of those companies. These broad market and industry fluctuations and general economic, political and market conditions, such as recessions, interest rate changes or foreign currency exchange fluctuations, may negatively impact the market price of our common stock regardless of our actual operating performance.
We are currently relying on the “controlled company” exemption under Nasdaq Stock Market Listing Rules, pursuant to which “controlled companies” are exempt from certain corporate governance requirements otherwise applicable under Nasdaq listing rules. The Nasdaq Stock Market Listing Rules exempt “controlled companies,” or companies of which more than 50% of the voting power is held by an individual, a group or another company, from certain corporate governance requirements. We currently rely on the controlled company exemption for certain of the above requirements, including the requirement that director nominees be selected or recommended to the Board of Directors by a majority of its independent directors or by a nominating committee that is composed
entirely of independent directors. Accordingly, our stockholders will not be afforded the same protections generally as stockholders of other Nasdaq-listed companies with respect to corporate governance for so long as we rely on these exemptions from the corporate governance requirements.
We do not pay regular quarterly or annual cash dividends on our stock. Any determination to pay dividends is at the discretion of our Board of Directors and will depend on our results of operations, earnings, capital requirements, financial condition, future prospects, contractual restrictions and other factors deemed relevant by our Board of Directors. Therefore, investors should not rely on regular quarterly or annual dividend income from shares of our common stock and investors should not rely on special dividends with any regularity or at all.
Future sales of shares of our common stock in the public market, or the perception that such sales may occur, may depress our stock price. Sales of substantial amounts of our common stock in the public market, particularly sales by our directors, officers, employees and significant stockholders, or the perception that these sales might occur, could depress the market price of our common stock and could impact our ability to raise capital through the sale of additional securities. In addition, certain stockholders have rights, subject to some conditions, to require us to file registration statements covering their shares or to include their shares in registration statements that we may file for ourselves or other stockholders. A decline in the price of shares of our common stock might impede our ability to raise capital through the issuance of additional shares of our common stock or other equity securities.
Anti-takeover provisions in our organizational documents and Delaware law may discourage or prevent a change of control, even if an acquisition would be beneficial to our stockholders, which could affect our stock price adversely and prevent attempts by our stockholders to replace or remove our current management.
These provisions include:
•Authorization and issuance of Class B common stock that entitles holders to ten votes per share;
•Authorization of the issuance of preferred stock which can be created and issued by the Board of Directors without prior stockholder approval, with rights senior to those of our common stock;
•Prohibition of our stockholders to fill board vacancies or call special stockholder meetings; and
•Limitations on who may call special meetings of stockholders.
These and other provisions in our certificate of incorporation, bylaws and Delaware law, including differences in law if we effect the Redomestication to become organized under the laws of the State of Nevada, could make it more difficult for stockholders or potential acquirers to obtain control of our Board of Directors or initiate actions that are opposed by our then-current Board of Directors, including a merger, tender offer or proxy contest involving our company. In addition, in connection with the closing of the Merger, the anti-takeover provisions included in our organizational documents may be removed or changed or additional anti-takeover provisions may be added which could further delay or prevent a change of control transaction or changes in our Board of Directors. Any delay or prevention of a change of control transaction or changes in our Board of Directors could cause the market price of our common stock to decline.
We cannot guarantee that we will repurchase our common stock pursuant to our share repurchase programs or that our share repurchase programs will enhance long-term stockholder value. On September 7, 2023, our Board of Directors authorized the repurchase of $250 million in shares of our common stock under a new share repurchase program. The share repurchase program has a term of two years and does not obligate the Company to acquire any particular number of shares and may be modified, suspended or discontinued at any time. The Executive Committee of our Board of Directors will determine the price, timing, amount and method of such repurchases based on its evaluation of market conditions and other factors, and at prices determined to be attractive and in the best interests of both the Company and its stockholders.
Although our Board of Directors has authorized the share repurchase programs, the share repurchase programs do not obligate the Company to repurchase any specific dollar amount or to acquire any specific number of shares. The timing and amount of repurchases, if any, will depend upon several factors, including market and business conditions, the trading price of the Company’s common stock and the nature of other investment opportunities. In August 2022, Congress passed the Inflation Reduction Act, which imposes a one percent tax on stock repurchases, subject to certain adjustments, after December 31, 2022 by publicly traded U.S. companies, including us, which may also impact our decision to engage in share repurchases. The repurchase programs may be limited, suspended or discontinued at any time without prior notice. In addition, repurchases of our common stock pursuant to our share repurchase programs could affect our stock price and increase its volatility. The existence of a share repurchase
program could cause our stock price to be higher than it would be in the absence of such a program. Additionally, our share repurchase programs could diminish our cash reserves, which may impact our ability to finance future growth, and to pursue possible future strategic opportunities and acquisitions. There can be no assurance that any share repurchases will enhance stockholder value because the market price of our common stock may decline below the levels at which we repurchased shares of stock. Although our share repurchase programs are intended to enhance long-term stockholder value, there is no assurance that they will do so and short-term stock price fluctuations could reduce the program’s effectiveness.
None.
Item 1C. Cybersecurity
In an era marked by rapid technological evolution, the business landscape is increasingly data-driven. Companies, including ours, collect, store, and leverage data to glean valuable insights about our members and travel trends; deliver relevant content to our members, suppliers, and business partners and enhance operational efficiency. This collection and leverage of data exposes us to potential cybersecurity threats. Our cybersecurity program is guided by industry standards developed by the National Institute of Standards and Technology (“NIST”). As a result, we have implemented a cybersecurity risk management framework that is designed to identify, assess, and mitigate risks from cybersecurity threats to our electronic information systems that could adversely affect the confidentiality, integrity, or availability of our information systems or the data residing on those systems. While no organization can eliminate cybersecurity risk entirely, we believe our cybersecurity program is reasonably designed to mitigate our cybersecurity and information technology risks.
Risk Management Oversight and Governance
The Board of Directors is responsible for overseeing management’s processes for managing cybersecurity risks and has delegated this function to the Audit Committee. The Audit Committee regularly reviews and discusses with management the processes to identify, assess and manage cybersecurity threats, as well as to identify, assess and, to the extent required, disclose whether risks from cybersecurity threats have materially affected the Company or if material cybersecurity incidents have occurred.
Management is responsible for the day-to-day risk management process, including the identification of risks and implementation of policies and procedures designed to manage, mitigate or monitor cyber risks. In support of these responsibilities, management has formed a Compliance Committee and designated a Chief Compliance Officer to implement, manage and oversee a corporate compliance program.
The Compliance Committee is responsible for understanding the global risk landscape of the Company and for working to ensure that we have a compliance program in place designed to mitigate, manage and/or monitor risks. The Compliance Committee consists of, among others, our Chief Financial Officer (“CFO”), Chief Legal Officer (“CLO”) and Chief Compliance Officer (“CCO”). The CCO has established an Information Governance and Privacy Committee responsible for oversight of privacy and cybersecurity risks. The Information Governance and Privacy Committee consists of senior members of the Company’s Information Security Team and CCO, as well as representatives from engineering, product development and data privacy. The Information Governance and Privacy Committee meets regularly to discuss and monitor information uses and governance and risks associated with our information assets, including prevention, detection, mitigation and remediation of risks from cybersecurity threats.
Our Information Security Team reports to our CCO. The CCO reports to the Compliance Committee, which includes the CFO and CLO. The CFO and CLO report directly to the Company’s Chief Executive Officer. Each of the CFO, CLO and CCO report regularly to our Board of Directors on, among other matters, our global risk landscape and risk management efforts, including those related to cybersecurity risks.
Our CCO, supported by our Information Security Team, has primary responsibility for managing our cybersecurity threat management program. We maintain rigorous standards for our information security leadership positions, including requiring extensive experience in building and leading cybersecurity security teams and
implementing enterprise-wide cybersecurity programs. Our CCO and Information Security Team continue to execute on our established cybersecurity strategy and risk management framework.
The CCO, with input from the Information Security Team, meets regularly with and provides updates on cybersecurity developments to, members of the executive management team.
Our Information Security Team meets at least annually with each of the Compliance Committee and the Audit Committee to discuss cybersecurity threats and the risk management programs. The Information Security Team provides information, as appropriate, about the sources and nature of risks the Company faces and how management assesses such risks. Our CCO also provides a quarterly report to the Audit Committee on trends and observations concerning cyber threats and actions being taken to mitigate those risks. The Chair of the Audit Committee reports quarterly to the full Board of Directors and that report includes a summary of the CCO’s report.
Processes for the Identification of Risks from Cybersecurity Threats
The Compliance Committee, working with the Information Security Team, has developed a cybersecurity risk management program that aims to address the following key areas:
•Identification of assets at risk from cybersecurity threats;
•Identification of potential sources of cybersecurity threats;
•Assessment of the status of protections in place to prevent or mitigate cybersecurity threats;
•Approaches to mitigating and managing cybersecurity risks; and
•A process for regular reporting to the Compliance Committee and Board of Directors (directly and through the Audit Committee).
The Company’s risk assessment and mitigation program is centered on the following components:
•Identification of significant risks (primarily through enterprise risk assessments);
•An evaluation of the likelihood of such risk occurring, the potential impact and the control strength, consideration for compensating controls to mitigate the risk;
•Prioritization of different risk items based on, among other things, the results of our evaluation; and
•Establishment of a process for addressing those risks.
Our Internal Audit team reviews, monitors and audits various aspects of the Company’s enterprise risk management program to evaluate whether risks, including cybersecurity risks, are appropriately identified and managed. Internal Audit periodically reports to the Audit Committee on the Company’s cybersecurity risk mitigation efforts. The Audit Committee Chair, in turn, reports to the full Board of Directors.
Our Incident Response Plan (“IRP”) is designed to facilitate rapid incident response to any security incident affecting the Company’s business lines, locations, services, and divisions. The IRP defines the roles and responsibilities for the senior leadership team and cybersecurity experts to identify and respond to cybersecurity events and incidents while complying with legal obligations. The Incident Response Team (“IRT”) is designated by the IRP to assess each cybersecurity incident and event for impacts to the Company, customers, and third-party partners and oversee the response to and remediation of such incident.
We have several employee training and development programs that are designed to, among others, raise awareness of cybersecurity risks impacting the business to encourage consideration and facilitate managing those risks. To assess the effectiveness of our program, we periodically conduct penetration testing and other vulnerability analyses. As part of the assessment of the protections we have in place to mitigate risks, we engage third parties to conduct risk assessments on our systems.
We rely on certain third-party computer systems and third-party service providers in connection with providing some of our services. These third-party business partners, service providers, and consultants need to access our customer and other data, and connect to our computer networks. We define expected security and privacy requirements through our contracting processes with those third parties and we perform cyber risk assessments at the time of procurement to review the cyber risk management efforts of those third parties. These vendors are
contractually obligated to notify us when they experience a cybersecurity incident that can affect our operations or stakeholders.
Before purchasing third-party technology or other solutions and partnerships that involve exposure to the Company’s assets and electronic information, our Information Security and Privacy team undertakes due diligence to assess any key data privacy or information security risks.
To date, we have not identified any cybersecurity incidents or threats that have materially affected us or are reasonably likely to materially affect us, including our business strategy, results of operations, or financial condition; however, like other companies in our industry, we have, from time to time, experienced threats and cybersecurity incidents relating to our information technology systems and infrastructure. Our third-party vendors may also experience threats and cybersecurity incidents from time to time.
For additional information about the cybersecurity risks, see “Risk Factors” under the section entitled “Risks Related to Information Security, Cybersecurity and Data Privacy” in Part I, Item 1A of this Annual Report on Form 10-K.
Item 2. Properties
As of December 31, 2024, we do not own any real estate. We lease approximately 280,000 square feet of office space for our corporate headquarters in Needham, Massachusetts, which has an expiration date of December 2030 and an option to extend the lease term for two consecutive terms of five years each. We also lease an aggregate of approximately 165,000 square feet of office space at nearly 25 locations across North America, Europe and Asia Pacific, in cities such as New York, London, Singapore, Barcelona and Paris, primarily used as sales offices, subsidiary headquarters, and for international operations, pursuant to leases with various expiration dates, with the latest expiring in March 2034. We believe that our current facilities are adequate for our current operations and that additional leased space can be obtained on reasonable terms if needed.
Item 3. Legal Proceedings
Refer to “Note 11: Commitments and Contingencies” in the notes to the consolidated financial statements in Part II, Item 8 of this Annual Report on Form 10-K, for further information regarding any legal proceedings. For an additional discussion of certain risks associated with legal proceedings, see “Risk Factors” in Part I, Item 1A of this Annual Report on Form 10-K.
Item 4. Mine Safety Disclosures
Not applicable.
PART II
Item 5. Market for Registrant’s Common Equity, Related Stockholder Matters and Issuer Purchases of Equity Securities
Market Information
Our common stock is quoted on The Nasdaq Global Select Market under the ticker symbol “TRIP.” Our Class B common stock is not listed and there is no established public trading market for that security. As of February 11, 2025, all of our Class B common stock was held by LTRIP.
Performance Comparison Graph
The following graph provides a comparison of the total stockholder return from December 31, 2019 to December 31, 2024, of an investment of $100 in cash on December 31, 2019 for Tripadvisor, Inc. common stock and an investment of $100 in cash on December 31, 2019 for (i) the Standard and Poor’s 500 Index (the “S&P 500 Index”), (ii) The Nasdaq Composite Index; and (iii) the Research Data Group (“RDG”) Internet Composite Index. The RDG Internet Composite Index is an index of stocks representing the internet industry, including internet software and service companies, and e-commerce companies. The stock price performance shown on the graph below is not necessarily indicative of future price performance. Data for the S&P 500 Index, The Nasdaq Composite Index, and the RDG Internet Composite Index assume reinvestment of dividends.
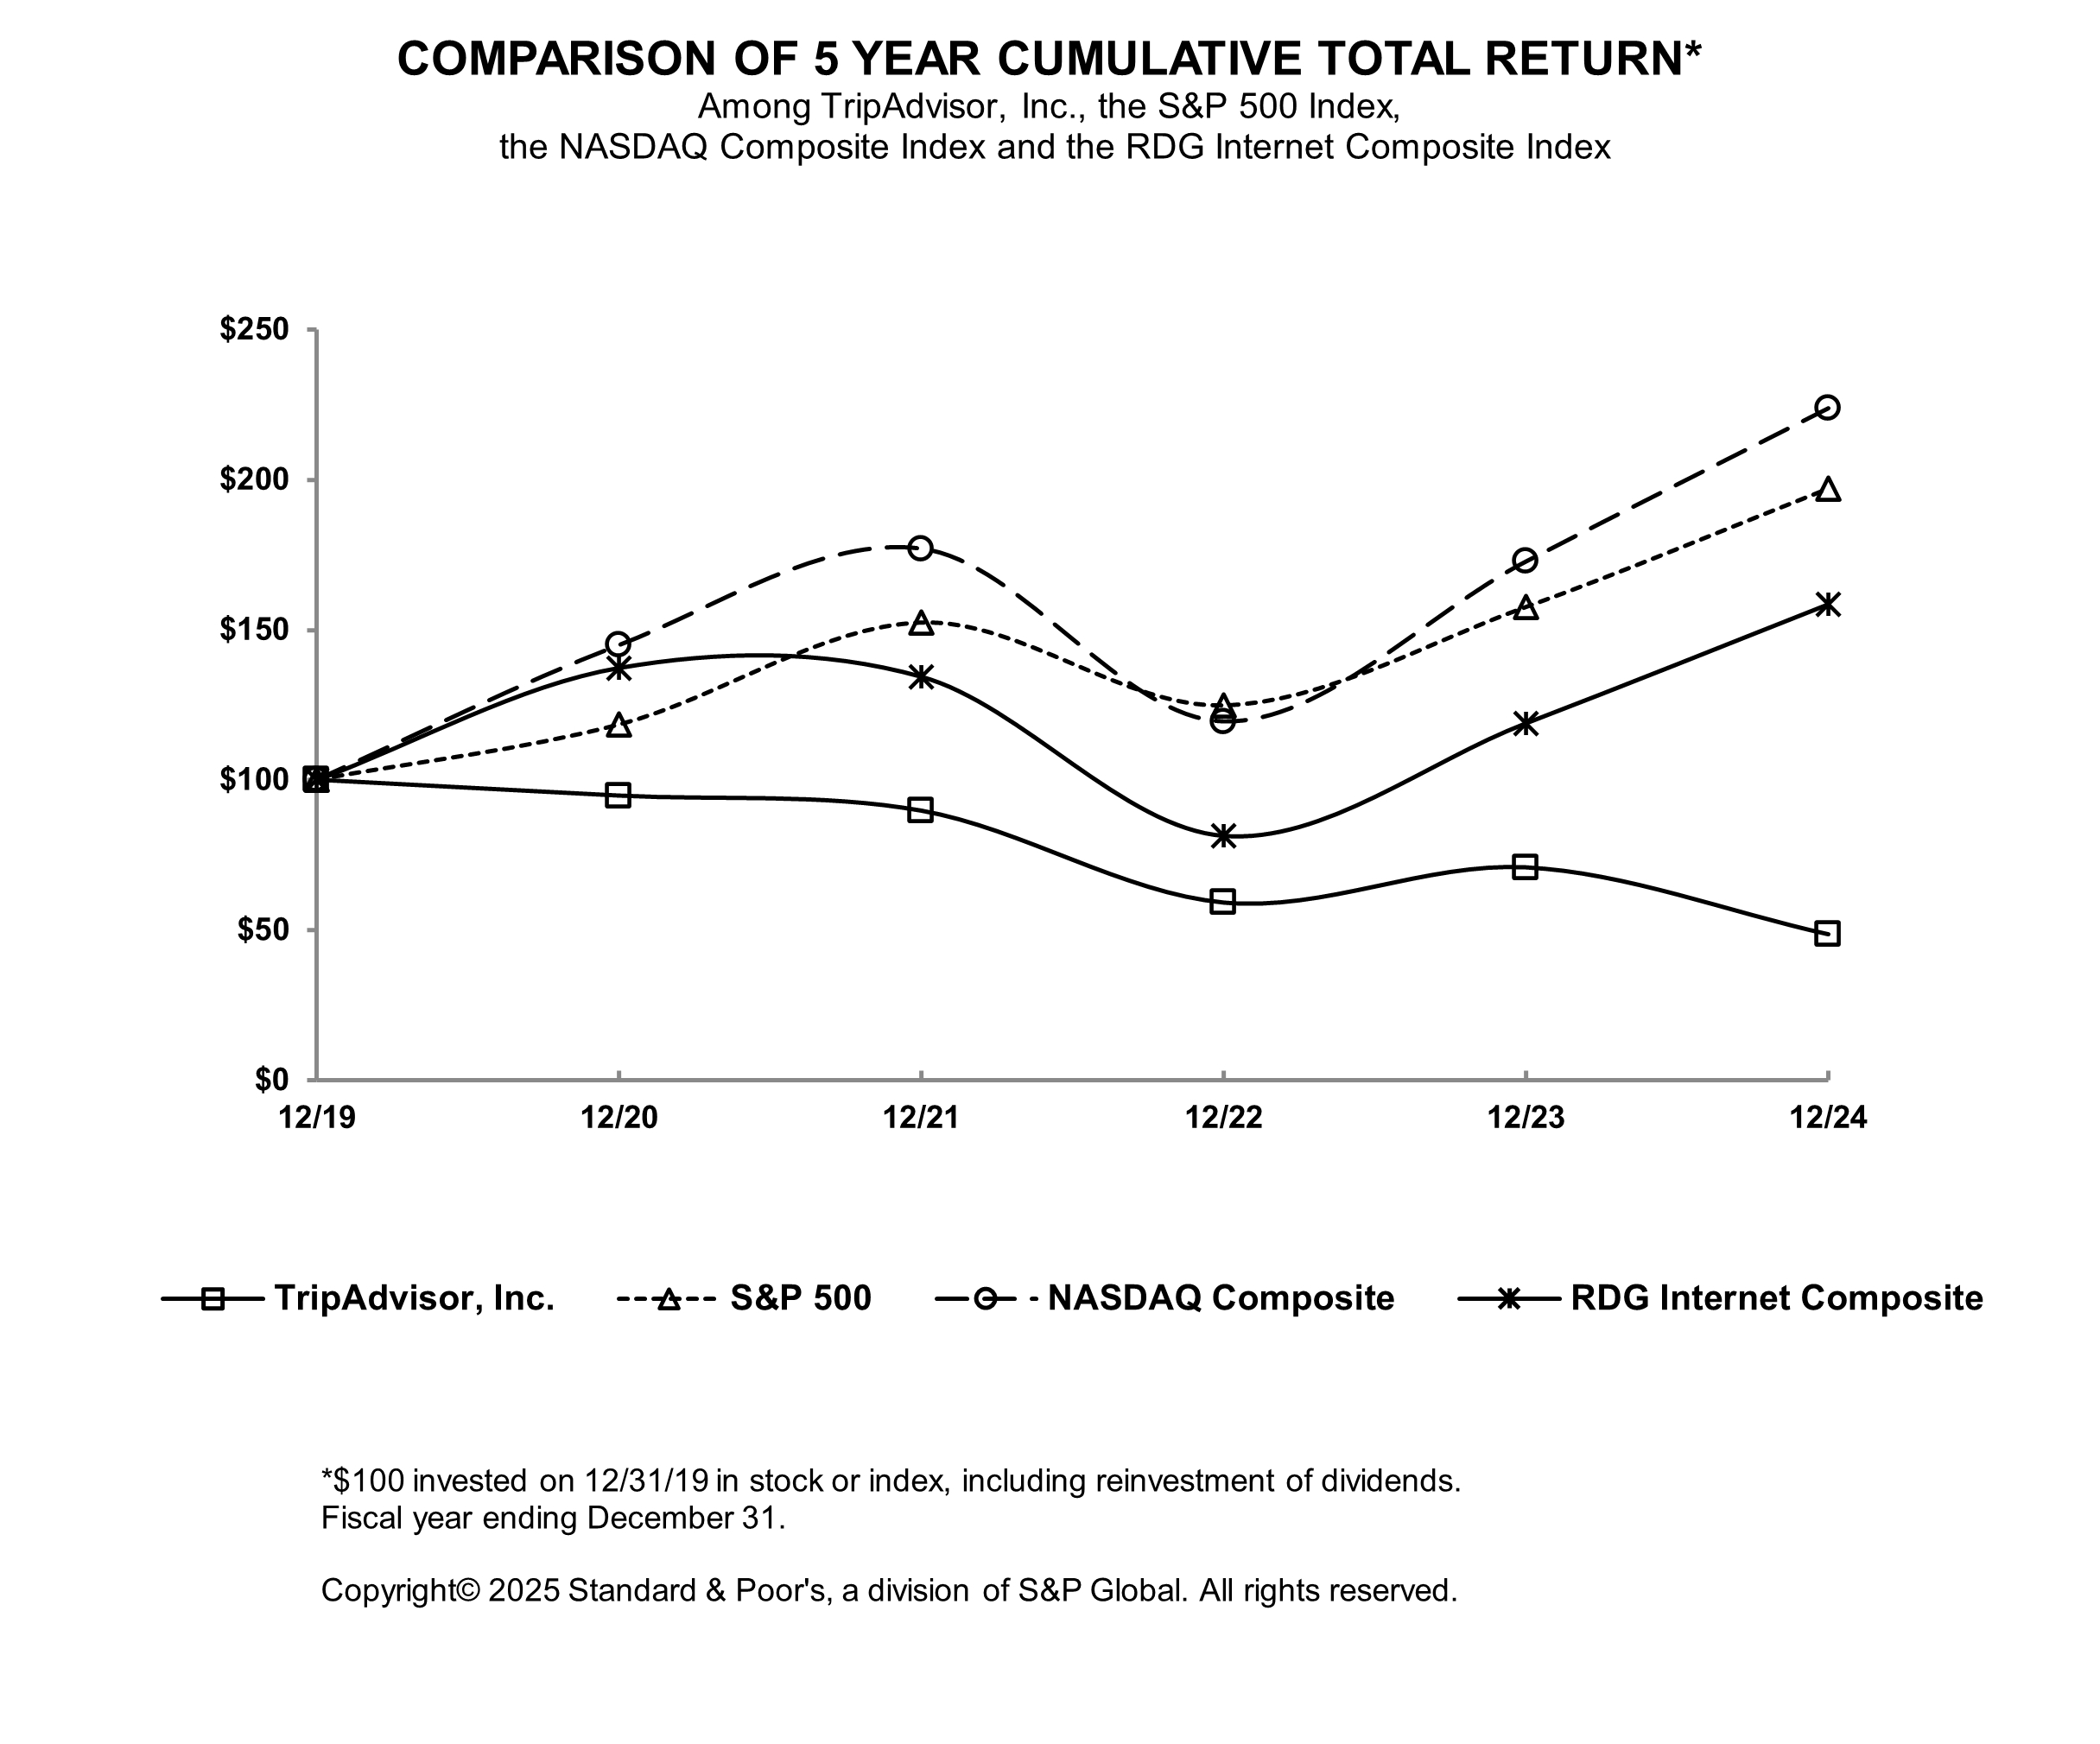
This performance comparison graph is not “soliciting material,” is not deemed filed with the SEC and is not deemed to be incorporated by reference into any filing of Tripadvisor, Inc. under the Securities Act or any filing under the Exchange Act.
Holders of Record
As of February 11, 2025, there were 127,581,730 outstanding shares of our common stock held by 1,620 stockholders of record, and 12,799,999 outstanding shares of our Class B common stock held by one stockholder of record: LTRIP.
Dividends
We did not declare or pay any dividends during the years ended December 31, 2024, 2023, or 2022. Any determination to pay dividends in the future will be at the discretion of our Board of Directors and will depend on our results of operations, earnings, capital requirements, financial condition, future prospects, contractual restrictions and other factors deemed relevant by our Board of Directors. In addition, our ability to pay dividends is limited by the terms of our Credit Agreement. Refer to “Note 8: Debt” in the notes to our consolidated financial statements in Item 8 of this Annual Report on Form 10-K for further information regarding our debt agreements. Therefore, investors should not rely on regular quarterly or annual dividend income from shares of our common stock and investors should not rely on special dividends with any regularity, or at all. Investors should rely on sales of their common stock after price appreciation, which may never occur, as the only way to realize future gains on their investments.
Securities Authorized for Issuance Under Equity Compensation Plans
The information required under this item is incorporated herein by reference to our 2025 Proxy Statement, which proxy statement will be filed with the SEC not later than 120 days after the close of our fiscal year ended December 31, 2024.
Unregistered Sales of Equity Securities
During the quarter ended December 31, 2024, we did not issue or sell any shares of our common stock, Class B common stock or other equity securities pursuant to unregistered transactions in reliance upon an exemption from the registration requirements of the Securities Act.
Issuer Purchases of Equity Securities
On September 7, 2023, our Board of Directors authorized the repurchase of $250 million in shares of our common stock under a share repurchase program. Our Board of Directors authorized and directed management, working with the Executive Committee of our Board of Directors, to affect the share repurchase program in compliance with applicable legal requirements. The Executive Committee of our Board of Directors will determine the price, timing, amount and method of such repurchases based on its evaluation of market conditions and other factors, and at prices determined to be attractive and in the best interests of both the Company and its stockholders. This share repurchase program, which has a term of two years, does not obligate the Company to acquire any particular number of shares and may be modified, suspended or discontinued at any time.
During the quarter ended December 31, 2024, we did not repurchase any shares of our common stock under our existing share repurchase program. As of December 31, 2024, we had $200 million remaining available to repurchase shares of our common stock under this authorized share repurchase program.
Item 6. [Reserved]
Item 7. Management’s Discussion and Analysis of Financial Condition and Results of Operations
The following discussion and analysis provides information concerning our results of operations and financial condition. This discussion should be read in conjunction with our accompanying consolidated financial statements including the notes in Item 8 of this Annual Report on Form 10-K, and the Section entitled “Cautionary Note Regarding Forward-Looking Statements,” included elsewhere in this Annual Report on Form 10-K. Our actual results may differ from the results discussed in any forward looking statements, which may be due to factors discussed in “Risk Factors” and elsewhere in this Annual Report on Form 10-K.
Overview
The Tripadvisor group operates as a family of brands with a purpose of connecting people to experiences worth sharing. Our vision is to be the world’s most trusted source for travel and experiences. The Company operates across three business segments: Brand Tripadvisor, Viator, and TheFork. We leverage our brands, technology platforms, and capabilities to connect our large, global audience with partners by offering rich content, travel guidance products and services, and two-sided marketplaces for experiences, accommodations, restaurants, and other travel categories.
Brand Tripadvisor’s purpose is to empower everyone to be a better traveler by serving as the world’s most trusted and essential travel guidance platform. Since Tripadvisor’s founding in 2000, the Tripadvisor brand has developed a relationship of trust and community with travelers and experience seekers by providing an online global platform for travelers to discover, generate, and share authentic user-generated content (“UGC”) in the form of reviews and opinions for destinations, points-of-interest (“POIs”), experiences, accommodations, restaurants, and cruises in over 40 countries and in more than 20 languages across the world. Tripadvisor offers more than 1 billion user-generated reviews and opinions on over 9 million experiences, accommodations, restaurants, airlines, and cruises. Tripadvisor’s online platform attracts one of the world’s largest travel audiences, with hundreds of millions of visitors annually.
Viator’s purpose is to bring extraordinary, unexpected, and forever memorable experiences to more people, more often, wherever they are traveling. In doing so, Viator elevates tens of thousands of businesses, large and small. Viator delivers on its purpose by enabling travelers to discover and book iconic, unique and memorable experiences from experience operators around the globe. Our online marketplace is comprehensive and easy-to-use, connecting millions of travelers to the world’s largest supply of bookable tours, activities and attractions—nearly 400,000 experiences from more than 65,000 operators. Viator is a pure-play experiences online travel agency (“OTA”) singularly focused on the needs of both travelers and operators with the largest supply of bookable experiences available to travelers.
TheFork’s purpose is to deliver happiness through amazing dining experiences as the leading online restaurant booking platform in Europe. At the forefront of championing restaurant culture, TheFork harnesses technology to promote real life connections between diners and restaurateurs. With a network of approximately 55,000 partner restaurants across 11 countries, nearly 40 million app downloads and more than 20 million reviews, TheFork is a go-to platform for all food lovers to enjoy unforgettable restaurant experiences. Through TheFork, users can easily find restaurants according to their preferences, check real-time availability, instantly book online 24/7, benefit from special offers and pay directly to the restaurants. For restaurateurs, TheFork's technology enables them to optimize reservation management and occupancy rates, increase bookings and visibility, limit the impacts of no-shows, manage payments and streamline operations, all while accessing the broadest community of loyal diners.
Trends
The online travel industry in which we operate is large, highly dynamic and competitive. We describe below current trends affecting our overall business and segments, including uncertainties that may impact our ability to execute on our objectives and strategies. Public health-related events, such as a pandemic; political instability, geopolitical conflicts, including the evolving events in the Middle East and between Ukraine and Russia; acts of terrorism; fluctuations in currency values’ and changes in global economic conditions, are examples of other events that could have a negative impact on the travel industry and, as a result, our financial results in the future.
We generate a significant amount of direct traffic from search engines, including Google, through strong search engine optimization (“SEO”) performance across all segments. We believe our SEO traffic acquisition performance has been negatively impacted, and may be impacted in the future, by search engines (primarily Google) changing their search result placement and underlying algorithms to increase the prominence of their own products in search results across our business. This has most notably impacted our hotel meta offering within our Brand Tripadvisor segment.
In response to the large underpenetrated market for experiences, Viator continues to invest in product, supply, and marketing to drive bookings and grow market share. Over the long-term, we are focused on driving a greater percentage of our bookings from direct channels. We are doing this by continuing to focus on increasing our brand loyalty and improving the user experience across products on our website and mobile app, providing high-quality customer service, and offering leading customer choice for online bookable experiences supply. In addition, we are evolving and growing our partnerships with leading global and e-commerce brands and general OTAs to increase demand for experiences and drive positive unit economics.
The global experiences market is large, growing, and highly fragmented, with the vast majority of bookings still occurring through traditional offline sources. We expect to benefit from ongoing market tailwinds as consumers increasingly book experiences online and consumer behavior continues to allocate discretionary spending more to travel and experiences and away from physical goods. Likewise, the global restaurants category is also benefiting from increased online adoption by both consumers and restaurant partners, particularly in Europe. Given the competitive positioning of our businesses relative to the attractive growth prospects in the experiences and restaurant categories, we expect to continue to invest in these categories across Tripadvisor group and, in particular, within the Viator and TheFork segments, to continue growing revenue, operating scale, and market share gains for the long-term.
For information regarding our business strategy and business models, see the discussion set forth in Part I, Item 1. “Business,” of this Form 10-K under the captions “Our Business Strategy,” and “Our Business Models.”
Recent Developments
Tripadvisor and Liberty TripAdvisor Planned Merger
On December 18, 2024, the Company and LTRIP entered into an agreement and plan of merger (the "Merger Agreement") whereby Tripadvisor will acquire Liberty TripAdvisor (the "Merger"). In connection with the Merger, (i) the shares of LTRIP Series A Common Stock and Series B Common Stock issued and outstanding immediately prior to the effective time of the Merger will be converted into the right to receive $0.2567 per share in cash (without interest), totaling approximately $20 million in the aggregate; (ii) all of the shares of LTRIP's 8% Series A Cumulative Redeemable Preferred Stock issued and outstanding immediately prior to the effective time of the Merger will be converted into the right to receive, in the aggregate, approximately $42 million in cash, without interest, and 3,037,959 validly issued, fully paid and non-assessable shares of the Company's common stock; and (iii) LTRIP's 0.50% Exchangeable Senior Debentures of approximately $330 million will be repaid in accordance with their terms. Pursuant to the Merger Agreement, the Company will provide a loan facility (the “TRIP Loan Facility”) to LTRIP of approximately $330 million, to repay LTRIP debentures prior to the closing of the Merger. The TRIP Loan Facility will be repaid on the earlier of (i) the closing of the Merger, and (ii) 15 business days after the valid termination of the Merger Agreement or (b) such later date as jointly agreed to by LTRIP and the Company.
The transaction is expected to close in the second quarter of 2025, and based on 10-day volume-weighted average share price (“VWAP”) of $13.98 at December 17, 2024, the expected aggregate transaction value to be paid by the Company is approximately $435 million (which includes approximately $392 million of cash consideration and 3,037,959 validly issued, fully paid and non-assessable shares of the Company's common stock based on 10-day VWAP of $13.98 at December 17, 2024). The implied share price for the acquisition of such shares of the Company's common stock from LTRIP is $16.21 (which reflects a premium of approximately 16% based on the 10-day VWAP as of December 17, 2024). Refer to “Note 1: Organization and Business Description” in the notes to our consolidated financial statements in Item 8 of this Annual Report on Form 10-K for further information.
Restructuring and Related Reorganization Actions
During the fourth quarter of 2024, the Company approved and subsequently initiated a set of actions across its businesses in order to reduce its cost structure, improve operational efficiencies, and realign its workforce with its strategic initiatives. As a result, the Company incurred pre-tax restructuring and other related reorganization costs totaling $21 million, which consisted of a one-time contract termination fee to a third-party professional services firm and employee severance and related benefits. Refer to “Note 7: Accrued Expenses and Other Current Liabilities” and “Note 18: Segment and Geographic Information” in the notes to our consolidated financial statements in Item 8 of this Annual Report on Form 10-K for further information regarding restructuring and other related reorganization costs incurred for each reportable segment.
As a result of subsequent actions, the Company expects to incur additional pre-tax restructuring and other related reorganization costs in an estimated range of $9 million to $11 million during the first quarter of 2025, consisting of employee severance and related benefits, primarily in the Brand Tripadvisor segment. We expect these cost reduction measures to be completed by the Company during the first quarter of 2025.
Term Loan B Facility
On July 8, 2024, under the Amended Credit Agreement, the Company issued a $500 million Term Loan B Facility maturing July 8, 2031, with an interest rate based on secured overnight financing rate ("SOFR") plus 2.75%. On July 15, 2024, the Company used these borrowed funds to fully redeem the outstanding $500 million, 2025 Senior Notes. The Term Loan B Facility was offered at 99.75% of par and is required to be paid down at 1.00% of the aggregate principal amount per year, repayable in quarterly installments on the last day of each calendar quarter, commencing December 31, 2024, equal to 0.25% of the original principal amount with the balance due on the maturity date. Refer to “Note 8: Debt” in the notes to our consolidated financial statements in Item 8 of this Annual Report on Form 10-K for further information.
Income Taxes
As previously disclosed, in August 2023, we received a Notices of Proposed Adjustments (“NOPA”) from the IRS for the 2014 through 2016 tax years relating to certain transfer pricing arrangements with our foreign subsidiaries. In response, we requested competent authority assistance under the Mutual Agreement Procedure (“MAP”) for the 2014 through 2016 tax years. In January 2024, we received notification of a MAP resolution agreement for the 2014 through 2016 tax years, which we accepted in February 2024. In connection with this IRS audit settlement: (i) during the second quarter of 2024, we made a payment to the IRS of $141 million, inclusive of estimated interest, (ii) during the second half of 2024, we made various state tax payments totaling $26 million, inclusive of estimated interest, and (iii) during the fourth quarter of 2024, we received a competent authority refund of $42 million, inclusive of net interest income, from a foreign jurisdiction. This IRS audit settlement resulted in total net operating cash outflow during 2024 of $105 million, which includes federal tax benefits from these payments of $20 million. Refer to “Note 10: Income Taxes” in the notes to our consolidated financial statements in Item 8 of this Annual Report on Form 10-K and the “Contingencies” discussion below for further information regarding potential material contingencies related to ongoing audits regarding income taxes.
Critical Accounting Estimates
We prepare our consolidated financial statements and accompanying notes in accordance with GAAP. Preparation of the consolidated financial statements and accompanying notes requires that management make estimates and assumptions that affect the reported amounts of assets and liabilities and the disclosure of contingent assets and liabilities as of the date of the consolidated financial statements as well as revenue and expenses during the periods reported. Management bases its estimates on historical experience, when applicable and other assumptions that it believes are reasonable under the circumstances. Actual results may differ from estimates under different assumptions or conditions.
There are certain critical estimates that we believe require that management use significant judgment and estimates in applying those policies in the preparation of our consolidated financial statements. We consider an accounting estimate to be critical if:
•It requires us to make an assumption because information was not available at the time or it included matters that were highly uncertain at the time we were making the estimate; and/or
•Changes in the estimate or different estimates that we could have selected may have had a material impact on our financial condition or results of operations.
Refer to “Note 2: Significant Accounting Policies” in the notes to our consolidated financial statements in Item 8 of this Annual Report on Form 10-K for an overview of our significant accounting policies and any new accounting pronouncements that we have adopted or that we plan to adopt that have had or may have an impact on our financial statements.
A discussion of information about the nature and rationale for our critical accounting estimates is below:
Income Taxes
We record income taxes under the asset and liability method. Deferred tax assets and liabilities reflect our estimation of the future tax consequences of temporary differences between the carrying amounts of assets and liabilities for book and tax purposes. We determine deferred income taxes based on the differences in accounting methods and timing between financial statement and income tax reporting. Accordingly, we determine the deferred tax asset or liability for each temporary difference based on the enacted income tax rates expected to be in effect when we realize the underlying items of income and expense. We consider all relevant factors when assessing the likelihood of future realization of our deferred tax assets, including our recent earnings experience by jurisdiction, expectations of future taxable income and the carryforward periods available to us for tax reporting purposes, as well as assessing available tax planning strategies. We may establish a valuation allowance to reduce deferred tax assets to the amount we believe is more likely than not to be realized. As of December 31, 2024, we had a valuation allowance of approximately $106 million related to certain NOL carryforwards and other foreign deferred tax assets for which it is more likely than not, the tax benefit will not be realized. We classify deferred tax assets and liabilities as noncurrent on our consolidated balance sheet. Due to inherent complexities arising from the nature of our businesses, future changes in income tax law, tax sharing agreements or variances between our actual and anticipated operating results, we make certain judgments and estimates. Therefore, actual income taxes could materially vary from these estimates.
We record liabilities to address uncertain tax positions we have taken in previously filed tax returns or that we expect to take in a future tax return. The determination for required liabilities is based upon an analysis of each individual tax position, taking into consideration whether it is more likely than not that our tax position, based on technical merits, will be sustained upon examination. For those positions for which we conclude it is more likely than not it will be sustained, we recognize the largest amount of tax benefit that is greater than 50% likely of being realized upon ultimate settlement with the taxing authority. The difference between the amount recognized and the total tax position is recorded as a liability. The ultimate resolution of these tax positions may be greater or less than the liabilities recorded.
Refer to “Note 10: Income Taxes” in the notes to our consolidated financial statements in Item 8 of this Annual Report on Form 10-K and the “Contingencies” discussion below for further information, including certain uncertainties, critical estimates, and potential contingencies related to ongoing audits regarding income taxes.
Certain Relationships and Related Party Transactions
For information on our related party transactions, refer to “Note 17: Related Party Transactions” in the notes to our consolidated financial statements in Item 8 of this Annual Report on Form 10-K.
Consolidated Results of Operations
Revised Operating Expense Presentation
During the fourth quarter of 2024, the Company revised its operating expense captions on its consolidated statement of operations to better align the Company’s financial presentation with how management assesses performance and makes strategic decisions in its business operations, and to provide additional clarity and understanding of our operating expenses for investors. Prior year amounts have been reclassified to conform to the current period presentation. The revised presentation did not result in any changes to previously reported revenues, total costs and expenses, operating income (loss), income (loss) before income taxes, or net income (loss). For further information, refer to “Note 2: Significant Accounting Policies” in the notes to our consolidated financial statements in Item 8 of this Annual Report on Form 10-K.
A discussion regarding our financial condition and results of operations for fiscal year 2024 compared to fiscal year 2023 is presented below. A discussion regarding our financial condition and results of operations for fiscal year 2023 compared to fiscal year 2022 can be found in Part II, Item 7. "Management’s Discussion and Analysis of Financial Condition and Results of Operations" of our Annual Report on Form 10-K for the year ended December 31, 2023, filed with the SEC on February 16, 2024, except for the discussion related to consolidated operating expenses which are presented below. We have included a discussion of certain operating expense captions for fiscal year 2023 compared to fiscal year 2022, given the changes made to those same operating expenses captions, as noted above.
Results of Operations
Selected Financial Data
(in millions, except percentages)
| | | | | | | | | | | | | | | | | | | | |
| | Year ended December 31, | | | % Change | |
| | 2024 | | | 2023 | | | 2022 | | | 2024 vs. 2023 | | | 2023 vs. 2022 | |
Revenue | | $ | 1,835 | | | $ | 1,788 | | | $ | 1,492 | | | | 3 | % | | | 20 | % |
| | | | | | | | | | | | | | | |
Costs and expenses: | | | | | | | | | | | | | | | |
Cost of sales | | | 131 | | | | 119 | | | | 78 | | | | 10 | % | | | 53 | % |
Marketing | | | 729 | | | | 705 | | | | 576 | | | | 3 | % | | | 22 | % |
Personnel (including stock-based compensation of $120, $96, and $88) | | | 595 | | | | 570 | | | | 503 | | | | 4 | % | | | 13 | % |
Technology | | | 91 | | | | 80 | | | | 63 | | | | 14 | % | | | 27 | % |
General and administrative | | | 91 | | | | 79 | | | | 74 | | | | 15 | % | | | 7 | % |
Depreciation and amortization | | | 85 | | | | 87 | | | | 97 | | | | (2 | )% | | | (10 | )% |
Restructuring and other related reorganization costs | | | 21 | | | | 22 | | | | — | | | | (5 | )% | | n.m. | |
Total costs and expenses: | | | 1,743 | | | | 1,662 | | | | 1,391 | | | | 5 | % | | | 19 | % |
Operating income (loss) | | | 92 | | | | 126 | | | | 101 | | | | (27 | )% | | | 25 | % |
Other income (expense): | | | | | | | | | | | | | | | |
Interest expense | | | (46 | ) | | | (44 | ) | | | (44 | ) | | | 5 | % | | | 0 | % |
Interest income | | | 48 | | | | 47 | | | | 15 | | | | 2 | % | | | 213 | % |
Other income (expense), net | | | (7 | ) | | | (4 | ) | | | (5 | ) | | | 75 | % | | | (20 | )% |
Total other income (expense), net | | | (5 | ) | | | (1 | ) | | | (34 | ) | | | 400 | % | | | (97 | )% |
Income (loss) before income taxes | | | 87 | | | | 125 | | | | 67 | | | | (30 | )% | | | 87 | % |
(Provision) benefit for income taxes | | | (82 | ) | | | (115 | ) | | | (47 | ) | | | (29 | )% | | | 145 | % |
Net income (loss) | | $ | 5 | | | $ | 10 | | | $ | 20 | | | | (50 | )% | | | (50 | )% |
| | | | | | | | | | | | | | | |
Other financial data: | | | | | | | | | | | | | | | |
Adjusted EBITDA (1) | | $ | 339 | | | $ | 334 | | | $ | 295 | | | | 1 | % | | | 13 | % |
| | | | | | | | | | | | | | | |
n.m. = not meaningful | | | | | | | | | | | | | | | |
(1)Consolidated Adjusted EBITDA is considered a non-GAAP measure as defined by the SEC. Please refer to the “Adjusted EBITDA” discussion below for more information, including tabular reconciliations to the most directly comparable GAAP financial measure.
Revenue and Segment Information
Brand Tripadvisor Segment
| | | | | | | | | | | | | | | | | | | | |
| | Year ended December 31, | | | % Change | |
| | 2024 | | | 2023 | | | 2022 | | | 2024 vs. 2023 | | | 2023 vs. 2022 | |
| | (in millions) | | | | | | |
Revenue (1) | | $ | 949 | | | $ | 1,031 | | | $ | 966 | | | | (8 | )% | | | 7 | % |
Less: (2) | | | | | | | | | | | | | | | |
Cost of sales | | | 33 | | | | 31 | | | | 20 | | | | 6 | % | | | 55 | % |
Marketing | | | 251 | | | | 279 | | | | 260 | | | | (10 | )% | | | 7 | % |
Personnel (exclusive of stock-based compensation) | | | 266 | | | | 273 | | | | 249 | | | | (3 | )% | | | 10 | % |
Technology | | | 54 | | | | 50 | | | | 42 | | | | 8 | % | | | 19 | % |
General and administrative | | | 44 | | | | 50 | | | | 50 | | | | (12 | )% | | | 0 | % |
Total Adjusted EBITDA | | $ | 301 | | | $ | 348 | | | $ | 345 | | | | (14 | )% | | | 1 | % |
| | | | | | | | | | | | | | | |
Adjusted EBITDA Margin by Segment (3) | | | 32 | % | | | 34 | % | | | 36 | % | | | | | | |
(1)Brand Tripadvisor segment revenue figures are shown gross of intersegment (intercompany) revenue, which is eliminated on a consolidated basis. Refer to “Note 18: Segment and Geographic Information” in the notes to our consolidated financial statements in Item 8 of this Annual Report on Form 10-K for a discussion of intersegment revenue and expenses for all periods presented.
(2)Refer to “Note 18: Segment and Geographic Information” in the notes to our consolidated financial statements in Item 8 of this Annual Report on Form 10-K for expense information needed in order to reconcile to the consolidated operating expense captions on the consolidated statements of operations.
(3)“Adjusted EBITDA Margin by Segment” is defined as Adjusted EBITDA by segment divided by revenue by segment.
Brand Tripadvisor revenue decreased by $82 million during the year ended December 31, 2024 when compared to the same period in 2023, primarily due to a decrease in hotel meta revenue and, to a lesser extent, a decrease in hotel B2B revenue.
Adjusted EBITDA in our Brand Tripadvisor segment decreased $47 million during the year ended December 31, 2024 when compared to the same period in 2023, while adjusted EBITDA margin decreased by 2 percentage points during the year ended December 31, 2024 when compared to the same period in 2023. The decrease in adjusted EBITDA was primarily due to a decrease in revenue, as noted above, partially offset by a decrease in the segment's operating expenses during the year ended December 31, 2024 when compared to the same period in 2023 of $35 million, primarily related to a decrease in marketing expenses, primarily paid online traffic acquisition costs, and to a lesser extent a decrease in personnel costs. The decrease in adjusted EBITDA margin during the year ended December 31, 2024 when compared to the same period in 2023, was largely due to an increase in personnel costs as a percent of revenue.
The following is a detailed discussion of the revenue sources within our Brand Tripadvisor segment:
| | | | | | | | | | | | | | | | | | | | |
| | Year ended December 31, | | | % Change | |
| | 2024 | | | 2023 | | | 2022 | | | 2024 vs. 2023 | | | 2023 vs. 2022 | |
Brand Tripadvisor: | | (in millions, except percentages) | | | | | | | |
Tripadvisor-branded hotels | | $ | 585 | | | $ | 659 | | | $ | 650 | | | | (11 | %) | | | 1 | % |
% of Brand Tripadvisor revenue* | | | 62 | % | | | 64 | % | | | 67 | % | | | | | | |
Media and advertising | | | 150 | | | | 145 | | | | 130 | | | | 3 | % | | | 12 | % |
% of Brand Tripadvisor revenue* | | | 16 | % | | | 14 | % | | | 13 | % | | | | | | |
Tripadvisor experiences and dining (1) | | | 169 | | | | 176 | | | | 134 | | | | (4 | %) | | | 31 | % |
% of Brand Tripadvisor revenue* | | | 18 | % | | | 17 | % | | | 14 | % | | | | | | |
Other | | | 45 | | | | 51 | | | | 52 | | | | (12 | %) | | | (2 | %) |
% of Brand Tripadvisor revenue* | | | 5 | % | | | 5 | % | | | 5 | % | | | | | | |
Total Brand Tripadvisor Revenue | | $ | 949 | | | $ | 1,031 | | | $ | 966 | | | | (8 | %) | | | 7 | % |
*Percentages may not total to 100% due to rounding
(1)Tripadvisor experiences and dining revenue within the Brand Tripadvisor segment is shown gross of intersegment (intercompany) revenue, which is eliminated on a consolidated basis. Refer to “Note 18: Segment and Geographic Information” in the notes to our consolidated financial statements in Item 8 of this Annual Report on Form 10-K for a discussion of intersegment revenue for all periods presented.
Tripadvisor-branded Hotels Revenue
Tripadvisor-branded hotels revenue decreased $74 million during the year ended December 31, 2024 when compared to the same period in 2023, primarily due to a decrease in hotel meta revenue and, to a lesser extent, a decrease in hotel B2B revenue as the Company transitioned from a sales-led model to a self-service model during 2024. The decrease in hotel meta revenue during the year ended December 31, 2024 when compared to the same period in 2023 was driven by declines in U.S. hotel meta revenue and, to a lesser extent, European hotel meta revenue, primarily due to weaker demand related to increased competition in paid online marketing channels and continued headwinds impacting direct channels, including SEO traffic, contributing to a decrease in click volumes, and to a lesser extent, a deceleration in cost-per-click (“CPC”) rates, particularly in the U.S.
Media and Advertising Revenue
Media and advertising revenue consists of revenue from display-based advertising (or “media advertising”) across our platform and increased $5 million during the year ended December 31, 2024 when compared to the same period in 2023, primarily due to an increase in overall advertising campaigns and pricing. Advertising through creative offerings and programmatic advertising, more than offset declines in traditional display advertising that correlates more closely with traffic volume, as well as the broader display advertising market, which is growing slower than other advertising formats.
Tripadvisor Experiences and Dining Revenue
Tripadvisor experiences and dining revenue includes intercompany (intersegment) revenue consisting of affiliate marketing commissions earned primarily from experience bookings, and to a lesser extent, restaurant reservation bookings on Tripadvisor-branded websites and mobile apps, fulfilled by Viator and TheFork, respectively, which is eliminated on a consolidated basis, in addition to revenue earned from Brand Tripadvisor’s restaurant offerings. Tripadvisor experiences and dining revenue decreased $7 million during the year ended December 31, 2024 when compared to the same period in 2023, due to a decline in dining revenue as the Company transitioned from a sales-led model to a self-service model during 2024.
Other Revenue
Other revenue, which includes vacation rentals revenue, in addition to primarily click-based advertising and display-based advertising revenue from cruise, flights, and rental cars offerings on Tripadvisor websites and mobile apps, decreased by $6 million during the year ended December 31, 2024 when compared to the same period in 2023, primarily due to a decline in vacation rentals revenue as this offering continues to be strategically de-emphasized.
Viator Segment
| | | | | | | | | | | | | | | | | | | | |
| | Year ended December 31, | | | % Change | |
| | 2024 | | | 2023 | | | 2022 | | | 2024 vs. 2023 | | | 2023 vs. 2022 | |
| | (in millions) | | | | | | |
Revenue | | $ | 840 | | | $ | 737 | | | $ | 493 | | | | 14 | % | | | 49 | % |
Less: (1) | | | | | | | | | | | | | | | |
Cost of sales | | | 80 | | | | 79 | | | | 51 | | | | 1 | % | | | 55 | % |
Marketing (2) | | | 562 | | | | 519 | | | | 351 | | | | 8 | % | | | 48 | % |
Personnel (exclusive of stock-based compensation) | | | 126 | | | | 110 | | | | 81 | | | | 15 | % | | | 36 | % |
Technology | | | 25 | | | | 18 | | | | 9 | | | | 39 | % | | | 100 | % |
General and administrative | | | 14 | | | | 11 | | | | 12 | | | | 27 | % | | | (8 | )% |
Total Adjusted EBITDA | | $ | 33 | | | $ | — | | | $ | (11 | ) | | n.m. | | | n.m. | |
| | | | | | | | | | | | | | | |
Adjusted EBITDA Margin by Segment (3) | | | 4 | % | | | 0 | % | | | (2 | %) | | | | | | |
n.m. = not meaningful
(1)Refer to “Note 18: Segment and Geographic Information” in the notes to our consolidated financial statements in Item 8 of this Annual Report on Form 10-K for expense information needed in order to reconcile to the consolidated operating expense captions on the consolidated statements of operations.
(2)Viator segment marketing expenses are shown gross of intersegment (intercompany) expenses, which is eliminated on a consolidated basis. Refer to “Note 18: Segment and Geographic Information” in the notes to our consolidated financial statements in Item 8 of this Annual Report on Form 10-K for a discussion of intersegment revenue and expenses for all periods presented.
(3)“Adjusted EBITDA Margin by Segment” is defined as Adjusted EBITDA by segment divided by revenue by segment.
Viator segment revenue increased by $103 million during the year ended December 31, 2024 when compared to the same period in 2023, primarily driven by growth in booking volume across all points of sale in all major geographies and, to a lesser extent, an increase in pricing.
Adjusted EBITDA in the Viator segment improved by $33 million during the year ended December 31, 2024 when compared to the same period in 2023, and adjusted EBITDA margin improved by 4 percentage points during the year ended December 31, 2024 when compared to the same period in 2023. The improvement in adjusted EBITDA and adjusted EBITDA margin was primarily due to differences in marketing channel mix driving increased spend efficiency. These improvements were partially offset by increased personnel costs to support growth, and to a lesser extent, increased licensing costs, as well as revenue generation costs resulting from credit card payments in direct correlation with the increase in revenue, all negatively impacted adjusted EBITDA.
TheFork Segment
| | | | | | | | | | | | | | | | | | | | |
| | Year ended December 31, | | | % Change | |
| | 2024 | | | 2023 | | | 2022 | | | 2024 vs. 2023 | | | 2023 vs. 2022 | |
| | (in millions) | | | | | | |
Revenue | | $ | 181 | | | $ | 154 | | | $ | 126 | | | | 18 | % | | | 22 | % |
Less: (1) | | | | | | | | | | | | | | | |
Cost of sales | | | 15 | | | | 9 | | | | 7 | | | | 67 | % | | | 29 | % |
Marketing (2) | | | 51 | | | | 41 | | | | 58 | | | | 24 | % | | | (29 | )% |
Personnel (exclusive of stock-based compensation) | | | 83 | | | | 91 | | | | 85 | | | | (9 | )% | | | 7 | % |
Technology | | | 12 | | | | 12 | | | | 12 | | | | 0 | % | | | 0 | % |
General and administrative | | | 15 | | | | 15 | | | | 3 | | | | 0 | % | | | 400 | % |
Total Adjusted EBITDA | | $ | 5 | | | $ | (14 | ) | | $ | (39 | ) | | n.m. | | | | (64 | )% |
| | | | | | | | | | | | | | | |
Adjusted EBITDA Margin by Segment (3) | | | 3 | % | | | (9 | %) | | | (31 | %) | | | | | | |
n.m. = not meaningful
(1)Refer to “Note 18: Segment and Geographic Information” in the notes to our consolidated financial statements in Item 8 of this Annual Report on Form 10-K for expense information needed in order to reconcile to the consolidated operating expense captions on the consolidated statements of operations.
(2)TheFork segment marketing expenses are shown gross of intersegment (intercompany) expenses, which is eliminated on a consolidated basis. Refer to “Note 18: Segment and Geographic Information” in the notes to our consolidated financial statements in Item 8 of this Annual Report on Form 10-K for a discussion of intersegment revenue and expenses for all periods presented.
(3)“Adjusted EBITDA Margin by Segment” is defined as Adjusted EBITDA by segment divided by revenue by segment.
TheFork segment revenue increased by $27 million during the year ended December 31, 2024 when compared to the same period in 2023, driven primarily by increased booking volumes largely in direct channels and, to a lesser extent, an increase in pricing.
Adjusted EBITDA in TheFork segment improved by $19 million during the year ended December 31, 2024 when compared to the same period in 2023, and adjusted EBITDA margin improved by 12 percentage points during the year ended December 31, 2024 when compared to the same period in 2023. The improvement in adjusted EBITDA was primarily due to an increase in revenue as noted above, and lower personnel costs, partially offset by an increase in paid online traffic acquisition costs and other costs to support revenue growth. The improvement in adjusted EBITDA margin was primarily due to lower personnel costs as a percent of revenue.
Consolidated Expenses
Cost of Sales
Cost of sales consists of expenses that are directly related or closely correlated to revenue generation, including direct costs, such as credit card and other booking transaction payment fees, media production costs, ad serving fees, and other revenue generating costs. In addition, cost of sales includes operating costs such as bad debt expense and non-income taxes, including sales, use, digital services, and other non-income related taxes.
| | | | | | | | | | | | | | | | | | | | |
| | Year ended December 31, | | | % Change | |
| | 2024 | | | 2023 | | | 2022 | | | 2024 vs. 2023 | | | 2023 vs. 2022 | |
| | (in millions) | | | | | | | |
Cost of sales | | $ | 131 | | | $ | 119 | | | $ | 78 | | | | 10 | % | | | 53 | % |
% of revenue | | | 7.1 | % | | | 6.7 | % | | | 5.2 | % | | | | | | |
2024 vs. 2023
Cost of sales increased $12 million during the year ended December 31, 2024 when compared to the same period in 2023, primarily due to increased direct costs from credit card payment processing fees and other revenue-related transaction costs of $7 million in the Viator segment in direct correlation with the increase in revenue, as Viator serves as the merchant of record for the significant majority of its experience booking transactions, and to a lesser extent, increased direct revenue generation costs related to media production costs in the Brand Tripadvisor segment, as well as other costs to support revenue growth in TheFork segment. These increased costs were partially offset by a decrease in non-income related taxes of $4 million in our Viator segment.
2023 vs. 2022
Cost of sales increased $41 million during the year ended December 31, 2023 when compared to the same period in 2022, primarily due to increased direct costs from credit card payment processing fees and other revenue-related transaction costs of $20 million in the Viator segment in direct correlation with the increase in revenue, and to a lesser extent, increased direct revenue generation costs related to media production costs in the Brand Tripadvisor segment and incremental digital service taxes of $9 million, primarily in the Viator segment, for the year ended December 31, 2023.
Marketing
Marketing expenses consist of direct costs, including traffic generation costs from paid online traffic acquisition costs (including SEM and other online traffic acquisition costs), syndication costs and affiliate marketing commissions, social media costs, brand advertising (including connected television, traditional television and other offline advertising), promotions and public relations.
| | | | | | | | | | | | | | | | | | | | |
| | Year ended December 31, | | | % Change | |
| | 2024 | | | 2023 | | | 2022 | | | 2024 vs. 2023 | | | 2023 vs. 2022 | |
| | (in millions) | | | | | | | |
Marketing - Brand Tripadvisor | | $ | 251 | | | $ | 279 | | | $ | 260 | | | | (10 | %) | | | 7 | % |
Marketing - Viator | | | 562 | | | | 519 | | | | 351 | | | | 8 | % | | | 48 | % |
Marketing - TheFork | | | 51 | | | | 41 | | | | 58 | | | | 24 | % | | | (29 | %) |
Intersegment (intercompany) marketing expenses | | | (135 | ) | | | (134 | ) | | | (93 | ) | | | 1 | % | | | 44 | % |
Total Marketing | | $ | 729 | | | $ | 705 | | | $ | 576 | | | | 3 | % | | | 22 | % |
% of revenue | | | 39.7 | % | | | 39.4 | % | | | 38.6 | % | | | | | | |
2024 vs. 2023
Marketing costs increased $24 million during the year ended December 31, 2024 when compared to the same period in 2023, primarily driven by an increase in overall marketing costs in the Viator and TheFork segments of $53 million, in order to capture consumer demand, including increased investment within the Viator segment focused on growing market share, acquiring new customers, and driving brand awareness, partially offset by a decrease in overall marketing costs in the Brand Tripadvisor segment of $28 million.
2023 vs. 2022
Marketing costs increased $129 million during the year ended December 31, 2023 when compared to the same period in 2022. This incremental expense was primarily driven by an increase of $147 million in overall marketing costs, the substantial majority of which was incurred within the Viator segment of $128 million, net of intersegment (intercompany) marketing expenses of $40 million, and to a lesser extent, the Brand Tripadvisor segment of $19 million, in order to capture consumer demand, including increased investment within these segments in order to grow market share, slightly offset by a decrease in overall marketing costs in TheFork segment of $17 million.
Personnel
Personnel expenses consist primarily of salaries, payroll taxes, bonuses, employee health and other benefits, and stock-based compensation. In addition, personnel expenses include costs associated with contingent staff, bonuses and commissions for sales, sales support, customer support and marketing employees.
| | | | | | | | | | | | | | | | | | | | |
| | Year ended December 31, | | | % Change | |
| | 2024 | | | 2023 | | | 2022 | | | 2024 vs. 2023 | | | 2023 vs. 2022 | |
| | (in millions) | | | | | | | |
Personnel (exclusive of stock-based compensation) | | $ | 475 | | | $ | 474 | | | $ | 415 | | | | 0 | % | | | 14 | % |
Stock-based compensation | | | 120 | | | | 96 | | | | 88 | | | | 25 | % | | | 9 | % |
Total Personnel | | $ | 595 | | | $ | 570 | | | $ | 503 | | | | 4 | % | | | 13 | % |
% of revenue | | | 32.4 | % | | | 31.9 | % | | | 33.7 | % | | | | | | |
2024 vs. 2023
Personnel costs increased $1 million during the year ended December 31, 2024 when compared to the same period in 2023, primarily driven by costs to support business growth in the Viator segment, partially offset by a reduction in headcount related to our cost-reduction measures taken during 2023 in the Brand Tripadvisor and TheFork segments. Stock-based compensation increased $24 million during the year ended December 31, 2024 when compared to the same period in 2023, primarily due to a modification during the first quarter of 2020 related to the Company wide annual grant which reduced the original grant-date vesting period from four years to two years.
2023 vs. 2022
Personnel costs increased $59 million during the year ended December 31, 2023 when compared to the same period in 2022, primarily due to additional headcount and contingent staff to support business growth, primarily in the Brand Tripadvisor and Viator segments. The impact of our cost reduction measures in July 2023, did not materially impact our personnel costs during 2023. Stock-based compensation increased $8 million during the year ended December 31, 2023 when compared to the same period in 2022, primarily due to an increase in stock-based compensation granted to support business growth during 2023.
Technology
Technology expenses consist primarily of licensing, data center costs including cloud-based solutions, maintenance, computer supplies, telecom, and content translation and localization costs.
| | | | | | | | | | | | | | | | | | | | |
| | Year ended December 31, | | | % Change | |
| | 2024 | | | 2023 | | | 2022 | | | 2024 vs. 2023 | | | 2023 vs. 2022 | |
| | (in millions) | | | | | | | |
Technology | | $ | 91 | | | $ | 80 | | | $ | 63 | | | | 14 | % | | | 27 | % |
% of revenue | | | 5.0 | % | | | 4.5 | % | | | 4.2 | % | | | | | | |
2024 vs. 2023
Technology costs increased $11 million during the year ended December 31, 2024 when compared to the same period in 2023, primarily due to increased licensing costs in the Viator segment, and to a lesser extent, increased data center costs in the Brand Tripadvisor segment.
2023 vs. 2022
Technology costs increased $17 million during the year ended December 31, 2023 when compared to the same period in 2022, primarily due to increased licensing costs, and to a lesser extent, increased data center costs in both the Brand Tripadvisor and Viator segments.
General and Administrative
General and administrative expenses consist primarily of professional service fees and other fees including audit, legal, tax and accounting, and other operating costs including real estate and office expenses, and non-compensation related personnel expenses such as travel, relocation, recruiting, and training expenses.
| | | | | | | | | | | | | | | | | | | | |
| | Year ended December 31, | | | % Change | |
| | 2024 | | | 2023 | | | 2022 | | | 2024 vs. 2023 | | | 2023 vs. 2022 | |
| | (in millions) | | | | | | | |
General and administrative | | $ | 91 | | | $ | 79 | | | $ | 74 | | | | 15 | % | | | 7 | % |
% of revenue | | | 5.0 | % | | | 4.4 | % | | | 5.0 | % | | | | | | |
2024 vs. 2023
General and administrative costs increased $12 million during the year ended December 31, 2024 when compared to the same period in 2023, primarily due to an estimated accrual for the potential settlement of a regulatory related matter of $10 million during 2024 in the Brand Tripadvisor segment.
2023 vs. 2022
General and administrative costs increased $5 million during the year ended December 31, 2023 when compared to the same period in 2022, primarily due to non-income tax related government assistance benefits related to COVID-19 relief of $11 million received by the Company during 2022 in TheFork segment, which did not reoccur in 2023, as well as, and to a lesser extent, a non-recurring cost of $3 million related to transaction costs during 2023. These increases were partially offset by an approximate $8 million loss incurred during the fourth quarter of 2022 as the result of a fraud scheme resulting in payments to an external party in the Brand Tripadvisor segment, as previously disclosed, which did not reoccur in 2023.
Depreciation and amortization
Depreciation expense consists of depreciation on computer equipment, leasehold improvements, furniture, office equipment and other assets, and amortization of capitalized website development costs and right-of-use (“ROU”) assets related to our finance lease. Amortization consists of the amortization of definite-lived intangibles purchased in business acquisitions.
| | | | | | | | | | | | |
| | Year ended December 31, | |
| | 2024 | | | 2023 | | | 2022 | |
| | (in millions) | |
Depreciation | | $ | 79 | | | $ | 78 | | | $ | 84 | |
Amortization of intangible assets | | | 6 | | | | 9 | | | | 13 | |
Total depreciation and amortization | | $ | 85 | | | $ | 87 | | | $ | 97 | |
% of revenue | | | 4.6 | % | | | 4.9 | % | | | 6.5 | % |
Depreciation and amortization decreased $2 million during the year ended December 31, 2024 when compared to the same period in 2023, primarily due to the completion of amortization related to intangible assets purchased in business acquisitions from previous years.
Restructuring and other related reorganization costs
Restructuring and other related reorganization costs consist primarily of employee severance and related benefits and other related reorganization costs.
| | | | | | | | | | | | |
| | Year ended December 31, | |
| | 2024 | | | 2023 | | | 2022 | |
| | (in millions) | |
Restructuring and other related reorganization costs | | $ | 21 | | | $ | 22 | | | $ | — | |
% of revenue | | | 1.1 | % | | | 1.2 | % | | | 0.0 | % |
The Company incurred pre-tax restructuring and other related reorganization costs of $21 million during the year ended December 31, 2024, as discussed above. Refer to “Note 7: Accrued Expenses and Other Current Liabilities” in the notes to our consolidated financial statements in Item 8 of this Annual Report on Form 10-K for more information regarding restructuring and other related reorganization costs.
Interest Expense
Interest expense primarily consists of interest incurred, commitment fees, and debt issuance cost amortization related to the Credit Facility, the Term Loan B Facility, the 2025 Senior Notes, the 2026 Senior Notes, as well as imputed interest on finance leases.
| | | | | | | | | | | | |
| | Year ended December 31, | |
| | 2024 | | | 2023 | | | 2022 | |
| | (in millions) | |
Interest expense | | $ | (46 | ) | | $ | (44 | ) | | $ | (44 | ) |
Interest expense increased $2 million during the year ended December 31, 2024 when compared to the same period in 2023, primarily due to the issuance of our Term Loan B Facility in July 2024, which increased our cost of capital. The significant majority of interest expense incurred during the year ended December 31, 2024 was primarily related to the Term Loan B Facility and 2026 Senior Notes. Refer to “Note 8: Debt” in the notes to our consolidated financial statements in Item 8 of this Annual Report on Form 10-K for further information.
Interest Income
Interest income primarily consists of interest earned from available on demand bank deposits, term deposits, money market funds, and marketable securities, including amortization of discounts and premiums on our marketable securities.
| | | | | | | | | | | | |
| | Year ended December 31, | |
| | 2024 | | | 2023 | | | 2022 | |
| | (in millions) | |
Interest income | | $ | 48 | | | $ | 47 | | | $ | 15 | |
Interest income increased $1 million during the year ended December 31, 2024 when compared to the same period in 2023, primarily due to an increase in the average amount of cash invested.
Other Income (Expense), Net
Other income (expense), net generally consists of net foreign exchange gains and losses, forward contract gains and losses, earnings/(losses) from equity method investments, gain/(loss) and impairments on non-marketable investments, gain/(loss) on sale/disposal of businesses, and other assets, gain/(loss) on extinguishment of debt, and other non-operating income (expenses).
| | | | | | | | | | | | |
| | Year ended December 31, | |
| | 2024 | | | 2023 | | | 2022 | |
| | (in millions) | |
Other income (expense), net | | $ | (7 | ) | | $ | (4 | ) | | $ | (5 | ) |
Other expense, net increased $3 million during the year ended December 31, 2024 when compared to the same period in 2023, primarily due to a loss on disposal of certain assets and aforementioned loss on extinguishment of debt of $2 million, partially offset by net foreign exchange gains incurred as a result of foreign currency movements. Refer to “Note 16: Other Income (Expense), Net” in the notes to our consolidated financial statements in Item 8 of this Annual Report on Form 10-K for additional information.
(Provision) Benefit for Income Taxes
| | | | | | | | | | | | |
| | Year ended December 31, | |
| | 2024 | | | 2023 | | | 2022 | |
| | (in millions) | |
(Provision) benefit for income taxes | | $ | (82 | ) | | $ | (115 | ) | | $ | (47 | ) |
Effective tax rate | | | 94.3 | % | | | 92.0 | % | | | 70.1 | % |
Our effective tax rate differed from the U.S. federal statutory rate of 21% during the year ended December 31, 2024, primarily related to an IRS audit settlement reached during the first quarter of 2024.
We recorded a total income tax provision of $82 million for the year ended December 31, 2024. The change in our income taxes and our effective tax rate during the year ended December 31, 2024, when compared to the same period in 2023, was primarily the result of an IRS audit settlement, which we recorded an income tax expense of $42 million, inclusive of interest, primarily during the first quarter of 2024, related to this settlement on our consolidated statement of operations. In addition, we reviewed the impact of the acceptance of this settlement position against our existing transfer pricing income tax reserves for the subsequent open tax years during the first quarter of 2024, which resulted in an income tax benefit, inclusive of estimated interest, of $4 million. During the year ended December 31, 2023, we recorded a net income tax expense of $55 million related to another IRS audit settlement and related adjustment to existing transfer pricing income tax reserves for subsequent tax years. Refer to “Note 10: Income Taxes” in the notes to our consolidated financial statements in Item 8 of this Annual Report on Form 10-K for further information.
Net income (loss)
| | | | | | | | | | | | |
| | Year ended December 31, | |
| | 2024 | | | 2023 | | | 2022 | |
| | (in millions) | |
Net income (loss) | | $ | 5 | | | $ | 10 | | | $ | 20 | |
Net income (loss) margin | | | 0.3 | % | | | 0.6 | % | | | 1.3 | % |
Net income decreased $5 million during the year ended December 31, 2024 when compared to the same period in 2023. The decrease in net income was largely driven by a decrease in revenue and adjusted EBITDA in the Brand Tripadvisor segment and partially offset by an increase in revenue and adjusted EBITDA in the Viator and TheFork segments. In addition, an increase in stock-based compensation expense and an estimated accrual for the potential settlement of a regulatory related matter of $10 million during the first quarter of 2024, contributed to the decrease in net income during the year ended December 31, 2024. These cost increases were largely offset by increased revenue, as described in more detail above under “Revenue and Segment Information”, and a decrease in income tax expense of $33 million, as described in more detail above under “(Provision) Benefit for Income Taxes”.
All drivers discussed above are described in more detail above under “Revenue and Segment Information” and “Consolidated Expenses.”
Adjusted EBITDA
To provide investors with additional information regarding our financial results, we also disclose consolidated Adjusted EBITDA, which is a non-GAAP financial measure. A “non-GAAP financial measure” refers to a numerical measure of a company’s historical or future financial performance, financial position, or cash flows that excludes (or includes) amounts that are included in (or excluded from) the most directly comparable measure calculated and presented in accordance with GAAP in such company’s financial statements.
Adjusted EBITDA is also our reported measure of segment profit and a key measure used by our CODM, management and Board of Directors to understand and evaluate the operating performance of our business as a whole and our individual operating segments, and on which internal budgets and forecasts are based and approved. In particular, the exclusion of certain expenses in calculating Adjusted EBITDA can provide a useful measure for period-to-period comparisons and better enables management and investors to compare financial results between periods as these costs may vary independent of ongoing core business performance. Accordingly, we believe that Adjusted EBITDA provides useful information to investors and others in understanding and evaluating our operating results in the same manner as our CODM, management and Board of Directors. We define Adjusted EBITDA as net income (loss) plus: (1) provision (benefit) for income taxes; (2) other expense (income), net; (3) depreciation and amortization; (4) stock-based compensation; (5) goodwill, long-lived asset, and intangible assets impairments; (6) legal reserves, settlements and other (including indirect tax reserves related to audit settlements and the impact of one-time changes resulting from enacted indirect tax legislation); (7) restructuring and other related reorganization costs; (8) transaction related expenses; and (9) non-recurring expenses and income unusual in nature or infrequently occurring.
Our use of Adjusted EBITDA has limitations as an analytical tool, and you should not consider it in isolation or as a substitute for analysis of our results reported in accordance with GAAP. Because of these limitations, you should consider Adjusted EBITDA alongside other financial performance measures, including net income (loss) and our other GAAP results.
Some of these limitations are:
•Adjusted EBITDA does not reflect our cash expenditures or future requirements for capital expenditures or contractual commitments;
•Adjusted EBITDA does not reflect changes in, or cash requirements for, our working capital needs;
•Adjusted EBITDA does not reflect the interest expense, or cash requirements necessary to service interest or principal payments on our debt;
•Adjusted EBITDA does not consider the potentially dilutive impact of stock-based compensation;
•although depreciation and amortization are non-cash charges, the assets being depreciated and amortized may have to be replaced in the future, and Adjusted EBITDA does not reflect cash capital expenditure requirements for such replacements or for new capital expenditure requirements;
•Adjusted EBITDA does not reflect certain income and expenses not directly tied to the ongoing core operations of our business, such as legal reserves, settlements and other, restructuring and other related reorganization costs, and transaction related expenses;
•Adjusted EBITDA does not reflect tax payments that may represent a reduction in cash available to us;
•Adjusted EBITDA is unaudited and does not conform to SEC Regulation S-X, and as a result such information may be presented differently in our future filings with the SEC; and
•other companies, including companies in our own industry, may calculate Adjusted EBITDA differently than we do, limiting its usefulness as a comparative measure.
The following table presents a reconciliation of Adjusted EBITDA to Net Income (Loss), the most directly comparable financial measure calculated and presented in accordance with GAAP, for the periods presented:
| | | | | | | | | | | | |
| | Year ended December 31, | |
| | 2024 | | | 2023 | | | 2022 | |
| | (in millions) | |
Net income (loss) | | $ | 5 | | | $ | 10 | | | $ | 20 | |
Add: Provision (benefit) for income taxes | | | 82 | | | | 115 | | | | 47 | |
Add: Other expense (income), net | | | 5 | | | | 1 | | | | 34 | |
Add: Restructuring and other related reorganization costs | | | 21 | | | | 22 | | | | — | |
Add: Legal reserves, settlements and other (1) | | | 18 | | | | — | | | | 1 | |
Add: Transaction related expenses (2) | | | 3 | | | | 3 | | | | — | |
Add: Other non-recurring expenses (income) (3) | | | — | | | | — | | | | 8 | |
Add: Stock-based compensation | | | 120 | | | | 96 | | | | 88 | |
Add: Depreciation and amortization | | | 85 | | | | 87 | | | | 97 | |
Adjusted EBITDA | | $ | 339 | | | $ | 334 | | | $ | 295 | |
(1)This amount primarily includes an estimated accrual for the potential settlement of a regulatory related matter of $10 million, expensed during 2024. Refer to "Note 11: Commitments and Contingencies" for further information. This cost is reflected in general and administrative expenses on our consolidated statement of operations. In addition, this amount includes a one-time charge of $3 million during the year ended December 31, 2024, resulting from enacted tax legislation in Canada during June 2024 related to digital service taxes, which requires retrospective application back to January 1, 2022. This amount represents the one-time retrospective liability for the periods prior to April 1, 2024, while all prospective periods are and will be included within adjusted EBITDA, respectively. This cost is reflected in cost of sales on our consolidated statement of operations.
(2)The Company expensed certain transaction related costs of $3 million during both the years ended December 31, 2024 and 2023, to general and administrative expenses on our consolidated statements of operations.
(3)The Company incurred a loss of approximately $8 million during the fourth quarter of 2022, as the result of external fraud. This loss was recorded to general and administrative expenses on the consolidated statement of operations during 2022. The Company considers such costs to be non-recurring in nature.
Liquidity and Capital Resources
Our principal source of liquidity is cash flow generated from operations and our existing cash and cash equivalents balance. Our liquidity needs can also be met through drawdowns under the Credit Facility. As of both December 31, 2024 and 2023, we had approximately $1.1 billion of cash and cash equivalents, and $497 million of available borrowing capacity under our Credit Facility as of December 31, 2024. As of December 31, 2024, approximately $227 million of our cash and cash equivalents were held by our international subsidiaries outside of the U.S., of which approximately 44% was held in the U.K. As of December 31, 2024, the significant majority of our cash was denominated in U.S. dollars.
As of December 31, 2024, we had $582 million of cumulative undistributed earnings in foreign subsidiaries which were no longer considered to be indefinitely reinvested. As of December 31, 2024, we maintained a deferred income tax liability on our consolidated balance sheet, which was not material, for the U.S. federal and state income tax and foreign withholding tax liabilities on the cumulative undistributed foreign earnings that we no longer consider indefinitely reinvested. Refer to “Note 10: Income Taxes” in the notes to our consolidated financial statements in Item 8 of this Annual Report on Form 10-K for further information.
As of December 31, 2024, we are party to a credit agreement (“Amended Credit Agreement”), which, among other things, provides for a $500 million revolving credit facility (“Credit Facility”) with a maturity date of June 29, 2028 (unless, on any date that is 91 days prior to the final scheduled maturity date in respect of any indebtedness outstanding under certain “specified debt,” the aggregate outstanding principal amount of such specified debt is $200 million or more, then the maturity date will be such business day). As of December 31, 2024 and 2023, we had no outstanding borrowings under the Credit Facility. The Company may borrow from the Credit Facility in U.S. dollars, Euros and Sterling. For information regarding interest rates on potential borrowings under the Credit Facility refer to “Note 8: Debt” in the notes to our consolidated financial statements in Item 8 of this Annual Report on Form 10-K. We are required to pay a quarterly commitment fee, at an applicable rate ranging from 0.25% to 0.40%, on the
daily unused portion of the Credit Facility for each fiscal quarter and in connection with the issuance of letters of credit. As of December 31, 2024, our unused revolver capacity was subject to a commitment fee of 0.25%, given the Company’s total net leverage ratio. The Credit Facility, among other things, requires us to maintain a maximum total net leverage ratio and contains certain customary affirmative and negative covenants and events of default, including for a change of control. As of December 31, 2024 and 2023, we were in compliance with our covenant requirements in effect under the Credit Facility. While there can be no assurance that we will be able to meet the total net leverage ratio covenant in the future, based on our current projections, we do not believe there is a material risk that we will not remain in compliance throughout the next twelve months.
As of December 31, 2024, the Company had an aggregate outstanding principal amount of $5 million and $831 million in short-term and long-term debt, respectively, on our consolidated balance sheet pertaining to the 2026 Senior Notes and Term Loan B Facility, both of which are discussed below.
In March 2021, the Company completed the sale of $345 million of the 2026 Senior Notes. The 2026 Senior Notes provide, among other things, that interest at a rate of 0.25% per annum, is payable on April 1 and October 1 of each year, until their maturity on April 1, 2026. The 2026 Senior Notes are senior unsecured obligations of the Company, although unconditionally guaranteed on a joint and several basis, by certain of the Company’s domestic subsidiaries.
On July 8, 2024, under the Amended Credit Agreement, the Company issued a $500 million Term Loan B Facility maturing July 8, 2031, with an interest rate based on secured overnight financing rate (“SOFR”) plus 2.75%, payable monthly. On July 15, 2024, the Company used these funds to fully redeem its outstanding $500 million, 2025 Senior Notes. The Term Loan B Facility was offered at 99.75% of par and is required to be paid down at 1.00% of the aggregate principal amount per year, repayable in quarterly installments on the last day of each calendar quarter, commencing December 31, 2024, equal to 0.25% of the original principal amount with the balance due on the maturity date. Principal payments of $1 million were made during the year ended December 31, 2024.
The 2026 Senior Notes are not registered securities and there are currently no plans to register these notes as securities in the future. We may from time to time repurchase the 2026 Senior Notes and Term Loan B Facility through tender offers, open market purchases, privately negotiated transactions or otherwise. Such repurchases, if any, will depend on prevailing market conditions, liquidity requirements, contractual restrictions and other factors. For further information on the Amended Credit Agreement, the Credit Facility, the Term Loan B Facility, 2025 Senior Notes and 2026 Senior Notes, refer to “Note 8: Debt” in the notes to our consolidated financial statements in Item 8 of this Annual Report on Form 10-K.
Significant uses of capital and other liquidity matters
On November 1, 2019, our Board of Directors authorized the repurchase of an additional $100 million in shares of our common stock under our existing share repurchase program, which increased the amount available to the Company under this share repurchase program to $250 million. During the three months ended June 30, 2023, we repurchased 4,724,729 shares of our outstanding common stock at an average price of $15.85 per share, exclusive of fees, commissions, and excise taxes, or $75 million in the aggregate, which completed this share repurchase program.
On September 7, 2023, our Board of Directors authorized the repurchase of $250 million in shares of our common stock under a new share repurchase program. This share repurchase program, which has a term of two years, does not obligate the Company to acquire any particular number of shares and may be modified, suspended or discontinued at any time. During the year ended December 31, 2023, we repurchased 1,324,524 shares of our outstanding common stock at an average price of $18.85 per share, exclusive of fees, commissions, and excise taxes, or $25 million, under our share repurchase program. During the year ended December 31, 2024, the Company repurchased 1,366,385 shares of its common stock at an average price of $18.28 per share, exclusive of fees, commissions, and excise taxes, or $25 million in the aggregate. As of December 31, 2024, there was $200 million remaining available to repurchase shares of its common stock under this share repurchase program.
Our business typically experiences seasonal fluctuations that affect the timing of our annual cash flows during the year related to working capital. As a result of our experience bookings, we generally receive cash from travelers
at the time of booking or prior to the occurrence of an experience, and we record these amounts, net of commissions, on our consolidated balance sheet as deferred merchant payables. We pay the experience operator, or the supplier, after the travelers’ use. Therefore, we generally receive cash from the traveler prior to paying the experience operator and this operating cycle represents a source or use of cash to us. During the first half of the year, experiences bookings typically exceed completed experiences, resulting in higher cash flow related to working capital, while during the second half of the year, particularly in the third quarter, this pattern reverses and cash flows from these transactions are typically negative. Other factors may also impact typical seasonal fluctuations, such as significant shifts in our business mix, adverse economic conditions, public health-related events, as well as other factors that could result in future seasonal patterns that are different from historical trends. In addition, new or different payment options offered to our customers could impact the timing of cash flows, such as our “Reserve Now, Pay Later” payment option, which allows travelers the option to reserve certain experiences and defer payment until a date no later than two days before the experience date. Usage of this payment option may continue to increase, though it is still not used in a majority of bookings to date, and affect the timing of our future cash flows and working capital.
As discussed in “Note 10: Income Taxes” in the notes to our consolidated financial statements in Item 8 of this Annual Report on Form 10-K, we received a final notice regarding a MAP resolution agreement for the 2014 through 2016 tax years in January 2024, which we subsequently accepted in February 2024. In connection with this IRS audit settlement: (i) during the second quarter of 2024, we made a payment to the IRS of $141 million, inclusive of estimated interest, (ii) during the second half of 2024, we made various state tax payments totaling $26 million, inclusive of estimated interest, related to this audit settlement; and (iii) during the fourth quarter of 2024, we received a competent authority refund of $42 million, inclusive of net interest income, from a foreign jurisdiction. This audit settlement resulted in total net operating cash outflow during 2024 of $105 million, which includes federal tax benefits from these payments of $20 million.
Additionally, as discussed in “Note 10: Income Taxes” in the notes to our consolidated financial statements in Item 8 of this Annual Report on Form 10-K, we received a final notice regarding a MAP settlement for the 2009 through 2011 tax years in January 2023, which the Company subsequently accepted in February 2023. During the three months ended June 30, 2023, we made a U.S. federal tax payment of $113 million, inclusive of interest, to Expedia related to this IRS audit settlement, pursuant to the Tax Sharing Agreement with Expedia. During the three months ended September 30, 2023, we received a competent authority refund of $49 million, inclusive of interest income, related to this IRS audit settlement.
In addition, in January 2021, we received an issue closure notice from HM Revenue & Customs (“HMRC”) in the U.K. relating to adjustments for the 2012 through 2016 tax years. These proposed adjustments are related to certain transfer pricing arrangements with our foreign subsidiaries and would result in an increase to income tax expense in an estimated range of $25 million to $35 million, exclusive of interest expense, at the close of the audit if HMRC prevails. We are also currently subject to audit by HMRC in tax years 2017 through 2022. If HMRC were to seek adjustments of a similar nature through a closure notice for transactions in these years, we could be subject to significant additional tax liabilities. Although the ultimate timing for resolution of this matter is uncertain, any future payments required would negatively impact our operating cash flows.
On December 18, 2024, as noted above, the Company and LTRIP entered into the Merger Agreement. This transaction is expected to close in the second quarter of 2025. The expected aggregate transaction value to be paid by the Company is approximately $435 million (which includes approximately $392 million of cash consideration and 3,037,959 validly issued, fully paid and non-assessable shares of the Company's common stock based on 10-day VWAP of $13.98 at December 17, 2024). Refer to “Note 1: Organization and Business Description” in the notes to our consolidated financial statements in Item 8 of this Annual Report on Form 10-K for further information.
We believe that our available cash and cash equivalents will be sufficient to fund our foreseeable working capital requirements, capital expenditures, existing business growth initiatives, debt and interest obligations, lease commitments, obligations under the Merger Agreement, and other financial commitments through at least the next twelve months. Our future capital requirements may also include capital needs for acquisitions and/or other expenditures in support of our business strategy, which may potentially reduce our cash balance and/or require us to borrow under the Credit Facility or to seek other financing alternatives.
Our cash flows from operating, investing and financing activities, as reflected in our consolidated statements of cash flows, are summarized in the following table:
| | | | | | | | | | | | |
| | Year ended December 31, | |
| | 2024 | | | 2023 | | | 2022 | |
| | (in millions) | |
Net cash provided by (used in): | | | | | | | | | |
Operating activities | | $ | 144 | | | $ | 235 | | | $ | 400 | |
Investing activities | | | (73 | ) | | | (63 | ) | | | (52 | ) |
Financing activities | | | (63 | ) | | | (127 | ) | | | (27 | ) |
During the year ended December 31, 2024, our primary source of cash was from operations, while our primary use of cash was from financing activities (including repurchases of our outstanding common stock at an aggregate cost of $25 million under our existing share repurchase program, payment of withholding taxes on net share settlements of our equity awards of $21 million, and financing costs related to the issuance of our Term Loan B Facility of $7 million) and investing activities (including capital expenditures of $74 million incurred during the year ended December 31, 2024). This use of cash was funded with cash and cash equivalents and operating cash flows during the period.
Net cash provided by operating activities for the year ended December 31, 2024, decreased by $91 million when compared to the same period in 2023, primarily due to a decrease in working capital of $121 million, and to a lesser extent, a decrease in net income of $5 million, partially offset by an increase in non-cash items of $35 million, primarily due to an increase in stock-based compensation expense. The decrease in working capital was partially driven by an increase in income tax payments of $30 million, net of refunds, largely impacted by the IRS audit settlements, discussed above, combined with a decrease of $33 million in our income tax provision during 2024, when compared to the same period in 2023. Also contributing to the decrease in working capital was a decrease in deferred merchant payables, reflecting the timing of when cash is received from travelers and then remitted to experiences operators. In addition, changes in working capital related to accounts receivable and accounts payable were primarily due to the timing of customer payments and vendor payments, respectively, which contributed to the fluctuation in working capital.
Net cash used in investing activities for the year ended December 31, 2024 increased by $10 million when compared to the same period in 2023, due to an increase in capital expenditures across the business.
Net cash used in financing activities for the year ended December 31, 2024 decreased by $64 million when compared to the same period in 2023, primarily due to a decrease in net cash used to purchase shares of our common stock under share repurchase programs of $75 million, partially offset by financing costs related to the issuance of our Term Loan B Facility of $7 million during 2024.
The following table summarizes our current and long-term material cash requirements, both accrued and off-balance sheet, as of December 31, 2024:
| | | | | | | | | | | | | | | | | | | | |
| | | | | By Period | |
| | Total | | | Less than
1 year | | | 1 to 3 years | | | 3 to 5 years | | | More than
5 years | |
| | (in millions) | |
Term Loan B Facility (1) | | $ | 499 | | | $ | 5 | | | $ | 10 | | | $ | 10 | | | $ | 474 | |
Expected interest payments on Term Loan B Facility (2) | | | 219 | | | | 35 | | | | 68 | | | | 67 | | | | 49 | |
2026 Senior Notes (3) | | | 345 | | | | — | | | | 345 | | | | — | | | | — | |
Expected interest payments on 2026 Senior Notes (4) | | | 1 | | | | 1 | | | | — | | | | — | | | | — | |
Finance lease obligations (5) | | | 57 | | | | 10 | | | | 20 | | | | 18 | | | | 9 | |
Operating lease obligations (6) | | | 20 | | | | 7 | | | | 6 | | | | 3 | | | | 4 | |
Expected commitment fee payments on Credit Facility (7) | | | 4 | | | | 1 | | | | 2 | | | | 1 | | | | — | |
Purchase obligations and other (8) | | | 106 | | | | 35 | | | | 54 | | | | 17 | | | | — | |
Total (9)(10)(11) | | $ | 1,251 | | | $ | 94 | | | $ | 505 | | | $ | 116 | | | $ | 536 | |
(1)Represents outstanding principal on our Term Loan B Facility due July 2031 and assumes that existing debt is repaid at maturity.
(2)Expected interest payments on our Term Loan B Facility are based on the effective interest rate as of December 31, 2024, however, this effective interest rate is variable and could change significantly in the future. Amount assumes that our existing debt is repaid at maturity.
(3)Represents outstanding principal on our 2026 Senior Notes due April 2026 and assumes that existing debt is repaid at maturity.
(4)Expected interest payments on our 2026 Senior Notes are based on a fixed interest rate of 0.25% as of December 31, 2024, and assumes that existing debt is repaid at maturity.
(5)Estimated future lease payments for our corporate headquarters in Needham, Massachusetts. These amounts exclude expected rental income under non-cancelable subleases.
(6)Estimated future lease payments for our operating leases, primarily for office space, with non-cancelable lease terms. These amounts exclude expected rental income under non-cancelable subleases.
(7)Expected commitment fee payments are based on the daily unused portion of the Credit Facility, issued letters of credit, and the effective commitment fee rate as of December 31, 2024; however, these variables could change significantly in the future.
(8)Estimated purchase obligations that are fixed and determinable, primarily related to telecommunication and licensing contracts, with various expiration dates through June 2029. These contracts have non-cancelable terms or are cancelable only upon payment of significant penalty. Timing of payments and actual amounts paid may be different depending on the time of receipt of goods or services or changes to agreed-upon amounts for some obligations.
(9)Excluded from the table is $78 million of unrecognized tax benefits, including interest, which is included in other long-term liabilities on our consolidated balance sheet as of December 31, 2024, for which we cannot make a reasonably reliable estimate of the amount and period of payment.
(10)Excluded from the table is $3 million of undrawn standby letters of credit, primarily as security deposits for certain property leases as of December 31, 2024.
(11)Excluded from the table is the TRIP Loan Facility of approximately $330 million, related to the Merger with LTRIP anticipated to be completed during the second quarter of 2025. Refer to “Note 1: Organization and Business Description” in the notes to our consolidated financial statements in Item 8 of this Annual Report on Form 10-K for additional information on the Merger.
As of December 31, 2024, other than the items discussed above, we did not have any off-balance sheet arrangements, that have, or are reasonably likely to have, a current or future effect on our financial condition, results of operations, liquidity, capital expenditures or capital resources.
Office Lease Commitments
As of December 31, 2024, we leased approximately 280,000 square feet of office space for our corporate headquarters in Needham, Massachusetts, which has an expiration date of December 2030 and an option to extend the lease term for two consecutive terms of five years each. We account for this lease as a finance lease as of December 31, 2024.
In addition to our corporate headquarters lease, we have contractual obligations in the form of operating leases for office space, in which we lease an aggregate of approximately 165,000 square feet, at nearly 25 other locations across North America, Europe and Asia Pacific, in cities such as New York, London, Singapore, Barcelona and
Paris, primarily used for sales offices, subsidiary headquarters, and international management teams, pursuant to leases with various expiration dates, with the latest expiring in March 2034.
Contingencies
In the ordinary course of business, we are party to legal, regulatory and administrative matters, including threats thereof, arising out of or in connection with our operations. These matters may involve claims involving patent and other intellectual property rights (including privacy, alleged infringement of third-party intellectual property rights), tax matters (including value-added, excise, transient occupancy and accommodation taxes), regulatory compliance (including competition, consumer matters and data privacy), contractual disputes (including breach of a covenant or disagreements as to interpretation), defamation and reputational claims. Periodically, we review the status of all significant outstanding matters to assess any potential financial exposure. When (i) it is probable that an asset has been impaired or a liability has been incurred; and (ii) the amount of the loss can be reasonably estimated and is material, we record the estimated loss in our consolidated statements of operations. We provide disclosures in the notes to the consolidated financial statements for loss contingencies that do not meet both of these conditions if there is a reasonable possibility that a loss may have been incurred that would be material to the consolidated financial statements. We base accruals on the best information available at the time which can be highly subjective. Although occasional adverse decisions or settlements may occur, we do not believe that the final disposition of any of these matters will have a material adverse effect on our business, except for certain known income tax matters discussed below. However, the final outcome of these matters could vary significantly from our estimates. Finally, there may be claims or actions pending or threatened against us of which we are currently not aware and the ultimate disposition of which could have a material adverse effect on us.
We are under audit by the IRS and various other domestic and foreign tax authorities with regards to income tax and non-income tax matters. We have reserved for potential adjustments to our provision for income taxes that may result from examinations by, or any negotiated agreements with, these tax authorities. Although we believe our tax estimates are reasonable, the final determination of audits could be materially different from our historical income tax provisions and accruals. The results of an audit could have a material effect on our financial position, results of operations, or cash flows in the period for which that determination is made.
Refer to “Note 10: Income Taxes” and “Note 11: Commitments and Contingencies” in the notes to our consolidated financial statements in Item 8 of this Annual Report on Form 10-K for further information on other potential contingencies, including ongoing audits by the IRS and various other domestic and foreign tax authorities, and other tax and legal matters.
Over recent years, the Organization for Economic Cooperation and Development (OECD) through its “Inclusive Framework” has been working on a “two-pillar” global tax consensus project that, if implemented, would result in certain changes to the current global tax regulatory framework. The OECD’s “Pillar One” initiative proposes to reallocate certain profits from the largest and most profitable multinational businesses to countries where the customers of those businesses are located, and the “Pillar Two” initiative proposes a global minimum income tax rate on corporations of 15%. In response to these proposals, certain jurisdictions have enacted legislation to implement a global minimum income tax of 15%, which currently has no impact on our financial results, as well as legislation to impose new forms of gross receipts taxes, such as digital services taxes imposed on digital advertising and online marketplace platforms/services.
If consensus is reached on Pillar One, unilateral digital services taxes should be repealed, however until such time we continue to be subject to these taxes. We are currently subject to unilateral digital services taxes, and during the years ended December 31, 2024, 2023 and 2022, we recorded $18 million, $18 million and $9 million, respectively, of digital service taxes to cost of sales on our consolidated statements of operations. While the future of the global tax regulatory landscape remains uncertain, we continue to monitor the OECD’s and members ongoing discussions to determine the current and potential impact on our consolidated financial statements.
Due to the one-time transition tax on the deemed repatriation of undistributed foreign subsidiary earnings and profits in 2017, as a result of the 2017 Tax Act, the majority of previously unremitted earnings have been subjected to U.S. federal income tax. To the extent future distributions from these subsidiaries will be taxable, a deferred
income tax liability has been accrued on our consolidated balance sheet, which was not material as of December 31, 2024. As of December 31, 2024, $582 million of our cumulative undistributed foreign earnings were no longer considered to be indefinitely reinvested.
Item 7A. Quantitative and Qualitative Disclosures About Market Risk
Market Risk Management
Market risk refers to the risk of loss arising from adverse changes in stock prices, interest rates and foreign currency exchange rates. We are exposed to market risks primarily due to our international operations, our ongoing investment and financial activities, as well as changes in economic conditions in all significant markets in which we operate. The risk of loss can be assessed from the perspective of adverse changes in our future earnings, cash flows, fair values of our assets, and financial condition. Our exposure to market risk, at any point in time, may include risks related to any borrowings under the Credit Facility, or outstanding debt related to the 2026 Senior Notes and Term Loan B Facility, derivative instruments, capped calls, cash and cash equivalents, short-term and long-term marketable securities, if any, accounts receivable, intercompany receivables/payables, accounts payable, deferred merchant payables and other balances and transactions denominated in foreign currencies. We have established policies, procedures and internal processes governing our management of market risks and the use of financial instruments to manage and attempt to mitigate our exposure to such risks.
Interest Rates
Our primary exposure to changes in interest rates relates primarily to our cash, cash equivalents, investment portfolio at any point in time, 2026 Senior Notes and Term Loan B Facility, and borrowings, if any, under our existing Credit Facility.
Changes in interest rates affect the amount of interest earned on our cash, cash equivalents, and marketable securities, if any, and the fair value of those securities. Our interest income and expense are most sensitive to fluctuations in U.S. interest rates. We generally invest our excess cash in available on demand bank deposits and term deposits at major global financial institutions, money market funds, and marketable securities. Our investment policy and strategy is focused on capital preservation and supporting our liquidity requirements. We invest in highly-rated securities, and our investment policy limits the amount of credit exposure to any one issuer. Our investment policy requires our investments to be investment grade, with the primary objective of minimizing the potential risk of principal loss.
As of December 31, 2024 and 2023, respectively, we had no outstanding marketable securities in our investment portfolio, and no outstanding borrowings under our Credit Facility. In March 2021, we issued 2026 Senior Notes with a principal balance of $345 million at a fixed rate of 0.25% and in July 2024, we entered into the Term Loan B Facility with a principal balance of $500 million at a variable rate equal to SOFR plus 2.75%. Based on our Term Loan B Facility current outstanding balance as of December 31, 2024, a 25 basis-point change in our interest rates on our Term Loan B Facility would result in an increase or decrease to interest expense of approximately $1 million per annum. As of December 31, 2024, we estimated the fair value of our 2026 Senior Notes and Term Loan B Facility were approximately $323 million and $504 million, respectively, based on recently reported market transactions and prices for identical or similar financial instruments obtained from a third-party pricing source. Since our 2026 Senior Notes bear interest at a fixed rate, we are more sensitive to the capital market conditions of our shares than changes in interest rates. The fair value of the 2026 Senior Notes and Term Loan B Facility will likely change based on the capital market conditions.
Refer to “Note 3: Financial Instruments and Fair Value Measurements” and “Note 8: Debt” in the notes to our consolidated financial statements in Item 8 of this Annual Report on Form 10-K for further information on our cash and cash equivalents, investments and other financial instruments, 2026 Senior Notes, Term Loan B Facility and our Credit Facility.
We currently do not hedge our interest rate risk; however, we are continually evaluating the interest rate market, and if we become increasingly exposed to potentially volatile movements in interest rates, and if these
movements are material, this could cause us to adjust our financing strategy. We did not experience material changes in interest rate exposures or any material financial impact from adverse changes in interest rates for the years ended December 31, 2024, 2023 or 2022.
Foreign Currency Exchange Rates
We conduct business in certain international markets, largely in the Europe, including the U.K., and also in countries such as Singapore and Australia. Because we operate in international markets, we have exposure to different economic climates, political arenas, tax systems and regulations that could affect foreign currency exchange rates.
Some of our subsidiaries maintain their accounting records in their respective local currencies other than the U.S. dollar. Consequently, changes in foreign currency exchange rates may impact the translation of those subsidiary’s financial statements into U.S. dollars. As a result, we face exposure to adverse movements in foreign currency exchange rates as the financial results of our non-U.S. dollar operations are translated from local currency, or functional currency, into U.S. dollars upon consolidation. If the U.S. dollar weakens against the functional currency, the translation of these foreign currency denominated balances will result in increased net assets, revenue, operating expenses, operating income and net income upon consolidation. Similarly, our net assets, revenue, operating expenses, operating income and net income will decrease upon consolidation if the U.S. dollar strengthens against the functional currency. The effect of foreign currency exchange on our business historically has varied from quarter to quarter and may continue to do so, potentially materially. In order to provide a meaningful assessment of the foreign currency exchange rate risk associated with our consolidated financial statements, we performed a sensitivity analysis. A hypothetical 10% decrease of the foreign currency exchange rates in our significant international markets relative to the U.S. dollar, or strengthening of the U.S. dollar, would generate an estimated unrealized loss of approximately $35 million related to a decrease in our net assets as of December 31, 2024, which would initially be recorded to accumulated other comprehensive income (loss) on our consolidated balance sheet.
In addition, foreign currency exchange rate fluctuations on transactions denominated in currencies other than the functional currency result in transactional gains and losses. We recognize these transactional gains and losses (primarily Euro and British pound currency transactions) in our consolidated statement of operations and have recorded net foreign currency exchange losses of $3 million, $5 million and $9 million for the years ended December 31, 2024, 2023 and 2022, respectively, in “other income (expense), net” on our consolidated statements of operations. Future transactional gains and losses are inherently difficult to predict as they are reliant on how the multiple currencies in which we transact fluctuate in relation to the U.S. dollar and other functional currencies, and the relative composition and denomination of monetary assets and liabilities each period.
We manage our exposure to foreign currency risk through internally established policies and procedures. To the extent practicable, we minimize our foreign currency exposures by maintaining natural hedges between our current assets and current liabilities in similarly denominated foreign currencies, as well as, using derivative financial instruments. We use foreign currency forward exchange contracts (“forward contracts”) to manage certain short-term foreign currency risk to attempt to reduce the effects of fluctuating foreign currency exchange rates on our cash flows denominated in foreign currencies. We do not use financial instruments for trading purposes and are not a party to any leveraged derivatives. Our objective is to hedge only those foreign currency exposures that can be confidently identified and quantified and that may result in significant impacts to our cash or the consolidated statement of operations. Our policy does not allow speculation in derivative instruments for profit or execution of derivative instrument contracts for which there are no underlying exposures.
The forward contracts which we have entered into to date, have principally addressed foreign currency exchange fluctuation risk between the Euro and the U.S. dollar. We account for these forward contacts, which have not been designated as hedges under GAAP to date, as either assets or liabilities and carry them at fair value. We had outstanding forward contracts as of December 31, 2024 and 2023, with a total notional value of $11 million and $9 million, respectively. These forward contracts were not designated as hedges and had maturities of less than 90 days. We recognize gains and losses from forward contracts in other income (expense), net on our consolidated statement of operations upon settlement or a change in fair value, which was not material for the year ended December 31, 2023. We recorded a net gain of $1 million and $4 million for the years ended December 31, 2024 and 2022, respectively, related to our forward contracts. Refer to “Note 3: Financial Instruments and Fair Value
Measurements” in the notes to the consolidated financial statements in Item 8 of this Annual Report on Form 10-K for further detail on our derivative instruments.
Our exposure to potentially volatile movements in foreign currency exchange rates will increase as we increase our operations in international markets. The economic impact of foreign currency exchange rate movement is linked to variability in the macroeconomic environment such as inflation and interest rates, governmental actions, and geopolitical events such as regional conflicts. We regularly monitor the macroeconomic environment, which has seen some volatility as a result of geopolitical tensions resulting from Russia’s invasion of Ukraine, the conflict in the Middle East, as well as increased cyberattacks, other military conflicts and sanctions. Developments in the macroeconomic environment could cause us to adjust our foreign currency risk strategies. Continued uncertainty regarding our international operations, including U.K. and E.U. relations, may result in future currency exchange rate volatility which may impact our business and results of operations.
Item 8. Financial Statements and Supplementary Data
| |
Index to Financial Statements and Supplementary Data: |
|
Report of Independent Registered Public Accounting Firm (KPMG LLP, Boston, Massachusetts, Auditor Firm ID: 185) | 62 |
Consolidated Statements of Operations for the years ended December 31, 2024, 2023 and 2022 | 65 |
Consolidated Statements of Comprehensive Income (Loss) for the years ended December 31, 2024, 2023 and 2022 | 66 |
Consolidated Balance Sheets as of December 31, 2024 and 2023 | 67 |
Consolidated Statements of Changes in Stockholders’ Equity for the years ended December 31, 2024, 2023 and 2022 | 68 |
Consolidated Statements of Cash Flows for the years ended December 31, 2024, 2023 and 2022 | 69 |
Notes to Consolidated Financial Statements | 70 |
REPORT OF INDEPENDENT REGISTERED PUBLIC ACCOUNTING FIRM
To the Stockholders and Board of Directors
Tripadvisor, Inc.:
Opinions on the Consolidated Financial Statements and Internal Control Over Financial Reporting
We have audited the accompanying consolidated balance sheets of Tripadvisor, Inc. and subsidiaries (the Company) as of December 31, 2024 and 2023, the related consolidated statements of operations, comprehensive income (loss), changes in stockholders’ equity, and cash flows for each of the years in the three-year period ended December 31, 2024, and the related notes (collectively, the consolidated financial statements). We also have audited the Company’s internal control over financial reporting as of December 31, 2024, based on criteria established in Internal Control – Integrated Framework (2013) issued by the Committee of Sponsoring Organizations of the Treadway Commission.
In our opinion, the consolidated financial statements referred to above present fairly, in all material respects, the financial position of the Company as of December 31, 2024 and 2023, and the results of its operations and its cash flows for each of the years in the three-year period ended December 31, 2024, in conformity with U.S. generally accepted accounting principles. Also in our opinion, the Company maintained, in all material respects, effective internal control over financial reporting as of December 31, 2024 based on criteria established in Internal Control – Integrated Framework (2013) issued by the Committee of Sponsoring Organizations of the Treadway Commission.
Basis for Opinions
The Company’s management is responsible for these consolidated financial statements, for maintaining effective internal control over financial reporting, and for its assessment of the effectiveness of internal control over financial reporting, included in the accompanying Management's Report on Internal Control over Financial Reporting. Our responsibility is to express an opinion on the Company’s consolidated financial statements and an opinion on the Company’s internal control over financial reporting based on our audits. We are a public accounting firm registered with the Public Company Accounting Oversight Board (United States) (PCAOB) and are required to be independent with respect to the Company in accordance with the U.S. federal securities laws and the applicable rules and regulations of the Securities and Exchange Commission and the PCAOB.
We conducted our audits in accordance with the standards of the PCAOB. Those standards require that we plan and perform the audits to obtain reasonable assurance about whether the consolidated financial statements are free of material misstatement, whether due to error or fraud, and whether effective internal control over financial reporting was maintained in all material respects.
Our audits of the consolidated financial statements included performing procedures to assess the risks of material misstatement of the consolidated financial statements, whether due to error or fraud, and performing procedures that respond to those risks. Such procedures included examining, on a test basis, evidence regarding the amounts and disclosures in the consolidated financial statements. Our audits also included evaluating the accounting principles used and significant estimates made by management, as well as evaluating the overall presentation of the consolidated financial statements. Our audit of internal control over financial reporting included obtaining an understanding of internal control over financial reporting, assessing the risk that a material weakness exists, and testing and evaluating the design and operating effectiveness of internal control based on the assessed risk. Our audits also included performing such other procedures as we considered necessary in the circumstances. We believe that our audits provide a reasonable basis for our opinions.
Definition and Limitations of Internal Control Over Financial Reporting
A company’s internal control over financial reporting is a process designed to provide reasonable assurance regarding the reliability of financial reporting and the preparation of financial statements for external purposes in accordance with generally accepted accounting principles. A company’s internal control over financial reporting includes those policies and procedures that (1) pertain to the maintenance of records that, in reasonable detail, accurately and fairly reflect the transactions and dispositions of the assets of the company; (2) provide reasonable assurance that transactions are recorded as necessary to permit preparation of financial statements in accordance with generally accepted accounting principles, and that receipts and expenditures of the company are being made only in accordance with authorizations of management and directors of the company; and (3) provide reasonable assurance regarding prevention or timely detection of unauthorized acquisition, use, or disposition of the company’s assets that could have a material effect on the financial statements.
Because of its inherent limitations, internal control over financial reporting may not prevent or detect misstatements. Also, projections of any evaluation of effectiveness to future periods are subject to the risk that controls may become inadequate because of changes in conditions, or that the degree of compliance with the policies or procedures may deteriorate.
Critical Audit Matter
The critical audit matter communicated below is a matter arising from the current period audit of the consolidated financial statements that was communicated or required to be communicated to the audit committee and that: (1) relates to accounts or disclosures that are material to the consolidated financial statements and (2) involved our especially challenging, subjective, or complex judgments. The communication of a critical audit matter does not alter in any way our opinion on the consolidated financial statements, taken as a whole, and we are not, by communicating the critical audit matter below, providing a separate opinion on the critical audit matter or on the accounts or disclosures to which it relates.
Sufficiency of audit evidence over revenue
As discussed in Notes 2 and 18 to the consolidated financial statements, and disclosed in the consolidated statements of operations, the Company had $1,835 million in revenue, net of intersegment revenue of $135 million, for the year ended December 31, 2024, of which $949 million was Brand Tripadvisor related, $840 million was Viator related and $181 million was TheFork related. Each of these categories of revenue has multiple revenue streams and the Company's processes and information technology (IT) systems differ between each revenue stream.
We identified the evaluation of sufficiency of audit evidence over Brand Tripadvisor and Viator revenue as a critical audit matter. Subjective auditor judgment was required due to the number of revenue streams and the related IT applications utilized throughout the revenue recognition processes. Subjective auditor judgment was required to evaluate that relevant revenue data was captured and aggregated throughout these various IT applications. This matter also included determining the revenue streams over which procedures would be performed and evaluating the nature and extent of evidence obtained over each revenue stream, both of which included the involvement of IT professionals with specialized skills and knowledge.
The following are the primary procedures we performed to address this critical audit matter. We applied auditor judgment to determine the nature and extent of procedures to be performed over Brand Tripadvisor and Viator revenue. We evaluated the design and tested the operating effectiveness of certain internal controls related to the Company’s revenue recognition process for Brand Tripadvisor and Viator revenue. This included controls related to accurate recording of amounts. For certain revenue streams, we assessed the recorded revenue by selecting a sample of transactions and compared the amounts recognized for consistency with underlying documentation, including evidence of contracts with customers.
We involved IT professionals with specialized skills and knowledge, who assisted in:
•testing certain IT applications used by the Company in its revenue recognition processes.
•testing the transfer of relevant revenue data between certain systems used in the revenue recognition processes.
We evaluated the sufficiency of audit evidence obtained by assessing the results of procedures performed, including the appropriateness of the nature and extent of such evidence.
/s/ KPMG LLP
We have served as the Company’s auditor since 2014.
Boston, Massachusetts
February 20, 2025
TRIPADVISOR, INC.
CONSOLIDATED STATEMENTS OF OPERATIONS
(in millions, except per share amounts)
| | | | | | | | | | | | |
| | Year ended December 31, | |
| | 2024 | | | 2023 | | | 2022 | |
Revenue (Note 2, Note 18) | | $ | 1,835 | | | $ | 1,788 | | | $ | 1,492 | |
| | | | | | | | | |
Costs and expenses: | | | | | | | | | |
Cost of sales (exclusive of depreciation and amortization as shown separately below) | | | 131 | | | | 119 | | | | 78 | |
Marketing | | | 729 | | | | 705 | | | | 576 | |
Personnel (including stock-based compensation of $120, $96, and $88 - Note 13) | | | 595 | | | | 570 | | | | 503 | |
Technology | | | 91 | | | | 80 | | | | 63 | |
General and administrative | | | 91 | | | | 79 | | | | 74 | |
Depreciation and amortization | | | 85 | | | | 87 | | | | 97 | |
Restructuring and other related reorganization costs (Note 7) | | | 21 | | | | 22 | | | | — | |
Total costs and expenses | | | 1,743 | | | | 1,662 | | | | 1,391 | |
Operating income (loss) | | | 92 | | | | 126 | | | | 101 | |
Other income (expense): | | | | | | | | | |
Interest expense | | | (46 | ) | | | (44 | ) | | | (44 | ) |
Interest income | | | 48 | | | | 47 | | | | 15 | |
Other income (expense), net (Note 16) | | | (7 | ) | | | (4 | ) | | | (5 | ) |
Total other income (expense), net | | | (5 | ) | | | (1 | ) | | | (34 | ) |
Income (loss) before income taxes | | | 87 | | | | 125 | | | | 67 | |
(Provision) benefit for income taxes (Note 10) | | | (82 | ) | | | (115 | ) | | | (47 | ) |
Net income (loss) | | $ | 5 | | | $ | 10 | | | $ | 20 | |
| | | | | | | | | |
Earnings (loss) per share attributable to common stockholders (Note 15): | | | | | | | | | |
Basic | | $ | 0.04 | | | $ | 0.07 | | | $ | 0.14 | |
Diluted | | $ | 0.04 | | | $ | 0.08 | | | $ | 0.14 | |
| | | | | | | | | |
Numerator used to compute earnings (loss) per share attributable to common stockholders (Note 15): | | | | | | | | | |
Basic | | $ | 5 | | | $ | 10 | | | $ | 20 | |
Diluted | | $ | 6 | | | $ | 11 | | | $ | 21 | |
| | | | | | | | | |
Weighted average common shares outstanding (Note 15): | | | | | | | | | |
Basic | | | 139 | | | | 139 | | | | 140 | |
Diluted | | | 145 | | | | 145 | | | | 146 | |
The accompanying notes are an integral part of these consolidated financial statements.
TRIPADVISOR, INC.
CONSOLIDATED STATEMENTS OF COMPREHENSIVE INCOME (LOSS)
(in millions)
| | | | | | | | | | | | |
| | | | | | |
| | Year ended December 31, | |
| | 2024 | | | 2023 | | | 2022 | |
Net income (loss) | | $ | 5 | | | $ | 10 | | | $ | 20 | |
Other comprehensive income (loss), net of tax: | | | | | | | | | |
Foreign currency translation adjustments, net of tax (1) | | | (23 | ) | | | 11 | | | | (27 | ) |
Reclassification adjustments included in net income (loss), net of tax (1) | | | 3 | | | | — | | | | 1 | |
Total other comprehensive income (loss), net of tax | | | (20 | ) | | | 11 | | | | (26 | ) |
Comprehensive income (loss) | | $ | (15 | ) | | $ | 21 | | | $ | (6 | ) |
(1)Deferred income tax liabilities related to these amounts are not material.
The accompanying notes are an integral part of these consolidated financial statements.
TRIPADVISOR, INC.
CONSOLIDATED BALANCE SHEETS
(in millions, except number of shares and per share amounts)
| | | | | | | | |
| | December 31, | | | December 31, | |
| | 2024 | | | 2023 | |
ASSETS | | | | | | |
Current assets: | | | | | | |
Cash and cash equivalents (Note 3) | | $ | 1,064 | | | $ | 1,067 | |
Accounts receivable, net (allowance for expected credit losses of $25 and $21, respectively) (Note 2, Note 3) | | | 207 | | | | 192 | |
Prepaid expenses and other current assets | | | 49 | | | | 38 | |
Total current assets | | | 1,320 | | | | 1,297 | |
Property and equipment, net (Note 4, Note 5) | | | 200 | | | | 191 | |
Operating lease right-of-use assets (Note 5) | | | 17 | | | | 15 | |
Intangible assets, net (Note 6) | | | 36 | | | | 43 | |
Goodwill (Note 6) | | | 814 | | | | 829 | |
Non-marketable investments (Note 3) | | | 30 | | | | 32 | |
Deferred income taxes, net (Note 10) | | | 101 | | | | 86 | |
Other long-term assets, net of allowance for credit losses of $10 and $10, respectively (Note 3) | | | 43 | | | | 44 | |
TOTAL ASSETS | | $ | 2,561 | | | $ | 2,537 | |
LIABILITIES AND STOCKHOLDERS' EQUITY | | | | | | |
Current liabilities: | | | | | | |
Accounts payable | | $ | 49 | | | $ | 28 | |
Deferred merchant payables (Note 2) | | | 255 | | | | 237 | |
Deferred revenue (Note 2) | | | 47 | | | | 49 | |
Current portion of debt (Note 8) | | | 5 | | | | — | |
Income taxes payable (Note 10) | | | 23 | | | | 6 | |
Accrued expenses and other current liabilities (Note 7) | | | 249 | | | | 252 | |
Total current liabilities | | | 628 | | | | 572 | |
Long-term debt (Note 8) | | | 831 | | | | 839 | |
Finance lease obligation, net of current portion (Note 5) | | | 43 | | | | 51 | |
Operating lease liabilities, net of current portion (Note 5) | | | 11 | | | | 6 | |
Deferred income taxes, net (Note 10) | | | 1 | | | | 1 | |
Other long-term liabilities (Note 9) | | | 104 | | | | 197 | |
Total Liabilities | | | 1,618 | | | | 1,666 | |
Commitments and contingencies (Note 11) | | | | | | |
Stockholders’ equity: (Note 14) | | | | | | |
Preferred stock, $0.001 par value | | | — | | | | — | |
Authorized shares: 100,000,000 | | | | | | |
Shares issued and outstanding: 0 and 0, respectively | | | | | | |
Common stock, $0.001 par value | | | — | | | | — | |
Authorized shares: 1,600,000,000 | | | | | | |
Shares issued: 153,655,038 and 149,775,361, respectively | | | | | | |
Shares outstanding: 127,394,786 and 124,881,494, respectively | | | | | | |
Class B common stock, $0.001 par value | | | — | | | | — | |
Authorized shares: 400,000,000 | | | | | | |
Shares issued and outstanding: 12,799,999 and 12,799,999, respectively | | | | | | |
Additional paid-in capital | | | 1,605 | | | | 1,493 | |
Retained earnings | | | 276 | | | | 271 | |
Accumulated other comprehensive income (loss) | | | (91 | ) | | | (71 | ) |
Treasury stock-common stock, at cost, 26,260,252 and 24,893,867 shares, respectively | | | (847 | ) | | | (822 | ) |
Total Stockholders’ Equity | | | 943 | | | | 871 | |
TOTAL LIABILITIES AND STOCKHOLDERS' EQUITY | | $ | 2,561 | | | $ | 2,537 | |
The accompanying notes are an integral part of these consolidated financial statements.
TRIPADVISOR, INC.
CONSOLIDATED STATEMENTS OF CHANGES IN STOCKHOLDERS’ EQUITY
(in millions, except number of shares)
| | | | | | | | | | | | | | | | | | | | | | | | | | | | | | | | | | | | | | | | |
| | | | | | | | | | | | | | | | | | | | Accumulated | | | | | | | | | | |
| | | | | | | | Class B | | | Additional | | | | | | other | | | | | | | | | | |
| | Common stock | | | common stock | | | paid-in | | | Retained | | | comprehensive | | | Treasury stock | | | | |
| | Shares | | | Amount | | | Shares | | | Amount | | | capital | | | earnings | | | income (loss) | | | Shares | | | Amount | | | Total | |
Balance as of December 31, 2021 | | | 144,656,649 | | | $ | — | | | | 12,799,999 | | | $ | — | | | $ | 1,326 | | | $ | 241 | | | $ | (56 | ) | | | (18,844,614 | ) | | $ | (722 | ) | | $ | 789 | |
Net income (loss) | | | | | | | | | | | | | | | | | | 20 | | | | | | | | | | | | | 20 | |
Other comprehensive income (loss), net of tax | | | | | | | | | | | | | | | | | | | | | (26 | ) | | | | | | | | | (26 | ) |
Issuance of common stock related to exercise of options and vesting of RSUs | | | 2,234,889 | | | | — | | | | | | | | | | — | | | | | | | | | | | | | | | | — | |
Withholding taxes on net share settlements of equity awards | | | | | | | | | | | | | | | (20 | ) | | | | | | | | | | | | | | | (20 | ) |
Stock-based compensation (Note 13) | | | | | | | | | | | | | | | 98 | | | | | | | | | | | | | | | | 98 | |
Balance as of December 31, 2022 | | | 146,891,538 | | | $ | — | | | | 12,799,999 | | | $ | — | | | $ | 1,404 | | | $ | 261 | | | $ | (82 | ) | | | (18,844,614 | ) | | $ | (722 | ) | | $ | 861 | |
Net income (loss) | | | | | | | | | | | | | | | | | | 10 | | | | | | | | | | | | | 10 | |
Other comprehensive income (loss), net of tax | | | | | | | | | | | | | | | | | | | | | 11 | | | | | | | | | | 11 | |
Issuance of common stock related to vesting of RSUs | | | 2,883,823 | | | | — | | | | | | | | | | — | | | | | | | | | | | | | | | | — | |
Repurchase of common stock (Note 14) | | | | | | | | | | | | | | | | | | | | | | | | (6,049,253 | ) | | | (100 | ) | | | (100 | ) |
Withholding taxes on net share settlements of equity awards | | | | | | | | | | | | | | | (17 | ) | | | | | | | | | | | | | | | (17 | ) |
Stock-based compensation (Note 13) | | | | | | | | | | | | | | | 106 | | | | | | | | | | | | | | | | 106 | |
Balance as of December 31, 2023 | | | 149,775,361 | | | $ | — | | | | 12,799,999 | | | $ | — | | | $ | 1,493 | | | $ | 271 | | | $ | (71 | ) | | | (24,893,867 | ) | | $ | (822 | ) | | $ | 871 | |
Net income (loss) | | | | | | | | | | | | | | | | | | 5 | | | | | | | | | | | | | 5 | |
Other comprehensive income (loss), net of tax | | | | | | | | | | | | | | | | | | | | | (20 | ) | | | | | | | | | (20 | ) |
Issuance of common stock related to exercise of options and vesting of RSUs | | | 3,879,677 | | | | — | | | | | | | | | | | | | | | | | | | | | | | | | — | |
Repurchase of common stock (Note 14) | | | | | | | | | | | | | | | | | | | | | | | | (1,366,385 | ) | | | (25 | ) | | | (25 | ) |
Withholding taxes on net share settlements of equity awards | | | | | | | | | | | | | | | (21 | ) | | | | | | | | | | | | | | | (21 | ) |
Stock-based compensation (Note 13) | | | | | | | | | | | | | | | 133 | | | | | | | | | | | | | | | | 133 | |
Balance as of December 31, 2024 | | | 153,655,038 | | | $ | — | | | | 12,799,999 | | | $ | — | | | $ | 1,605 | | | $ | 276 | | | $ | (91 | ) | | | (26,260,252 | ) | | $ | (847 | ) | | $ | 943 | |
The accompanying notes are an integral part of these consolidated financial statements.
TRIPADVISOR, INC.
CONSOLIDATED STATEMENTS OF CASH FLOWS
(in millions)
| | | | | | | | | | | | |
| | Year ended December 31, | |
| | 2024 | | | 2023 | | | 2022 | |
Operating activities: | | | | | | | | | |
Net income (loss) | | $ | 5 | | | $ | 10 | | | $ | 20 | |
Adjustments to reconcile net income (loss) to net cash provided by (used in) operating activities: | | | | | | | | | |
Depreciation and amortization | | | 85 | | | | 87 | | | | 97 | |
Stock-based compensation expense (Note 13) | | | 120 | | | | 96 | | | | 88 | |
Deferred income tax expense (benefit) (Note 10) | | | (14 | ) | | | (25 | ) | | | (19 | ) |
Provision for expected credit losses (Note 2) | | | 8 | | | | 6 | | | | 6 | |
Other, net | | | 9 | | | | 9 | | | | 7 | |
Changes in operating assets and liabilities, net: | | | | | | | | | |
Accounts receivable, prepaid expenses and other assets | | | (24 | ) | | | 6 | | | | (87 | ) |
Accounts payable, accrued expenses and other liabilities | | | 13 | | | | 11 | | | | 72 | |
Deferred merchant payables | | | 19 | | | | 32 | | | | 99 | |
Income tax receivables/payables, net | | | (75 | ) | | | (1 | ) | | | 107 | |
Deferred revenue | | | (2 | ) | | | 4 | | | | 10 | |
Net cash provided by (used in) operating activities | | | 144 | | | | 235 | | | | 400 | |
| | | | | | | | | |
Investing activities: | | | | | | | | | |
Capital expenditures, including capitalized website development | | | (74 | ) | | | (63 | ) | | | (56 | ) |
Other investing activities, net | | | 1 | | | | — | | | | 4 | |
Net cash provided by (used in) investing activities | | | (73 | ) | | | (63 | ) | | | (52 | ) |
Financing activities: | | | | | | | | | |
Repurchase of common stock (Note 14) | | | (25 | ) | | | (100 | ) | | | — | |
Proceeds from the issuance of Term Loan B Facility, net of financing costs (Note 8) | | | 493 | | | | — | | | | — | |
Principal payments on Term Loan B Facility (Note 8) | | | (1 | ) | | | — | | | | — | |
Payment of 2025 Senior Notes (Note 8) | | | (500 | ) | | | — | | | | — | |
Payment of financing costs related to Credit Facility (Note 8) | | | (1 | ) | | | (3 | ) | | | — | |
Payment of withholding taxes on net share settlements of equity awards | | | (21 | ) | | | (17 | ) | | | (20 | ) |
Payments of finance lease obligation and other financing activities, net (Note 5) | | | (8 | ) | | | (7 | ) | | | (7 | ) |
Net cash provided by (used in) financing activities | | | (63 | ) | | | (127 | ) | | | (27 | ) |
Effect of exchange rate changes on cash, cash equivalents and restricted cash | | | (11 | ) | | | 1 | | | | (23 | ) |
Net increase (decrease) in cash, cash equivalents and restricted cash | | | (3 | ) | | | 46 | | | | 298 | |
Cash, cash equivalents and restricted cash at beginning of period | | | 1,067 | | | | 1,021 | | | | 723 | |
Cash, cash equivalents and restricted cash at end of period | | $ | 1,064 | | | $ | 1,067 | | | $ | 1,021 | |
Supplemental disclosure of cash flow information: | | | | | | | | | |
Cash paid (received) during the period for income taxes, net of refunds | | $ | 170 | | | $ | 140 | | | $ | (40 | ) |
Cash paid during the period for interest | | $ | 58 | | | $ | 39 | | | $ | 40 | |
Supplemental disclosure of non-cash investing and financing activities: | | | | | | | | | |
Stock-based compensation capitalized website development costs (Note 13) | | $ | 13 | | | $ | 10 | | | $ | 10 | |
The accompanying notes are an integral part of these consolidated financial statements.
TRIPADVISOR, INC.
NOTES TO CONSOLIDATED FINANCIAL STATEMENTS
NOTE 1: ORGANIZATION AND BUSINESS DESCRIPTION
We refer to Tripadvisor, Inc. and our wholly-owned subsidiaries as “Tripadvisor,” “Tripadvisor group,” “the Company,” “us,” “we” and “our” in these notes to the consolidated financial statements.
On December 20, 2011, Expedia Group, Inc. (“Expedia”) completed a spin-off of Tripadvisor into a separate publicly traded Delaware corporation. We refer to this transaction as the “Spin-Off.” Tripadvisor’s common stock began trading on The Nasdaq Stock Market as an independent public company on December 21, 2011, under the trading symbol “TRIP.”
On December 11, 2012, Liberty Interactive Corporation, or Liberty, purchased an aggregate of approximately 4.8 million shares of common stock of Tripadvisor from Barry Diller, our former Chairman of the Board of Directors and Senior Executive, and certain of his affiliates. As a result, Liberty beneficially owned approximately 18.2 million shares of our common stock and 12.8 million shares of our Class B common stock.
On August 27, 2014, the entire beneficial ownership of our common stock and Class B common stock held by Liberty was acquired by Liberty TripAdvisor Holdings, Inc., or LTRIP. Simultaneously, Liberty, LTRIP’s former parent company, distributed, by means of a dividend, to the holders of its Liberty Ventures common stock, Liberty’s entire equity interest in LTRIP. We refer to this transaction as the “Liberty Spin-Off.” As a result of the Liberty Spin-Off, effective August 27, 2014, LTRIP became a separate, publicly traded company holding 100% of Liberty’s interest in Tripadvisor.
As a result of these transactions, and as of December 31, 2024, LTRIP beneficially owned approximately 14.0 million shares of our common stock and 12.8 million shares of our Class B common stock, which constitute approximately 11% of the outstanding shares of common stock and 100% of the outstanding shares of Class B common stock. Assuming the conversion of all of LTRIP’s shares of Class B common stock into common stock, LTRIP would beneficially own approximately 19% of the outstanding common stock. However, because each share of Class B common stock is entitled to ten votes per share and each share of common stock is entitled to one vote per share, LTRIP may be deemed to beneficially own equity securities representing approximately 56% of our voting power.
On December 18, 2024, the Company, LTRIP and Telluride Merger Sub Corp., a Delaware corporation (“Merger Sub”) and an indirect wholly-owned subsidiary of the Company, entered into an Agreement and Plan of Merger (the “Merger Agreement”), pursuant to which, and subject to the terms and conditions, (i) Merger Sub will be merged with and into LTRIP (the “Merger”), with LTRIP surviving the Merger as the surviving corporation and an indirect, wholly-owned subsidiary of the Company, and (ii) immediately following the Merger, LTRIP (as the surviving corporation in the Merger) will be merged with and into TellurideSub LLC, a Delaware limited liability company and a direct wholly-owned subsidiary of the Company (“ParentSub LLC”) (such merger, the “ParentSub LLC Merger”), with ParentSub LLC surviving the ParentSub LLC Merger as the surviving company and a wholly-owned subsidiary of the Company.
In connection with the Merger, (i) the shares of LTRIP Series A Common Stock and Series B Common Stock issued and outstanding immediately prior to the effective time of the Merger will be converted into the right to receive $0.2567 per share in cash (without interest), totaling approximately $20 million in the aggregate; (ii) all of the shares of LTRIP's 8% Series A Cumulative Redeemable Preferred Stock issued and outstanding immediately prior to the effective time of the Merger will be converted into the right to receive, in the aggregate, approximately $42 million in cash, without interest, and 3,037,959 validly issued, fully paid and non-assessable shares of the Company's common stock; and (iii) LTRIP's 0.50% Exchangeable Senior Debentures of approximately $330 million will be repaid in accordance with their terms. Pursuant to the Merger Agreement, the Company will provide a loan facility (the “TRIP Loan Facility”) to LTRIP of approximately $330 million, to repay LTRIP debentures prior to the closing of the Merger. The TRIP Loan Facility will be repaid on the earlier of (i) the closing of the Merger, and (ii) 15 business days after the valid termination of the Merger Agreement or (b) such later date as jointly agreed to by LTRIP and the Company. The transaction is expected to close in the second quarter of 2025, and based on 10-day
volume-weighted average share price (“VWAP”) of $13.98 at December 17, 2024, the expected aggregate transaction value to be paid by the Company is approximately $435 million (which includes approximately $392 million of cash consideration and 3,037,959 validly issued, fully paid and non-assessable shares of the Company's common stock based on 10-day VWAP of $13.98 at December 17, 2024). The implied share price for the acquisition of such shares of the Company's common stock from LTRIP is $16.21 (which reflects a premium of approximately 16% based on the 10-day VWAP as of December 17, 2024).
Assets held by LTRIP substantially consist of the shares of the Company’s common stock described above. As a result, the Company views this transaction as a repurchase of the Company's common stock held by LTRIP and, as such, the Merger will be substantially accounted for as a treasury stock repurchase transaction within stockholders’ equity on our consolidated balance sheet. The amount allocated to the treasury stock repurchase transaction will be the aggregate transaction value paid by the Company, plus all direct expenses and fees associated with the transaction incurred by the Company. Upon consummation of the Merger, the Company plans to retire the approximately 26.8 million shares of the Company's common stock held by LTRIP as reported on LTRIP's Form 13D/A filed on December 20, 2024. Following the closing of the Merger, the Company will no longer have a controlling shareholder or be considered a “controlled company”.
The transaction is subject to various closing conditions, including LTRIP stockholder approval, regulatory clearances, and other customary conditions. There can be no assurance that the conditions to closing will be satisfied or that the transactions contemplated by the Merger Agreement will be completed on the contemplated terms or timeline, or at all.
Description of Business
The Tripadvisor group operates as a family of brands with the purpose of connecting people to experiences worth sharing. The Company's vision is to be the world’s most trusted source for travel and experiences. The Company operates across three reportable segments: Brand Tripadvisor, Viator, and TheFork. We leverage our brands, technology platforms, and capabilities to connect our large, global audience with partners by offering rich content, travel guidance products and services, and two-sided marketplaces for experiences, accommodations, restaurants, and other travel categories.
Brand Tripadvisor’s purpose is to empower everyone to be a better traveler by serving as the world’s most trusted and essential travel guidance platform. Brand Tripadvisor offers travelers and experience seekers an online global platform for travelers to discover, generate, and share authentic user-generated content (“UGC”) in the form of reviews and opinions for destinations, points-of-interest (“POIs”), experiences, accommodations, restaurants, and cruises in over 40 countries and in more than 20 languages across the world. Tripadvisor offers more than 1 billion user-generated reviews and opinions on over 9 million experiences, accommodations, restaurants, airlines, and cruises.
Viator enables travelers to discover and book iconic, unique and memorable experiences from experience operators around the globe. Our online marketplace is comprehensive, connecting travelers to bookable tours, activities and attractions—consisting of nearly 400,000 experiences from more than 65,000 operators.
TheFork provides an online marketplace that enables diners to discover and book online reservations at approximately 55,000 restaurants in 11 countries, across the U.K., western and central Europe.
Risks and Uncertainties
Our business was negatively impacted by the risks and uncertainties related to the COVID-19 pandemic and our business would be adversely and materially affected upon a resurgence of COVID-19 or the emergence of any new pandemic or other health crisis that results in reinstated travel bans and/or other government restrictions and mandates. In addition, the U.S. and other countries have seen elevated levels of inflation and fluctuating discretionary spending patterns by consumers all of which may impact our business. If macroeconomic conditions deteriorate, consumer demand and spending may decline, we may not be able to pass on increased costs to our
customers and any inability to navigate the macroeconomic environment could harm our business, results of operations and financial condition.
Additionally, natural disasters, public health-related events, political instability, geopolitical conflicts, including the evolving events in the Middle East and between Ukraine and Russia, acts of terrorism, fluctuations in currency values, and changes in global economic conditions are examples of other events that could have a negative impact on the travel industry, and as a result, our financial results.
Consumer travel expenditures have historically followed a seasonal pattern. Correspondingly, travel partner advertising investments, and therefore our revenue and operating profits, have also historically followed a seasonal pattern. Our financial performance tends to be highest in the second and third quarters of a given year, which includes the seasonal peak in consumer demand, including traveler accommodation stays, and travel experiences taken, compared to the first and fourth quarters, which represent seasonal low points. In addition, during the first half of the year, experience bookings typically exceed the amount of completed experiences, resulting in higher cash flow related to working capital; while during the second half of the year, particularly in the third quarter, this pattern reverses and cash flows from these transactions are typically negative. Other factors may also impact typical seasonal fluctuations, such as significant shifts in our business mix, adverse economic conditions, public health-related events, as well as other factors.
NOTE 2: SIGNIFICANT ACCOUNTING POLICIES
Basis of Presentation and Consolidation
The accompanying consolidated financial statements include Tripadvisor, our wholly-owned subsidiaries, and entities we control, or in which we have a variable interest and are the primary beneficiary of expected cash profits or losses. All inter-company accounts and transactions have been eliminated in consolidation. Additionally, certain prior period amounts may have been reclassified for comparability with the current period presentation, none of which were material, except as discussed below in “Revised Operating Expense Presentation.” The accompanying consolidated financial statements have been prepared in accordance with generally accepted accounting principles in the United States (“GAAP”). We believe that the assumptions underlying our consolidated financial statements are reasonable. However, these consolidated financial statements do not present our future financial position, or the results of our future operations and cash flows.
One of our subsidiaries that operates in China has variable interests in affiliated entities in China in order to comply with Chinese laws and regulations, which restrict foreign investment in internet content provision businesses. Although we do not own the capital stock of these Chinese affiliates, we consolidate their results as we are the primary beneficiary of the cash losses or profits of these variable interest affiliates and have the power to direct the activity of these affiliates. Our variable interest entities’ financial results were not material for all periods presented. Investments in entities in which we do not have a controlling financial interest are accounted for under the equity method, the fair value option, as available-for-sale securities, or at cost adjusted for observable price changes and impairments, as appropriate.
Revised Operating Expense Presentation
During the fourth quarter of 2024, the Company revised its operating expense captions on its consolidated statement of operations to better align the Company’s financial presentation with how management assesses performance and makes strategic decisions in its business operations, and to provide additional clarity and understanding of our operating expenses for investors. Prior year amounts have been reclassified to conform to the current period presentation. The revised presentation did not result in any changes to previously reported revenues, total costs and expenses, operating income (loss), income (loss) before income taxes, or net income (loss). Below is a brief description of the major cost components within the revised operating expense captions presented on our consolidated statements of operations:
•Cost of Sales: Cost of sales consists of expenses that are directly related or closely correlated to revenue generation, including direct costs, such as credit card and other booking transaction payment fees, media
production costs, ad serving fees, and other revenue generating costs. In addition, cost of sales includes operating costs such as bad debt expense and non-income taxes, including sales, use, digital services, and other non-income revenue related taxes.
•Marketing: Marketing expenses consist of direct costs, including traffic generation costs from paid online traffic acquisition costs (including search engine marketing (“SEM”) and other online traffic acquisition costs), syndication costs and affiliate marketing commissions, social media costs, brand advertising (including connected television, traditional television and other offline advertising), promotions and public relations.
•Personnel: Personnel expenses consist primarily of salaries, payroll taxes, bonuses, employee health and other benefits, and stock-based compensation. In addition, personnel expenses include costs associated with contingent staff, bonuses and commissions for sales, sales support, customer support and marketing employees.
•Technology: Technology expenses consist primarily of licensing, data center costs including cloud-based solutions, maintenance, computer supplies, telecom, and content translation and localization costs.
•General and administrative: General and administrative expenses consist primarily of professional service fees and other fees including audit, legal, tax and accounting, and other operating costs including real estate and office expenses, and non-compensation related personnel expenses such as travel, relocation, recruiting, and training expenses.
The following table below shows the reclassification adjustments made amongst costs and expenses on our consolidated statements of operations for the periods presented below:
| | | | | | | | | | | | | | | | | | | | | | | | |
| | As Reported December 31, 2023 | | | Adjustments | | | As Adjusted December 31, 2023 | | | As Reported December 31, 2022 | | | Adjustments | | | As Adjusted December 31, 2022 | |
| | (in millions) | | | (in millions) | |
Costs and expenses: | | | | | | | | | | | | | | | | | | |
Cost of sales (formerly Cost of revenue) | | $ | 149 | | | $ | (30 | ) | 1 | $ | 119 | | | $ | 116 | | | $ | (38 | ) | 1 | $ | 78 | |
Marketing (formerly Selling and marketing) | | | 940 | | | | (235 | ) | 2 | | 705 | | | | 784 | | | | (208 | ) | 2 | | 576 | |
Personnel (including stock-based compensation of $96 and $88) | | | — | | | | 570 | | 3 | | 570 | | | | — | | | | 503 | | 3 | | 503 | |
Technology (formerly Technology and content) | | | 273 | | | | (193 | ) | 4 | | 80 | | | | 222 | | | | (159 | ) | 4 | | 63 | |
General and administrative | | | 191 | | | | (112 | ) | 5 | | 79 | | | | 172 | | | | (98 | ) | 5 | | 74 | |
Depreciation and amortization | | | 87 | | | | — | | | | 87 | | | | 97 | | | | — | | | | 97 | |
Restructuring and other related reorganization costs | | | 22 | | | | — | | | | 22 | | | | — | | | | — | | | | — | |
Total costs and expenses | | $ | 1,662 | | | $ | — | | | $ | 1,662 | | | $ | 1,391 | | | $ | — | | | $ | 1,391 | |
(1)Primarily related to the reclass of people costs to Personnel, and data center costs, and to a lesser extent, licensing costs to Technology; partially offset by the reclass of digital service taxes ("DST") and bad debt expense from General and administrative to Costs of sales.
(2)Primarily related to the reclass of people costs to Personnel, and to a lesser extent, licensing costs to Technology and real estate and office expenses to General and administrative.
(3)Related to the reclass of people costs, including stock-based compensation expense, from all legacy operating expense captions to Personnel.
(4)Primarily related to the reclass of people costs to Personnel, and to a lesser extent, the reclass of real estate and office expenses to General and administrative; partially offset by the reclass of data center and licensing costs from all legacy operating expense captions to Technology.
(5)Primarily related to the reclass of people costs to Personnel, and to a lesser extent, the reclass of DST and bad debt expense to Costs of sales; partially offset by the reclass of real estate and office expenses to General and administrative from all legacy operating expense captions.
Accounting Estimates
We use estimates and assumptions in the preparation of our consolidated financial statements in accordance with GAAP. Our estimates and assumptions affect the reported amounts of assets and liabilities and disclosure of contingent assets and liabilities as of the date of our consolidated financial statements. These estimates and assumptions also affect the reported amount of net income or loss during any period. Our actual financial results could differ significantly from these estimates. The significant estimates underlying our consolidated financial statements are within accounting for income taxes. Refer to our accounting policy for income taxes disclosed below and “Note 10: Income Taxes” for information regarding our significant income tax estimates.
Revenue Recognition
We generate all our revenue from contracts with customers. We recognize revenue when we satisfy a performance obligation by transferring control of the promised services to a customer in an amount that reflects the consideration that we expect to receive in exchange for those services. When we act as an agent in the transaction, we recognize revenue for only our commission on the arrangement. We determine revenue recognition through the following steps:
(1)Identification of the contract, or contracts, with a customer
(2)Identification of the performance obligations in the contract
(3)Determination of the transaction price
(4)Allocation of the transaction price to the performance obligations in the contract
(5)Recognition of revenue when, or as, we satisfy a performance obligation.
At contract inception, we assess the services promised in our contracts with customers and identify a performance obligation for each promise to transfer to the customer a service (or bundle of services) that is distinct. To identify the performance obligations, we consider all of the services promised in the contract regardless of whether they are explicitly stated or are implied by customary business practices. We have provided qualitative information about our performance obligations for our principal revenue streams discussed below. There was no significant revenue recognized in the years ended December 31, 2024, 2023 and 2022 related to performance obligations satisfied in prior periods, respectively. We have applied a practical expedient and do not disclose the value of unsatisfied performance obligations that have an original expected duration of less than one year. The Company expects to complete its performance obligations within one year from the initial transaction date. The value related to our remaining or partially satisfied performance obligations relates to subscription services that are satisfied over time or services that are recognized at a point in time, but not yet achieved. Our timing of services, invoicing and payments are discussed in more detail below and do not include a significant financing component. Our customer invoices are generally due 30 days from the time of invoicing.
We recognize an asset for the incremental costs of obtaining a contract with a customer if we expect the benefit of those costs to be longer than one year. Although the substantial majority of our contract costs have an amortization period of less than one year, we have determined contract costs arising from certain sales incentives have an amortization period in excess of one year given the high likelihood of contract renewal. Sales incentives are not paid upon renewal of these contracts and therefore are not commensurate with the initial sales incentive costs. As of both December 31, 2024 and 2023, there was $3 million of unamortized contract costs in other long-term assets on our consolidated balance sheet. We amortize these contract costs on a straight-line basis over the estimated customer life, which is based on historical customer retention rates. Amortization expense recorded to personnel expense on our consolidated statements of operations during each of the years ended December 31, 2024, 2023 and 2022, was $1 million. We assess such asset for impairment when events or circumstances indicate that the carrying amount may not be recoverable. No impairments were recognized during the years ended December 31, 2024, 2023 and 2022.
The recognition of revenue may require the application of judgment related to the determination of the performance obligations and the timing of when the performance obligations are satisfied. The determination of our performance obligations does not require significant judgment given that we generally do not provide multiple services to a customer in a transaction, and the point in which control is transferred to the customer is readily determinable. In instances where we recognize revenue over time, we generally have either a subscription service
that is recognized over time on a straight-line basis using the time-elapsed output method, or based on other output measures that provide a faithful depiction of the transfer of our services. When an estimate for cancellations is included in the transaction price, we base our estimate on historical cancellation rates and current trends. Taxes assessed by a government authority that are both imposed on and concurrent with a specific revenue–producing transaction, that are collected by us from a customer, are reported on a net basis, or in other words excluded from revenue on our consolidated financial statements.
Practical Expedients and Exemptions
•We expense costs to obtain a contract as incurred, such as sales incentives, when the amortization period would have been one year or less.
•We do not disclose the value of unsatisfied performance obligations for (i) contracts with an original expected length of one year or less and (ii) contracts for which we recognize revenue at the amount to which we have the right to invoice for services performed.
The application of our revenue recognition policies and description of our principal activities, organized by reportable segment from which we generate our revenue, are presented below.
Brand Tripadvisor Segment
Tripadvisor-branded Hotels Revenue. Our largest source of Brand Tripadvisor segment revenue is generated from click-based advertising on Tripadvisor-branded websites, which we refer to as our hotel meta (also referred to as hotel auction) revenue, which is primarily comprised of contextually-relevant booking links to our travel partners’ websites. Our click-based travel partners are predominantly online travel agencies, or OTAs, and hotels. Click-based advertising is generally priced on a cost-per-click, or “CPC” basis, with payments from travel partners determined by the number of travelers who click on a link multiplied by the CPC rate for each specific click. CPC rates are determined in a dynamic, competitive auction process, where the travel partner bids for rates and availability to be listed on our platform. When a CPC bid is submitted, the travel partner agrees to pay us the bid amount each time a traveler clicks on the link to that travel partner’s website. Bids can be submitted periodically – as often as daily – on a property-by-property basis. We record click-based advertising revenue as the click occurs and traveler leads are sent to the travel partner’s website as our performance obligation is fulfilled at that time. Click-based revenue is generally billed to our travel partners monthly, consistent with the timing of the service. We also generate revenue from our cost-per-acquisition, or “CPA” model, which consists of contextually-relevant booking links to our travel partners’ websites which are advertised on our platform. We earn a commission from our travel partners, based on a pre-determined contractual commission rate, for each traveler who clicks to and books a hotel reservation on the travel partner's website, which results in a traveler stay. CPA revenue is billable only upon the completion of each traveler’s stay resulting from a hotel reservation. The travel partners provide the service to the travelers, and we act as an agent under GAAP. Our performance obligation is complete at the time of the hotel reservation booking, and the commission earned is recognized upon booking, as we have no post-booking service obligations. We recognize this revenue net of an estimate of the impact of cancellations, using historical cancellation rates and current trends. Contract assets are recognized at the time of booking for commissions that are billable upon the completion of a traveler's stay. CPA revenue is generally billed to our travel partners two months after traveler stays are completed.
In addition, we offer business-to-business, or “B2B,” solutions, including subscription-based advertising to hotels, owners of B&Bs, and other specialty lodging properties. Our performance obligation is generally to enable subscribers to advertise their businesses on our platform, as well as to manage and promote their website URL, email address, phone number, special offers and other information related to their business. Subscription-based advertising services are predominantly sold for a flat fee for a contracted period of time of one year or less and revenue is recognized on a straight-line basis over the period of the subscription service as efforts are expended evenly throughout the contract period. Subscription-based advertising services are generally billed at the inception of the service. When prepayments are received, we recognize deferred revenue initially on our consolidated balance sheet for the amount of prepayment in excess of revenue recognized, until the performance obligation is satisfied. To a lesser extent, we offer travel partners the opportunity to advertise and promote their business through hotel sponsored placements on our platform. This service is generally priced on a CPC basis, with payments from travel partners determined by the number of travelers who click on the sponsored link multiplied by the CPC rate for each specific click. CPC rates for hotel sponsored placements that our travel partners pay are generally based on bids
submitted as part of an auction by our travel partners or a pre-determined contractual CPC rate. The travel partner agrees to pay us the CPC rate amount each time a traveler clicks on a link to the travel partner’s website. We record this click-based advertising revenue as the click occurs and traveler leads are sent to the travel partner as our performance obligation is fulfilled at that time. Hotel sponsored placements revenue is generally billed to our travel partners monthly, consistent with the timing of the service.
Media and Advertising Revenue. We offer travel partners the ability to promote their brands through display-based advertising, or sometimes referred to as “media advertising,” placements across our platform. Our display-based advertising clients are predominantly direct suppliers of hotels, airlines and cruises, as well as destination marketing organizations. We also sell display-based advertising to OTAs and other travel related businesses, as well as to advertisers from non-travel categories. Display-based advertising is sold predominantly on a cost per thousand impressions, or “CPM,” basis. The performance obligation in our display-based advertising arrangements is to display a number of advertising impressions on our platform and we recognize revenue for impressions as they are delivered. Services are generally billed monthly. We have applied the practical expedient to measure progress toward completion, as we have the right to invoice the customer in an amount that directly corresponds with the value to the customer of our performance to date, which is measured based on impressions delivered.
Tripadvisor Experiences and Dining Revenue. We generate revenue from our experiences and restaurant offerings on Tripadvisor-branded websites and mobile apps. Tripadvisor receives intercompany (intersegment) revenue consisting of affiliate marketing commissions earned primarily from experience bookings and, to a lesser extent, restaurant reservation bookings, on Tripadvisor-branded websites and mobile apps, fulfilled by Viator and TheFork, respectively, which are eliminated on a consolidated basis. The performance obligations, timing of customer payments for our experiences and dining transactions, and methods of revenue recognition are consistent with the Viator and TheFork segments, as described below. In addition, Tripadvisor restaurant offerings, or B2B restaurant offerings, generate subscription fees for subscription-based advertising to our restaurant partners that allow restaurants to manage and promote their website URL, email address, phone number, special offers and other information related to their business, as well as access to certain online reservation management services, marketing analytic tools, and menu syndication services. As the performance obligation is to provide restaurants with access to these services over a subscription period, the subscription fee revenue is recognized over the subscription period on a straight-line basis as efforts are expended evenly throughout the contract period. Subscription-based advertising services are generally billed at the inception of the service. When prepayments are received, we recognize deferred revenue initially on our consolidated balance sheet for the amount of prepayment in excess of revenue recognized, until the performance obligation is satisfied. In addition, we offer restaurant partners the opportunity to advertise and promote their business through restaurant media advertising placements on our platform. This service is generally priced on a CPC basis, with payments from restaurant partners determined by the number of clicks by consumers on the sponsored link multiplied by the CPC rate for each specific click. CPC rates for media advertising placements agreed to by our restaurant partners are based on a pre-determined contractual rate. We record this click-based advertising revenue as the click occurs and diner leads are sent to the restaurant partner as our performance obligation is fulfilled at that time. Click-based revenue is generally billed to our restaurant partners monthly, consistent with the timing of the service.
Other Revenue. We also offer travelers cruises, vacation rentals, flights, and rental cars solutions on our platforms which complement our end-to-end travel experience.
Our vacation rentals offering provides information and services that allow travelers to research and book vacation and short-term rental properties, including full homes, condominiums, villas, beach properties, cabins and cottages. These properties are listed on our Tripadvisor-branded websites and mobile apps, and Tripadvisor's portfolio of travel media brands, including, www.flipkey.com, www.holidaylettings.co.uk, and www.niumba.com. Prior to the fourth quarter of 2024, we earned commissions associated with rental transactions through our free-to-list model from both the traveler and the property owner or manager. We provided post-booking services to the travelers, property owners and managers until the time the rental commenced, which was the time the performance obligation was satisfied and revenue was recognized. Under GAAP, we acted as an agent in these transactions, as we did not control any properties before the property owner provided the accommodation to the traveler and had no inventory risk. Accordingly, this commission revenue was recorded on a net basis.
As of the beginning of the fourth quarter of 2024, our performance obligation in the vacation rentals offering is to display and promote vacation rentals inventory from partners on our platform, including contextually-relevant booking links to third-party booking partners, our customers, in exchange for a commission when travelers complete a booking on the third-party booking partner's website. The third-party booking partner is responsible for completing the booking, payment processing and post-booking services to the travelers. We do not control the service or have inventory risk, and therefore act as an agent for these transactions under GAAP. Accordingly, our performance obligation is satisfied and revenue is recognized at the time of the booking, as we have no post-booking obligations to the traveler. We recognize this revenue net of an estimate of the impact of cancellations, which is not material, using historical cancellation rates and current trends. We generally invoice and receive commissions directly from third-party bookings partners upon the completion of a traveler's stay. Therefore, contract assets are recognized at the time of booking for commissions earned that are billable upon the completion of a traveler's stay.
In addition, Other Revenue includes revenue generated from cruises, flights, and rental cars offerings on Tripadvisor-branded websites and mobile apps and Tripadvisor’s portfolio of brands, which primarily includes click-based advertising and display-based advertising revenue. The performance obligations, timing of customer payments for these offerings, and methods of revenue recognition are generally consistent with click-based advertising and display-based advertising revenue, as described above.
Viator Segment
We provide an online marketplace that allows travelers to research and book tours, activities and attractions in popular travel destinations across the globe through our Viator-branded platform, which includes website, mobile web, and mobile app. Through Viator, we also power traveler bookings of tours, activities and attractions on behalf of third-party distribution partner websites, including the Tripadvisor platform as well as many of the world’s major OTA’s, airlines, hotels, online and offline travel agencies, and other prominent content and eCommerce brands.
We work with local tour, activity, and experience operators (“operators”) to provide travelers (“customers”) the ability to book tours, activities and attractions, or “experiences,” in destinations around the world. We generate commissions for each booking transaction we facilitate through our online reservation system, in exchange for certain activities, including the use of the Company’s booking platform, post-booking 24/7 customer support until the time of the experience and payment processing activities as the merchant of record, which is the completion of the performance obligation. These activities are not distinct from each other and are not separate performance obligations. As a result, the Company’s single performance obligation is to facilitate an experience, which is complete upon the time the experience occurs, and when revenue is recognized. We do not control the experience or have inventory risk before the operator provides the experience to our customer and therefore act as agent for substantially all of these transactions under GAAP.
We collect payment from the customer prior to the experience occurring, which includes both our commission and the amount due to the operator. We record our commissions as deferred revenue on our consolidated balance sheet when payment is received, including amounts which are refundable subject to cancellation, until the experience occurs and revenue is recognized. The amount due to the operator is recorded as a deferred merchant payable on our consolidated balance sheet until completion of the experience, after which payment is remitted to the operator.
To a much lesser extent, we earn commissions from third-party distribution partners, in this case, the customers, who display and promote on their websites the operator experiences available on our platform to generate bookings. In these transactions, we are not the merchant of record, and we generally invoice and receive commissions directly from third-party distribution partners upon completion of the experience and make payments to the operators after the experience is complete. Our performance obligation is to allow the third-party distribution partners to display and promote on their website experiences offered by operators who utilize our platform, in exchange for which, we earn a commission when travelers book and complete an experience on the third-party distribution partner's website. We do not control the service or have inventory risk, and therefore act as an agent for these transactions under GAAP. Our performance obligation is complete, and revenue is recognized at the time of the booking, as we have no post-booking obligations to the customer. We recognize this revenue net of an estimate
of the impact of cancellations, which is not material, using historical cancellation rates and current trends. Contract assets are recognized for commissions that are contractually billable contingent upon completion of the experience.
TheFork Segment
We provide information and services for consumers to research and book dining reservations through our online restaurant reservations platform, TheFork. We primarily generate transaction fees (or per seated diner fees) that are paid by our restaurant customers for diners seated primarily from bookings through TheFork’s online reservation system. The transaction fee is recognized as revenue after the reservation is fulfilled, or as diners are seated by our restaurant customers. We invoice restaurants monthly for transaction fees. To a lesser extent, we also generate subscription fees for providing access to certain online reservation management services, marketing analytic tools, and menu syndication services. For these services, our performance obligation is to provide restaurants with access to these services over the subscription period, which generally is one-month, and we recognize revenue once our performance obligation is met and invoice restaurants monthly for these subscription services.
Refer to “Note 18: Segment and Geographic Information” for disaggregation of the Company’s revenue by major products and revenue sources. We have determined that disaggregating revenue into these categories achieves the disclosure objective under GAAP, which is to depict how the nature, amount, timing, and uncertainty of revenue and cash flows are affected by economic factors.
Deferred Revenue
Contract liabilities generally include payments received in advance of performance under the contract, and are realized as revenue as the performance obligation to the customer is satisfied, which we present as deferred revenue on our consolidated balance sheets. As of January 1, 2024, we had $49 million recorded as deferred revenue on our consolidated balance sheet, of which $46 million was recognized in revenue and $3 million was refunded due to cancellations by travelers during the year ended December 31, 2024. As of January 1, 2023, we had $44 million recorded as deferred revenue on our consolidated balance sheet, of which $41 million was recognized in revenue and $3 million was refunded due to cancellations by travelers during the year ended December 31, 2023. The difference between the opening and closing balances of our deferred revenue primarily results from the timing differences between when we receive customer payments and the time in which we satisfy our performance obligations. There were no significant changes in deferred revenue during the years ended December 31, 2024 and 2023 related to business combinations, impairments, cumulative catch-ups or other material adjustments.
Deferred Merchant Payables
In our experience offerings we receive payment from travelers at the time of booking or prior to the experience, and we record these amounts, net of our commissions, on our consolidated balance sheet as deferred merchant payables. We pay the experience operators after the travelers’ use. Therefore, we receive payment from the traveler prior to paying the experience operator and this operating cycle represents a working capital source or use of cash to us. Our deferred merchant payables balance was $255 million and $237 million at December 31, 2024 and 2023, respectively, on our consolidated balance sheets.
Advertising costs
The Company's advertising costs are reported as "Marketing expenses" on our consolidated statements of operations. We incur advertising costs consisting of paid online traffic acquisition costs (including SEM and other online traffic acquisition costs), syndication costs and affiliate marketing commissions, social media costs, brand advertising (including connected television, traditional television and other offline advertising), promotions and public relations, to promote our brands. We expense the costs associated with communicating the advertisements in the period in which the advertisement takes place. We expense the production costs associated with advertisements in the period in which the advertisement first takes place. For the years ended December 31, 2024, 2023 and 2022, we recorded advertising expense of $729 million, $705 million, and $576 million, respectively, in marketing expense on our consolidated statements of operations. We include prepaid advertising expenses in prepaid expenses and other current assets on our consolidated balance sheets, which was not material as of December 31, 2024 and 2023.
Stock-Based Compensation
Stock Options. Our employee stock options generally consist of service based awards. The exercise price is equal to the market price of the underlying shares of our common stock at the date of grant. In this regard, when granting stock option awards, our practice is to determine the applicable grant date and to specify that the exercise price shall be the closing price of our common stock on the date of grant. Our stock options generally have a term of ten years from the date of grant and typically vest equally over a four-year requisite service period. We amortize the grant-date fair value of our stock option grants as stock-based compensation expense over the vesting term on a straight-line basis, with the amount of compensation expense recognized at any date at least equaling the portion of the grant-date fair value of the award that is vested at that date.
The estimated grant-date fair value of stock options is calculated using a Black-Scholes Merton option-pricing model (“Black-Scholes model”). The Black-Scholes model incorporates assumptions to fair value stock-based awards, which includes the risk-free rate of return, expected volatility, expected term, and expected dividend yield. Our risk-free interest rate is based on the yields currently available on zero-coupon U.S. Treasury issues, in effect at the time of the grant, whose remaining maturity period most closely approximates the stock option’s expected term assumption. We estimate our expected volatility by using the historical volatility of our own common stock. Historical volatility is determined using actual daily price observations of our common stock price over a period equivalent to or approximate to the expected term of our stock option grants to date. We estimate our expected term using historical exercise behavior and expected post-vest termination data. Our expected dividend yield is zero as we have not historically paid regular cash dividends on our common stock and do not expect to pay regular cash dividends for the foreseeable future.
Restricted Stock Units. Restricted stock units (“RSUs”) are stock awards that are granted to employees entitling the holder to shares of our common stock as the award vests. RSUs are measured at fair value based on the quoted price of our common stock at the date of grant. We amortize the fair value of RSUs as stock-based compensation expense over the vesting term, which is typically over a four-year requisite service period on a straight-line basis, with the amount of compensation expense recognized at any date at least equaling the portion of the grant-date fair value of the award that is vested at that date.
Performance-Based Awards. Performance-based stock options and RSUs vest upon achievement of certain company-based performance conditions and a requisite service period. On the date of grant, the fair value of a performance-based award is calculated using the same method as our service based stock options and RSUs as described above. We then assess whether it is probable that the individual performance targets would be achieved. If assessed as probable, compensation expense will be recorded for these awards over the estimated performance period. At each reporting period, we reassess the probability of achieving the performance targets and the performance period required to meet those targets. The estimation of whether the performance targets will be achieved and the performance period required to achieve the targets requires judgment, and to the extent actual results or updated estimates differ from our current estimates, the cumulative effect on current and prior periods of those changes will be recorded in the period estimates are revised, or the change in estimate will be applied prospectively depending on whether the change affects the estimate of total compensation cost to be recognized or merely affects the period over which compensation cost is to be recognized. The ultimate number of shares issued and the related compensation expense recognized will be based on a comparison of the final performance metrics to the specified targets.
Market-Based Awards. We issue market-based performance RSUs, or MSUs, which vest upon achievement of specified levels of market conditions. The fair value of our MSUs is estimated at the date of grant using a Monte-Carlo simulation model. The probabilities of the actual number of market-based performance units expected to vest and resultant actual number of shares of common stock expected to be awarded are reflected in the grant date fair values; therefore, the compensation expense for these awards will be recognized assuming the requisite service period is rendered and are not adjusted based on the actual number of awards that ultimately vest.
Estimates of fair value are not intended to predict actual future events or the value ultimately realized by employees who receive these awards, and subsequent events are not indicative of the reasonableness of our original estimates of fair value.
The Company accounts for forfeitures in the period in which they occur, rather than estimating expected forfeitures.
Income Taxes
We record income taxes under the asset and liability method. Deferred tax assets and liabilities reflect our estimation of the future tax consequences of temporary differences between the carrying amounts of assets and liabilities for book and tax purposes. We determine deferred income taxes based on the differences in accounting methods and timing between financial statement and income tax reporting. Accordingly, we determine the deferred tax asset or liability for each temporary difference based on the enacted income tax rates expected to be in effect when we realize the underlying items of income and expense. We consider all relevant factors when assessing the likelihood of future realization of our deferred tax assets, including our recent earnings experience by jurisdiction, expectations of future taxable income, and the carryforward periods available to us for tax reporting purposes, as well as assessing available tax planning strategies. We may establish a valuation allowance to reduce deferred tax assets to the amount we believe is more likely than not to be realized. Due to inherent complexities arising from the nature of our businesses, future changes in income tax law, tax sharing agreements or variances between our actual and anticipated operating results, we make certain judgments and estimates. Therefore, actual income taxes could materially vary from these estimates. We classify deferred tax assets and liabilities as noncurrent on our consolidated balance sheet.
We record liabilities to address uncertain tax positions we have taken in previously filed tax returns or that we expect to take in a future tax return. The determination for required liabilities is based upon an analysis of each individual tax position, taking into consideration whether it is more likely than not that our tax position, based on technical merits, will be sustained upon examination.
Cash, Cash Equivalents, Restricted Cash and Marketable Securities
Our cash consists of available on demand bank deposits held in global financial institutions. Our cash equivalents generally consist of highly liquid investments, generally including money market funds, term deposits and marketable securities, with maturities of 90 days or less at the date of purchase.
As of December 31, 2024 and 2023, our restricted cash, which primarily consists of legally restricted deposits and escrowed security deposits, was not material.
We classify marketable securities as either short-term or long-term based on each instrument’s underlying contractual maturity date and as to whether and when we intend to sell a particular security prior to its maturity date. Marketable securities with maturities greater than 90 days at the date of purchase and 12 months or less remaining at the balance sheet date will be classified as short-term and marketable securities with maturities greater than 12 months from the balance sheet date will generally be classified as long-term. We classify marketable equity securities, limited by policy to money market funds and mutual funds, as either a cash equivalent, short-term or long-term based on the nature of each security and its availability for use in current operations.
Our marketable securities are classified and accounted for as available-for-sale, and therefore are carried at fair value, with unrealized gains and losses, net of taxes, reported in accumulated other comprehensive income (loss) as a component of stockholders’ equity. Fair values are determined for each individual security in the investment portfolio. We determine the appropriate classification of our marketable securities at the time of purchase and reevaluate the designations at each balance sheet date. We invest in highly-rated securities, and our investment policy limits the amount of credit exposure to any one issuer, industry group and currency. The policy requires investments to be investment grade, with the primary objective of minimizing the potential risk of principal loss and providing liquidity of investments sufficient to meet our operating and capital spending requirements and debt repayments. Realized gains and losses on the sale of marketable securities are determined by specific identification of each security’s cost basis. We may sell certain of our marketable securities prior to their stated maturities for strategic reasons including, but not limited to, anticipation of credit deterioration, liquidity, and duration management. The weighted average maturity of our total invested cash shall not exceed 18 months, and no security shall have a final maturity date greater than three years, according to our investment policy.
We continually review any available-for-sale securities to determine whether their fair value is below their carrying value. If the fair value of an available-for-sale security is below their carrying value, and either we intend to sell the security or we will be required to sell before recovery, then the difference between fair value and carrying value is recognized as a loss in other income (expense), net on our consolidated statements of operations. If we do not intend to sell and we will not be required to sell before recovery, then we analyze whether a portion of the unrealized loss is the result of a credit loss. When a portion of the unrealized loss is the result of a credit loss, we recognize an allowance for expected credit losses on our consolidated balance sheet and a corresponding loss in other income (expense), net on our consolidated statements of operations. Any portion of the unrealized loss on the available-for-sale securities that is not attributable to a credit loss would be recognized as an unrealized loss in accumulated other comprehensive income (loss) within our consolidated statements of changes in stockholders’ equity.
The Company's investment portfolio at any point in time may contain various investments, including, in U.S. treasury and U.S. government agency securities, taxable and tax-exempt municipal notes, corporate notes and bonds, commercial paper, non-U.S. government agency securities, overnight demand deposits, and money market funds. The Company segments its portfolio based on the underlying risk profiles of the securities and has a zero loss expectation for U.S. treasury and U.S. government agency securities. The Company regularly reviews the securities in an unrealized loss position and evaluates the expected credit loss risk by considering factors such as historical experience, market data, issuer-specific factors, and current economic conditions. As of December 31, 2024 and 2023, the Company had no available-for-sale securities.
Accounts Receivable and Allowance for Expected Credit Losses
Accounts receivable are recognized when the right to consideration becomes unconditional and are recorded net of an allowance for expected credit losses. We record accounts receivable at the invoiced amount. Our customer invoices are generally due 30 days from the time of invoicing.
The Company uses the “expected credit loss” methodology, allowed under GAAP, in estimating its allowance for expected credit losses. We apply the “expected credit loss” methodology by first assessing our historical losses based on credit sales and then adding in an assessment of expected changes in the foreseeable future, whether positive or negative, to the Company’s ability to collect its outstanding accounts receivables, or the expectation for future losses. The Company develops its expectation for future losses by assessing the profiles of its customers using their historical payment patterns, any known changes to those customers’ ability to fulfill their payment obligations, and assessing broader economic conditions that may impact our customers’ ability to pay their obligations. Where appropriate, the Company performs this analysis using a portfolio approach. Portfolios comprise customers with similar characteristics and payment history, and we have concluded that the aggregation of these customers into various portfolios does not produce a result that is materially different from considering the affected customers individually. Customers are assigned internal credit ratings, as determined by the Company, based on our collection profiles. Customers whose outstanding obligations are less likely to experience a credit loss are assigned a higher internal credit rating, and those customers whose outstanding obligations are more likely to experience a credit loss are assigned a lower credit rating. We recognize a greater credit loss allowance on the accounts receivable due from those customers in the lower credit rating tranche, as determined by the Company. When the Company becomes aware of facts and circumstances affecting an individual customer, it also takes that specific customer information into account as part of its calculation of expected credit losses.
The Company's exposure to credit losses may increase if our customers are adversely affected by changes in macroeconomic pressures or uncertainty associated with local or global economic recessions, or other customer-specific factors.
The following table presents the changes in our allowance for expected credit losses for the periods presented:
| | | | | | | | | | | | |
| | December 31, | |
| | 2024 | | | 2023 | | | 2022 | |
| | (in millions) | |
Allowance for expected credit losses: | | | | | | | | | |
Balance, beginning of period | | $ | 21 | | | $ | 28 | | | $ | 28 | |
Provision charged to expense | | | 8 | | | | 6 | | | | 6 | |
Write-offs, net of recoveries and other adjustments | | | (4 | ) | | | (13 | ) | | | (6 | ) |
Balance, end of period | | $ | 25 | | | $ | 21 | | | $ | 28 | |
Property and Equipment
We record property and equipment at cost, net of accumulated depreciation. We capitalize certain costs incurred during the application development stage related to website development when it is probable the project will be completed and the software will be used as intended. Capitalized costs include internal and external costs, if direct and incremental, and deemed by management to be significant. We expense costs related to the planning and post-implementation phases of website development as these costs are incurred. Maintenance and enhancement costs (including those costs in the post-implementation stages) are typically expensed as incurred, unless such costs relate to substantial upgrades and enhancements to the website or software resulting in added functionality, in which case the costs are capitalized.
We compute depreciation using the straight-line method over the estimated useful lives of the assets, which is three to five years for computer equipment, capitalized website development, office furniture and other equipment. We depreciate leasehold improvements using the straight-line method, over the shorter of the estimated useful life of the improvement or the remaining term of the lease.
Leases
We lease office space in a number of countries around the world, generally under non-cancelable operating lease agreements. Our corporate headquarters is our most significant office space lease and is accounted for as a finance lease under GAAP. The Company has also entered into other leases, such as data center leases, which are not material to our consolidated financial statements.
We determine whether a contract is or contains a lease at inception of a contract. We define a lease as a contract, or part of a contract, that conveys the right to control the use of identified property or equipment (an identified asset) for a period of time in exchange for consideration. Control over the use of the identified asset means that we have both the right to obtain substantially all of the economic benefits from the use of the asset and the right to direct the use of the asset.
Our lease contracts contain both lease and non-lease components which we combine as a single component under our accounting policy by asset class, except for office space leases and certain other leases, such as colocation data center leases, which we account separately for the lease and non-lease components. For leases which the consideration in the contract is allocated to lease and non-lease components, we base it on each component’s relative standalone price. We determine standalone prices for the lease components based on the prices for which other lessors lease similar assets on a standalone basis. We determine standalone prices for the non-lease component based on the prices that third-party suppliers charge for services for similar assets on a standalone basis. If observable standalone prices are not readily available, we estimate the standalone prices based on other available observable information. However, for certain categories of equipment leases, such as network equipment and others, we account for the lease and non-lease components as a single lease component. Additionally, for certain equipment leases that have similar characteristics, we apply a portfolio approach to effectively account for operating lease right-of-use ROU assets and operating lease liabilities.
The Company uses its estimated incremental borrowing rate as the discount rate in measuring the present value of our lease payments given the rate implicit in our leases is not typically readily determinable. Given we do
not currently borrow on a collateralized basis, our incremental borrowing rate is estimated to approximate the interest rate in which the Company would expect to pay on a collateralized basis over a similar term and payments, and in economic environments where the leased asset is located. We use the portfolio approach to determine the discount rate for leases with similar characteristics or when the Company is reasonably certain that doing so would not materially affect the accounting for those leases to which a single discount rate is applied.
We establish assets and liabilities for the estimated construction costs incurred under lease arrangements where we are considered the owner for accounting purposes only, or build-to-suit leases, to the extent we are involved in the construction of structural improvements or take construction risk prior to commencement of a lease. Upon occupancy of facilities under build-to-suit leases, we assess whether these arrangements qualify for sales recognition under the sale-leaseback accounting guidance under GAAP. If we continue to be the deemed owner, for accounting purposes, the facilities are accounted for as finance obligations.
Finance Leases
Finance lease ROU assets and finance lease liabilities are recognized at the lease commencement date or the date the lessor makes the leased asset available for use. Finance lease ROU assets are generally amortized on a straight-line basis over the lease term, and the carrying amount of finance lease liabilities are (1) accreted to reflect interest using the incremental borrowing rate if the rate implicit in the lease is not readily determinable; and (2) reduced to reflect lease payments made during the period. Amortization expense for finance lease ROU assets and interest accretion on finance lease liabilities are recorded to depreciation and interest expense, respectively, in our consolidated statement of operations.
We lease approximately 280,000 square feet of office space for our corporate headquarters in Needham, Massachusetts. This lease has an expiration date of December 2030, with an option to extend the lease term for two consecutive terms of five years each and is accounted for as a finance lease.
Operating Leases
Our office space leases, exclusive of our corporate headquarters, are operating leases, which we lease an aggregate of approximately 165,000 square feet at nearly 25 locations across North America, Europe and Asia Pacific, in cities such as New York, London, Singapore, Barcelona and Paris, primarily used as sales offices, subsidiary headquarters, and for international operations, pursuant to leases with various expiration dates, with the latest expiring in March 2034.
Operating lease ROU assets and liabilities are recognized at lease commencement date, or the date the lessor makes the leased asset available for use, based on the present value of lease payments over the lease term using the Company’s estimated incremental borrowing rate. ROU assets associated with operating leases comprise the initial lease liability, and are then adjusted for any prepaid or deferred rent payments, unamortized initial direct costs, and lease incentives received. Amortization expense for operating lease ROU assets and interest accretion on operating lease liabilities are recognized as a single operating lease cost in our consolidated statement of operations, which results effectively in recognition of rent expense on a straight-line basis over the lease period. The carrying amount of operating lease liabilities are (1) accreted to reflect interest using the incremental borrowing rate if the rate implicit in the lease is not readily determinable; and (2) reduced to reflect lease payments made during the period. We present the combination of both the amortization of operating lease ROU assets and the change in the operating lease liabilities in the same line item within the adjustments to reconcile net income (loss) to net cash provided by operating activities in our consolidated statement of cash flows. Lease incentives are recognized as reductions of rental expense on a straight-line basis over the term of the lease. Our operating leases generally include options to extend the lease terms for up to approximately 6 years and/or terminate certain leases within 1 year, which we include in our lease term if we are reasonably certain to exercise these options. Payments under our operating leases are primarily fixed, however, certain of our operating lease agreements include rental payments which are adjusted periodically for inflation. We recognize these costs as variable lease costs on our consolidated statement of operations, which were not material during the years ended December 31, 2024, 2023 and 2022. In addition, our short-term lease costs were not material in any period presented.
We also establish assets and liabilities at the present value of estimated future costs to return certain of our leased facilities to their original condition to satisfy any asset retirement obligations. Such assets are depreciated
over the lease period into operating expense, and the recorded liabilities are accreted to the future value of the estimated restoration costs and are included in other long-term liabilities on our consolidated balance sheet. Our asset retirement obligations were not material as of both December 31, 2024 and 2023.
Non-Marketable Equity Investments
We account for non-marketable equity investments through which we exercise significant influence but do not have control over the investee under the equity method. Under this method, the investment, originally recorded at cost, is adjusted to recognize the Company’s share of net earnings or losses of the investment as they occur rather than as dividends or other distributions are received. Losses are limited to the extent of the Company’s investment in, advances to and commitments for the investee. In the event we are unable to obtain accurate financial information from the investee in a timely manner, we record our share of earnings or losses of such equity investment on a lag.
Non-marketable equity investments that are not accounted for under the equity method and that do not have a readily determinable fair value are accounted for under the measurement alternative, allowed under GAAP. Under the measurement alternative, the carrying value is measured at cost, less any impairment, plus or minus changes resulting from observable price changes in orderly transactions for identical or similar investments of the same issuer. Adjustments are determined primarily based on a market approach as of the transaction date. We classify our non-marketable equity investments as long-term assets on our consolidated balance sheet as those investments do not have stated contractual maturity dates.
On a quarterly basis, we perform a qualitative assessment considering impairment indicators, if any, to evaluate whether these investments are impaired. Qualitative factors considered include industry and market conditions, financial performance, business prospects, and other relevant events and factors. When indicators of impairment exist, we prepare a quantitative assessment of the fair value of our equity investments, which may include using both the market and income approaches which require judgment and the use of estimates, including discount rates, investee revenues and costs, and available comparable market data of private and public companies, among others. When our assessment indicates that an impairment exists, we measure our non-marketable equity investments at fair value.
Valuations of such privately-held companies are inherently complex and uncertain due to the lack of liquid market for such company’s securities. In addition, such investments are inherently risky in that such companies are typically at an early stage of development, may have no or limited revenues, may not be or may never become profitable, may not be able to secure additional funding or their technologies, services or products may not be successfully developed or introduced into the market.
Business Combinations
We account for acquired businesses using the acquisition method of accounting which requires that tangible assets and identifiable intangible assets acquired and assumed liabilities be recorded at the date of acquisition at their respective fair values. Any excess purchase price over the estimated fair value of the net tangible and intangible assets acquired is allocated to goodwill. When determining the fair values of assets acquired and liabilities assumed, management makes estimates and assumptions, especially with respect to intangible assets. Significant estimates in valuing certain intangible assets may include but are not limited to future expected cash flows from customer and supplier relationships, acquired technology and trade names from a market participant perspective, useful lives and discount rates. Management’s estimates of fair value are based upon assumptions believed to be reasonable, but which are inherently uncertain and unpredictable and, as a result, actual results may differ from estimates. Valuations are performed by management or third-party valuation specialists under management's supervision, where appropriate. Any changes to provisional amounts identified during the measurement period, calculated as if the accounting had been completed as of the acquisition date, are recognized in the consolidated financial statements in the reporting period in which the adjustment amounts are determined.
Goodwill and Intangible Assets
Goodwill
We assess goodwill, which is not amortized, for impairment annually during the fourth quarter, or more frequently, if events and circumstances indicate impairment may have occurred. We test goodwill for impairment at the reporting unit level. Goodwill is assigned to reporting units that are expected to benefit from the synergies of the business combination in which such goodwill was generated as of the acquisition date. We evaluate our reporting units when changes in our operating structure occur, and if necessary, reassign goodwill using a relative fair value allocation approach. Once goodwill has been allocated to the reporting units, it no longer retains its identification with a particular acquisition and becomes identified with the reporting unit in its entirety. Accordingly, the fair value of the reporting unit as a whole is available to support the recoverability of its goodwill.
The Company has the option to qualitatively assess whether it is more likely than not that the fair value of a reporting unit is less than its carrying value. In the evaluation of goodwill for impairment, we generally first perform a qualitative assessment to determine whether it is more likely than not (i.e., a likelihood of more than 50%) that the estimated fair value of the reporting unit is less than the carrying amount. Periodically, we may choose to forgo the initial qualitative assessment and proceed directly to a quantitative analysis to assist in our annual evaluation. When assessing goodwill for impairment, our decision to perform a qualitative impairment assessment for an individual reporting unit in a given year is influenced by a number of factors, including, but not limited to the size of the reporting unit's goodwill, the significance of the excess of the reporting unit's estimated fair value over carrying value at the last quantitative assessment date, the amount of time in between quantitative fair value assessments from the date of acquisition or to establish an updated baseline quantitative analysis, and other performance and market indicators. During a qualitative assessment, if we determine that it is not more likely than not that the implied fair value of the goodwill is less than its carrying amount, no further testing is necessary. If, however, we determine that it is more likely than not that the implied fair value of the goodwill is less than its carrying amount, we then perform a quantitative assessment and compare the estimated fair value of the reporting unit to the carrying value. If the carrying value of a reporting unit exceeds its estimated fair value, the goodwill impairment is measured using the difference between the carrying value and the estimated fair value of the reporting unit; however, any loss recognized cannot exceed the total amount of goodwill allocated to that reporting unit.
In determining the estimated fair values of reporting units in a quantitative goodwill impairment test, we generally use a blend, of the following recognized valuation methods: the income approach (i.e. discounted cash flows model) and the market valuation approach, which we believe compensates for the inherent risks of using either model on a stand-alone basis. The discounted cash flows model indicates the fair value of the reporting units based on the present value of the cash flows that we expect the reporting units to generate in the future. Our significant estimates in the discounted cash flows model include: weighted average cost of capital; long-term rate of growth and profitability of the reporting unit; income tax rates and working capital effects. The market valuation approach indicates the fair value of the business based on a comparison to comparable publicly traded firms in similar lines of business and other precedent transactions. Our significant estimates in the market valuation approach model include identifying similar companies with comparable business factors such as size, growth, profitability, risk and return on investment and assessing comparable revenue and/or income multiples in estimating the fair value of the reporting units. Valuations are performed by management or third-party valuation specialists under management's supervision, where appropriate. We believe that the estimated fair values assigned to our reporting units in impairment tests are based on reasonable assumptions that marketplace participants would use. However, such assumptions are inherently uncertain and actual results could differ from those estimates. The use of substantially different assumptions, estimates or judgments could trigger the need for an impairment charge, or materially increase or decrease the amount of any such impairment charge.
During the Company's annual goodwill impairment test in the fourth quarter of 2024, a qualitative assessment was performed for all our reporting units, which are Brand Tripadvisor, Viator, and TheFork. We determined that it was not more likely than not that the fair value of any reporting unit was less than its carrying value, and, accordingly, no impairment charges were recorded during the year ended December 31, 2024. As part of the qualitative assessment for our annual 2024 goodwill impairment analysis of our reporting units, the factors that we considered included, but were not limited to: (a) changes in macroeconomic conditions in the overall economy and the specific markets in which we operate, (b) our ability to access capital, (c) changes in the online travel industry, (d) changes in the level of competition, (e) evaluation of current and future forecasted financial results of the
reporting units, (f) comparison of our current financial performance to historical and budgeted results of the reporting units, (g) change in excess of the Company’s market capitalization over its book value, (h) changes in estimates, valuation inputs, and/or assumptions since the last quantitative analysis of the reporting units during the second quarter of 2022, (i) changes in the regulatory environment, (j) changes in strategic outlook or organizational structure and leadership of the reporting units; and (k) other relevant factors, and how these factors might impact specific performance in future periods.
Intangible Assets
Intangible assets with estimable useful lives, or definite-lived intangibles, are carried at cost and are amortized on a straight-line basis over their estimated useful lives and reviewed for impairment upon certain triggering events. We routinely review the remaining estimated useful lives of our definite-lived intangible assets. If we reduce the estimated useful life assumption, the remaining unamortized balance is amortized over the revised estimated useful life.
Intangible assets that have indefinite lives are not amortized and are tested for impairment annually during the fourth quarter, or whenever events or changes in circumstances indicate that the carrying value may not be recoverable. Similar to the qualitative assessment for goodwill, we may assess qualitative factors to determine if it is more likely than not that the implied fair value of the indefinite-lived intangible asset is less than its carrying amount. If we determine that it is not more likely than not that the implied fair value of the indefinite-lived intangible asset is less than its carrying amount, no further testing is necessary. If, however, we determine that it is more likely than not that the implied fair value of the indefinite-lived intangible asset is less than its carrying amount, we compare the implied fair value of the indefinite-lived asset with its carrying amount. If the carrying amount of an individual indefinite-lived intangible asset exceeds its implied fair value, the individual asset's carrying value is written down by an amount equal to such excess. The assessment of qualitative factors is optional and at our discretion. We may bypass the qualitative assessment for any indefinite-lived intangible asset in any period and resume performing the qualitative assessment in any subsequent period. We base our quantitative measurement of fair value of indefinite-lived intangible assets, which consist of Tripadvisor-brand trade name and trademarks, using the relief-from-royalty method. This method assumes that the trade name and trademarks have value to the extent that their owner is relieved of the obligation to pay royalties for the benefits received from them. This method requires us to estimate future revenues, the appropriate royalty rate and the weighted average cost of capital, however, such assumptions are inherently uncertain and actual results could differ from those estimates.
During the Company's annual indefinite-lived intangible impairment test during the fourth quarter of 2024, a qualitative assessment was performed. As part of our qualitative assessment we considered, amongst other factors, the amount of excess fair value of our trade names and trademarks to the carrying value of those same assets, changes in estimates, and valuation input assumptions, since our previous quantitative analysis. After considering these factors and the impact that changes in such factors would have on the inputs used in our previous quantitative assessment, we determined that it was more likely than not that our indefinite-lived intangible assets were not impaired as of December 31, 2024.
Impairment of Long-Lived Assets
We periodically review the carrying amount of our definite-lived intangible assets and other long-term assets, including property and equipment, net and operating lease right-of-use assets, to determine whether current events or circumstances indicate that such carrying amounts may not be recoverable. Factors that would necessitate an impairment assessment include a significant adverse change in the extent or manner in which an asset is used, a significant adverse change in legal factors or the business climate that could affect the value of the asset, or a significant decline in the observable market value of an asset, among others. The Company’s impairment evaluation is performed at the asset group level or the lowest level for which identified cash flows are largely independent, which the Company has defined as the reporting unit level. If such facts indicate a potential impairment, we assess the recoverability of the asset group by determining if the carrying value of the asset group exceeds the sum of the projected undiscounted cash flows expected to result from the use and eventual disposition of the assets over the remaining economic life of the primary asset of the group. If the recoverability test indicates that the carrying value of the asset group is not recoverable, we will estimate the fair value of the asset group using appropriate valuation methodologies which would typically include an estimate of discounted cash flows, using an appropriate discount rate. Any impairment would be measured by the amount that the carrying values, of such asset groups, exceed their
estimated fair value and would be included in operating income (loss) on the consolidated statement of operations. Considerable management judgment is necessary to estimate the fair value of asset groups. Accordingly, actual results could vary significantly from such estimates. We have not identified any circumstances that would warrant an impairment charge for any recorded definite-lived intangibles or other long-term assets on our consolidated balance sheet at December 31, 2024 or 2023.
Foreign Currency Translation and Transaction Gains and Losses
Our consolidated financial statements are reported in U.S. dollars. Certain of our subsidiaries outside of the U.S. use the local currency as their functional currency and not the U.S. dollar. Therefore assets and liabilities of our foreign subsidiaries are translated at the spot rate in effect at the applicable reporting date, and the consolidated statements of operations are translated at the average exchange rates in effect during the applicable reporting period. The resulting unrealized cumulative translation adjustment is recorded as a component of accumulated other comprehensive income (loss) in stockholders’ equity on our consolidated balance sheet.
In addition, our subsidiaries also engage in transactions in currencies other than its functional currency. Transactions denominated in currencies other than the functional currency are recorded based on foreign currency exchange rates at the time such transactions arise. Subsequent changes in foreign currency exchange rates result in transaction gains and losses which are reflected in our consolidated statements of operations as unrealized (based on the applicable period-end exchange rate) or realized upon settlement of the transactions. Accordingly, we have recorded net foreign currency exchange losses of $2 million, $5 million and $5 million, respectively, for the years ended December 31, 2024, 2023 and 2022, in other income (expense), net on our consolidated statements of operations. These amounts also include transaction gains and losses, both realized and unrealized from forward contracts.
Derivative Financial Instruments
We account for derivative instruments that do not qualify for hedge accounting as either assets or liabilities and carry them at fair value, with any subsequent adjustments to fair value recorded in other income (expense), net on our consolidated statements of operations. Monetary assets and liabilities denominated in a currency other than the functional currency of a given subsidiary are remeasured at spot rates in effect on the balance sheet date with the effects of changes in foreign currency exchange rates reported in other income (expense), net on our consolidated statements of operations. In certain circumstances, we enter into forward contracts to reduce, to the extent practical, our potential exposure to the effects of fluctuating foreign currency exchange rates on our cash flows denominated in foreign currencies. Accordingly, fair value changes in the forward contracts help mitigate the changes in the value of the remeasured assets and liabilities attributable to changes in foreign currency exchange rates, except to the extent of the spot-forward differences. These differences are not expected to be significant due to the short-term nature of the contracts, which to date, have typically had maturities at inception of 90 days or less. The net cash received or paid related to our derivative instruments are classified in other investing activities in our consolidated statements of cash flows. Counterparties to forward contracts consist of major global financial institutions. We monitor our positions and the credit ratings of the counterparties involved and, by policy limits, the amount of credit exposure to any one party. We do not use derivatives for trading or speculative purposes. We did not enter into any cash flow, fair value or net investment hedges during the years ended December 31, 2024, 2023 or 2022. Refer to “Note 3: Financial Instruments and Fair Value Measurements” for additional information on our derivatives.
Fair Value Measurements and Disclosures
We apply fair value accounting for all financial assets and liabilities and non-financial assets and liabilities that are recognized or disclosed at fair value in the financial statements on a recurring basis. We measure assets and liabilities at fair value based on the expected exit price, which is the amount that would be received on the sale of an asset or amount paid to transfer a liability, as the case may be, in an orderly transaction between market participants in the principal or most advantageous market in which we would transact. As such, fair value may be based on assumptions that market participants would use in pricing an asset or liability at the measurement date. The authoritative guidance on fair value measurements establishes a consistent framework for measuring fair value on either a recurring or nonrecurring basis whereby inputs, used in valuation techniques, are assigned a hierarchical level. GAAP provides the following hierarchical levels of inputs used to measure fair value:
Level 1—Valuations are based on quoted market prices for identical assets and liabilities in active markets.
Level 2—Valuations are based on observable inputs other than quoted market prices included in Level 1, such as quoted prices for similar assets and liabilities in active markets, quoted prices for identical or similar assets and liabilities in markets that are not active, or other inputs that are observable or can be corroborated by observable market data.
Level 3—Valuations are based on unobservable inputs reflecting our own assumptions, consistent with reasonably available assumptions made by other market participants. These valuations require significant judgment.
Debt Issuance Costs
We defer costs we incur to issue debt, which are presented in the balance sheet as a direct deduction from the carrying amount of the related debt liability, and amortize these costs using the effective interest rate method to interest expense over the term of the debt. We also defer costs we incur to enter into a credit facility or to amend our existing revolving credit facility, which are presented on the consolidated balance sheet as a long-term asset, and amortize these costs using the effective interest rate method to interest expense over the term of the credit facility.
Certain Risks and Concentrations
Our business is subject to certain risks and concentrations, including a concentration related to dependence on our relationships with our customers. For the year ended December 31, 2024, Booking (and its subsidiaries) accounted for 10% or more of our consolidated revenue, and together with Expedia (and its subsidiaries), our two most significant travel partners, accounted for approximately 22% of our consolidated revenue. For the years ended December 31, 2023 and 2022, Expedia and Booking each accounted for 10% or more of our consolidated revenue, and together accounted for approximately 25% and 31%, respectively, of our consolidated revenue. Nearly all of this concentration of revenue is recorded in our Brand Tripadvisor segment during these reporting periods.
Additionally, our business is dependent on relationships with third-party service providers that we rely on to fulfill service obligations to our customers where the Company is the merchant of record, such as our experience operators. However, no one operator’s inventory resulted in more than 10% of our revenue on a consolidated basis or at a reportable segment level in any period presented. Refer to “Note 18: Segment and Geographic Information” for information regarding concentrations related to geographic and product revenues and fixed assets by geographic location. As of both December 31, 2024 and 2023, Expedia accounted for approximately 10% of our consolidated accounts receivable, net.
Financial instruments, which potentially subject us to concentration of credit risk, generally consist, at any point in time, of cash and cash equivalents, corporate debt securities, forward contracts, capped calls, and accounts receivable. We maintain cash balances with financial institutions that are in excess of Federal Deposit Insurance Corporation insurance limits in the U.S. and similar government programs outside the U.S. Our cash and cash equivalents are generally composed of available on demand bank deposits or term deposits with several major global financial institutions, as well as money market funds, primarily denominated in U.S. dollars, and to a lesser extent Euros, British pounds, and Australian dollars. We may invest in highly-rated corporate debt securities, and our investment policy limits the amount of credit exposure to any one issuer, industry group and currency. Our credit risk related to corporate debt securities is also mitigated by the relatively short maturity period required by our investment policy. Forward contracts and capped calls are transacted with major international financial institutions with high credit standings. Forward contracts, which, to date, have typically had maturities of less than 90 days, also mitigate risk. Our overall credit risk related to accounts receivable is mitigated by the relatively short collection period.
Contingent Liabilities
Periodically, we review the status of all significant outstanding matters to assess any potential financial exposure. When (i) it is probable that an asset has been impaired or a liability has been incurred; and (ii) the amount
of the loss can be reasonably estimated, we record the estimated loss in our consolidated statement of operations. We provide disclosure in the notes to the consolidated financial statements for loss contingencies that do not meet both these conditions if there is a reasonable possibility that a loss may have been incurred that would be material to the consolidated financial statements. Significant judgment may be required to determine the probability that a liability has been incurred and whether such liability is reasonably estimable. We base accruals made on the best information available at the time which can be highly subjective. The final outcome of these matters could vary significantly from the amounts included in the accompanying consolidated financial statements.
Treasury Stock
Shares of our common stock repurchased, including incremental direct costs to purchase treasury stock, including excise tax, are recorded at cost as treasury stock and result in the reduction of stockholders' equity on our consolidated balance sheet. We may reissue these treasury shares. When treasury shares are reissued, we use the average cost method for determining the cost of reissued shares. If the issuance price is higher than the cost, the excess of the issuance price over the cost is credited to additional paid-in-capital. If the issuance price is lower than the cost, the difference is first charged against any credit balance in additional paid-in-capital from the previous issuances of treasury stock and any remaining balance is charged to retained earnings.
Earnings Per Share (“EPS”)
Basic Earnings Per Share Attributable to Common Stockholders
We compute basic earnings per share, or Basic EPS, by dividing net income (loss) by the weighted average number of common shares outstanding during the period. We compute the weighted average number of common shares outstanding during the reporting period using the total of common stock and Class B common stock outstanding as of the last day of the previous year end reporting period plus the weighted average of any additional shares issued and outstanding less the weighted average of any common shares repurchased during the reporting period.
Diluted Earnings Per Share Attributable to Common Stockholders
Diluted earnings per share, or Diluted EPS, includes the potential dilution of common equivalent shares outstanding that could occur from stock-based awards and other stock-based commitments using the treasury stock method. We compute Diluted EPS by dividing net income (loss) by the sum of the weighted average number of common and common equivalent shares outstanding during the period. We compute the weighted average number of common and common equivalent shares outstanding during the period using the sum of (i) the number of shares of common stock and Class B common stock used in the Basic EPS calculation as indicated above; (ii) if dilutive, the incremental weighted average common stock that we would issue upon the assumed exercise of outstanding common equivalent shares, primarily stock options and restricted stock units using the treasury stock method; and (iii) if dilutive, performance-based and market-based awards based on the number of shares that would be issuable as of the end of the reporting period assuming the end of the reporting period was also the end of the contingency period.
Under the treasury stock method, the assumed proceeds calculation includes the actual proceeds to be received from the employee upon exercise of outstanding equity awards and the average unrecognized compensation cost during the period. The treasury stock method assumes that a company uses the proceeds from the exercise of an equity award to repurchase common stock at the average market price for the reporting period.
In periods of net income, shares of our common stock subject to the potential conversion of the 2026 Senior Notes outstanding during the period is also included in our weighted average number of shares outstanding used to calculate Diluted EPS using the if-converted method under GAAP, as share settlement is presumed. When convertible notes are dilutive, interest expense, net of tax, is added back to net income attributable to common stockholders to calculate Diluted EPS. Capped Calls are excluded from the calculation of Diluted EPS, as they would be antidilutive. However, upon conversion of the 2026 Senior Notes, unless the market price of our common stock exceeds the cap price, an exercise of the Capped Calls would generally offset any dilution from the 2026
Senior Notes from the conversion price up to the cap price. As of December 31, 2024, 2023, and 2022, the market price of a share of our common stock did not exceed the $107.36 cap price. Refer to “Note 8: Debt” for further information regarding our 2026 Senior Notes and Capped Calls.
In periods of a net loss, common equivalent shares are excluded from the calculation of Diluted EPS as their inclusion would have an antidilutive effect. Accordingly, for periods in which we report a net loss, Diluted EPS is the same as Basic EPS, since dilutive common equivalent shares are not assumed to have been issued if their effect is antidilutive.
Recently Adopted Accounting Pronouncement
In November 2023, the Financial Accounting Standards Board (“FASB”) issued new accounting guidance which expands public entities’ segment disclosures by requiring disclosure of significant segment expenses that are regularly provided to the chief operating decision maker (“CODM”) and included within each reported measure of segment profit or loss, an amount and description of its composition for other segment items, and interim disclosures of a reportable segment’s profit or loss and assets. This guidance is effective for annual periods beginning after December 15, 2023, and interim periods within annual periods beginning after December 15, 2024, with early adoption permitted, including adoption in any interim period. We adopted this accounting guidance on December 31, 2024, and applied it retrospectively to all prior periods presented in our consolidated financial statements. The adoption of this accounting guidance did not result in a change to our previously reported segments revenue or adjusted EBITDA. Refer to “Note 18: Segment and Geographic Information” for our reportable segment disclosure information required under the adoption of this accounting guidance, including significant segment expenses that are regularly provided to our CODM.
New Accounting Pronouncements Not Yet Adopted
In November 2024, the FASB issued new accounting guidance that clarifies the requirements for determining whether certain settlements of convertible debt instruments should be accounted for as an induced conversion. This guidance is effective for annual reporting periods beginning after December 15, 2025 and interim reporting periods within those annual reporting periods. Early adoption is permitted for all entities that have adopted the amendments in ASU 2020-06, Debt—Debt with Conversion and Other Options (Subtopic 470-20) and Derivatives and Hedging—Contracts in Entity’s Own Equity (Subtopic 815-40).
In November 2024, the FASB issued new accounting guidance expanding disclosure requirements related to certain income statement expenses. The guidance requires tabular footnote disclosure of certain operating expenses disaggregated into categories, such as employee compensation, depreciation, and intangible asset amortization, included within each interim and annual income statement's expense caption, as applicable. This guidance is effective for fiscal years beginning after December 15, 2026, and interim periods within fiscal years beginning after December 15, 2027, with early adoption permitted, and may be applied either prospectively or retrospectively.
In December 2023, the FASB issued new accounting guidance requiring entities to provide additional information in the income tax rate reconciliation and additional disclosures about income taxes paid. The new accounting guidance requires entities to disclose in their rate reconciliation table additional categories of information about federal, state and foreign income taxes and to provide more details about the reconciling items in some categories if the items meet a quantitative threshold. This guidance is effective for annual periods beginning after December 15, 2024, and should be applied prospectively, but entities have the option to apply it retrospectively for each period presented. Early adoption is permitted for annual financial statements that have not yet been issued or made available for issuance.
We are currently considering our timing of adoption and are in the process of evaluating the impact of adopting these newly issued accounting rules on our consolidated financial statements and related disclosures.
NOTE 3: FINANCIAL INSTRUMENTS AND FAIR VALUE MEASUREMENTS
Cash, Cash Equivalents and Marketable Securities
As of both December 31, 2024 and 2023, we had approximately $1.1 billion of cash and cash equivalents, which consisted of available on demand bank deposits and money market funds, with maturities of 90 days or less at the date of purchase, in each case, with major global financial institutions. We had no outstanding investments classified as either short-term or long-term marketable securities as of December 31, 2024 and 2023, respectively, and there were no purchases or sales of any marketable securities during the years ended December 31, 2024, 2023 and 2022.
The following table shows our cash and cash equivalents, which are measured at fair value on a recurring basis and categorized using the fair value hierarchy, as well as their classification on our consolidated balance sheets as of December 31, 2024 and 2023:
| | | | | | | | | | | | | | | | | | | | | | | | |
| | December 31, 2024 | | | December 31, 2023 | |
| | Amortized Cost | | | Fair Value (1) | | | Cash and Cash Equivalents | | | Amortized Cost | | | Fair Value (1) | | | Cash and Cash Equivalents | |
| | (in millions) | |
Cash | | $ | 742 | | | $ | 742 | | | $ | 742 | | | $ | 685 | | | $ | 685 | | | $ | 685 | |
Level 1: | | | | | | | | | | | | | | | | | | |
Money market funds | | | 322 | | | | 322 | | | | 322 | | | | 382 | | | | 382 | | | | 382 | |
Total | | $ | 1,064 | | | $ | 1,064 | | | $ | 1,064 | | | $ | 1,067 | | | $ | 1,067 | | | $ | 1,067 | |
(1)We did not have any unrealized gains and losses related to our cash equivalents.
We generally classify cash equivalents and marketable securities, if any, within Level 1 and Level 2 as we value these financial instruments using quoted market prices (Level 1) or alternative pricing sources (Level 2). The valuation technique we use to measure the fair value of money market funds is derived from quoted prices in active markets for identical assets or liabilities. Fair values for Level 2 investments are considered “Level 2” valuations because they are obtained from independent pricing sources for identical or comparable instruments, rather than direct observations of quoted prices in active markets. Our procedures include controls to ensure that appropriate fair values are recorded, including comparing the fair values obtained from our independent pricing services against fair values obtained from another independent source.
Derivative Financial Instruments
We generally use forward contracts to reduce the effects of foreign currency exchange rate fluctuations on our cash flows for the Euro versus the U.S. Dollar. For the periods ended December 31, 2024, 2023 and 2022, respectively, our forward contracts have not been designated as hedges and generally had maturities of less than 90 days. Our outstanding or unsettled forward contracts were carried at fair value on our consolidated balance sheets at December 31, 2024 and 2023. We measure the fair value of our outstanding or unsettled derivatives using Level 2 fair value inputs, as we use a pricing model that takes into account the contract terms as well as current foreign currency exchange rates in active markets. We recognize any gain or loss resulting from the change in fair value of our forward contracts in other income (expense), net on our consolidated statement of operations. We recorded a net gain of $1 million and $4 million for the years ended December 31, 2024 and 2022, respectively, related to our forward contracts, while this amount was not material for the year ended December 31, 2023.
The following table shows the notional principal amounts of our outstanding derivative instruments for the periods presented:
| | | | | | | | |
| | December 31, 2024 | | | December 31, 2023 | |
| | (in millions) | |
Foreign currency exchange-forward contracts (1)(2) | | $ | 11 | | | $ | 9 | |
(1)Derivative contracts address foreign currency exchange fluctuations for the Euro versus the U.S. dollar. These outstanding derivatives are not designated as hedging instruments and have an original maturity period of 90 days or less.
(2)The fair value of our outstanding derivatives as of December 31, 2024 and 2023, respectively, was not material. The notional amount of a forward contract is the contracted amount of foreign currency to be exchanged and is not recorded on the consolidated balance sheet.
Other Financial Assets and Liabilities
As of December 31, 2024 and 2023, financial instruments not measured at fair value on a recurring basis including accounts payable, accrued expenses and other current liabilities, and deferred merchant payables, were carried at cost on our consolidated balance sheets, which approximates their fair values because of the short-term nature of these items. Accounts receivable, including contract assets as described below, as well as certain other financial assets, are measured at amortized cost and are carried at cost less an allowance for expected credit losses on our consolidated balance sheet to present the net amount expected to be collected.
Accounts Receivable, net
The following table provides information about the opening and closing balances of accounts receivable, including contract assets, net of allowance for expected credit losses, from contracts with customers as of the dates presented:
| | | | | | | | |
| | December 31, 2024 | | | December 31, 2023 | |
| | (in millions) | |
Accounts receivable | | $ | 187 | | | $ | 177 | |
Contract assets | | | 20 | | | | 15 | |
Total | | $ | 207 | | | $ | 192 | |
Contract assets are rights to consideration in exchange for services that we have transferred to a customer when that right is conditional on something other than the passage of time, such as commission payments that are contingent upon the completion of the service by the principal in the transaction. The difference between the opening and closing balances of our contract assets primarily results from the timing difference between when we satisfy our performance obligations and the time when the principal completes the service in the transaction. There were no significant changes in contract assets during the years ended December 31, 2024 and 2023 related to business combinations, impairments, cumulative catch-ups or other material adjustments.
Fair Value of Long-Term Debt
The following table shows the aggregate principal and fair value amount of the 2025 Senior Notes, 2026 Senior Notes, and Term Loan B Facility as of the dates presented, primarily classified as long-term debt on our consolidated balance sheets, and are considered Level 2 fair value measurements. Refer to “Note 8: Debt” for additional information related to our 2025 Senior Notes, 2026 Senior Notes, and Term Loan B Facility.
| | | | | | | | | | | | | | | | | | | | | | | | | | | | | | | | |
| | December 31, 2024 | | | December 31, 2023 | |
| | Principal | | | Unamortized Debt Issuance Costs | | | Carrying Value | | | Fair Value (1) | | | Principal | | | Unamortized Debt Issuance Costs | | | Carrying Value | | | Fair Value (1) | |
| | (in millions) | |
2026 Senior Notes | | $ | 345 | | | $ | (2 | ) | | $ | 343 | | | $ | 323 | | | $ | 345 | | | $ | (3 | ) | | $ | 342 | | | $ | 304 | |
Term Loan B Facility (2) | | | 499 | | | | (6 | ) | | | 493 | | | | 504 | | | | — | | | | — | | | | — | | | | — | |
2025 Senior Notes (2) | | | — | | | | — | | | | — | | | | — | | | | 500 | | | | (3 | ) | | | 497 | | | | 502 | |
(1)We estimate the fair value of the 2025 Senior Notes, 2026 Senior Notes, and Term Loan B Facility based on recently reported market transactions and/or prices for identical or similar financial instruments obtained from a third-party pricing source.
(2)During the third quarter of 2024, the Company issued the $500 million Term Loan B Facility and used these borrowed funds to redeem all $500 million aggregate principal amount of the Company's outstanding 2025 Senior Notes. Refer to “Note 8: Debt” for further information.
The Company did not have any assets or liabilities measured at fair value on a recurring basis using Level 3 unobservable inputs at both December 31, 2024 and 2023.
Assets Measured at Fair Value on a Non-recurring Basis
Non-Marketable Investments
Equity Securities Accounted for under the Equity Method
In November 2019, the Company and Ctrip Investment Holding Ltd, a majority-owned subsidiary of Trip.com Group Limited, entered into an agreement to combine certain assets in China through the creation of a new entity, Chelsea Investment Holding Company PTE, Ltd. Tripadvisor contributed a portion of its business in China, including a long-term exclusive brand and content license and other assets, in return for a 40% equity investment in Chelsea Investment Holding Company PTE Ltd. This investment resulted in the Company recording an initial equity method investment of $41 million and a $39 million deferred income liability attributable to the brand and content license in the fourth quarter of 2019. The Company expects to earn the deferred income ratably over a 15-year period, congruent with the initial term of the brand and content license, which is recorded in other income (expense), net on the consolidated statement of operations.
The Company accounts for this minority investment under the equity method, given it has the ability to exercise significant influence over, but not control, the investee. The carrying value of this minority investment was $28 million and $30 million as of December 31, 2024 and 2023, respectively, and is included in non-marketable investments on our consolidated balance sheets. During each of the years ended December 31, 2024, 2023 and 2022, we recognized a loss of $2 million, representing our share of the investee’s net loss in other income (expenses), net within the consolidated statements of operations. The Company evaluates this investment for impairment when factors indicate that a decline in the value of its investment has occurred and the carrying amount of its investment may not be recoverable. An impairment loss, based on the excess of the carrying value over the estimated fair value of the investment based on Level 3 inputs, is recognized in earnings when an impairment is deemed to be other than temporary. Due to ongoing operating losses, we performed a qualitative assessment to evaluate whether this equity investment is impaired as of December 31, 2024. During the years ended December 31, 2024, 2023 and 2022, respectively, we did not record any impairment loss on this equity investment. The remaining deferred income liability of $26 million is presented in accrued expenses and other current liabilities and other long-term liabilities on our consolidated balance sheet of $3 million and $23 million, respectively, as of December 31, 2024.
The Company has various commercial agreements with Chelsea Investment Holding Company PTE Ltd. and/or its subsidiaries. Transactions under these agreements with the equity method investee are considered related-party transactions, and were not material for the years ended December 31, 2024, 2023 and 2022, respectively.
Other Equity Investments
We also hold a minority investment in equity securities of a privately-held company and does not have a readily determinable fair value. As of both December 31, 2024 and 2023, the total carrying value of this investment was $2 million, and included in non-marketable investments on our consolidated balance sheets.
Our policy is to measure this equity investment at cost less impairment, if any, plus or minus changes resulting from observable price changes in orderly transactions for the identical or a similar investment of the same issuer such observable price changes may include instances where the investee issues equity securities to new investors, thus creating a new indicator of fair value, as an example. On a quarterly basis, we perform a qualitative assessment considering impairment indicators, if any, to evaluate whether this investment is impaired and monitor for any observable price changes. During the years ended December 31, 2024, 2023 and 2022, we did not record any impairment loss on this equity investment or note any observable price change indicators.
Other Long-Term Assets
In June 2020, the Company was issued collateralized notes (the “Notes Receivable”) with a total principal amount of $20 million from a privately-held company, in exchange for an existing equity investment held in the investee by the Company, and other-long term receivables, net, which the Company held due from the same investee. The Company classified the Notes Receivable as held-to-maturity, as the Company has concluded it has the positive intent and ability to hold the Notes Receivable until maturity, with 50% due June 2028 and the remaining 50% due June 2030, or the date on which there is a change in control, whichever is earlier. As of both December 31, 2024 and 2023, the carrying value of the Notes Receivable was $9 million, net of accumulated allowance for credit losses, and is classified in other long-term assets, net on our consolidated balance sheet at amortized cost. On a quarterly basis, we perform a qualitative assessment considering impairment indicators to evaluate whether the Notes Receivable are impaired and monitor for changes to our allowance for expected credit losses.
Other non-financial assets, such as property and equipment, goodwill, intangible assets, and operating lease right-of-use assets are adjusted to fair value when an impairment charge is recognized or the underlying investment is sold. Such fair value measurements, if necessary, are based predominately on Level 3 inputs. Refer to “Note 4: Property and Equipment, Net,” “Note 5: Leases” and “Note 6: Goodwill and Intangibles Assets, Net” for additional information regarding those assets.
NOTE 4: PROPERTY AND EQUIPMENT, NET
Property and equipment, net consists of the following as of the dates presented:
| | | | | | | | |
| | December 31, 2024 | | | December 31, 2023 | |
| | (in millions) | |
Capitalized website development | | $ | 558 | | | $ | 510 | |
Finance lease right-of-use asset (Note 5) | | | 114 | | | | 114 | |
Leasehold improvements | | | 24 | | | | 37 | |
Computer equipment and purchased software | | | 56 | | | | 64 | |
Furniture, office equipment and other | | | 15 | | | | 17 | |
| | | 767 | | | | 742 | |
Less: accumulated depreciation | | | (567 | ) | | | (551 | ) |
Total | | $ | 200 | | | $ | 191 | |
As of December 31, 2024 and 2023, the carrying value of our capitalized website development costs, net of accumulated amortization, was $115 million and $103 million, respectively. For the years ended December 31, 2024, 2023 and 2022, we capitalized $73 million, $66 million and $56 million, respectively, related to website development costs. For the years ended December 31, 2024, 2023 and 2022, we recorded amortization of capitalized website development costs of $59 million, $55 million and $61 million, respectively, which is included in depreciation expense on our consolidated statements of operations. During the year ended December 31, 2024, we retired and subsequently disposed of certain capitalized website development projects, leasehold improvements and computer equipment and purchased software, which were no longer in use and fully depreciated, with a total gross cost and related accumulated depreciation of $54 million.
NOTE 5: LEASES
Operating and finance lease assets and liabilities consist of the following as of the dates presented:
| | | | | | | | | | |
| | | | December 31, | | | December 31, | |
| Presentation on Consolidated Balance Sheet | | 2024 | | | 2023 | |
| | | | (in millions) | |
Noncurrent Lease Assets: | | | | | | | | |
Finance lease | | Property and equipment, net | | $ | 57 | | | $ | 67 | |
Operating lease | | Operating lease right-of-use-assets | | | 17 | | | | 15 | |
| | Total lease assets | | $ | 74 | | | $ | 82 | |
| | | | | | | | |
| | | | | | | | |
Current Lease Liabilities: | | | | | | | | |
Finance lease | | Accrued expenses and other current liabilities | | $ | 7 | | | $ | 6 | |
Operating lease | | Accrued expenses and other current liabilities | | | 6 | | | | 10 | |
| | Total current lease liabilities | | | 13 | | | | 16 | |
| | | | | | | | |
Noncurrent Lease Liabilities: | | | | | | | | |
Finance lease | | Finance lease liability, net of current portion | | | 43 | | | | 51 | |
Operating lease | | Operating lease liabilities, net of current portion | | | 11 | | | | 6 | |
| | Total noncurrent lease liabilities | | | 54 | | | | 57 | |
| | | | | | | | |
| | Total lease liabilities | | $ | 67 | | | $ | 73 | |
As of December 31, 2024, we did not have any additional operating or finance leases that have not yet commenced but that create significant rights and obligations for us.
The components of lease expense were as follows for the periods presented:
| | | | | | | | | | | | |
| | Year ended December 31, | |
| | 2024 | | | 2023 | | | 2022 | |
| (in millions) | | | | | | | |
Operating lease cost (1) | | $ | 14 | | | $ | 17 | | | $ | 19 | |
Finance lease cost: | | | | | | | | | |
Amortization of right-of-use assets (2) | | $ | 10 | | | $ | 10 | | | $ | 10 | |
Interest on lease liabilities (3) | | | 2 | | | | 3 | | | | 3 | |
Total finance lease cost | | $ | 12 | | | $ | 13 | | | $ | 13 | |
Sublease income (1) | | | (3 | ) | | | (5 | ) | | | (9 | ) |
Total lease cost, net | | $ | 23 | | | $ | 25 | | | $ | 23 | |
(1)Operating lease costs, net of sublease income, are included within operating expenses in our consolidated statements of operations.
(2)Amount is included in depreciation expense in our consolidated statements of operations.
(3)Amount is included in interest expense in our consolidated statements of operations.
Additional information related to our leases is as follows for the periods presented:
| | | | | | | | | | | | |
| | Year ended December 31, | |
| 2024 | | | 2023 | | | 2022 | |
Supplemental Cash Flows Information: | | (in millions) | | | | | | | |
Cash paid for amounts included in the measurement of lease liabilities: | | | | | | | | | |
Operating cash outflows from operating leases | | $ | 12 | | | $ | 17 | | | $ | 22 | |
Operating cash outflows from finance lease | | | 2 | | | | 4 | | | | 3 | |
Financing cash outflows from finance lease | | | 7 | | | | 8 | | | | 6 | |
| | | | | | | | | |
Right-of-use assets obtained in exchange for lease liabilities: | | | | | | | | | |
Operating leases | | $ | 13 | | | $ | 4 | | | $ | 2 | |
| | | | | | | | |
| | Year ended December 31, | |
| | 2024 | | | 2023 | |
Weighted-average remaining lease term: | | | | | | |
Operating leases | | 5.1 years | | | 2.0 years | |
Finance lease | | 6.0 years | | | 7.0 years | |
| | | | | | |
Weighted-average discount rate: | | | | | | |
Operating leases | | | 5.5 | % | | | 4.1 | % |
Finance lease | | | 4.5 | % | | | 4.5 | % |
Future lease payments under non-cancelable leases as of December 31, 2024 were as follows:
| | | | | | | | |
Year Ending December 31, | | Operating Leases | | | Finance Lease | |
| | (in millions) | | | | |
2025 | | $ | 7 | | | $ | 10 | |
2026 | | | 4 | | | | 10 | |
2027 | | | 2 | | | | 10 | |
2028 | | | 2 | | | | 9 | |
2029 | | | 1 | | | | 9 | |
Thereafter | | | 4 | | | | 9 | |
Total future lease payments | | | 20 | | | | 57 | |
Less imputed interest | | | (3 | ) | | | (7 | ) |
Total lease liabilities | | $ | 17 | | | $ | 50 | |
NOTE 6: GOODWILL AND INTANGIBLE ASSETS, NET
Goodwill
The following table summarizes our goodwill activity by reportable segment for the periods presented:
| | | | | | | | | | | | | | | | |
| | Brand Tripadvisor | | | Viator | | | TheFork | | | Total | |
| | (in millions) | |
Balance as of December 31, 2022 | | $ | 599 | | | $ | 119 | | | $ | 104 | | | $ | 822 | |
Foreign currency translation adjustments | | | 2 | | | | 1 | | | | 4 | | | | 7 | |
Balance as of December 31, 2023 | | $ | 601 | | | $ | 120 | | | $ | 108 | | | $ | 829 | |
Foreign currency translation adjustments | | | — | | | | (3 | ) | | | (12 | ) | | | (15 | ) |
Balance as of December 31, 2024 | | $ | 601 | | | $ | 117 | | | $ | 96 | | | $ | 814 | |
There were no goodwill impairment charges recognized on our consolidated statements of operations during the years ended December 31, 2024, 2023, or 2022. Refer to “Note 2: Significant Accounting Policies” for discussion regarding the Company’s 2024 goodwill impairment assessment. As of both December 31, 2024 and 2023, accumulated goodwill impairment losses totaled $3 million, which was associated with the Brand Tripadvisor segment.
Intangibles
Intangible assets, acquired in business combinations and recorded at fair value on the date of purchase, consisted of the following as of the dates presented:
| | | | | | | | |
| | December 31, | |
| | 2024 | | | 2023 | |
| | (in millions) | |
Intangible assets with definite lives | | $ | 195 | | | $ | 221 | |
Less: accumulated amortization | | | (189 | ) | | | (208 | ) |
Intangible assets with definite lives, net | | | 6 | | | | 13 | |
Intangible assets with indefinite lives (1) | | | 30 | | | | 30 | |
Total | | $ | 36 | | | $ | 43 | |
(1)Indefinite-lived intangible assets include trade names and trademarks for Brand Tripadvisor.
Amortization expense for definite-lived intangible assets was $6 million, $9 million, and $13 million, for the years ended December 31, 2024, 2023 and 2022, respectively.
There were no impairment charges recognized to our consolidated statements of operations for the years ended December 31, 2024, 2023 and 2022 related to our intangible assets. Refer to “Note 2: Significant Accounting Policies” for discussion regarding the Company’s 2024 indefinite-lived intangible impairment assessment.
The following table presents the components of our intangible assets with definite lives as of the dates presented:
| | | | | | | | | | | | | | | | | | | | | | | | | | | | |
| | | | | December 31, 2024 | | | December 31, 2023 | |
| | Weighted Average | | | Gross | | | | | | Net | | | Gross | | | | | | Net | |
| | Remaining Life | | | Carrying | | | Accumulated | | | Carrying | | | Carrying | | | Accumulated | | | Carrying | |
| | (in years) | | | Amount | | | Amortization | | | Amount | | | Amount | | | Amortization | | | Amount | |
| | | | | (in millions) | | | (in millions) | |
Trade names and trademarks | | | — | | | $ | 44 | | | $ | (44 | ) | | $ | — | | | $ | 48 | | | $ | (45 | ) | | $ | 3 | |
Customer lists and supplier relationships | | | 2.9 | | | | 89 | | | | (84 | ) | | | 5 | | | | 97 | | | | (90 | ) | | | 7 | |
Subscriber relationships | | | — | | | | 22 | | | | (22 | ) | | | — | | | | 34 | | | | (33 | ) | | | 1 | |
Technology and other | | | 0.9 | | | | 40 | | | | (39 | ) | | | 1 | | | | 42 | | | | (40 | ) | | | 2 | |
Total | | | 2.5 | | | $ | 195 | | | $ | (189 | ) | | $ | 6 | | | $ | 221 | | | $ | (208 | ) | | $ | 13 | |
Our definite-lived intangible assets are being amortized on a straight-line basis. The straight-line method of amortization is currently our best estimate, or approximates to date, the distribution of the economic use of these intangible assets.
The estimated amortization expense for intangible assets with definite lives for each of the next five years, and the expense thereafter, assuming no subsequent impairment of the underlying assets or change in estimate of remaining lives, is expected to be as follows (in millions):
| | | | |
2025 | | $ | 3 | |
2026 | | | 2 | |
2027 | | | 1 | |
2028 | | | — | |
2029 | | | — | |
2030 and thereafter | | | — | |
Total | | $ | 6 | |
NOTE 7: ACCRUED EXPENSES AND OTHER CURRENT LIABILITIES
Accrued expenses and other current liabilities consisted of the following as of the dates presented:
| | | | | | | | |
| | December 31, 2024 | | | December 31, 2023 | |
| | (in millions) | |
Accrued salary, bonus, and other employee-related benefits | | $ | 74 | | | $ | 70 | |
Accrued marketing costs | | | 67 | | | | 67 | |
Interest payable (1) | | | 1 | | | | 17 | |
Finance lease liability - current portion (2) | | | 7 | | | | 6 | |
Operating lease liabilities - current portion (2) | | | 6 | | | | 10 | |
Non-income taxes payable (3) | | | 18 | | | | 16 | |
Accrued legal contingencies (4) | | | 10 | | | | — | |
Restructuring and other related reorganization costs (5) | | | 5 | | | | 13 | |
Other | | | 61 | | | | 53 | |
Total | | $ | 249 | | | $ | 252 | |
(1)Amount for the year ended December 31, 2023 relates primarily to interest accrued on our 2025 Senior Notes. Refer to “Note 8: Debt” for further information.
(2)Refer to “Note 5: Leases” for further information regarding our lease obligations.
(3)Amount relates primarily to digital service taxes.
(4)Refer to “Note 11: Commitments and Contingencies” for further information.
(5)The following table summarizes our restructuring and other related reorganization costs for the periods presented:
| | | | | | | | | | | | |
| | Employee Severance and Benefits | | | Other (2) | | | Total | |
| | (in millions) | |
Accrued liability as of December 31, 2022 | | $ | — | | | $ | — | | | $ | — | |
Charges (1) | | | 22 | | | | — | | | | 22 | |
Payments | | | (9 | ) | | | — | | | | (9 | ) |
Accrued liability as of December 31, 2023 | | $ | 13 | | | $ | — | | | $ | 13 | |
Charges (2) | | | 3 | | | | 18 | | | | 21 | |
Payments | | | (11 | ) | | | (18 | ) | | | (29 | ) |
Accrued liability as of December 31, 2024 | | $ | 5 | | | $ | — | | | $ | 5 | |
(1)During the third quarter of 2023, the Company approved and subsequently initiated a set of actions across its businesses in order to reduce its cost structure, improve operational efficiencies, and realign its workforce with its strategic initiatives. These actions taken by the Company resulted in reduced global headcount. As a result, the Company incurred estimated pre-tax restructuring and other related reorganization costs of $22 million during the year ended December 31, 2023, consisting of employee severance and related benefits. We expect the majority of remaining unpaid costs as of December 31, 2024 to be disbursed during the first quarter of 2025.
(2)During the fourth quarter of 2024, the Company approved and subsequently initiated a set of actions across its businesses in order to reduce its cost structure, improve operational efficiencies, and realign its workforce with its strategic initiatives. As a result, the Company incurred and paid a one-time contract termination fee to a third-party professional services firm of $18 million within its Brand Tripadvisor segment. In addition, these actions also included estimated pre-tax restructuring and other related reorganization costs of $3 million during the three months ended December 31, 2024, which consisted of employee severance and related benefits, and expect to be paid during the first quarter of 2025.
NOTE 8: DEBT
The Company’s outstanding debt consisted of the following as of the dates presented:
| | | | | | | | |
| | December 31, 2024 | | | December 31, 2023 | |
| | (in millions) | |
Short-term debt: | | | | | | |
Term Loan B Facility | | $ | 5 | | | $ | — | |
Total short-term debt | | $ | 5 | | | $ | — | |
| | | | | | |
Long-term debt: | | | | | | |
Term Loan B Facility due 2031 | | $ | 494 | | | $ | — | |
0.25% Convertible 2026 Senior Notes due 2026 | | | 345 | | | | 345 | |
7.00% 2025 Senior Notes due 2025 | | | — | | | | 500 | |
Unamortized Debt Issuance Costs | | | (8 | ) | | | (6 | ) |
Total long-term debt | | $ | 831 | | | $ | 839 | |
Credit Agreement
We are party to a credit agreement with a group of lenders initially entered into in June 2015 and, amended and restated in June 2023 (the “Credit Agreement”), which, among other things, provides for a $500 million secured revolving credit facility (the “Credit Facility”). The Credit Facility has a maturity date of June 29, 2028 (unless, on any date that is 91 days prior to the final scheduled maturity date in respect of any indebtedness outstanding under certain “specified debt,” the aggregate outstanding principal amount of such specified debt is $200 million or more, then the maturity date will be such business day). On July 8, 2024, the Company entered into the First Amendment
to its Credit Agreement (the “Amended Credit Agreement”), which implements the Term Loan B Facility (discussed below); and among other things:
•Does not change the aggregate amount of revolving commitments available at $500 million related to our Credit Facility;
•Makes certain adjustments to the definition of “Consolidated EBITDA”;
•Increases the Available Amount by the portion of excess cash flow and asset sale, casualty and condemnation mandatory prepayments declined by lenders under the Term Loan B Facility, which may be used to make restricted payments and investments;
•Adds a separate dollar basket not to exceed the greater of $195 million and 50% of Consolidated EBITDA for capital leases and purchase money debt;
•Adds a separate “ratio debt” basket for additional indebtedness up to 3.5 times pro forma Total Net Leverage Ratio, subject to certain customary limitations; and
•Adds customary extension and modification and refinancing facility provisions.
The Amended Credit Agreement includes certain customary restrictions on the ability of the Company and its subsidiaries to, among other things, incur additional indebtedness, grant additional liens, and make investments, acquisitions, dispositions, distributions, and other payments, with certain exceptions as more specifically described in the Amended Credit Agreement. The Amended Credit Agreement contains customary events of default and modifies the cross-default provision so that the Term Loan B Facility includes a customary cross-acceleration event of default with the Credit Facility under the Amended Credit Agreement. If an event of default occurs and is continuing, then, among other things, the lenders under the Credit Facility and/or the Term Loan B Facility, as applicable, may declare any outstanding Credit Facility and/or Term Loan B Facility obligations, as applicable, under the Amended Credit Agreement to be immediately due and payable and exercise their rights and remedies against the collateral. The obligations under the Amended Credit Agreement are secured by substantially all assets, whether personal, tangible or intangible, of the Company and the Subsidiary Loan Parties as granted under the Security Documents. Any term not otherwise defined herein shall have the meaning ascribed to it in the Amended Credit Agreement.
Credit Facility
As of December 31, 2024 and 2023, we had no outstanding borrowings from the Credit Facility. The Credit Facility also includes $15 million of borrowing capacity available for letters of credit and $40 million for swing-line borrowings on same-day notice. As of December 31, 2024 and 2023, we had issued $3 million and $4 million, respectively, of undrawn standby letters of credit under the Credit Facility. For the years ended December 31, 2024, 2023 and 2022, we recorded total commitment fees on the Credit Facility of $1 million to interest expense on our consolidated statements of operations. The Amended Credit Agreement, among other things, requires us to maintain a maximum total net leverage ratio of 4.5 to 1.0 solely in respect to the Credit Facility and contains certain customary affirmative and negative covenants and events of default, including a change of control. As of December 31, 2024 and 2023, the Company was in compliance with its existing covenants.
The Company may borrow from the Credit Facility in U.S. dollars, Euros and Sterling. Borrowings under the Credit Facility generally bear interest, at the Company’s option, at a rate per annum equal to either (i) the Adjusted Term SOFR rate for the interest period in effect for such borrowing in U.S. dollars, the EURIBO rate for the interest period in effect for such borrowings in Euro and the Daily Simple SONIA rate for the interest period in effect for such borrowings in Sterling; plus, in each case, an applicable margin ranging from 1.75% to 2.50% (“Term Benchmark/RFP Spread”), based on the Company’s total net leverage ratio; or (ii) the Alternate Base Rate (“ABR”), which is the greatest of (a) the Prime Rate in effect on such day, (b) the New York Fed Bank Rate in effect on such day plus 1/2 of 1.00% per annum, and (c) the Adjusted Term SOFR for an interest period of one month as published two US Government Securities Business Days prior to such day (or if such day is not a US Government Securities Business Day, the immediately preceding US Government Securities Business Day) plus 1.00% plus an applicable margin ranging from 0.75% to 1.50%, based on the Company’s total net leverage ratio. In addition, we are required to pay a quarterly commitment fee, at an applicable rate ranging from 0.25% to 0.40%, on the daily unused portion of the Credit Facility for each fiscal quarter and in connection with the issuance of letters of credit. As of
December 31, 2024, our unused revolver capacity was subject to a commitment fee of 0.25%, given the Company’s total net leverage ratio.
In connection with the Amended Credit Agreement, we incurred lender fees and other debt financing costs of $1 million under the Credit Facility. These costs were capitalized as deferred financing costs in other long-term assets on our consolidated balance sheet as of December 31, 2024. As of both December 31, 2024 and 2023, the Company had $4 million remaining in deferred financing costs in connection with the Credit Facility. These costs will be amortized over the remaining term of the Credit Facility, using the effective interest rate method, and recorded to interest expense on our consolidated statement of operations.
There is no specific repayment date prior to the maturity date for any borrowings under the Amended Credit Agreement. We may voluntarily repay any outstanding borrowing under the Credit Facility at any time without premium or penalty, other than customary breakage costs with respect to Term Benchmark loans. Additionally, the Company believes that the likelihood of the lender exercising any subjective acceleration rights, which would permit the lenders to accelerate repayment of any outstanding borrowings, is remote. As such, we intend to classify any future borrowings under this facility as long-term debt.
Term Loan B Facility
On July 8, 2024, under the Amended Credit Agreement, the Company issued a $500 million Term Loan B Facility maturing July 8, 2031, with an interest rate based on secured overnight financing rate ("SOFR") plus 2.75%. On July 15, 2024, the Company used these borrowed funds to fully redeem its outstanding 2025 Senior Notes. As of December 31, 2024, the interest rate on the Term Loan B Facility was 7.11% and the weighted-average interest rate on the Term Loan B Facility was 7.74% for the year ended December 31, 2024. The Term Loan B Facility was offered at 99.75% of par and is required to be paid down at 1.00% of the aggregate principal amount per year, repayable in quarterly installments on the last day of each calendar quarter, commencing December 31, 2024, equal to 0.25% of the original principal amount with the balance due on the maturity date. Principal payments of $1 million were made during the year ended December 31, 2024. The Term Loan B Facility has no financial covenants.
In connection with the issuance of the Term Loan B Facility, we incurred $7 million of debt issuance costs, comprised of the initial purchasers’ discount, lender fees, and other debt financing costs. These debt issuance costs will be amortized over the remaining term of the Term Loan B Facility, using the effective interest rate method, and recorded to interest expense on our consolidated statement of operations. As of December 31, 2024, unpaid interest on the Term Loan B Facility was not material and $19 million was recorded as interest expense on our consolidated statement of operations during the year ended December 31, 2024.
2025 Senior Notes
On July 15, 2024, as noted above, the Company redeemed all $500 million aggregate principal amount of the Company’s outstanding 2025 Senior Notes, in addition to the settlement of accrued and unpaid interest. As a result, we recognized a loss on extinguishment of debt of $2 million, which primarily consisted of a non-cash write-off of unamortized debt issuance costs, and is included in Other income (expense), net on our consolidated statement of operations the year ended December 31, 2024.
As of December 31, 2023, unpaid interest on our 2025 Senior Notes was $16 million and was included in accrued expenses and other current liabilities on our consolidated balance sheets. During the years ended December 31, 2024, 2023 and 2022, we recorded $19 million, $35 million, and $35 million of interest expense, respectively, on our consolidated statements of operations.
2026 Senior Notes
On March 25, 2021, we entered into a purchase agreement for the sale of $345 million aggregate principal amount of 0.25% Convertible 2026 Senior Notes due 2026 (the “2026 Senior Notes”) in a private offering to qualified institutional buyers. The terms of the 2026 Senior Notes are governed by an Indenture, dated March 25, 2021 (the “2026 Indenture”), among the Company, the guarantors party thereto and the trustee. The 2026 Senior
Notes mature on April 1, 2026, unless earlier converted, redeemed or repurchased. The 2026 Senior Notes are senior unsecured obligations of the Company, although guaranteed by certain of the Company’s domestic subsidiaries, with interest payable semiannually in arrears on April 1 and October 1 of each year. As of December 31, 2024 and 2023, unpaid interest on our 2026 Senior Notes was not material.
The 2026 Senior Notes are redeemable, in whole or in part, at our option at any time, and from time to time, beginning after April 1, 2024 and on or before the 30th scheduled trading day immediately before the maturity date, at a cash redemption price equal to the principal amount of the 2026 Senior Notes to be redeemed, plus accrued and unpaid interest, if any, but only if the last reported sale price per share of our common stock exceeds 130% of the conversion price on (1) each of at least 20 trading days, whether or not consecutive, during the 30 consecutive trading days ending on, and including, the trading day immediately before the date we send the related redemption notice; and (2) the trading day immediately before the date we send such notice. In addition, calling any such note for redemption will constitute a make-whole fundamental change with respect to that note, in which case the conversion rate applicable to the conversion of that note will be increased in certain circumstances if it is converted after it is called for redemption.
The 2026 Senior Notes are unconditionally guaranteed, on a joint and several basis, by the guarantors on a senior, unsecured basis. The 2026 Senior Notes are our general senior unsecured obligations and rank equally in right of payment with all of our existing and future senior indebtedness, and senior in right of payment to all of our future subordinated indebtedness. The 2026 Senior Notes will be effectively subordinated to any of our existing and future secured indebtedness, including borrowings under the Amended Credit Agreement, to the extent of the value of the assets securing such indebtedness.
Holders may convert their 2026 Senior Notes at any time prior to the close of business on the business day immediately preceding January 1, 2026, in multiples of $1,000 principal amount, only under the following conditions and circumstances:
•during any calendar quarter commencing after the calendar quarter ending on June 30, 2021 (and only during such calendar quarter), if the last reported sale price of our common stock for at least 20 trading days (whether or not consecutive) during the period of 30 consecutive trading days ending on the last trading day of the immediately preceding calendar quarter is greater than or equal to 130% of the conversion price on each applicable trading day;
•during the five business day period after any five consecutive trading day period (the “measurement period”) in which the trading price per $1,000 principal amount of 2026 Senior Notes for each trading day of the measurement period was less than 98% of the product of the last reported sale price of our common stock and the conversion rate on each such trading day; or
•upon the occurrence of specified corporate events as described in the 2026 Indenture.
In addition, holders may convert their 2026 Senior Notes, in multiples of $1,000 principal amount, at their option at any time beginning on or after January 1, 2026, and prior to the close of business on the second scheduled trading day immediately preceding the stated maturity date of the 2026 Senior Notes, without regard to the foregoing circumstances.
The initial conversion rate for the 2026 Senior Notes is 13.5483 shares of common stock per $1,000 principal amount of 2026 Senior Notes, which is equivalent to an initial conversion price of approximately $73.81 per share of common stock, or approximately 4.7 million shares of common stock, subject to adjustment upon the occurrence of certain specified events as set forth in the 2026 Indenture. Upon conversion, the Company may choose to pay or deliver, as the case may be, cash, shares of common stock or a combination of cash and shares of common stock.
The Company accounts for the 2026 Senior Notes as a liability measured at its amortized cost, and no other features of the 2026 Senior Notes are bifurcated and recognized as a derivative. The proceeds from the issuance of the 2026 Senior Notes were approximately $340 million, net of debt issuance costs of $5 million comprised primarily of the initial purchasers’ discount, and the Company used a portion of the proceeds from the 2026 Senior Notes to enter into capped call transactions, as discussed below. The Company intends to use the remainder of the proceeds from this offering for general corporate purposes, which may include repayment of debt. The debt issuance
costs are being amortized over the remaining term of the 2026 Senior Notes, using the effective interest rate method, and recorded to interest expense on our consolidated statement of operations. During the years ended December 31, 2024, 2023 and 2022, our effective interest rate on our 2026 Senior Notes, including debt issuance costs, was approximately 0.33%, 0.40% and 0.47%, respectively, and $1 million was recorded as interest expense on our consolidated statements of operations for each of the years ended December 31, 2024, 2023 and 2022.
The 2026 Senior Notes do not contain any financial covenants, restrictions on dividends, incurrence of senior debt or other indebtedness, or restrictions on the issuance or repurchase of securities by the Company.
Capped Call Transactions
In connection with the issuance of the 2026 Senior Notes, the Company entered into privately negotiated capped call transactions (the “Capped Calls”) with certain of the initial purchasers of the 2026 Senior Notes and/or their respective affiliates and/or other financial institutions (the “Option Counterparties”) at a cost of approximately $35 million. The Capped Calls are separate transactions entered into by the Company with each of the Option Counterparties, and are not part of the terms of the 2026 Senior Notes and therefore will not affect any noteholder’s rights under the 2026 Senior Notes. Noteholders will not have any rights with respect to the Capped Calls.
The Capped Calls cover, subject to anti-dilution adjustments, substantially similar to those applicable to the conversion rate of the 2026 Senior Notes, the number of shares of common stock initially underlying the 2026 Senior Notes, or up to approximately 4.7 million shares of our common stock. The Capped Calls are expected generally to reduce potential dilution to the common stock upon any conversion of 2026 Senior Notes and/or offset any potential cash payments the Company is required to make in excess of the principal amount of such converted 2026 Senior Notes, as the case may be, with such reduction and/or offset subject to a cap. The strike price of the Capped Calls is $73.81, while the cap price of the Capped Calls will initially be $107.36 per share of our common stock, which represents a premium of 100% over the close price of our common stock of $53.68 per share on March 22, 2021 and is subject to certain customary adjustments under the terms of the Capped Calls.
The Capped Calls are considered indexed to our own stock and are considered equity classified under GAAP, and were recorded as a reduction to additional paid-in-capital within stockholders’ equity on our consolidated balance sheet when the Capped Calls were purchased in March 2021. The Capped Calls are not accounted for as derivatives and their fair value is not remeasured each reporting period. In addition, upon entering into the Capped Calls we recorded an associated deferred tax asset of $9 million, as we made an income tax election allowable under the IRS regulations in order to recover the cost of the Capped Calls as interest expense for income tax purposes only over the term of the 2026 Senior Notes.
NOTE 9: OTHER LONG-TERM LIABILITIES
Other long-term liabilities consisted of the following as of the dates presented:
| | | | | | | | |
| | December 31, 2024 | | | December 31, 2023 | |
| | (in millions) | |
Unrecognized tax benefits (1) | | $ | 78 | | | $ | 153 | |
Deferred gain on equity method investment (2) | | | 23 | | | | 25 | |
Long-term income taxes payable (3) | | | — | | | | 15 | |
Other | | | 3 | | | | 4 | |
Total | | $ | 104 | | | $ | 197 | |
(1)Refer to “Note 10: Income Taxes” for information regarding our unrecognized tax benefits. Amounts include accrued interest related to this liability.
(2)Amount relates to long-term portion of a deferred income liability recorded as a result of an equity method investment. Refer to “Note 3: Financial Instruments and Fair Value Measurements” for additional information.
(3)Amount relates to the long-term portion of transition tax payable related to the Tax Cuts and Jobs Act of 2017 (the “2017 Tax Act”), which was reclassified to current income taxes payable on our consolidated balance sheet during 2024.
NOTE 10: INCOME TAXES
The following table presents a summary of our domestic and foreign income (loss) before income taxes for the periods presented:
| | | | | | | | | | | | |
| | Year Ended December 31, | |
| | 2024 | | | 2023 | | | 2022 | |
| | (in millions) | |
Domestic | | $ | 61 | | | $ | 95 | | | $ | 37 | |
Foreign | | | 26 | | | | 30 | | | | 30 | |
Income (loss) before income taxes | | $ | 87 | | | $ | 125 | | | $ | 67 | |
The components of our provision (benefit) for income taxes consisted of the following for the periods presented:
| | | | | | | | | | | | |
| | Year Ended December 31, | |
| | 2024 | | | 2023 | | | 2022 | |
| | (in millions) | |
Current income tax expense (benefit): | | | | | | | | | |
Federal | | $ | 129 | | | $ | 94 | | | $ | 37 | |
State | | | 29 | | | | 25 | | | | 3 | |
Foreign | | | (62 | ) | | | 21 | | | | 26 | |
Current income tax expense (benefit) | | | 96 | | | | 140 | | | | 66 | |
Deferred income tax expense (benefit): | | | | | | | | | |
Federal | | | (13 | ) | | | (9 | ) | | | (19 | ) |
State | | | 2 | | | | 6 | | | | 1 | |
Foreign | | | (3 | ) | | | (22 | ) | | | (1 | ) |
Deferred income tax expense (benefit) | | | (14 | ) | | | (25 | ) | | | (19 | ) |
Provision (benefit) for income taxes | | $ | 82 | | | $ | 115 | | | $ | 47 | |
The significant components of our deferred tax assets and deferred tax liabilities consisted of the following as of the dates presented:
| | | | | | | | |
| | December 31, | |
| | 2024 | | | 2023 | |
| | (in millions) | |
Deferred tax assets: | | | | | | |
Stock-based compensation | | $ | 9 | | | $ | 14 | |
Net operating loss carryforwards | | | 93 | | | | 96 | |
Provision for accrued expenses | | | 10 | | | | 8 | |
Lease financing obligation | | | 12 | | | | 13 | |
Foreign advertising spend | | | 13 | | | | 14 | |
Tax credit carryforward | | | 8 | | | | 10 | |
Capitalized research expenses | | | 71 | | | | 52 | |
Interest carryforward | | | 40 | | | | 32 | |
Other | | | 8 | | | | 14 | |
Total deferred tax assets | | $ | 264 | | | $ | 253 | |
Less: valuation allowance | | | (106 | ) | | | (106 | ) |
Net deferred tax assets | | $ | 158 | | | $ | 147 | |
Deferred tax liabilities: | |
| | |
| |
Intangible assets | | $ | (42 | ) | | $ | (42 | ) |
Property and equipment | | | (2 | ) | | | (3 | ) |
Prepaid expenses | | | (3 | ) | | | (4 | ) |
Building - corporate headquarters | | | (10 | ) | | | (12 | ) |
Other | | | (1 | ) | | | (1 | ) |
Total deferred tax liabilities | | $ | (58 | ) | | $ | (62 | ) |
Net deferred tax asset (liability) | | $ | 100 | | | $ | 85 | |
At December 31, 2024, we had U.S. federal, state, and foreign net operating loss carryforwards (“NOLs”) of approximately $2 million, $49 million, and $354 million, respectively. U.S. federal NOLs of $2 million expire at various times starting from 2029. State NOLs of $9 million may be carried forward indefinitely, while the remaining state NOLs of $40 million expire at various times starting from 2030. Foreign NOLs of $342 million may be carried forward indefinitely, while the remaining foreign NOLs of $12 million expire at various times starting from 2025.
As of December 31, 2024, we had a valuation allowance of approximately $106 million related to certain foreign NOLs carryforwards and other foreign deferred tax assets for which it is more likely than not, the tax benefit will not be realized.
Except for such foreign NOLs and other foreign deferred tax assets, discussed above, we expect to realize all of our deferred tax assets. Due to economic uncertainty and global inflationary pressures, we will continue to monitor our financial performance to determine if the valuation allowance against our deferred tax assets may be necessary in the future.
A reconciliation of the provision (benefit) for income taxes to the amounts computed by applying the statutory federal income tax rate to income (loss) before income taxes is as follows for the periods presented:
| | | | | | | | | | | | |
| | Year Ended December 31, | |
| | 2024 | | | 2023 | | | 2022 | |
| | (in millions) | |
Income tax expense at the federal statutory rate | | $ | 18 | | | $ | 26 | | | $ | 14 | |
State income taxes, net of effect of federal tax benefit | | | 5 | | | | 6 | | | | 5 | |
Unrecognized tax benefits and related interest | | | 4 | | | | 27 | | | | 17 | |
IRS audit settlements | | | 42 | | | | 31 | | | | — | |
Additional IRS audit impacts (1) | | | 6 | | | | — | | | | — | |
Transfer pricing reserve adjustment | | | (4 | ) | | | 24 | | | | — | |
FDII, GILTI and other provisions | | | (7 | ) | | | (9 | ) | | | (2 | ) |
Research tax credit | | | (6 | ) | | | (4 | ) | | | (2 | ) |
Stock-based compensation | | | 15 | | | | 22 | | | | 11 | |
Change in valuation allowance | | | (1 | ) | | | (6 | ) | | | 5 | |
Executive compensation | | | 4 | | | | 2 | | | | 1 | |
Other, net | | | 6 | | | | (4 | ) | | | (2 | ) |
Provision (benefit) for income taxes | | $ | 82 | | | $ | 115 | | | $ | 47 | |
(1)Amount relates to incremental interest associated with the 2009 through 2011 tax years IRS audit period with Expedia. See below for further information regarding this IRS audit settlement.
Due to the one-time transition tax on the deemed repatriation of undistributed foreign subsidiary earnings and profits in 2017, the majority of previously unremitted earnings have been subjected to U.S. federal income tax. To the extent future distributions from these subsidiaries will be taxable, a deferred tax liability has been accrued which was not material as of December 31, 2024. As of December 31, 2024, $582 million of our cumulative undistributed foreign earnings were no longer considered to be indefinitely reinvested.
Tripadvisor continues to be subject to certain post Spin-Off obligations under the Tax Sharing Agreement, whereby Tripadvisor is generally required to indemnify Expedia for any taxes resulting from the Spin-Off to the extent such amounts resulted from (i) any act or failure to act by Tripadvisor described in the covenants in the tax sharing agreement, (ii) any acquisition of Tripadvisor equity securities or assets or those of a member of the Tripadvisor group; or (iii) any failure of the representations with respect to Tripadvisor or any member of our group to be true or any breach by Tripadvisor or any member of the Tripadvisor group of any covenant, in each case, which is contained in the separation documents or in the documents relating to the IRS private letter ruling and/or the opinion of counsel.
We are currently under examination by the IRS for the 2018 tax year and have various ongoing audits for foreign and state income tax returns. These examinations may lead to proposed or ordinary course adjustments to our taxes. We are no longer subject to tax examinations by tax authorities for years prior to 2018. As of December 31, 2024, no material assessments have resulted, except as noted below regarding our 2009, 2010, and 2011 IRS audit with Expedia, our 2014 through 2016 standalone IRS audit, and our 2012 through 2016 HM Revenue & Customs (“HMRC”) audit.
As previously disclosed, we received Notices of Proposed Adjustments ("NOPA") from the IRS for the 2014 through 2016 tax years relating to certain transfer pricing arrangements with our foreign subsidiaries. In response, we requested competent authority assistance under the Mutual Agreement Procedure (“MAP”) for the 2014 through 2016 tax years. In January 2024, we received notification of a MAP resolution agreement for the 2014 through 2016 tax years, which we accepted in February 2024. During the year ended December 31, 2024, we recorded an income tax expense of $42 million, inclusive of interest, related to this settlement on our consolidated statement of operations and during the first quarter of 2024, we reviewed the impact of the acceptance of this settlement to our existing transfer pricing income tax reserves for the subsequent open tax years, which resulted in an income tax benefit, inclusive of estimated interest, of $4 million. Additionally, in connection with this IRS audit settlement: (i) during the second quarter of 2024, we made a payment to the IRS of $141 million, inclusive of estimated interest,
(ii) during the second half of 2024, we made various state tax payments totaling $26 million, inclusive of estimated interest, and (iii) during the fourth quarter of 2024, we received a competent authority refund of $42 million, inclusive of net interest income, from a foreign jurisdiction. This IRS audit settlement resulted in total net operating cash outflow during 2024 of $105 million, which includes federal tax benefits from these payments of $20 million. As of December 31, 2024, there are no remaining outstanding payments or refunds due related to this IRS audit settlement.
As of December 31, 2023, we had recorded $153 million of unrecognized tax benefits, inclusive of interest, classified as other long-term liabilities on our consolidated balance sheet. As a result of our acceptance of the MAP resolution agreement with the IRS for the 2014 through 2016 tax years, and its impact on other ongoing IRS audits, as described above, we reduced this unrecognized tax benefits liability by $79 million during the first quarter of 2024 by reclassifying the balance to current income taxes payable, representing a short-term payment obligation to the IRS, which was subsequently paid during the second quarter of 2024, as noted above.
In addition, as previously disclosed, we received a NOPA from the IRS for the 2009 through 2011 tax years relating to certain transfer pricing arrangements with our foreign subsidiaries. In response, we requested competent authority assistance under MAP for the 2009 through 2011 tax years. In January 2023, we received notification of a MAP resolution agreement for the 2009 through 2011 tax years, which we accepted in February 2023. In the first quarter of 2023, we recorded additional income tax expense of $31 million, inclusive of interest. During the first quarter of 2023, we reviewed the impact of the acceptance of this settlement position against our existing transfer pricing income tax reserves for the subsequent open tax years, which resulted in incremental income tax expense, inclusive of estimated interest, of $24 million. The total impact of these two adjustments resulted in an incremental income tax expense of $55 million recorded in the first quarter of 2023. Additionally, in connection with this IRS audit settlement: (i) during the second quarter of 2023, we made a U.S. federal tax payment of $113 million, inclusive of interest, to Expedia related to this IRS audit settlement, pursuant to the Tax Sharing Agreement with Expedia, and (ii) during the third quarter of 2023, we received a competent authority refund of $49 million, inclusive of interest income, from a foreign jurisdiction.
In January 2021, we received from HMRC an issue closure notice relating to adjustments for 2012 through 2016 tax years. These proposed adjustments are related to certain transfer pricing arrangements with our foreign subsidiaries and would result in an increase to our worldwide income tax expense in an estimated range of $25 million to $35 million, exclusive of interest expense, at the close of the audit if HMRC prevails. We disagree with the proposed adjustments and we intend to defend our position through applicable administrative and, if necessary, judicial remedies. We are also currently subject to audit by HMRC in tax years 2017 through 2022. If HMRC were to seek adjustments of a similar nature through a closure notice for transactions in these years, we could be subject to significant additional tax liabilities. Our policy is to review and update tax reserves as facts and circumstances change.
A reconciliation of the beginning and ending amount of gross unrecognized tax benefits (excluding interest and penalties) is as follows during the periods presented:
| | | | | | | | | | | | |
| | December 31, | |
| | 2024 | | | 2023 | | | 2022 | |
| | (in millions) | |
Balance, beginning of year | | $ | 136 | | | $ | 157 | | | $ | 144 | |
Increases to tax positions related to the current year | | | 2 | | | | 8 | | | | 5 | |
Increases to tax positions related to the prior year | | | 34 | | | | 17 | | | | 29 | |
Decreases due to lapsed statute of limitations | | | — | | | | — | | | | (20 | ) |
Decreases due to tax positions related to the prior year | | | (3 | ) | | | (6 | ) | | | (1 | ) |
Settlements during current year | | | (70 | ) | | | (40 | ) | | | — | |
Balance, end of year | | $ | 99 | | | $ | 136 | | | $ | 157 | |
As of December 31, 2024, we had $78 million of unrecognized tax benefits, inclusive of interest, which is classified as long-term and included in other long-term liabilities on our consolidated balance sheet. We also had $43 million of unrecognized tax benefits classified as long-term and included as an offset to our deferred tax asset on our consolidated balance sheet. The amount of unrecognized tax benefits, if recognized, would reduce income tax
expense by $53 million, due to correlative adjustments in other tax jurisdictions. We recognize interest and penalties related to unrecognized tax benefits in income tax expense on our consolidated statement of operations. As of December 31, 2024 and 2023, total gross interest accrued was $22 million and $45 million, respectively, and recorded to unrecognized tax benefits in other long-term liabilities on the consolidated balance sheets.
NOTE 11: COMMITMENTS AND CONTINGENCIES
As of December 31, 2024, we have contractual obligations and commercial commitments that include expected interest payments on our 2026 Senior Notes and Term Loan B Facility, expected commitment fees on our Credit Facility, and non-cancellable long-term purchase obligations, as summarized in the table below. The expected amounts and timing of payments discussed below were estimated based on information available to us as of December 31, 2024.
| | | | | | | | | | | | | | | | | | | | |
| | | | | By Period | |
| | Total | | | Less than
1 year | | | 1 to 3 years | | | 3 to 5 years | | | More than
5 years | |
| | (in millions) | |
Expected interest payments on Term Loan B Facility (1) | | $ | 219 | | | $ | 35 | | | $ | 68 | | | $ | 67 | | | $ | 49 | |
Expected interest payments on 2026 Senior Notes (2) | | | 1 | | | | 1 | | | | — | | | | — | | | | — | |
Expected commitment fee payments on Credit Facility (3) | | | 4 | | | | 1 | | | | 2 | | | | 1 | | | | — | |
Purchase obligations and other (4) | | | 106 | | | | 35 | | | | 54 | | | | 17 | | | | — | |
Total (5)(6) | | $ | 330 | | | $ | 72 | | | $ | 124 | | | $ | 85 | | | $ | 49 | |
(1)The amounts included as expected interest payments on the Term Loan B Facility in this table are based on the effective interest rate as of December 31, 2024, however, the interest rate is variable and could change significantly in the future. Amount assumes that our existing debt is repaid at maturity. Refer to “Note 8: Debt” for additional information on the Term Loan B Facility.
(2)Expected interest payments on our 2026 Senior Notes are based on a fixed interest rate of 0.25% as of December 31, 2024, and assumes that our existing debt is repaid at maturity. Refer to “Note 8: Debt” for additional information on our 2026 Senior Notes.
(3)Expected commitment fee payments are based on the daily unused portion of our Credit Facility, issued letters of credit, and the effective commitment fee rate as of December 31, 2024; however, these variables could change significantly in the future. Refer to “Note 8: Debt” for additional information on our Credit Facility.
(4)Estimated purchase obligations that are fixed and determinable, primarily related to telecommunication and licensing contracts, with various expiration dates through June 2029. These contracts have non-cancelable terms or are cancelable only upon payment of significant penalty. Timing of payments and actual amounts paid may be different depending on the time of receipt of goods or services or changes to agreed-upon amounts for some obligations.
(5)Excluded from the table is $3 million of undrawn standby letters of credit, primarily as security deposits for certain property leases as of December 31, 2024.
(6)Excluded from the table is the TRIP Loan Facility of approximately $330 million, related to the Merger with LTRIP anticipated to be completed during the second quarter of 2025. Refer to “Note 1: Organization and Business Description” for additional information on the Merger.
Legal Proceedings
In the ordinary course of business, we are party to legal, regulatory and administrative matters, including threats thereof, arising out of, or in connection with our operations. These matters may involve claims involving, but not limited to, intellectual property rights (including privacy rights and alleged infringement of third-party intellectual property rights), tax matters (including value-added, excise, transient occupancy and accommodation taxes), regulatory compliance (including competition, consumer protection matters and data privacy or cybersecurity matters), contractual claims (including related to our material agreements or other contracts), defamation and reputational claims, personal injury claims, labor and employment matters and commercial disputes. Periodically, we review the status of all significant outstanding matters to assess any potential financial exposure. We record the estimated loss in our consolidated statements of operations when (i) it is probable that an asset has been impaired or a liability has been incurred; and (ii) the amount of the loss can be reasonably estimated and is material. We provide disclosures in the notes to the consolidated financial statements for loss contingencies that do not meet both of these conditions if there is a reasonable possibility that a loss may have been incurred that would be material to the consolidated financial statements. We base accruals on the best information available at the time, which can be highly subjective. Although occasional adverse decisions or settlements may occur, we do not believe that the final disposition of any of these matters will have a material adverse effect on our business, except for certain known
income tax matters discussed in “Note 10: Income Taxes.” However, the final outcome of these matters could vary significantly from our estimates. Finally, there may be claims or actions pending or threatened against us of which we are currently not aware and the ultimate disposition of which could have a material adverse effect on us. All legal fees incurred by the Company related to any regulatory and legal matters are expensed in the period incurred.
We are under audit by the IRS and various other domestic and foreign tax authorities with regards to income tax matters. We have reserved for potential losses that may result from examinations by, or any negotiated agreements with, these tax authorities. Although we believe our tax estimates are reasonable, the final determination of audits could be materially different from our historical tax provisions and accruals. The results of an audit could have a material effect on our financial position, results of operations, or cash flows in the period for which that determination is made. Refer to “Note 10: Income Taxes” for further information on potential contingencies pertaining to current income tax audits.
As of December 31, 2024, we have an accrual of $10 million in accrued expenses and other current liabilities in our consolidated balance sheet, as an estimated potential settlement of a regulatory related matter within our vacation rentals offering. This amount is included in general and administrative expenses in our consolidated statement of operations for the year ended December 31, 2024. This accrual is based on our best estimate of probable loss; the ultimate resolution of this contingency may be greater or less than the liability recorded.
NOTE 12: EMPLOYEE BENEFIT PLANS
Retirement Savings Plan
The Tripadvisor Retirement Savings Plan (the “401(k) Plan”), qualifies under Section 401(k) of the Internal Revenue Code. The 401(k) Plan allows participating employees, which includes most of our U.S. employees, to make contributions of a specified percentage of their eligible compensation. Participating employees may contribute up to 50% of their eligible salary on a pre-tax basis, but not more than statutory limits. Employee-participants age 50 and over may also contribute an additional amount of their salary on a pre-tax tax basis up to the IRS Catch-Up Provision Limit (or “catch-up contributions”). Employees may also contribute into the 401(k) Plan on an after-tax basis up (or “Roth 401(k) contributions”) to an annual maximum of 10%. The 401(k) Plan has an automatic enrollment feature at 6% pre-tax. We match 50% of the first 6% of employee contributions to the plan for a maximum employer contribution of 3% of a participant’s eligible earnings. The catch-up contributions are not eligible for employer matching contributions. The matching contributions portion of an employee’s account, vests after two years of service. Additionally, at the end of the 401(k) Plan year, we make a discretionary matching contribution to eligible participants. This additional discretionary matching employer contribution (or “true up”) is limited to match only contributions up to 3% of eligible compensation.
We also have various defined contribution plans for our non-U.S. employees. Our contribution to the 401(k) Plan and our non-U.S. defined contribution plans which are recorded in our consolidated statements of operations for the years ended December 31, 2024, 2023 and 2022 were $12 million, $12 million, and $11 million, respectively.
Deferred Compensation Plan for Non-Employee Directors
The Company has a deferred compensation plan for non-employee directors (the “Deferred Compensation Plan”). Under the Deferred Compensation Plan, eligible directors who defer their directors’ fees may elect to have such deferred fees (i) applied to the purchase of share units, representing the number of shares of our common stock that could have been purchased on the date such fees would otherwise be payable, or (ii) credited to a cash fund. The cash fund will be credited with interest at an annual rate equal to the weighted average prime or base lending rate of a financial institution selected in accordance with the terms of the Deferred Compensation Plan and applicable law. Upon termination of service as a director of Tripadvisor, a director will receive (i) with respect to share units, such number of shares of our common stock as the share units represent, and (ii) with respect to the cash fund, a cash payment. Payments upon termination will be made in either one lump sum or up to five annual installments, as elected by the eligible director at the time of the deferral election.
Under the Deferred Compensation Plan, 100,000 shares of Tripadvisor common stock are available for issuance to non-employee directors. From the inception of the Deferred Compensation Plan through December 31, 2024, a total of 557 shares have been issued for such purpose.
Executive Severance Plan and Summary Plan Description
The Company also maintains the Executive Severance Plan and Summary Plan Description (the “Severance Plan”) which is applicable to certain employees of the Company and its subsidiaries. The Severance Plan formalizes and standardizes the Company’s severance practices for certain designated employees (each, a “Participant” and, collectively, the “Participants”). Participants covered by the Severance Plan generally will be eligible to receive severance benefits in the event of a termination by the Company without cause or, under certain circumstances, by the Participant for good reason. The severance benefits differ if there is a termination of employment in connection with a change in control. The severance benefits provided pursuant to the Severance Plan are determined based on the job classification of the Participants (as reflected in internal job profile designations) and, in certain cases, their years of service with the Company. During the years ended December 31, 2024, 2023 and 2022, respectively, we recognized $2 million, $2 million and $1 million of expense under the Severance Plan on our consolidated statements of operations.
NOTE 13: STOCK BASED AWARDS AND OTHER EQUITY INSTRUMENTS
Stock-based Compensation Expense
The following table presents the amount of stock-based compensation expense and the related income tax benefit included in our consolidated statements of operations during the periods presented:
| | | | | | | | | | | | |
| | Year ended December 31, | |
| | 2024 | | | 2023 | | | 2022 | |
| | (in millions) | |
Total stock-based compensation expense | | $ | 120 | | | $ | 96 | | | $ | 88 | |
Income tax benefit from stock-based compensation expense | | | (23 | ) | | | (21 | ) | | | (18 | ) |
Total stock-based compensation expense, net of tax effect | | $ | 97 | | | $ | 75 | | | $ | 70 | |
We capitalized $13 million, $10 million and $10 million of stock-based compensation expense as website development costs during the years ended December 31, 2024, 2023 and 2022, respectively.
Stock and Incentive Plans
On December 20, 2011, our 2011 Stock and Annual Incentive Plan (the “2011 Plan”) became effective and we filed a Registration Statement registering a total of 17,500,000 shares of our common stock, of which 17,400,000 shares were issuable in connection with grants of equity-based awards under our 2011 Plan and 100,000 shares were issuable under our Deferred Compensation Plan for Non-Employee Directors (refer to “Note 12: Employee Benefit Plans” for information on our Deferred Compensation Plan for Non-Employee Directors). At our annual meeting of stockholders held on June 28, 2013, our stockholders approved an amendment to our 2011 Plan to, among other things, increase the aggregate number of shares of common stock authorized for issuance thereunder by 15,000,000 shares.
On June 21, 2018, our stockholders approved the 2018 Stock and Annual Incentive Plan (the “2018 Plan”) and we filed a Registration Statement registering 6,000,000 shares plus the number of shares available for issuance (and not subject to outstanding awards) under the 2011 Plan. As of the effective date of the 2018 Plan, the Company ceased granting awards under the 2011 Plan. On June 8, 2021, our stockholders approved an amendment to the Company’s 2018 Plan to, among other things, increase the aggregate number of shares reserved and available for issuance under the 2018 Plan by 10,000,000 shares. The purpose of this amendment was to provide sufficient reserves of shares of our common stock to ensure our ability to continue to provide new hires, employees and management with equity incentives.
On June 6, 2023, our stockholders approved the TripAdvisor, Inc. 2023 Stock and Annual Incentive Plan (the “2023 Plan”) primarily for the purpose of providing sufficient reserves of shares of our common stock to ensure our
ability to continue to provide new hires, employees, and other participants with equity incentives. The 2023 Plan provides for the grant of stock options, stock appreciation rights, restricted stock, restricted stock units (“RSUs”), and other stock-based awards. As of the effective date of the 2023 Plan, the Company ceased granting awards under the 2018 Plan.
As of December 31, 2024, the total number of shares reserved for future stock-based awards under the 2023 Plan was approximately 16 million shares, calculated as follows: 12 million shares plus the number of shares available for issuance (and not subject to outstanding awards) under the 2018 Plan. All shares of common stock issued to date in respect of the exercise of options, RSUs, or other equity awards have been issued from authorized, but unissued common stock.
Stock Based Award Activity and Valuation
2024 Stock Option Activity
A summary of our stock option activity, consisting of service-based non-qualified stock options, is presented below:
| | | | | | | | | | | | | | | | |
| | | | | Weighted | | | Weighted | | | | |
| | | | | Average | | | Average | | | | |
| | | | | Exercise | | | Remaining | | | Aggregate | |
| | Options | | | Price Per | | | Contractual | | | Intrinsic | |
| | Outstanding | | | Share | | | Life | | | Value | |
| | (in thousands) | | | | | | (in years) | | | (in millions) | |
Options outstanding as of December 31, 2023 | | | 3,927 | | | $ | 35.56 | | | | | | | |
Granted | | | 45 | | | | 24.96 | | | | | | | |
Exercised (1) | | | (80 | ) | | | 24.36 | | | | | | | |
Cancelled or expired | | | (1,702 | ) | | | 40.93 | | | | | | | |
Options outstanding as of December 31, 2024 | | | 2,190 | | | | 31.57 | | | | 5.3 | | | $ | — | |
Exercisable as of December 31, 2024 | | | 1,703 | | | | 34.42 | | | | 4.7 | | | $ | — | |
Vested and expected to vest after December 31, 2024 (2) | | | 2,190 | | | $ | 31.57 | | | | 5.3 | | | $ | — | |
(1)Inclusive of approximately 67,000 stock options withheld due to net share settlement to satisfy required employee tax withholding requirements. Potential shares issuable under stock options that were withheld under net share settlement remain in the authorized but unissued pool under the 2023 Plan and can be reissued by the Company. Total payments for the employees’ tax obligations to the taxing authorities due to net share settlements are reflected as a financing activity within the consolidated statements of cash flows.
(2)The Company accounts for forfeitures as they occur, rather than estimate expected forfeitures as allowed under GAAP and therefore do not include a forfeiture rate in our vested and expected to vest calculation unless necessary for a performance condition award.
Aggregate intrinsic value represents the difference between the closing stock price of our common stock and the exercise price of outstanding, in-the-money options. Our closing stock price as reported on Nasdaq as of December 31, 2024 was $14.77. The total intrinsic value of stock options exercised for the years ended December 31, 2024, 2023, and 2022 was not material.
The fair value of stock option grants has been estimated at the date of grant using the Black–Scholes option pricing model with the following weighted average assumptions for the periods presented:
| | | | | | | | | | | | |
| | December 31, | |
| | 2024 | | | 2023 | | | 2022 | |
Risk free interest rate | | | 4.07 | % | | | 3.70 | % | | | 3.07 | % |
Expected term (in years) | | | 5.19 | | | | 5.16 | | | | 5.42 | |
Expected volatility | | | 56.69 | % | | | 53.43 | % | | | 51.63 | % |
Expected dividend yield | | — % | | | — % | | | — % | |
Weighted-average grant date fair value | | $ | 13.37 | | | $ | 10.18 | | | $ | 9.93 | |
The total fair value of stock options vested for the years ended December 31, 2024, 2023 and 2022 were $7 million, $7 million, and $16 million, respectively. Cash received from stock option exercises for the years ended December 31, 2024, 2023, and 2022 was not material.
2024 RSU Activity
A summary of our RSU activity, consisting of service-based vesting terms, is presented below:
| | | | | | | | | | | | |
| | | | | Weighted | | | | |
| | | | | Average | | | | |
| | | | | Grant- | | | Aggregate | |
| | RSUs | | | Date Fair | | | Intrinsic | |
| | Outstanding | | | Value Per Share | | | Value | |
| | (in thousands) | | | | | | (in millions) | |
Unvested RSUs outstanding as of December 31, 2023 | | | 11,520 | | | $ | 23.06 | | | | |
Granted | | | 6,314 | | | | 24.70 | | | | |
Vested and released (1) | | | (4,936 | ) | | | 23.93 | | | | |
Cancelled | | | (1,293 | ) | | | 24.02 | | | | |
Unvested RSUs outstanding as of December 31, 2024 (2) | | | 11,605 | | | $ | 23.47 | | | $ | 171 | |
(1)Inclusive of approximately 1,070,000 RSUs withheld due to net share settlement to satisfy required employee tax withholding requirements. Potential shares issuable under RSUs that were withheld under net share settlement remain in the authorized but unissued pool under the 2023 Plan and can be reissued by the Company. Total payments for the employees’ tax obligations to the taxing authorities due to net share settlements are reflected as a financing activity within the consolidated statements of cash flows.
(2)The Company accounts for forfeitures as they occur, rather than estimate expected forfeitures as allowed under GAAP and therefore do not include a forfeiture rate in our vested and expected to vest calculation unless necessary for a performance condition award.
The total fair value of RSUs vested for the years ended December 31, 2024, 2023, and 2022 was $118 million, $109 million, and $108 million, respectively.
A summary of our performance-based RSUs ("PSUs") and market-based RSUs (“MSUs”) activity is presented below:
| | | | | | | | | | | | | | | | | | | | | | | | |
| | PSUs (1) | | | MSUs (2) | |
| | | | | Weighted | | | | | | | | | Weighted | | | | |
| | | | | Average | | | | | | | | | Average | | | | |
| | | | | Grant- | | | Aggregate | | | | | | Grant- | | | Aggregate | |
| | | | | Date Fair | | | Intrinsic | | | | | | Date Fair | | | Intrinsic | |
| | Outstanding | | | Value Per Share | | | Value | | | Outstanding | | | Value Per Share | | | Value | |
| | (in thousands) | | | | | | (in millions) | | | (in thousands) | | | | | | (in millions) | |
Unvested and outstanding as of December 31, 2023 | | | 519 | | | $ | 18.45 | |
| | | | | 572 | | | $ | 10.35 | |
| | |
Granted | | | 616 | | | | 27.06 | | | | | | | — | | | | — | | | | |
Cancelled | | | (153 | ) | | | 22.06 | | | | | | | (81 | ) | | | 9.26 | | | | |
Unvested and outstanding as of December 31, 2024 | | | 982 | | | $ | 23.28 | | | $ | 15 | | | | 491 | | | $ | 10.53 | | | $ | 7 | |
(1)Represents PSUs awarded primarily in February 2023 and March 2024, representing nearly all the unvested and outstanding awards as of December 31, 2024. The February 2023 PSU awards provide for vesting in two equal annual installments on each of December 31, 2024 and December 31, 2025, if and to the extent the Company achieves pre-determined revenue and adjusted EBITDA metrics (each weighted 50%) established by the Compensation Committee and Section 16 Committee of its Board of Directors (jointly, the "Compensation Committees"). The March 2024 PSU awards provide for vesting in two equal annual installments on each of December 31, 2025 and December 31, 2026, if and to the extent the Company achieves pre-determined revenue and adjusted EBITDA metrics (each weighted 50%) established by the Compensation Committees. The estimated grant-date fair values per PSU were measured based on the quoted price of our common stock at the date of grant, calculated upon the establishment of performance targets, and are amortized on a straight-line basis over the requisite service period. Based upon actual attainment relative to the target financial metrics, employees have the ability to receive up to 200% of the target number originally granted, or to be issued none at all. Probable outcome for performance-based awards is updated based upon changes in actual and forecasted operating results or expected achievement of performance goals, as applicable, and the impact of modifications, if any.
(2)MSUs shall vest three years from grant date, generally with 25% vesting if the weighted-average stock price over a 30-day trading period during the vesting period is equal to or greater than $35.00 but less than $45.00, 50% vesting if equal to or greater than $45.00 but less than $55.00, and 100% vesting if equal to or greater than $55.00, subject to continuous employment with, or performance of services for, the Company. A Monte-Carlo simulation model, which simulated the present value of the potential outcomes of future stock prices was
used to calculate the grant-date fair value of our MSU awards. The estimated grant-date fair value of these awards is amortized on a straight-line basis over the requisite service period and is not adjusted based on the actual number of awards that ultimately vest.
As of December 31, 2024, total unrecognized compensation cost related to stock-based awards, substantially RSUs, was $245 million, which the Company expects to recognize over a weighted-average period of 2.5 years.
NOTE 14: STOCKHOLDERS’ EQUITY
Preferred Stock
In addition to common stock, we are authorized to issue up to 100 million preferred shares, with $ 0.001 par value per share, with terms determined by our Board of Directors, without further action by our stockholders. As of December 31, 2024, no preferred shares had been issued.
Common Stock and Class B Common Stock
Our authorized common stock consists of 1.6 billion shares of common stock with par value of $0.001 per share, and 400 million shares of Class B common stock with par value of $0.001 per share. Both classes of common stock qualify for and share equally in dividends, if declared by our Board of Directors. Common stock is entitled to one vote per share and Class B common stock is entitled to 10 votes per share. Holders of Tripadvisor common stock, acting as a single class, are entitled to elect a number of directors equal to 25% of the total number of directors, rounded up to the next whole number, which was three directors as of December 31, 2024. Class B common stockholders may, at any time, convert their shares into common stock, on a one for one share basis. Upon conversion, the Class B common stock is retired and is not available for reissue. In the event of liquidation, dissolution, distribution of assets or winding-up of Tripadvisor the holders of both classes of common stock have equal rights to receive all the assets of Tripadvisor after the rights of the holders of the preferred stock have been satisfied. There were 153,655,038 and 127,394,786 shares of common stock issued and outstanding, respectively, and 12,799,999 shares of Class B common stock issued and outstanding at December 31, 2024.
Accumulated Other Comprehensive Income (Loss)
Accumulated other comprehensive income (loss) is comprised of accumulated foreign currency translation adjustments, as follows as of the dates presented:
| | | | | | | | |
| | December 31, 2024 | | | December 31, 2023 | |
| | (in millions) | |
Cumulative foreign currency translation adjustments, net of tax (1) | | $ | (91 | ) | | $ | (71 | ) |
Accumulated other comprehensive income (loss) | | $ | (91 | ) | | $ | (71 | ) |
(1)Deferred income tax liabilities related to these amounts are not material.
Treasury Stock
On November 1, 2019, our Board of Directors authorized the repurchase of an additional $100 million in shares of our common stock under an existing share repurchase program, which increased the amount available to the Company under this share repurchase program to $250 million. Our Board of Directors authorized and directed management, working with the Executive Committee of our Board of Directors, to affect the share repurchase program in compliance with applicable legal requirements. As of December 31, 2022, the Company had $75 million remaining under this existing share repurchase program to repurchase shares of its common stock. During the year ended December 31, 2023, we repurchased 4,724,729 shares of our outstanding common stock at an average price of $15.85 per share, exclusive of fees, commissions, and excise taxes or $75 million in the aggregate, which completed this share repurchase program.
On September 7, 2023, our Board of Directors authorized the repurchase of $250 million in shares of our common stock under a new share repurchase program. Our Board of Directors authorized and directed management, working with the Executive Committee of our Board of Directors, to affect the share repurchase program in
compliance with applicable legal requirements. The Executive Committee will determine the price, timing, amount and method of such repurchases based on its evaluation of market conditions and other factors, and at prices determined to be attractive and in the best interests of both the Company and its stockholders. This share repurchase program, which has a term of two years, does not obligate the Company to acquire any particular number of shares and may be modified, suspended or discontinued at any time. During the year ended December 31, 2023, we repurchased 1,324,524 shares of our outstanding common stock at an average price of $18.85 per share, exclusive of fees, commissions, and excise taxes, or $25 million, under this share repurchase program. During the year ended December 31, 2024, we repurchased 1,366,385 shares of our outstanding common stock at an average price of $18.28 per share, exclusive of fees, commissions, and excise taxes, or $25 million in the aggregate. As of December 31, 2024, we had $200 million remaining available to repurchase shares of our common stock under this share repurchase program.
On August 16, 2022, the Inflation Reduction Act was signed into law, and imposed a nondeductible 1% excise tax on the net value of certain stock repurchases made after December 31, 2022. However, for purposes of calculating the excise tax, repurchasing corporations are permitted to net the fair market value of certain new stock issuances against the fair market value of stock repurchases during the same taxable year. For the years ended December 31, 2024 and 2023, excise tax on our share repurchases was not material.
Dividends
During the years ended December 31, 2024, 2023 and 2022, our Board of Directors did not declare any dividends on our outstanding common stock. Any determination to pay dividends in the future will be at the discretion of our Board of Directors and will depend on our results of operations, earnings, capital requirements, financial condition, future prospects, contractual restrictions and other factors deemed relevant by our Board of Directors.
NOTE 15: EARNINGS PER SHARE
Below is a reconciliation of the weighted average number of shares of common stock outstanding in calculating Diluted EPS for the periods presented:
| | | | | | | | | | | | |
| | Year ended December 31, | |
| | 2024 | | | 2023 | | | 2022 | |
| | (shares in thousands and $ in millions, except per share amounts) | |
Numerator: | | | | | | | | | |
Net income (loss) used to compute Basic EPS | | $ | 5 | | | $ | 10 | | | $ | 20 | |
Interest expense on 2026 Senior Notes, net of tax | | | 1 | | | | 1 | | | | 1 | |
Net income (loss) used to compute Diluted EPS | | $ | 6 | | | $ | 11 | | | $ | 21 | |
Denominator: | | | | | | | | | |
Weighted average shares used to compute Basic EPS | | | 139,079 | | | | 139,412 | | | | 139,923 | |
Weighted average effect of dilutive securities: | | | | | | | | | |
Stock-based awards (Note 13) | | | 1,285 | | | | 729 | | | | 1,073 | |
2026 Senior Notes (Note 8) | | | 4,674 | | | | 4,674 | | | | 4,674 | |
Weighted average shares used to compute Diluted EPS | | | 145,038 | | | | 144,815 | | | | 145,670 | |
Basic EPS | | $ | 0.04 | | | $ | 0.07 | | | $ | 0.14 | |
Diluted EPS | | $ | 0.04 | | | $ | 0.08 | | | $ | 0.14 | |
Potential common shares, consisting of outstanding stock options, RSUs and those issuable under the 2026 Senior Notes, totaling approximately 12.4 million, 14.8 million, and 11.4 million, for the years ended December 31, 2024, 2023 and 2022, respectively, have been excluded from the calculations of Diluted EPS because their effect would have been antidilutive. In addition, potential common shares of certain performance-based awards of approximately 1.4 million, 1.1 million, and 0.3 million, for the years ended December 31, 2024, 2023 and 2022,
respectively, for which all targets required to trigger vesting had not been achieved, were excluded from the calculation of weighted average shares used to compute Diluted EPS for those reporting periods.
The earnings per share amounts are the same for our common stock and Class B common stock because the holders of each class are legally entitled to equal per share distributions whether through dividends or in liquidation. In addition, our non-vested RSUs are entitled to dividend equivalents, which are payable to the holder subject to, and only upon vesting of, the underlying awards and are therefore forfeitable. Given such dividend equivalents are forfeitable, we do not consider them to be participating securities and, consequently, they are not subject to the two‑class method of determining earnings per share.
NOTE 16: OTHER INCOME (EXPENSE), NET
Other income (expense), net, consists of the following for the periods presented:
| | | | | | | | | | | | |
| | Year Ended December 31, | |
| | 2024 | | | 2023 | | | 2022 | |
| | (in millions) | |
Foreign currency exchange gains (losses), net (1) | | $ | (2 | ) | | $ | (5 | ) | | $ | (5 | ) |
Earnings (losses) from equity investment, net | | | (2 | ) | | | (2 | ) | | | (2 | ) |
Gain (loss) on extinguishment of debt (2) | | | (2 | ) | | | — | | | | — | |
Other, net | | | (1 | ) | | | 3 | | | | 2 | |
Total | | $ | (7 | ) | | $ | (4 | ) | | $ | (5 | ) |
(1)Foreign currency exchange gains (losses), net, are related to foreign exchange transaction gains and losses due to required conversion from transaction currency to functional currency, offset by any foreign currency forward contract gains and losses.
(2)Refer to “Note 8: Debt” for information regarding the extinguishment loss incurred due to the redemption of the 2025 Senior Notes.
NOTE 17: RELATED PARTY TRANSACTIONS
Relationship between Liberty TripAdvisor Holdings, Inc. and Tripadvisor
LTRIP is a controlling stockholder of Tripadvisor. We consider LTRIP a related party. Refer to “Note 1: Organization and Business Description,” which describes the evolution of our relationship with LTRIP, LTRIP’s stock ownership of Tripadvisor and deemed voting power as of December 31, 2024, and discussion pertaining to the Merger Agreement entered into by the Company with LTRIP on December 18, 2024. We had no related party transactions with LTRIP during the years ended December 31, 2024, 2023 and 2022.
Relationship between Chelsea Investment Holding Company PTE Ltd. and Tripadvisor
Refer to the discussion regarding our equity method investment in Chelsea Investment Holding Company PTD Ltd. in the section titled “Non-Marketable Investments” within “Note 3: Financial Instruments and Fair Value Measurements” for a description of our relationship and existing commercial arrangements with Chelsea Investment Holding Company PTE Ltd and/or its subsidiaries. We had no material related party transactions with Chelsea Investment Holding Company PTE Ltd or its subsidiaries during the years ended December 31, 2024, 2023 and 2022.
NOTE 18: SEGMENT AND GEOGRAPHIC INFORMATION
We have three reportable segments: (1) Brand Tripadvisor; (2) Viator; and (3) TheFork. Our Brand Tripadvisor segment includes the following revenue sources: (1) Tripadvisor-branded hotels – consisting of hotel meta revenue, primarily click-based advertising revenue, and also hotel B2B revenue, which includes primarily subscription-based advertising and hotel sponsored placements revenue; (2) Media and advertising revenue – consisting primarily of display-based advertising revenue (also referred to as “media advertising”); (3) Tripadvisor experiences and dining revenue – consisting of intercompany (intersegment) revenue related to affiliate marketing commissions earned primarily from experience bookings, and to a lesser extent, restaurant reservation bookings on
Tripadvisor-branded websites and mobile apps, fulfilled by Viator and TheFork, respectively, which are eliminated on a consolidated basis, in addition to external revenue generated from Tripadvisor restaurant offerings; and (4) Other revenue – consisting of cruises, vacation rentals, flights, and rental cars revenue. The nature of the services provided and related revenue recognition policies are summarized by reportable segment in “Note 2: Significant Accounting Policies.”
Our operating segments are determined based on how our chief executive officer, who also serves as our chief operating decision maker (“CODM”) manages our business, regularly accesses information, and evaluates performance for operating decision-making purposes, including allocation of operating and capital resources. adjusted EBITDA is our reported measure of segment profit and a key measure used by our CODM and Board of Directors to understand and evaluate the operating performance of our business as a whole and our individual operating segments, and on which internal budgets and forecasts are based and approved. We define adjusted EBITDA as net income (loss) plus: (1) (provision) benefit for income taxes; (2) other income (expense), net; (3) depreciation and amortization; (4) stock-based compensation; (5) goodwill, long-lived asset, and intangible assets impairments; (6) legal reserves, settlements and other (including indirect tax reserves related to audit settlements and the impact of one-time changes resulting from enacted indirect tax legislation); (7) restructuring and other related reorganization costs; (8) transaction related expenses; and (9) non-recurring expenses and income unusual in nature or infrequently occurring.
Direct costs are included in the applicable operating segments, including certain personnel costs, which have been allocated to each segment. We base these allocations on time-spent analyses, headcount, and other allocation methods we believe are reasonable. We do not allocate certain shared expenses to our reportable segments, such as certain information system costs, technical infrastructure costs, and other costs supporting the Tripadvisor platform and operations, that we do not believe are a material driver of individual segment performance, which is consistent with the financial information used by our CODM. We include these expenses in our Brand Tripadvisor segment. Our allocation methodology is periodically evaluated and may change.
The following tables present our reportable segment information for the years ended December 31, 2024, 2023 and 2022 and includes a reconciliation of Adjusted EBITDA to Net income (loss). We record depreciation and amortization, stock-based compensation, goodwill, long-lived asset and intangible asset impairments, legal reserves, settlements and other, transaction related expenses, and other non-recurring expenses and income, net, which are excluded from segment operating performance, in “Corporate & Eliminations.” In addition, we do not report total assets, capital expenditures and related depreciation expense by segment as our CODM does not use this information to evaluate operating segment performance. Accordingly, we do not regularly provide such information by segment to our CODM.
Our segment disclosure includes intersegment revenues, which consist of affiliate marketing fees for services provided by our Brand Tripadvisor segment to both our Viator and TheFork segments. These intersegment transactions are recorded by each segment at amounts that we believe approximate fair value as if the transactions were between third parties and, therefore, impact segment performance. However, the revenue and corresponding expense are eliminated in consolidation. The elimination of such intersegment transactions is included within the “Corporate & Eliminations” column in the tables below.
| | | | | | | | | | | | | | | | | | | | |
| | Year ended December 31, 2024 | |
| | Brand Tripadvisor (1) | | | Viator (2) | | | TheFork (3) | | | Corporate &
Eliminations | | | Total | |
| | (in millions) | |
External revenue | | $ | 814 | | | $ | 840 | | | $ | 181 | | | $ | — | | | $ | 1,835 | |
Intersegment revenue | | | 135 | | | | — | | | | — | | | | (135 | ) | | | — | |
Revenue | | $ | 949 | | | $ | 840 | | | $ | 181 | | | $ | (135 | ) | | $ | 1,835 | |
Less: (4) | | | | | | | | | | | | | | | |
Cost of sales (5) | | | 33 | | | | 80 | | | | 15 | | | | — | | | | 128 | |
Marketing | | | 251 | | | | 562 | | | | 51 | | | | (135 | ) | | | 729 | |
Personnel (exclusive of stock-based compensation as shown separately below) | | | 266 | | | | 126 | | | | 83 | | | | — | | | | 475 | |
Technology | | | 54 | | | | 25 | | | | 12 | | | | — | | | | 91 | |
General and administrative (6) | | | 44 | | | | 14 | | | | 15 | | | | — | | | | 73 | |
Adjusted EBITDA | | | 301 | | | | 33 | | | | 5 | | | | — | | | | 339 | |
Depreciation and amortization | | | | | | | | | | | | (85 | ) | | | (85 | ) |
Stock-based compensation | | | | | | | | | | | | (120 | ) | | | (120 | ) |
Restructuring and other related reorganization costs (7) | | | (18 | ) | | | (2 | ) | | | (1 | ) | | | | | | (21 | ) |
Legal reserves, settlements and other (8) | | | | | | | | | | | | (18 | ) | | | (18 | ) |
Transaction related expenses (9) | | | | | | | | | | | | (3 | ) | | | (3 | ) |
Operating income (loss) | | | | | | | | | | | | | | | 92 | |
Other income (expense), net | | | | | | | | | | | | | | | (5 | ) |
Income (loss) before income taxes | | | | | | | | | | | | | | | 87 | |
(Provision) benefit for income taxes | | | | | | | | | | | | | | | (82 | ) |
Net income (loss) | | | | | | | | | | | | | | | 5 | |
| | | | | | | | | | | | | | | | | | | | |
| | Year ended December 31, 2023 | |
| | Brand Tripadvisor (1) | | | Viator (2) | | | TheFork (3) | | | Corporate &
Eliminations | | | Total | |
| | (in millions) | |
External revenue | | $ | 897 | | | $ | 737 | | | $ | 154 | | | $ | — | | | $ | 1,788 | |
Intersegment revenue | | | 134 | | | | — | | | | — | | | | (134 | ) | | | — | |
Revenue | | $ | 1,031 | | | $ | 737 | | | $ | 154 | | | $ | (134 | ) | | $ | 1,788 | |
Less: (4) | | | | | | | | | | | | | | | |
Cost of sales | | | 31 | | | | 79 | | | | 9 | | | | — | | | | 119 | |
Marketing | | | 279 | | | | 519 | | | | 41 | | | | (134 | ) | | | 705 | |
Personnel (exclusive of stock-based compensation as shown separately below) | | | 273 | | | | 110 | | | | 91 | | | | — | | | | 474 | |
Technology | | | 50 | | | | 18 | | | | 12 | | | | — | | | | 80 | |
General and administrative (10) | | | 50 | | | | 11 | | | | 15 | | | | — | | | | 76 | |
Adjusted EBITDA | | | 348 | | | | — | | | | (14 | ) | | | — | | | | 334 | |
Depreciation and amortization | | | | | | | | | | | | (87 | ) | | | (87 | ) |
Stock-based compensation | | | | | | | | | | | | (96 | ) | | | (96 | ) |
Restructuring and other related reorganization costs (7) | | | (10 | ) | | | (3 | ) | | | (9 | ) | | | — | | | | (22 | ) |
Transaction related expenses (9) | | | | | | | | | | | | (3 | ) | | | (3 | ) |
Operating income (loss) | | | | | | | | | | | | | | | 126 | |
Other income (expense), net | | | | | | | | | | | | | | | (1 | ) |
Income (loss) before income taxes | | | | | | | | | | | | | | | 125 | |
(Provision) benefit for income taxes | | | | | | | | | | | | | | | (115 | ) |
Net income (loss) | | | | | | | | | | | | | | | 10 | |
| | | | | | | | | | | | | | | | | | | | |
| | Year ended December 31, 2022 | |
| | Brand Tripadvisor (1) | | | Viator (2) | | | TheFork (3) | | | Corporate &
Eliminations | | | Total | |
| | (in millions) | |
External revenue | | $ | 873 | | | $ | 493 | | | $ | 126 | | | $ | — | | | $ | 1,492 | |
Intersegment revenue | | | 93 | | | | — | | | | — | | | | (93 | ) | | | — | |
Revenue | | $ | 966 | | | $ | 493 | | | $ | 126 | | | $ | (93 | ) | | $ | 1,492 | |
Less: (4) | | | | | | | | | | | | | | | |
Cost of sales | | | 20 | | | | 51 | | | | 7 | | | | — | | | | 78 | |
Marketing | | | 260 | | | | 351 | | | | 58 | | | | (93 | ) | | | 576 | |
Personnel (exclusive of stock-based compensation as shown separately below) | | | 249 | | | | 81 | | | | 85 | | | | — | | | | 415 | |
Technology | | | 42 | | | | 9 | | | | 12 | | | | — | | | | 63 | |
General and administrative (11) | | | 50 | | | | 12 | | | | 3 | | | | — | | | | 65 | |
Adjusted EBITDA | | | 345 | | | | (11 | ) | | | (39 | ) | | | — | | | | 295 | |
Depreciation and amortization | | | | | | | | | | | | (97 | ) | | | (97 | ) |
Stock-based compensation | | | | | | | | | | | | (88 | ) | | | (88 | ) |
Legal reserves, settlements and other | | | | | | | | | | | | (1 | ) | | | (1 | ) |
Other non-recurring expenses (income) (12) | | | | | | | | | | | | (8 | ) | | | (8 | ) |
Operating income (loss) | | | | | | | | | | | | | | | 101 | |
Other income (expense), net | | | | | | | | | | | | | | | (34 | ) |
Income (loss) before income taxes | | | | | | | | | | | | | | | 67 | |
(Provision) benefit for income taxes | | | | | | | | | | | | | | | (47 | ) |
Net income (loss) | | | | | | | | | | | | | | | 20 | |
(1)Certain personnel costs of $7 million, $6 million and $5 million for the years ended December 31, 2024, 2023 and 2022, respectively, were allocated to the Viator and TheFork segments.
(2)Includes allocated certain personnel costs from the Brand Tripadvisor segment of $3 million, $3 million and $2 million for the years ended December 31, 2024, 2023 and 2022, respectively.
(3)Includes allocated certain personnel costs from the Brand Tripadvisor segment of $4 million, $3 million and $3 million for the years ended December 31, 2024, 2023 and 2022, respectively.
(4)The significant segment expense categories and amounts align with the segment-level information that is regularly provided to our CODM.
(5)Exclusive of $2 million and $1 million in the Brand Tripadvisor and Viator segments, respectively, which are included separately below in legal reserves, settlements and other.
(6)Exclusive of $18 million in the Brand Tripadvisor segment which is included separately below in legal reserves, settlements and other and transaction related expenses.
(7)Refer to “Note 7: Accrued Expenses and Other Current Liabilities” for information regarding restructuring and other related reorganization costs.
(8)This amount primarily includes an estimated accrual for the potential settlement of a regulatory related matter of $10 million expensed during 2024 and is reflected in general and administrative expenses on our consolidated statement of operations. Refer to "Note 11: Commitments and Contingencies" for further information. In addition, this amount includes a one-time charge of $3 million during the year ended December 31, 2024, resulting from enacted tax legislation in Canada during June 2024 related to digital service taxes, which requires retrospective application back to January 1, 2022. This amount represents the one-time retrospective liability for the periods prior to April 1, 2024, while all prospective periods are and will be included within adjusted EBITDA, respectively. This cost is reflected in cost of sales on our consolidated statement of operations.
(9)The Company expensed certain transaction related costs of $3 million during both the years ended December 31, 2024 and 2023, to general and administrative expenses on our consolidated statements of operations.
(10)Exclusive of $3 million in the Viator segment which is included separately below in transaction related expenses.
(11)Exclusive of $8 million in the Brand Tripadvisor segment which is included separately below in other non-recurring expenses (income).
(12)The Company incurred a loss of approximately $8 million during the fourth quarter of 2022, as the result of external fraud. This loss was recorded to general and administrative expenses on the consolidated statement of operations for December 31, 2022. The Company considers such costs to be non-recurring in nature.
Product and Geographic Information
We disaggregate revenue into major products and revenue sources, as follows, for the periods presented:
| | | | | | | | | | | | |
| | Year ended December 31, | |
| | 2024 | | | 2023 | | | 2022 | |
Major products/revenue sources (1): | | (in millions) | |
Brand Tripadvisor | | | | | | | | | |
Tripadvisor-branded hotels | | $ | 585 | | | $ | 659 | | | $ | 650 | |
Media and advertising | | | 150 | | | | 145 | | | | 130 | |
Tripadvisor experiences and dining (2) | | | 169 | | | | 176 | | | | 134 | |
Other | | | 45 | | | | 51 | | | | 52 | |
Total Brand Tripadvisor | | | 949 | | | | 1,031 | | | | 966 | |
| | | | | | | | | |
Viator | | | 840 | | | | 737 | | | | 493 | |
TheFork | | | 181 | | | | 154 | | | | 126 | |
Intersegment eliminations (2) | | | (135 | ) | | | (134 | ) | | | (93 | ) |
Total Revenue | | $ | 1,835 | | | $ | 1,788 | | | $ | 1,492 | |
(1)Our revenue is recognized primarily at a point in time for all reported segments.
(2)Tripadvisor experiences and dining revenue within the Brand Tripadvisor segment is shown gross of intersegment (intercompany) revenue, which is eliminated on a consolidated basis.
The Company measures its geographic revenue based on the physical location of the Tripadvisor subsidiary which generates the revenue, which is consistent with our measurement of long-lived physical assets, or property and equipment, net. As such, this geographic classification does not necessarily align with where the consumer resides, where the consumer is physically located while using the Company's services, or the location of the travel service provider, experience operator or restaurant.
The Company’s revenue based on geographic location consists of the following for the periods presented:
| | | | | | | | | | | | |
| | Year ended December 31, | |
| | 2024 | | | 2023 | | | 2022 | |
| | (in millions) | |
Revenue | | | | | | | | | |
United States | | $ | 1,230 | | | $ | 1,198 | | | $ | 905 | |
United Kingdom | | | 334 | | | | 349 | | | | 402 | |
All other countries | | | 271 | | | | 241 | | | | 185 | |
Total revenue | | $ | 1,835 | | | $ | 1,788 | | | $ | 1,492 | |
The Company’s property and equipment, net for the United States and all other countries based on the geographic location of the assets consists of the following as of the dates presented:
| | | | | | | | |
| | December 31, | |
| | 2024 | | | 2023 | |
| | (in millions) | |
Property and equipment, net | | | | | | |
United States | | $ | 144 | | | $ | 147 | |
All other countries | | | 56 | | | | 44 | |
Total | | $ | 200 | | | $ | 191 | |
Customer Concentrations
Refer to “Note 2: Significant Accounting Policies” under the section entitled “Certain Risks and Concentrations” for information regarding our major customer concentrations.
Item 9. Changes in and Disagreements with Accountants on Accounting and Financial Disclosure
None.
Item 9A. Controls and Procedures
Evaluation of Disclosure Controls and Procedures
As of December 31, 2024, our management, with the participation of our Chief Executive Officer and President and our Chief Financial Officer, evaluated the effectiveness of our disclosure controls and procedures pursuant to Rule 13a-15(e) and 15d-15(e) promulgated under the Exchange Act. Based upon that evaluation, our Chief Executive Officer and President and our Chief Financial Officer concluded that, as of December 31, 2024, our disclosure controls and procedures were effective in ensuring that material information required to be disclosed in the reports that we file or submit under the Exchange Act is recorded, processed, summarized and reported within the time periods specified in the SEC’s rules and forms, including ensuring that such material information is accumulated and communicated to our management, including our Chief Executive Officer and President and our Chief Financial Officer, as appropriate to allow timely decisions regarding required disclosure.
Changes in Internal Control over Financial Reporting
There were no changes to our internal control over financial reporting that occurred during the quarter ended December 31, 2024 that have materially affected, or are reasonably likely to materially affect, our internal control over financial reporting.
Management’s Report on Internal Control over Financial Reporting
Our management is responsible for establishing and maintaining adequate internal control over financial reporting, as defined in Rule 13a-15(f) of the Exchange Act. Internal control over financial reporting is a process to provide reasonable assurance regarding the reliability of our financial reporting for external purposes in accordance with GAAP. Under the supervision and with the participation of the Company’s management, including the Chief Executive Officer and President and the Chief Financial Officer, the Company conducted an evaluation of the effectiveness of our internal control over financial reporting based on the criteria for effective internal control over financial reporting described in Internal Control—Integrated Framework (2013) issued by the Committee of Sponsoring Organizations of the Treadway Commission.
The Company’s management evaluated the effectiveness of the Company’s internal control over financial reporting as of December 31, 2024. Pursuant to Exchange Act Rule 13a-15(d) or 15d-15(d), management has concluded that, as of December 31, 2024, our internal control over financial reporting was effective. Management has reviewed its assessment with the Audit Committee. KPMG LLP, an independent registered public accounting firm, has audited the Company's consolidated financial statements included elsewhere in this Annual Report on Form 10-K and has also audited the effectiveness of our internal control over financial reporting as of December 31, 2024, as stated in this Annual Report on Form 10-K under the heading, “Report of Independent Registered Public Accounting Firm.”
Limitations on Effectiveness of Controls and Procedures
Management does not expect that our disclosure controls and procedures or our internal control over financial reporting will prevent or detect all error and fraud. Any control system, no matter how well designed and operated, is based upon certain assumptions and can provide only reasonable, not absolute, assurance that its objectives will be met. Further, no evaluation of controls can provide absolute assurance that misstatements due to error or fraud will not occur or that all control issues and instances of fraud, if any, within our company have been detected.
Item 9B. Other Information
During the fourth quarter of 2024, none of the Company’s directors or officers adopted or terminated a Rule 10b5-1 trading arrangement or a non-Rule 10b5-1 trading arrangement (each as defined in Item 408(c) of Regulation S-K).
Item 9C. Disclosure Regarding Foreign Jurisdictions that Prevent Inspections
Not applicable.
PART III
Item 10. Directors, Executive Officers and Corporate Governance
The information required under this item is incorporated herein by reference to our 2025 Proxy Statement, which proxy statement will be filed with the SEC not later than 120 days after the close of our fiscal year ended December 31, 2024. A copy of our Insider Trading Policy is filed as Exhibit 19.1 to this Form 10-K.
Item 11. Executive Compensation
The information required under this item is incorporated herein by reference to our 2025 Proxy Statement, which proxy statement will be filed with the SEC not later than 120 days after the close of our fiscal year ended December 31, 2024.
Item 12. Security Ownership of Certain Beneficial Owners and Management and Related Stockholder Matters
The information required under this item is incorporated herein by reference to our 2025 Proxy Statement, which proxy statement will be filed with the SEC not later than 120 days after the close of our fiscal year ended December 31, 2024.
Item 13. Certain Relationships and Related Transactions, and Director Independence
The information required under this item is incorporated herein by reference to our 2025 Proxy Statement, which proxy statement will be filed with the SEC not later than 120 days after the close of our fiscal year ended December 31, 2024.
Item 14. Principal Accounting Fees and Services
The information required under this item is incorporated herein by reference to our 2025 Proxy Statement, which proxy statement will be filed with the SEC not later than 120 days after the close of our fiscal year ended December 31, 2024.
PART IV
Item 15. Exhibit and Financial Statement Schedules
(a) The following is filed as part of this Annual Report on Form 10-K:
1. Consolidated Financial Statements: The consolidated financial statements and report of independent registered public accounting firms required by this item are included in Part II, Item 8.
All other schedules are omitted because they are not applicable or not required, or because the required information is shown either in the consolidated financial statements or in the notes thereto.
(b) Exhibits:
| | | | | | | | | | | | | | | | | | | | | | | | | | | | | | |
| | | | | | | | | Incorporated by Reference | | | | |
Exhibit No. | | Exhibit Description | | Filed
Herewith | | Form | | | SEC File No. | | | Exhibit
No. | | | Filing
Date | |
2.1 | | Agreement and Plan of Merger, dated as of December 18, 2024, by and among LTRIP, TRIP and Merger Sub | | | | | 8-K | | | | 001-35362 | | | | 2.1 | | | | 12/19/24 | |
3.1 | | Restated Certificate of Incorporation of Tripadvisor, Inc. | | | | | 8-K | | | | 001-35362 | | | | 3.1 | | | | 12/27/11 | |
3.2 | | Amended and Restated Bylaws of Tripadvisor, Inc. | | | | | 8-K | | | | 001-35362 | | | | 3.2 | | | | 12/27/11 | |
3.3 | | Amendment No. 1 to Amended and Restated Bylaws of Tripadvisor, Inc. | | | | | 8-K | | | | 001-35362 | | | | 3.1 | | | | 2/12/13 | |
4.1 | | Specimen Tripadvisor, Inc. Common Stock Certificate | | | | | S-4/A | | | | 333-175828-01 | | | | 4.6 | | | | 10/24/11 | |
4.2 | | Description of the Registrant’s Securities Registered Pursuant to Section 12 of the Securities Exchange Act of 1934 | | | | | 10-K | | | | 001-35362 | | | | 4.2 | | | | 2/19/20 | |
4.3 | | Indenture, dated July 9, 2020, among Tripadvisor, Inc., the guarantors party thereto and U.S. Bank National Association, as trustee (as successor trustee to Wilmington Trust, National Association) | | | | | 8-K | | | | 001-35362 | | | | 4.1 | | | | 7/9/20 | |
4.4 | | Form of Senior Note (included in Exhibit 4.1) | | | | | 8-K | | | | 001-35362 | | | | 4.2 | | | | 7/9/20 | |
4.5 | | Indenture, dated as of March 25, 2021, by and among Tripadvisor, Inc., the guarantors party thereto and U.S. Bank National Association, as trustee | | | | | 8-K | | | | 001-35362 | | | | 4.1 | | | | 3/25/21 | |
4.6 | | Form of 0.25% Convertible Senior Notes due 2026 (included as Exhibit A to Exhibit 4.1) | | | | | 8-K | | | | 001-35362 | | | | 4.2 | | | | 3/25/21 | |
10.1 | | Governance Agreement, by and among Tripadvisor, Inc., Liberty Interactive Corporation and Barry Diller, dated as of December 20, 2011 | | | | | 8-K | | | | 001-35362 | | | | 10.1 | | | | 12/27/11 | |
10.2 | | Assignment and Assumption of Governance Agreement by and among Tripadvisor, Inc. and Liberty Tripadvisor Holdings, dated as of August 12, 2014 | | | | | 10-K | | | | 001-35362 | | | | 10.2 | | | | 2/16/24 | |
10.3 | | Tax Sharing Agreement by and between Tripadvisor, Inc. and | | | | | 8-K | | | | 001-35362 | | | | 10.2 | | | | 12/27/11 | |
| | | | | | | | | | | | | | | | | | | | |
| | Expedia, Inc., dated as of December 20, 2011 | | | | | | | | | | | | | | | | | | |
10.4+ | | Tripadvisor, Inc. Deferred Compensation Plan for Non-Employee Directors | | | | | S-8 | | | | 333-178637 | | | | 4.6 | | | | 12/20/11 | |
10.5 | | Corporate Headquarters Lease with Normandy Gap-V Needham Building 3, LLC, as landlord, dated as of June 20, 2013 | | | | | 10-Q | | | | 001-35362 | | | | 10.1 | | | | 7/24/13 | |
10.6 | | Guaranty dated June 20, 2013 by Tripadvisor, Inc. for the benefit of Normandy Gap-V Needham Building 3, LLC, as landlord | | | | | 10-Q | | | | 001-35362 | | | | 10.2 | | | | 7/24/13 | |
10.7 | | Amendment and Restatement Agreement, dated as of June 29, 2023, to the Credit Agreement dated as of June 26, 2015 (as amended as of May 12, 2017, May 5, 2020 and December 17, 2020, among Tripadvisor, Inc., Tripadvisor Holdings, LLC, Tripadvisor, LLC, the other Borrowers party thereto, the Lenders party thereto and JPMorgan Chase Bank, N.A., as Administrative Agent | | | | | 8-K | | | | 001-35362 | | | | 10.1 | | | | 7/6/23 | |
10.8 | | First Amendment, dated July 8, 2024, to the Amended and Restated Agreement, dated as of June 29, 2023, by and among Tripadvisor, Inc., Tripadvisor Holdings, LLC, Tripadvisor, LLC, the other Borrowers party thereto, the Lenders party thereto and JPMorgan Chase Bank, N.A., as Administrative Agent | | | | | 8-K | | | | 001-35362 | | | | 10.1 | | | | 7/8/24 | |
10.9+ | | Executive Severance Plan and Summary Plan Description | | | | | 10-Q | | | | 001-35362 | | | | 10.4 | | | | 8/8/17 | |
10.10+ | | Form of Option Agreement (Domestic) | | | | | 10-Q | | | | 001-35362 | | | | 10.2 | | | | 5/6/21 | |
10.11+ | | Form of Option Agreement (International) | | | | | 10-Q | | | | 001-35362 | | | | 10.3 | | | | 5/6/21 | |
10.12+ | | Form of Restricted Stock Unit Agreement (Domestic) | | | | | 10-Q | | | | 001-35362 | | | | 10.1 | | | | 5/8/24 | |
10.13+ | | Form of Restricted Stock Unit Agreement (International) | | | | | 10-Q | | | | 001-35362 | | | | 10.2 | | | | 5/8/24 | |
10.14+ | | Form of Restricted Stock Unit Agreement (French) | | | | | 10-Q | | | | 001-35362 | | | | 10.3 | | | | 5/8/24 | |
10.15+ | | Form of Restricted Stock Unit Agreement (Performance Based) | | | | | 10-Q | | | | 001-35362 | | | | 10.4 | | | | 5/8/24 | |
10.16+ | | Form of Restricted Stock Unit Agreement (Non-Employee Directors) | | | | | 10-Q | | | | 001-35362 | | | | 10.2 | | | | 8/1/18 | |
10.17 | | Governance Agreement dated as of November 6, 2019 between Tripadvisor, Inc. and Trip.com Group Limited | | | | | 8-K | | | | 001-35362 | | | | 10.1 | | | | 11/6/19 | |
| | | | | | | | | | | | | | | | | | | | |
10.18+ | | Employment Agreement, dated as of March 29, 2021 between Tripadvisor, LLC and Seth Kalvert | | | | | 10-Q | | | | 001-35362 | | | | 10.7 | | | | 5/6/21 | |
10.19 | | Form of Capped Call Confirmation | | | | | 8-K | | | | 001-35362 | | | | 10.1 | | | | 3/25/21 | |
10.20+ | | Employment Letter Agreement dated May 2, 2022 between Tripadvisor LLC and Matt Goldberg | | | | | 8-K | | | | 001-35362 | | | | 10.1 | | | | 5/4/22 | |
10.21+ | | Employment Letter Agreement dated October 10, 2022 between Tripadvisor LLC and Michael Noonan | | | | | 8-K | | | | 001-35362 | | | | 10.1 | | | | 10/11/22 | |
10.22+ | | Tripadvisor, Inc. 2023 Stock and Annual Incentive Plan | | | | | 10-K | | | | 001-35362 | | | | 10.21 | | | | 2/16/24 | |
10.23 | | Voting Agreement, dated as of December 18, 2024, by and among TRIP, LTRIP and Gregory B. Maffei | | | | | 8-K | | | | 001-35362 | | | | 10.1 | | | | 12/19/24 | |
10.24 | | Voting Agreement, dated as of December 18, 2024, by and among TRIP, LTRIP and Certares | | | | | 8-K | | | | 001-35362 | | | | 10.2 | | | | 12/19/24 | |
10.25 | | Letter Agreement, dated as of December 18, 2024, by and among TRIP, LTRIP and Certares | | | | | 8-K | | | | 001-35362 | | | | 10.3 | | | | 12/19/24 | |
19.1 | | Tripadvisor, Inc. Insider Trading Policy | | X | | | | | | | | | | | | | | | | |
21.1 | | Subsidiaries of the Registrant | | X | | | | | | | | | | | | | | | | |
23.1 | | Consent of KPMG LLP, Independent Registered Public Accounting Firm | | X | | | | | | | | | | | | | | | | |
24.1 | | Power of Attorney (included in signature page) | | X | | | | | | | | | | | | | | | | |
31.1 | | Certification of the Chief Executive Officer pursuant to Section 302 of the Sarbanes-Oxley Act of 2002 | | X | | | | | | | | | | | | | | | | |
31.2 | | Certification of the Chief Financial Officer pursuant to Section 302 of the Sarbanes-Oxley Act of 2002 | | X | | | | | | | | | | | | | | | | |
32.1 | | Certification of the Chief Executive Officer pursuant to Section 906 of the Sarbanes-Oxley Act of 2002 | | X | | | | | | | | | | | | | | | | |
32.2 | | Certification of the Chief Financial Officer pursuant to Section 906 of the Sarbanes-Oxley Act of 2002 | | X | | | | | | | | | | | | | | | | |
97.1 | | Tripadvisor, Inc. Incentive Compensation Clawback Policy, dated November 1, 2023 | | | | | 10-K | | | | 001-35362 | | | | 97.1 | | | | 2/16/24 | |
101.INS | | Inline XBRL Instance Document - the instance document does not appear in the Interactive Data File because its XBRL tags are embedded within the Inline XBRL document. | | X | | | | | | | | | | | | | | | | |
101.SCH | | Inline XBRL Taxonomy Extension Schema with Embedded Linkbases Document. | | X | | | | | | | | | | | | | | | | |
104 | | Cover Page Interactive Data File (embedded within the Inline XBRL document). | | X | | | | | | | | | | | | | | | | |
+ Indicates a management contract or a compensatory plan, contract or arrangement.
Item 16. Form 10-K Summary
Not applicable.
Signatures
Pursuant to the requirements of the Section 13 or 15(d) of Securities Exchange Act of 1934, the Registrant has duly caused this report to be signed on its behalf by the undersigned, hereunto duly authorized.
| | | | |
| | TRIPADVISOR, INC. |
| | By: | | /s/ MATT GOLDBERG |
February 20, 2025 | | | | Matt Goldberg Chief Executive Officer and President |
POWER OF ATTORNEY
We, the undersigned officers and directors of Tripadvisor, Inc., hereby severally constitute and appoint Matt Goldberg and Michael Noonan, and each of them singly, our true and lawful attorneys, with full power to them and each of them singly, to sign for us in our names in the capacities indicated below, all amendments to this report, and generally to do all things in our names and on our behalf in such capacities to enable Tripadvisor, Inc. to comply with the provisions of the Securities Exchange Act of 1934, and all requirements of the Securities and Exchange Commission.
Pursuant to the requirements of the Securities Exchange Act of 1934, this report has been signed below by the following persons on behalf of the Registrant and in the capacities indicated as of February 20, 2025.
| | |
Signature |
| Title |
/s/ MATT GOLDBERG | | Chief Executive Officer, President and Director (Principal Executive Officer) |
Matt Goldberg |
|
/s/ MICHAEL NOONAN | | Chief Financial Officer (Principal Financial Officer) |
Michael Noonan |
|
/s/ GEOFFREY GOUVALARIS | | Chief Accounting Officer (Principal Accounting Officer) |
Geoffrey Gouvalaris |
|
/s/ GREGORY B. MAFFEI | | Chairman of the Board |
Gregory B. Maffei /s/ TRYNKA SHINEMAN BLAKE | | Director |
Trynka Shineman Blake |
| |
/s/ JAY C. HOAG | | Director |
Jay C. Hoag |
| |
/s/ BETSY MORGAN | | Director |
Betsy Morgan |
| |
/s/ GREG O’HARA | | Director |
Greg O’Hara |
| |
/s/ JEREMY PHILIPS | | Director |
Jeremy Philips |
| |
/s/ ALBERT E. ROSENTHALER | | Director |
Albert E. Rosenthaler |
| |
| | |
/s/ JANE JIE SUN | | Director |
Jane Jie Sun | | |
/s/ ROBERT S. WIESENTHAL | | Director |
Robert S. Wiesenthal |
| |