
| 1 |

| Q2 2021 | Q2 2020 | Q2 2019 |
Revenue ●Q2 2021 performance demonstrates continued relative U.S. strength as well as a broadening recovery
| $235M 298% Y/Y (44)% Y/2Y | $59M
| $422M |
Net Income / (Loss) ●Q2 2021 Net loss improved primarily due to revenue improvement
| $(40)M
| $(153)M
| $34M |
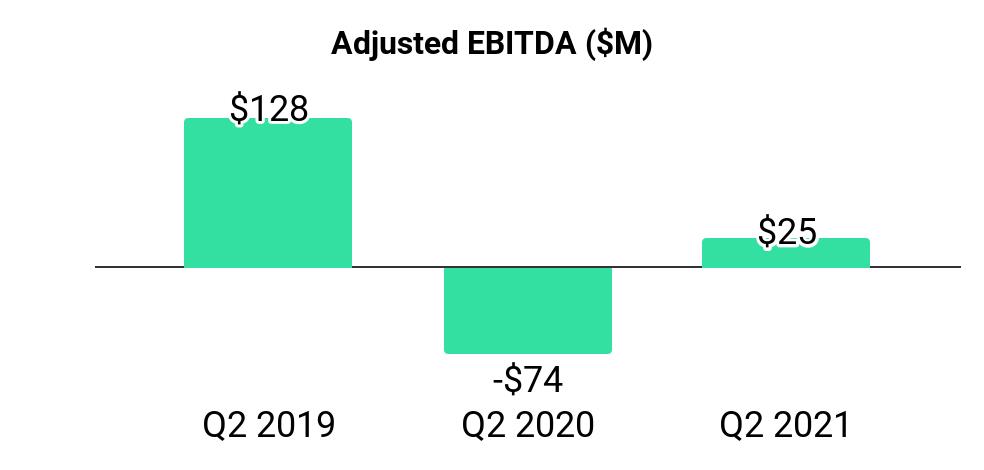
Adjusted EBITDA (1) ●Generated positive Adjusted EBITDA in Q2 2021 | $25M
| $(74)M
| $128M |
| (1) | Consolidated Adjusted EBITDA is a non-GAAP profit measure and is defined as net income (loss) plus: (1) provision (benefit) for income taxes; (2) other income (expense), net; (3) depreciation and amortization; (4) stock-based compensation and other stock-settled obligations; (5) goodwill, intangible asset, and long-lived asset impairments; (6) legal reserves and settlements; (7) restructuring and other related reorganization costs; and (8) non-recurring expenses and income. |
| 2 |
|
Letter to Shareholders
Have vaccine, will travel.
During Q2, vaccination rates increased and reopenings took hold, both undeniably positive steps towards travel’s full recovery. These developments, combined with strong pent-up consumer travel demand and record personal savings levels, drove improved results across our key products and regions.
The emerging recovery, along with strong execution by our team, drove improved financial performance in the quarter. Revenue of $235 million was 56% of Q2 2019 levels and increased 91% versus Q1 2021. We narrowed our net loss to $40 million, and we swung to a positive adjusted EBITDA of $25 million. These results exceeded our internal expectations, and demonstrate the resilience of our business.
We are pleased with our progress on a number of fronts:
| ● | The U.S. market led the way and strengthened throughout the period. U.S. hotel metasearch auction revenue grew in June and nearly achieved 2019 levels in the second quarter. |
| ● | Recovery in our Experiences offering has occurred sooner than we expected. Q2 U.S. bookings and revenue improved significantly year-over-year and versus Q1 2021. Europe travel demand picked up recently, though it still lags that of the U.S. |
| ● | Europe travel demand recovery accelerated in May and June, signaling an early broadening of the global travel recovery. Europe hotel metasearch auction revenue improved materially in May and June as well, and dining revenue at TheFork accelerated throughout the quarter as countries, cities, and restaurants started to reopen. |
| ● | Our narrowed quarterly net loss and positive adjusted EBITDA are testaments to our ongoing cost discipline. We kept fixed headcount and discretionary expenses roughly flat both year-over-year and compared to Q1 2021. On the variable cost side, in Q2 we leaned into areas of strength and increased marketing in the Hotel auction and Experiences. |
| ● | Tripadvisor Plus became available to all U.S. consumers in June and entered into supply partnerships that enhance the consumer value proposition. We also rolled out a completely redesigned Tripadvisor app, another achievement along our consumer-focused vision to help more people become better travelers. |
Some factors driving travel’s recovery remain outside of our control, and we of course are mindful of the ongoing risks posed by the virus and its variants. However, July revenue as a percentage of 2019 level improved versus June, and while the travel landscape could see near-term unevenness, we believe the recovery remains on an overall positive trajectory. Our consumer surveys continue to suggest strong pent-up travel demand, and consumer activity on Tripadvisor indicates that consumers are getting back out to explore the world. We remain optimistic not only for a stronger second half of 2021, but also for improvement in 2022 as vaccination rates increase, countries reopen, and leisure travel’s recovery further broadens.
Additionally, we are executing towards an exciting future that extends well beyond leisure travel’s eventual rebound. For the hundreds of millions of travelers on Tripadvisor every month, especially our most engaged members, we are building and improving tools that help them research, plan, and book the trips that matter and help them be better travelers. Differentiating our Experiences and Dining offerings, and expanding our Tripadvisor Plus service to enable more members to unlock savings and premium travel experiences, remain top priorities. For travel partners, we are leveraging our unique position, rich first-party data, scalable technology, and innovative go-to-market strategies to help them capitalize on Tripadvisor's valuable global audience to drive impressions, leads, and bookings for their businesses.
In summary, more than a year into the pandemic, our business has proven resilient and we are making progress building toward the future of travel. By leveraging our platform’s unique strengths, we are helping partners succeed, we are deepening member engagement on our platform, and we are laying the foundation for sustained, profitable growth in the years to come.
***
| 3 |
Q2 2021 Business Update
Monthly unique users improved, and improvement broadened, throughout Q2. Monthly unique users on Tripadvisor-branded websites in Q2 were approximately 70% of 2019’s comparable period, up from approximately 55% in Q1. Monthly unique users also improved sequentially during the quarter, as April, May, and June were approximately 59%, 71%, and 79% of 2019’s comparable periods, respectively. We see consumer traffic on our site as a leading indicator of consumer’s desire to travel.

From a geographical perspective, the U.S. showed continued strength, and the recovery broadened to international markets throughout the quarter. U.S. monthly unique users averaged approximately 85% of 2019 levels in May and June, up from nearly 80% in April.
Europe monthly unique users exceeded 90% of 2019 levels in June, up from nearly 60% in April. We saw notable strength in our key European markets of France, Italy, Germany, and Spain, some of our largest countries beyond the U.S. and U.K. In these countries, monthly unique users approached 95% of 2019 levels in June, up from nearly 40% in April. In the U.K., unique users were approximately 70% of 2019 levels in June, up from nearly 45% in April.
Recovery in Rest of World lagged in April and May amidst significant travel restrictions; however, monthly unique users reached approximately 55% of 2019 levels in June.
In terms of travel planning by trip type, recovery has been limited to certain pockets. Specifically:
| ● | Worldwide, searches for domestic travel represented nearly 80% of searches during the quarter, compared to approximately 50% in pre-pandemic times. |
| ● | Searches for trips outside of urban centers, particularly in outdoor adventure-based destinations, have remained popular. Searches for B&Bs, hotels on lakes, hotels with nearby hiking, and ‘pets allowed’ have been popular throughout the 2021 summer travel planning season. |
We see the concentrated recovery thus far, as well as rising consumer confidence and signs of pent up demand, as indications of a more powerful recovery to come:
| ● | In the U.S., forty percent of travelers surveyed say they plan to spend more on their next trip compared to what they spent on travel prior to the pandemic. Globally, more than a third of vaccinated travelers surveyed plan to spend more on their next trip. |
| ● | Overall, consumers on Tripadvisor are researching and planning trips with longer lead times, and nearly a third of vaccinated respondents plan to take a longer trip than they would have done pre-pandemic. |
| ● | Recent Tripadvisor consumer surveys and site behavior indicate that urban destinations are starting to re-emerge as a trip of choice for travelers. |
| 4 |
|
| ● | International travel planning has also been picking up recently, accounting for a quarter of trip searches with stay dates in late 2021 and into 2022. Our Tripadvisor search data indicates that Europeans are the keenest to travel internationally, and the European Travel Commission Q2 report indicated that European travel demand is expected to pick up considerably in the second half of 2021. |
Revenue recovery broadened as well. Q2 revenue was $235 million and, at 56%, revenue as a percentage of 2019’s comparable period was 23 percentage points better than it was in Q1 2021.
Consolidated revenue in April, May, and June was approximately 46%, 53%, and 66%, respectively, of 2019’s comparable periods and exceeded all pandemic impacted months from last year.

Q2 updates across our diverse offerings:
| ● | In Tripadvisor-branded hotels, our hotel auction had a strong improvement in Q2 versus Q1. |
| ○ | In Q2, U.S. hotel shoppers reached approximately 90% of 2019 levels (up from approximately 70% of 2019 levels in Q1) and Europe hotel shoppers were nearly 75% of 2019 levels (compared to approximately 45% in Q1). |
| ○ | U.S. Hotel auction CPCs regained 2019 levels in early May and have been at or above 2019 levels since, demonstrating strong partner engagement on our platform as travel demand recovers. Solid and improving auction monetization enabled increased efficient marketing investment on performance channels, which enhanced our Q2 hotel auction growth. |
| ○ | Q2 U.S. hotel auction revenue nearly reached parity with Q2 2019 levels and, in June, grew by more than 15% versus June 2019 levels based on continued strong CPC trends. Europe and Rest of World hotel auction revenue continued to lag the U.S. recovery, but both improved in Q2 versus Q1. Overall, our hotel auction revenue reached approximately 80% of 2019 levels in June compared to approximately 50% in April. |
| ● | The other component of Tripadvisor-branded hotels - Hotel B2B services - remained a steady performer in Q2 given its primarily subscription-based revenue. We are committed to driving insights and value on our platform and helping partners rebuild and thrive. |
| 5 |
| ● | In Tripadvisor-branded display and platform, revenue as a percentage of 2019 levels improved each month throughout the first half of the year and reached approximately 70% of 2019 levels in June. Since mid-2019, we have expanded the media ad products clients can buy from 10 to 40, and we have gained traction bringing our modernized media advertising |
| ● | Moving to E&D, in our Experiences offering, U.S. trends improved as Q2 progressed. In June, bookings on our U.S. sites exceeded June 2019 levels, up from approximately 60% levels in April. Cancellations remain elevated compared to 2019 levels, but have moderated year-over-year. We have also seen bookings for the U.S. as a destination grow dramatically versus 2019 levels, with particular strength in experiences that involve water and outdoor-related activities. |
Our transaction-based business, Viator, has been the primary driver of Experiences’ rapid recent recovery. We leaned into Q2 recovery on performance marketing channels in order to capture additional market share. Bookings on our Viator point-of-sale exceeded 2019 levels in June and improved further in July.
We are pleased to see strong consumer demand on our platform as well as the resilience of our key markets so far this year. Helping consumers find and book travel experiences online remains a large and attractive long-term growth opportunity, and we believe our Tripadvisor and Viator assets position us to grow for years to come.
| ● | In Dining, we have seen notable recovery since mid-May, as restaurants in most of the European countries started to reopen for in-restaurant dining. Overall, Dining revenue reached approximately 90% of 2019 levels in June. Also, consumers who booked for the first time on TheFork grew by more than 15% in June versus June 2019 levels. With vaccines now available throughout the region, and restaurants starting to fully reopen, we are optimistic that TheFork business will once again prove resilient in the summer months. |
We note that revenue improvement as a percentage of 2019 levels in July versus June moderated versus the improvement we saw in May to June. We acknowledge the increased case counts and other challenges posed by the pandemic, which adds near-term uncertainty for the pace of the ongoing travel recovery. However, we currently expect Q3 financial performance will meaningfully exceed Q2 as a percentage of 2019. We expect this to be driven mostly by further improvement in Europe.
We are optimistic about further travel recovery into 2022 and believe the industry has entered a ‘return to travel’ period and an initial release of significant pent-up demand. This has already been demonstrated in terms of demand for domestic travel, and primarily in the U.S., and we expect international travel, as well as Europe and the rest of the world, to follow closely behind.
Building an exciting future beyond the recovery. The Tripadvisor growth story extends well beyond the recovery. We remain laser-focused on leveraging Tripadvisor’s unique position with consumers and to serve members and deliver more value, creating durable long-term growth and profitability for our business. These objectives coalesce nicely within our new consumer subscription service, Tripadvisor Plus.
Plus progress. Launching a subscription service gives Tripadvisor the imperative to super-serve subscription members and deliver them increasing value over time. Subscribers continue to achieve attractive average savings of more than $300, which is well in excess of the $99 subscription fee. This year we have added car rental savings and benefits through our partnership with Hertz and flight discounts through Dollar Flight Club. We are exploring a number of potential partnership opportunities to broaden the offering and drive wider distribution.
In June, we rolled out Plus to 100% of U.S. consumers and have started to amplify Plus consumer messaging, both on and off the Tripadvisor platform. For example, on Tripadvisor, we have been adding improvements to the hotel shopping experience, including Plus-focused marketing on our website and in our email campaigns to members, and within our mobile experience, including on the new Tripadvisor native app. We are also testing merchandising Plus during check-out for an Experiences transaction.
Delivering hotel savings is an important part of the Plus value proposition. We made progress recently on a number of fronts:
| ● | First, we entered into a partnership with one of the leading global OTAs, Trip.com Group. |
| 6 |
| ● | Second, as we indicated last quarter, we have been extensively testing ways to merchandise Plus and increase the opportunities for consumers to see a Plus offer. We are making gains and, at present, we can offer Plus deals on more than 100,000 hotels. |
| ● | Third, we entered our first hotel-direct partnerships with four hotel chains - Barceló Hotels, Melia Hotels International, Millennium Hotels and Resorts, and Pestana Hotel Group. Once fully integrated, this adds direct connections with approximately 850 properties to Plus and enables Plus subscribers to access special room rates and guest perks, such as welcome gifts, dining, and spa credits, and late check-out. |
| ● | Fourth, we partnered with four hotel technology providers, which enables connectivity to independent hotels, the top 10 hotel groups, as well as hundreds of regional hotel chains of all sizes throughout Europe, China, and North America. This gives us the opportunity to potentially sign up an estimated additional 45,000 hotels. |
| ● | Fifth, we have developed a new way to communicate hotel discounts that we believe will help increase adoption, addressing initial concerns from large hotel chains during our early beta. Feedback from the major chains on these new designs has been quite positive. We have also been able to leverage our instant booking infrastructure, which was developed over the years and has been leveraged by thousands of brands and independents, in order to speed up the onboarding of Plus hotel supply. We also expect to leverage our Trip.com partnership, including their extensive supply, to facilitate this service. |
We are just getting started and, while our 2021 expectations remain measured, we are very excited about the opportunity, our positioning, and what we are building. As we outlined earlier this year, hundreds of millions of consumers have chosen their preferred subscription services across categories like music, online shopping, and video content. However, there has been a notable void of an affordable, high-value subscription offering in travel. We believe the global market opportunity is tens of millions of subscribers, implying multi-billion dollars of recurring revenue. With our global audience of hundreds of millions of visitors per month, and our influence with travelers and travel partners, we believe we are uniquely positioned to capture a meaningful share of this long-term opportunity.
Q2 2021 Financial Update
Q2 2021 revenue was $235 million, representing a year-over-year increase of 298% and a 91% increase versus Q1 2021, which is well beyond typical seasonality for these periods. At approximately 56% of 2019’s comparable period, Q2 2021 revenue performance improved by 23-percentage points versus Q1 2021, which performed at 33% of 2019’s comparable period. Moreover, monthly revenue performance improved throughout the quarter, driven primarily by strengthening U.S. travel demand as well as improved travel demand in Europe in May and June.

Q2 2021 operating expenses increased 21% year-over-year to $270 million. The year-over-year and sequential quarterly expense increases were driven primarily by increased variable expenses (including performance-based marketing and the transaction-based cost of revenue), which reflected the recovering travel demand environment through the summer travel planning season, as well as increased marketing expenses on performance-based channels in order to lean into the recovery in the U.S. and boost our competitive position in Experiences in particular. We expect variable expenses will track generally in line with consumer travel demand trends moving forward, though we may seek additional opportunities to gain share during the recovery.
| 7 |
On the fixed cost side, during Q2 2021 we maintained rigorous cost controls in workforce-related and discretionary expense areas and these costs remained roughly flat versus both Q2 2020 and Q1 2021. Our ending headcount was 2,648, or 10% lower year-over-year, and 32% lower than at the end of 2019, and we continue to expect the majority of the 2020 fixed cost savings will persist in 2021. (Note that these estimated cost savings levels do not consider depreciation, amortization, restructuring and other related reorganization costs, or stock-based compensation.)
Q2 2021 consolidated net loss narrowed by $113 million year-over-year driven primarily by revenue improvement, partially offset by increased variable marketing expenses.

Q2 2021 Adjusted EBITDA was $25 million and improved by $99 million year-over-year, driven primarily by revenue improvement against our stable fixed cost base, partially offset by increased variable marketing expenses. We believe we have positioned the business for operating leverage as travel demand and our revenue recovers further.
Moving to the balance sheet, we had $775 million of cash and cash equivalents as of June 30, 2021, an increase of $101 million since the end of Q1 2021, driven by positive operating cash inflow.
As for cash flow, we had a $126 million operating cash inflow in Q2, driven primarily by an increase in working capital during the period, offset in part by our net loss. This inflow compares very favorably to the $78 million operating cash outflow in Q2 2020, which was the first full quarter with impact from the pandemic, and was a quarter in which consumers canceled their experiences and rentals bookings at historically high rates. This is also reflected in deferred merchant payables, which increased $116 million year-over-year (from a $14 million outflow in Q2 2020 to a $102 million inflow in Q2 2021), primarily driven by significant increases in experiences bookings on our platform.
Outlook
(As a reminder, we endeavor to be as accurate as possible with our forward-looking commentary; however, a number of factors outside of our control can limit our visibility into future financial performance and can cause our results to vary materially from our current expectations.)
Recovery year-to-date, including the notable progress since the beginning of Q2, is encouraging. We believe leisure travel’s eventual full recovery will be defined by rising consumer confidence and traveler safety including a full return of travel activity in urban destinations as well as international travel. Achieving these milestones remains related to factors such as vaccine progress, reaching herd immunity, and/or easing government restrictions.
| 8 |
As such, while we remain mindful of the ongoing risks posed by the virus and its variants, and near-term results will likely remain materially impacted by travel market conditions and government restrictions, we continue to expect that leisure travel, and our business, could experience a more robust second‐half rebound as vaccinations increase, countries reopen, and the leisure travel recovery broadens. This includes our expectation for Q3 revenue and adjusted EBITDA performance to meaningfully improve versus Q2, both in absolute dollar terms and as a percentage of 2019.
We also remain committed to operating a fundamentally leaner fixed cost structure and continue to expect the majority of the 2020 fixed cost savings will persist in 2021. We expect variable costs will continue to generally move in line with travel demand, and we may also seek additional opportunities to efficiently lean into the recovery and gain share in strategic areas.
***
Earnings Webcast
Tripadvisor management will host a conference call to discuss results as well as forward-looking information at 8:30 a.m. ET on August 6, 2021. The link to the live webcast, as well as the audio replay, will be made available on Tripadvisor’s Investor Relations website at http://ir.tripadvisor.com.
A replay of the conference call will be available on the same website. A telephonic replay will be available for two weeks following the call at (855) 859-2056; passcode 6944807.
Investor relations contact
ir@tripadvisor.com
Media contact
uspr@tripadvisor.com
Forward-Looking Statements
These prepared remarks contain “forward-looking statements” within the meaning of Section 27A of the Securities Act of 1933, as amended, and Section 21E of the Securities Exchange Act of 1934, as amended. The following words, when used, are intended to identify forward-looking statements: “anticipate,” “believe,” “could,” “estimate,” “expect,” “intend,” “may,” “might,” “plan,” “project,” “target,” “should,” “will,” and similar expressions which do not relate solely to historical matters. We caution investors that any forward-looking statements in these prepared remarks, or which management may make orally or in writing from time to time, are based on management’s beliefs and on assumptions made by, and information currently available to, management. Such statements are subject to risks, uncertainties and assumptions and are not guarantees of future performance, which may be affected by known and unknown risks, trends, uncertainties and factors that are beyond our control. Some of the risks and uncertainties that may cause our actual results, performance or achievements to differ materially from those expressed or implied by forward-looking statements are more fully described in Part I. Item 1A. "Risk Factors" of our Annual Report on Form 10-K. Moreover, we operate in a rapidly changing environment. New risk factors emerge from time to time and it is not possible for management to predict all such risk factors, nor can we assess the impact of all such risk factors on our business or the extent to which any factor, or combination of factors, may cause actual results to differ materially from those contained in any forward-looking statements. We caution you that, while forward-looking statements reflect our good faith beliefs when we make them, they are not guarantees of future performance and are impacted by actual events when they occur after we make such statements. We expressly disclaim any responsibility to update our forward-looking statements, whether as a result of new information, future events or otherwise.
Investors should also refer to our quarterly reports on Form 10-Q for future periods and current reports on Form 8-K as we file them with the SEC and to other materials we may furnish to the public from time to time through current reports on Form 8-K or otherwise, for a discussion of risks and uncertainties that may cause actual results, performance or achievements to differ materially from those expressed or implied by forward-looking statements.
| 9 |
Use of Non-GAAP Financial Measures
These prepared remarks may include references to non-GAAP measures, such as consolidated adjusted EBITDA (including forecasted adjusted EBITDA), free cash flow, and constant currency measurements, such as, non-GAAP revenue before effects of foreign exchange, and adjusted EBITDA before effects of foreign exchange, which are considered non-GAAP financial measures as they are not prepared in conformity with accounting principles generally accepted in the United States (“GAAP”). These non-GAAP financial measures are not prepared under a comprehensive set of accounting rules and, therefore, should only be reviewed alongside results reported under GAAP.
We encourage investors to review our earnings press release as it contains important information about our financial results, including tabular reconciliations to the most directly comparable GAAP financial measure, definitions, limitations and other related information about these non-GAAP financial measures. We have not reconciled consolidated adjusted EBITDA guidance to projected consolidated GAAP net income (loss) because we do not provide guidance on GAAP net income (loss) or the reconciling items between adjusted EBITDA and GAAP net income (loss), as a result of the uncertainty regarding, and the potential variability of, certain of these items. Accordingly, a reconciliation of the non-GAAP financial measure guidance to the corresponding GAAP measure is not available without unreasonable effort.
The earnings press release in addition to other supplemental financial information is available on the Investor Relations section of our website at http://ir.tripadvisor.com/. The earnings press release is also included as Exhibit 99.1 to our Current Report on Form 8-K as furnished to the SEC on August 5, 2021, which is available on the Investor Relations section of our website at http://ir.tripadvisor.com/ and the SEC’s website at www.sec.gov.
Key Business Metrics
We review a number of metrics, including unique visitors, hotel shoppers, and other metrics, to evaluate our business, measure our performance, identify trends affecting our business, formulate business plans and make strategic decisions. While these numbers are based on what we believe to be reasonable estimates for the applicable period of measurement, there are inherent challenges in measuring usage and user engagement across our large user base around the world. For example, a single user may have multiple member accounts or browse the internet on multiple browsers or devices, some users may restrict our ability to accurately identify them across visits, and we are not always able to capture user information on all of our platforms. As such, the calculations of our active users may not accurately reflect the actual number of people or organizations using our platform. Our metrics are also affected by applications that automatically contact our servers for regular updates with no discernible user action involved, and this activity can cause our system to count the users associated with such applications as active users on the day or days such contact occurs. As such, the calculation of some of the metrics presented may be affected as a result of this activity. We regularly review our process and may adjust how we calculate our internal metrics to improve their accuracy.
| 10 |