UNITED STATES
SECURITIES AND EXCHANGE COMMISSION
Washington, D.C. 20549
FORM N-CSR
CERTIFIED SHAREHOLDER REPORT OF REGISTERED
MANAGEMENT INVESTMENT COMPANIES
Investment Company Act file number: 811-23146
Natixis ETF Trust
(Exact name of Registrant as specified in charter)
888 Boylston Street, Suite 800 Boston, Massachusetts 02199-8197
(Address of principal executive offices) (Zip code)
Susan McWhan Tobin, Esq.
Natixis Distribution, LLC
888 Boylston Street, Suite 800
Boston, Massachusetts 02199-8197
(Name and address of agent for service)
Registrant’s telephone number, including area code: (617) 449-2139
Date of fiscal year end: December 31
Date of reporting period: December 31, 2023
Item 1. Reports to Stockholders.
| (a) | The Registrant’s annual report transmitted to shareholders pursuant to Rule 30e-1 under the Investment Company Act of 1940 is as follows: |
Annual Report
December 31, 2023
Natixis Gateway Quality Income ETF |
Natixis Loomis Sayles Focused Growth ETF |
Natixis Loomis Sayles Short Duration Income ETF |
Natixis Vaughan Nelson Mid Cap ETF |
Natixis Vaughan Nelson Select ETF |
IMPORTANT NOTICE TO SHAREHOLDERS
The Securities and Exchange Commission (SEC) has adopted new regulations that will result in changes to the design and delivery of annual and semiannual shareholder reports. Beginning in July 2024, Funds will be required by the SEC to send shareholders a paper copy of a new tailored shareholder report in place of the full shareholder report that is currently being provided. If you would like to receive shareholder reports and other communications from the Funds electronically, instead of by mail, you may make that request at www.icsdelivery.com/natixisfunds. If you have already elected to receive shareholder reports electronically, you will not be affected by this change, and you need not take any action.
Natixis Gateway Quality Income ETF
|
|
|
|
|
Gateway Investment Advisers, LLC
|
Investment GoalThe Fund seeks to deliver current income while maintaining prospects for capital appreciation.
Market Conditions
The S&P 500® Index returned 7.50%, 8.74%, -3.27%, and 11.69% in the first, second, third, and fourth quarters of 2023, respectively. Despite significant turmoil and growing global conflict, the year was all about the US Federal Reserve (Fed) and expectations surrounding the path of monetary policy. Investors attempted to predict the direction of Fed decisions and, most importantly, the level and pace of interest rate increases. After record inflation and negative equity markets in 2022, signs of softening inflation in January 2023 helped the S&P 500® Index climb 8.98% from January 1 to February 2, 2023. Sudden tumult from a regional bank crisis contributed to a 7.53% decline in the S&P 500® Index from February 2 to March 13. As confidence in the financial system showed signs of deterioration, the Fed enacted emergency measures which relieved investor concerns and fueled a 19.72% rally in the S&P 500® Index from March 13 to July 31. Last-minute US debt ceiling negotiations triggered a surprise credit downgrade by Fitch Ratings and a second wave of regional bank downgrades. The burst of uncertainty contributed to a 9.94% equity market decline from the end of July to October 27. As inflation continued to ease, a less-hawkish tone from the Fed kicked off a 16.23% market advance from October 27 through year-end.
With a significant equity market advance during 2023, implied volatility drifted lower, as expected. Implied volatility, as measured by the Cboe® Volatility Index (the VIX®), ended 2022 at 21.67 and averaged 16.85 during 2023. Consistent with its typical relationship, average implied volatility exceeded realized volatility, as measured by the standard deviation of daily returns for the S&P 500® Index, which was 13.10% for the year. The Volatility Risk Premium, or the difference between the two volatility measures, was positive throughout the year and averaged 4.19% in 2023, above its average of 4.08% since 1990. The VIX® spent most of 2023 ranging from the mid-teens to the mid-20s, closing above its long-term average of 19.58 for more than 20% of the year. The VIX® reached an intra-year high of 26.52 on March 13 at the height of the banking crisis before settling into a quiet summer supported by a rapid equity market advance and growing investor optimism surrounding the direction of monetary policy. The selloff from July 31 through October 27 drove the measure above summer lows, reaching a fourth quarter high of 21.71 on October 20. Implied volatility through the end of 2023 was stifled as hopes grew for an extended pause, or even a cut, in interest rates. The VIX® reached an intra-year low of 12.07 on December 12 and ended 2023 at 12.45.
Performance Results
Since the December 13, 2023 inception through December 31, 2023, the Natixis Gateway Quality Income ETF returned 1.97% at net asset value. The Fund underperformed its benchmark, the S&P 500® Index, which returned 2.79% for the same period.
Explanation of Fund Performance
The Fund invests in a diversified portfolio of high-quality US common stocks and combines it with the characteristics of an options selling overlay program designed to provide consistent cash flow to support a monthly distribution, enhance return, and reduce downside risk. High-quality companies offer the potential to benefit from rising equity markets while also providing protection during times of uncertainty. Over the long-term, a quality focus can provide a robust risk and return profile relative to other factors and lead to outperformance relative to the broad market. The Fund’s equity portfolio is driven by a focus on key fundamental variables and invests in firms exhibiting consistent quality factors. The Fund uses equity-linked notes (ELNs) to replicate the performance of selling index covered call options on a portion of the underlying equity portfolio. This combination helps drive monthly income, enhances yield, and reduces volatility. The options overlay covers 50% of the equity portfolio to provide investors with consistent income and monthly payouts. The remaining 50% of the equity portfolio is uncovered to provide unhedged market exposure. This approach balances long-term growth with monthly income.
The cash flow generated by the strategy is a factor of the level of participation the strategy has in a rising equity market and how much protection is provided in a falling market. The amount of cash flow available to the strategy varies with the amount of implied
Natixis Gateway Quality Income ETF
volatility priced into the index options market, with higher volatility generally resulting in more cash flow while lower implied volatility generally results in less cash flow.
The Fund underperformed its benchmark since its inception on December 13, 2023 through year-end. The Fund’s equity portfolio returned 2.28% during this period, a performance differential of negative 0.51% versus the S&P 500® Index. With no maturities during the reporting period, the ELN portion of the Fund performed as expected. The measured risk of the Fund, as measured by the standard deviation of daily returns for this period, was 8.49% versus 11.08% for the S&P 500® Index.
Outlook
The Federal Funds Effective Rate (Fed Funds Rate) was increased seven times during 2022, ratcheting from 0.07% to 4.33%. With a significant departure from the quantitative easing approach of the prior decade or more, the consensus was that the Fed had been too aggressive and risked pushing the US economy into recession. Amidst progress against inflation paired with an impressively resilient economy and labor market, the Fed’s tone turned less hawkish as the year progressed and led to a pause in the rate hiking cycle. Ultimately, the Fed Funds Rate climbed to 5.33% in July 2023 and was held steady through year-end. Bond yields are higher than prior to the Global Financial Crisis but only time will tell if current yields will be overwhelmed by lower-but-persistent inflation or be sufficient compensation for the potential loss of principle if the Fed’s tightening cycle resumes.
There are growing expectations of interest rate cuts in 2024 and some market participants may view such a reversal as a potentially bullish development. The historical record is not so sanguine as the effects of monetary policy tend to lag policy action and create significant uncertainty. On average, the equity market advanced 5.1% in the one-year period following an interest rate cut, although investors had to withstand significant drawdowns and increased volatility along the way.
While it’s impossible to predict market performance in 2024, a review of the last 25 years shows that the equity market has climbed more than 20% in eight of those years. In the year following those advances, average returns were just 3.8%. Positive, but hardly as exciting as 2023’s results. With ample drivers of volatility on the horizon – such as the US presidential election, geopolitical uncertainty, and ongoing wars – risk management may be prudent.
If current levels of volatility and interest rates persist, or move higher, option writing premiums may continue to be an effective source of cash flow. Whether the Fed resumes rate hikes, holds steady, or even cuts rates, investment strategies that combine high-quality equity market exposure with cash flow from writing index options may benefit from relatively higher levels of interest rates and implied volatility. Quality investing paired with robust cash flow from option writing seeks to provide attractive return potential during market advances and attractive downside protection potential in market declines.
Top Ten Holdings as of December 31, 2023 |
| |
| |
| |
3 Alphabet, Inc., Class A | |
| |
5 Canadian Imperial Bank of Commerce, (S&P 500 Index) | |
6 Morgan Stanley Finance LLC, (S&P 500 Index) | |
7 BNP Paribas Issuance BV, (S&P 500 Index) | |
8 UBS AG, (S&P 500 Index) | |
| |
10 Mastercard, Inc., Class A | |
The portfolio is actively managed and holdings are subject to change. There is no guarantee the Fund continues to invest in the securities referenced. The holdings listed exclude any temporary cash investments, are presented on an individual security basis and do not represent holdings of the issuer. |
Natixis Gateway Quality Income ETF
Total Returns —December 31, 20231 |
| Life of Fund (Inception 12/13/23) | |
| | |
| | | |
| | | |
| | | |
| | | |
Performance data shown represents past performance and is no guarantee of, and not necessarily indicative of, future results. Total return and value will vary, and you may have a gain or loss when shares are sold. Current performance may be lower or higher than quoted. For most recent month-end performance, visit im.natixis.com/performance. You may not invest directly in an index. Performance for periods less than one year is cumulative, not annualized. Returns reflect changes in share price and reinvestment of dividends and capital gains, if any. The table(s) do not reflect taxes shareholders might owe on any fund distributions or when they redeem their shares.
| Fund performance has been increased by fee waivers and/or expense reimbursements, if any, without which performance would have been lower. |
| Expense ratios are as shown in the Fund’s prospectus in effect as of the date of this report. The expense ratios for the current reporting period can be found in the Financial Highlights section of this report under Ratios to Average Net Assets. Net expenses reflect contractual expense limitations set to expire on 4/30/26. When a Fund’s expenses are below the limitation, gross and net expense ratios will be the same. See Note 6 of the Notes to Financial Statements for more information about the Fund’s expense limitations. |
| The NAV return is based on the NAV of the Fund, and the market return is based on the market price per share of the Fund, which is determined by using the midpoint between the highest bid and the lowest offer on the primary stock exchange on which shares of the Fund are listed for trading, as of the time that the Fund’s NAV is calculated. 12/13/23 represents the date trading of Fund shares commenced on the secondary market. 12/12/23 represents commencement of operations for accounting and financial reporting purposes only. NAV is used as a proxy for the opening market price on 12/13/23. Market and NAV returns assume that dividends and capital gain distributions have been reinvested in the Fund at market price and NAV, respectively. |
| S&P 500® Index is a widely recognized measure of U.S. stock market performance. It is an unmanaged index of 500 common stocks chosen for market size, liquidity, and industry group representation, among other factors. It also measures the performance of the large cap segment of the U.S. equities market. |
Natixis Loomis Sayles Focused Growth ETF
|
|
Loomis, Sayles & Company, L.P.
|
Investment GoalThe Fund's investment objective is long-term growth of capital.
Market Conditions
The US equity market overcame a number of potential headwinds to post a robust total return in 2023. The interest-rate outlook was a key driver of volatility throughout the year, as the US Federal Reserve (Fed) continued to raise rates—albeit at a slower pace than in 2022—to combat inflation. This issue became more prominent in late summer and early autumn, when rising energy prices fueled concerns that persistent inflation could compel the Fed to keep rates “higher for longer.” The backdrop changed considerably in the fourth quarter, however, thanks to a series of cooler-than-expected inflation reports. In addition, Fed Chairman Jerome Powell surprised the markets in December by indicating that the central bank was likely finished raising rates and possibly on track to begin enacting rate cuts in 2024. Not least, it appeared that GDP growth would remain in positive territory and allow the Fed to achieve the ideal outcome of a “soft landing” for the economy. Stocks surged in response, bringing most major large-cap indexes to near all-time highs by year-end.
The late rally was broad-based, with strong participation from market segments—including the value style, small caps, and mid caps—that had underperformed for most of 2023. Despite this shift, growth stocks were the key source of market leadership over the full year. Mega-cap technology-related companies produced particularly impressive gains that were fueled, in part, by excitement about the long-term prospects for artificial intelligence. On the other hand, the more traditionally defensive segments of the market lagged.
Performance Results
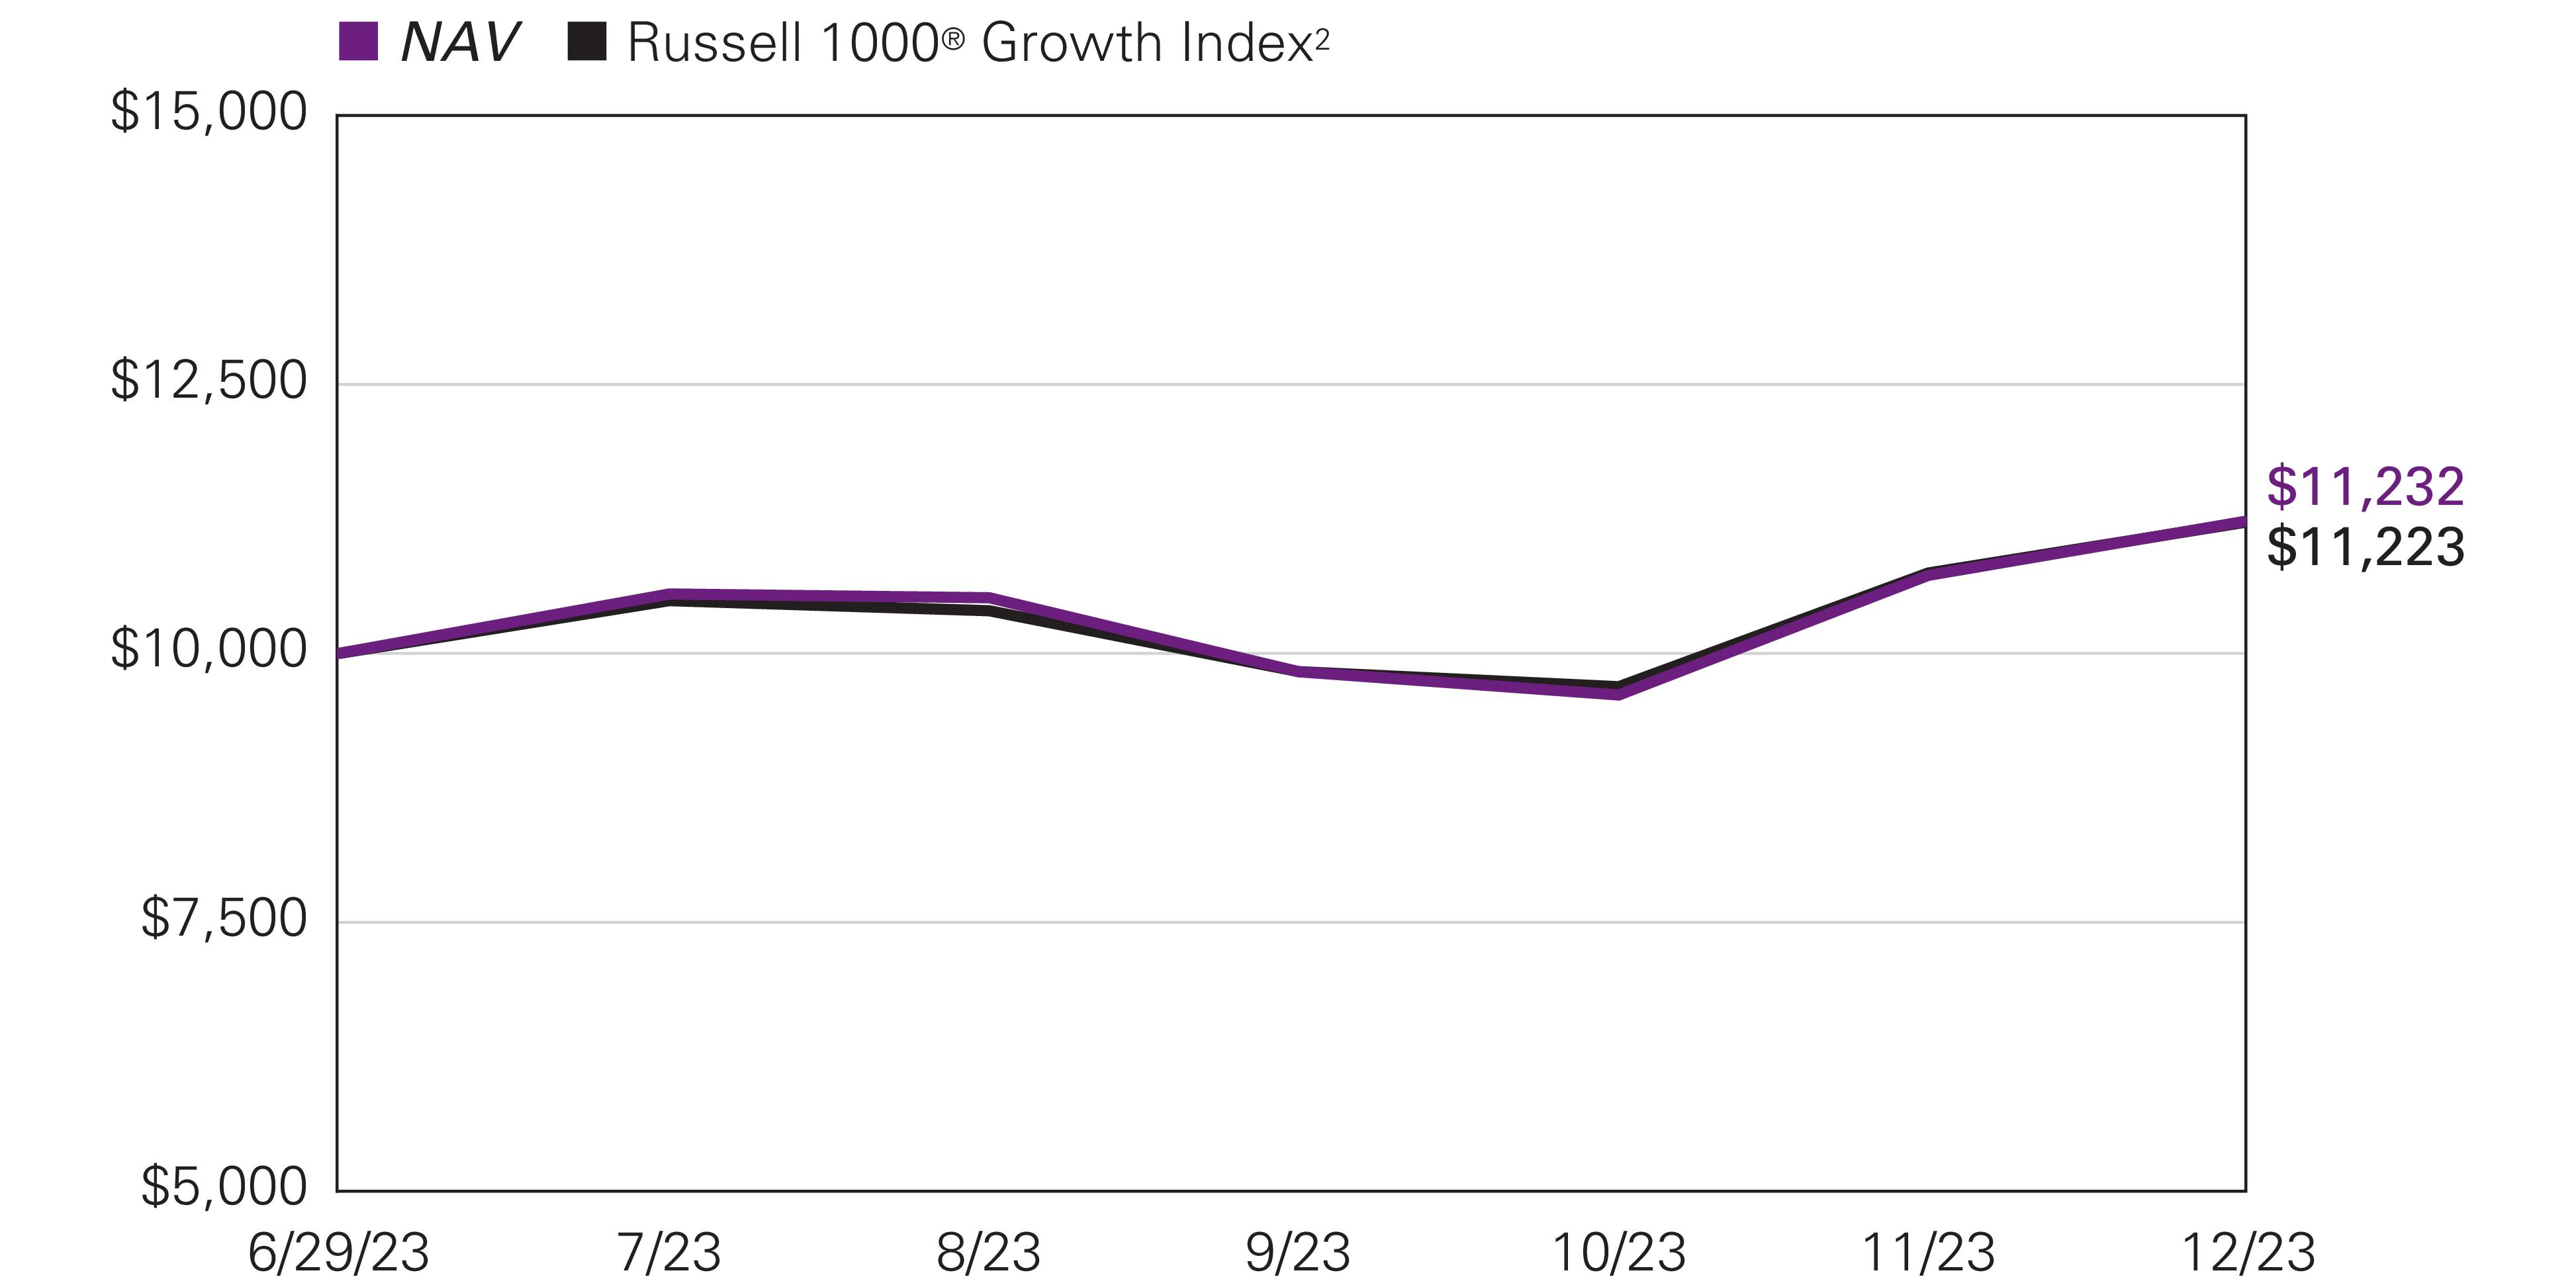
The Natixis Loomis Sayles Focused Growth ETF was launched on June 29, 2023. For the period ended December 31, 2023, shares of the Fund returned 12.31% at net asset value. The Fund outperformed its benchmark, the Russell 1000® Growth Index, which returned 12.23%.
Explanation of Fund Performance
We are an active manager with a long-term, private equity approach to investing. Through our proprietary bottom-up research framework, we look to invest in those few high-quality businesses with sustainable competitive advantages and profitable growth when they trade at a significant discount to intrinsic value. Given the rare confluence of quality, growth, and valuation, we may study dozens of companies but may only invest in a select few businesses each year. We believe identifying those few businesses with such characteristics is an art, not a science. As a result of this rigorous approach, ours is a selective, high-conviction portfolio of typically 20–30 stocks.
The Fund’s positions in Meta Platforms, Nvidia, and Amazon contributed the most to performance. Stock selection in the industrials, information technology, and financials sectors, along with our allocation in the communication services sector, contributed positively to relative performance.
Meta Platforms operates online social networking platforms that allow people to connect, share, and interact with friends and communities. With 3.9 billion monthly users, 200 million businesses, and 10 million advertisers worldwide using its family of apps – Facebook, Messenger, WhatsApp, and Instagram – we believe the scale and reach of Meta’s network is unrivaled. A Fund holding since inception, Meta’s shares rebounded substantially in 2023 after being under pressure throughout most of 2022 due to a perceived lack of discipline in the company’s capital expenditures – especially with respect to the metaverse – that coincided with what we believed was temporary fundamental weakness arising from the company’s transition to a new advertising format and maneuvering around privacy changes imposed by Apple in 2021. Our analysis suggested that Meta was being priced as if a high-quality, high-returning, growth company – whose returns on capital were many times larger than its cost of capital – would become a low-quality business that both ceased to grow and would also see its margins and returns on invested capital deteriorate. Despite ongoing macroeconomic pressure on advertising spending, during the reporting period Meta, posted consecutive quarters of better-than-expected financial results, including accelerating revenue growth as it made further progress in navigating Apple’s privacy changes and saw improved monetization of its newest Reels video format. Earlier in the year, Meta announced a set of efficiency measures that have already led to significant improvements in margins and lower capital expenditure plans, and shares responded positively to the company’s increased focus on productivity and cost management. We believe founder and CEO Mark Zuckerberg has always managed
Natixis Loomis Sayles Focused Growth ETF
the company with a long-term focus and strong strategic vision. Over the past ten years, Meta has spent over $125 billion on research and development and $110 billion on capital expenditures – a level of investment that few firms can match, and which creates high barriers to entry for competitors that are further buttressed by the growth of cumulative knowledge over time. The successful development of a metaverse is not an explicit part of our investment thesis for Meta. However, given the potential size of the opportunity, which we estimate could impact over $1 trillion of spending over the long term, and Meta’s positioning with billions of users and hundreds of millions of businesses, we believe Meta’s current balanced approach to its forward-looking investments make sense. We expect that corporations will continue to allocate an increasing proportion of their advertising spending online, and Meta remains one of very few platforms where advertisers can reach consumers at such scale in such a targeted and effective fashion. We believe Meta’s brands, network, and targeting advantage position the company to take increasing share of the industry’s profit pool and grow its market share from approximately 6% currently to approximately 10% of the total global advertising market over our investment time horizon. On the basis of its core business alone, we believe the company is substantially undervalued and trades at a significant discount to our estimate of intrinsic value.
Nvidia is the world leader in artificial intelligence (AI) computing, which enables computers to mimic human-like intelligence for problem solving and decision-making capabilities. We believe the company’s competitive advantages include its intellectual property, brands, and a large and growing ecosystem of developers and applications utilizing its GPU (graphics processing unit) technology. A Fund holding since inception, Nvidia reported record financial results during the period that were well above consensus expectations, as AI applications, including generative AI, are driving strong demand for GPUs by companies looking to leverage these capabilities and drive competitive differentiation. Revenue in the company’s gaming segment had been depressed, which we believe reflected global demand for PCs returning to pre-pandemic levels after a period of excess and the impact of Covid restrictions on China consumer spending. However, we believe the company has worked expeditiously in clearing existing inventory in its retail channels, which contributed to the gaming business returning to growth in the most recent two quarters. In its data center business, we believe Nvidia’s decades of focused investment, cumulative know-how, and robust software platform and architecture that has attracted millions of developers position the company to benefit from several secular long-term growth drivers, including continued growth in use cases for artificial intelligence. To further drive adoption by enterprises, Nvidia is also partnering with cloud service providers including Oracle, Microsoft, and Google to offer AI services via the cloud. We believe Nvidia remains strongly positioned to benefit from secular growth in PC gaming and is still in the early stages of growth in its data center business, which has the potential to be much larger in the long term. We believe Nvidia’s strong growth prospects are not currently reflected in its share price. As a result, we believe the company’s shares are trading at a significant discount to our estimate of intrinsic value, offering a compelling reward-to-risk opportunity.
Online retailer Amazon offers millions of products – sold by Amazon or by third parties – with the value proposition to consumers of selection, price, and convenience. Amazon’s enterprise IT business, Amazon Web Services (AWS), offers a suite of secure, on-demand cloud-computing services, with a value proposition to clients of speed, agility, and savings. In both of its core markets, we believe Amazon possesses strong and sustainable competitive advantages that would be difficult for competitors to replicate. A Fund holding since inception, Amazon reported fundamentally solid low-double-digit revenue growth and much higher growth in operating profits that were both above management’s guidance and consensus expectations during the period. Earlier in the year, the company saw a deceleration in growth in AWS as businesses continue to optimize their cloud spending following a period of economic weakness; the trend was also apparent at both Microsoft and Alphabet. During the reporting period, the optimization activity began to stabilize, and Amazon observed companies once again focusing on innovation rather than cost reduction and bringing increasing workloads to the cloud. Over the past few years, Amazon made substantial investments to ensure that its fulfillment and transportation network remained unconstrained during the pandemic. As a result, the company doubled its fulfillment footprint – which took 25 years to build – and built out a transportation network to support last-mile delivery. Given the company’s long-tailed secular growth opportunities, over time we believe it will realize greater productivity and fixed cost leverage from these investments in labor, fulfillment, and distribution. The company showed efficiency gains during the year due in part to its decision to transition away from a national network and towards several smaller regional networks. This resulted in faster and less expensive deliveries and contributed to operating margins expanding by over 400 basis points in each of the past two quarters. However, expense pressures are expected to persist as the company progresses towards full utilization of its new investments. We believe Amazon is one of the best-positioned companies in e-commerce and enterprise IT – in each case addressing large, underpenetrated markets experiencing secular growth that is still in its early stages. We also expect Amazon’s strong position in the e-commerce market to support an emerging advertising business, which has already reached a $44 billion annual revenue run rate. We believe the current share price shows a lack of appreciation for Amazon’s significant long-term growth opportunities and the sustainability of its business model. As a result, we believe the company is selling at a significant discount to our estimate of intrinsic value and offers a compelling reward-to-risk opportunity.
The Fund’s positions in Illumina, Oracle, and Tesla detracted the most from performance. Stock selection in the consumer discretionary, healthcare, information technology, and consumer staples sectors, as well as our allocations in the consumer discretionary and information technology sectors, also detracted from relative performance.
Natixis Loomis Sayles Focused Growth ETF
Founded in 1998, Illumina is the industry leader in the fast-growing field of sequencing for genetic and genomic analysis, supporting research, clinical, and consumer genetics applications. A Fund holding since inception, Illumina’s shares have been under pressure due to lower-than-expected results in its core business, uncertainty regarding its acquisition of GRAIL, and near-term management uncertainty following an activist investor campaign that succeeded in ousting the Chairman of the Board in May and later prompted the resignation of CEO Francis deSouza in June. While orders for its newest sequencing platform, NovaSeq X, had been solid, they slowed in the most recently reported quarter as the company observed a lengthening sales cycle among customers facing macroeconomic pressure – which has similarly impacted peers as well. Still, Illumina’s recent results and guidance are below our long-term expectations as we believe GRAIL has detracted from near-term focus and returns. Illumina acquired GRAIL in August 2021 but closed the transaction prior to receiving approval from the EU, which has since ordered that the business be divested. In December 2023, Illumina announced it will divest GRAIL and aims to have the terms finalized by June 2024. GRAIL is an early leader in asymptomatic cancer screening through liquid biopsies that use Illumina’s sequencing technology to detect tumor DNA in the bloodstream before it could otherwise be sampled via a traditional biopsy. While we believed that there was potential upside in GRAIL, our structural investment thesis for Illumina was not premised on a successful completion of the acquisition, and GRAIL will remain an important customer for the company. We believe the core Illumina business remains highly attractive on a reward-to-risk basis and remains substantially discounted relative to intrinsic value. Illumina is in the early stages of a major platform launch while simultaneously facing more competition than in recent years. Over the last two years, Illumina’s share of industry revenue has dropped from an estimated 80% to 77%. These share losses have been most pronounced in China and in the lower-value, mid- and low- throughput portions of the sequencing market. We anticipate Illumina will retain its dominant share in the high-value, high-throughput ends of the market on the strength of its product ecosystem and continue to capture approximately 75% of the sequencing market. In September, the company named Jacob Thaysen, Ph.D. as its new CEO. Thaysen previously served as President of the Life Sciences and Applied Markets Group at Agilent, and brings a background in research and development (R&D) as well as experience operating in genetics and clinical end market. We met with Thaysen and our interactions have been positive as we believe he has the requisite skills and vision to reinvigorate the core Illumina franchise. We are encouraged that new management seems committed to redoubling its focus on the significant opportunity in Illumina’s core markets and reinvigorating operational execution – which appeared to have diminished over the last several quarters under deSouza. In addition to the activist-sponsored candidate, Illumina also added two new board members with significant experience at innovative, market-expanding healthcare businesses that we believe should contribute positively to Illumina’s return to growth. Despite the near-term uncertainty, we believe Illumina remains advantageously positioned in a high-quality industry benefiting from long-term, secular growth. We believe Illumina is at the forefront of a multi-decade transformation that will see genetic analysis incorporated into multiple facets of our lives. While demand today is still predominantly from large life sciences research facilities, over the next decade we believe democratization of gene sequencing technology and greater practical application will result in the equipment becoming ubiquitous in clinical settings as well, with oncology offering the largest market opportunity. We believe Illumina is a dominant competitor whose sequencing technology represents the critical enabling technology that ideally positions it to capitalize on an approximately $100 billion market opportunity. We believe Illumina’s shares embed expectations for key revenue and cash flow growth drivers that are well below our long-term assumptions. As a result, we believe the company is selling at a significant discount to our estimate of its intrinsic value and offers a compelling reward-to-risk opportunity.
Oracle is a leader in the enterprise software market with a strong market position in database, infrastructure and application software, and cloud-based software and services. We believe the company’s competitive advantages include its large and experienced direct sales force, a founder-driven management team that reinvests relentlessly to maintain a leading intellectual property portfolio and differentiated product suite, and a large installed base of clients with high switching costs where it consistently achieves renewal and retention rates in the mid-90% range. We believe Oracle is well positioned to benefit from the continuing growth in data storage and enterprise application software, as well as the shift to cloud-based solutions. A Fund holding since inception, Oracle reported fundamentally solid financial results that were generally in line with or better than consensus expectations. However, shares may have responded negatively to a deceleration in cloud revenue growth, due in part to capacity constraints in its data centers. Oracle is a leading global provider of enterprise infrastructure software, which includes its database technology, Oracle Cloud Infrastructure (OCI), and enterprise applications software. Oracle is transitioning its entire software business from a traditional, on-premise, up-front software licensing and maintenance revenue model to a cloud computing subscription-based model where software revenue is recognized over the life of the client’s contract. The purchase of both database and applications software is typically a long-term decision for an enterprise (usually 7-10 years) due to the mission-critical nature of these products and the high switching costs involved for customers deciding to go with a new vendor. This contributes to high client retention. While there has been near-term pressure on year-over-year overall revenue comparisons during this transition as up-front license revenue shifts to subscription revenue, we expected this to lead to faster growth over time due to a higher customer lifetime value as the transition progresses. The cloud model also allows Oracle to monetize its services and technology more efficiently and yield savings to the customer. During the period, Oracle grew its cloud revenues, which now represent almost 40% of total corporate revenues, in excess of 25% and has seen total revenue growth inflect upward towards the high single digits, consistent with our long-term expectations. There are no changes to
Natixis Loomis Sayles Focused Growth ETF
our view of Oracle as a structurally attractive business trading substantially below our estimate of intrinsic value. Oracle has a strong financial model that now has higher financial leverage due to its increased allocation of capital to share repurchases and more recently its $28 billion acquisition of healthcare IT provider Cerner in 2022. However, the company consistently generates high operating cash flow margins in the low-to-mid 30% range, and cash flow returns on invested capital that are well above its cost of capital, and we believe cash flow will be focused on debt reduction over the near to immediate term. As the subscription-based, cloud-computing services model matures and increases in sales mix, we believe Oracle will realize stronger revenue, operating margins, and free cash flow growth. We believe Oracle’s stock price embeds free cash flow growth assumptions that are well below our long-term forecast. As a result, we believe its shares are selling at a significant discount to our estimate of intrinsic value and offer a compelling reward-to-risk opportunity.
Founded in 2003, Tesla is a global leader in the design, manufacturing, and sales of high-performance fully electric (battery) vehicles (EVs). We believe Tesla’s strong and sustainable competitive advantages include its brand, focus and business model, scale, and entrepreneurial culture. With a mission that includes accelerating the world’s transition to sustainable energy, no other brand is more closely associated with EVs, and the company has become the dominant global battery EV manufacturer with over 20% global market share. Tesla’s focus and business model have enabled it to substantially disrupt the automotive industry, maintain a first-mover advantage, and capture structural cost advantages. A Fund holding since inception, Tesla reported financial results during the period that were mixed with respect to consensus expectations, due in part to pricing cuts aimed at sustaining affordability of its vehicles in the face of elevated interest rates and economic uncertainty, as well as lingering materials and logistics cost inflation, both of which lowered profitability. However, we believe the company continues to execute well, as reflected by record quarterly revenue growth, record production and deliveries in its second quarter, and growing market share as a percentage of total light vehicle sales, despite an automotive industry slowdown. Given that affordability in the EV industry is being impacted by multi-decade-high interest rates and lingering materials and logistics cost inflation, we believe Tesla has been prudently managing the business. Despite working to lower the price of its vehicles to increase affordability, higher interest rates have impacted the core mass market customer Tesla ultimately seeks to win over. With respect to price reductions, Tesla has a pricing strategy where they price their vehicles to maximize overall profit dollars. Historically the company has reduced prices annually as they leveraged their growing scale to lower the total cost of ownership for potential buyers and drive EV adoption. The company is focused on penetrating mass-market buyers, where pricing sensitivity is a greater factor, and rising rates effectively increased the price of Tesla’s cars by 10% over the last two years. Tesla’s long-term strategy remains lowering the total cost of ownership for its vehicles. We believe this is the correct strategy because Tesla manufacturing factories have high fixed costs that benefit from scale, so increasing EV sales from current levels would improve production utilization and generate higher profit per vehicle. We believe that increased volumes will offset near-term margin pressure over time. Further, unlike other manufacturers, Tesla has the ability to sell software to car owners after the initial sale, providing incentive to grow an installed base that can later be monetized through software sales. Despite a substantial year-over-year decline in operating margins, due to lower average selling prices, new factories that are not yet operating at full efficiency, higher raw materials and logistics costs, and strong investments in research and development to support the Cybertruck and its AI robot, Tesla’s operating margin trails only Ferrari, and exceeds other scaled auto manufacturers. We believe these impacts are temporary and that over the long term, Tesla can achieve operating margins in the mid-20% range. We believe the secular growth driver for Tesla is increasing penetration of electric vehicles as a share of global automotive sales. Around the world, EVs accounted for a high-single digit percentage of new light vehicle sales in 2022, with penetration rates ranging from mid-single digits in North America to low double digits in Western Europe and almost 20% in China. We believe the pace of EV adoption will accelerate, driven by advances in battery technology that will drive cost parity, lower ongoing cost of ownership for consumers, government incentives, and numerous global initiatives to phase out internal combustion engine sales over the next two decades. Tesla is the global leader in battery EV sales, with approximately 20% unit share, 25% revenue share, and a much higher share of industry profitability. While we expect competition to increase substantially, we believe Tesla’s superior brand, focus, technology leadership, and strong ongoing consumer demand will enable the company to maintain its leading global market share in the low-20% range. As a result of a rapidly expanding global EV market, we expect Tesla’s unit sales to grow by approximately 30% on a compounded annual basis, which will translate to automotive revenue growth in the high-20% range as Tesla addresses the lower-priced segment of the market with a more affordable offering. As a function of lower battery cost and greater leverage of fixed manufacturing expenses, we expect Tesla to generate higher automotive gross margins as the company gains scale. We also believe the company will benefit from operating leverage, as well as growth in its higher-margin software business, led by FSD (full self-driving) software which we believe can increase from 0% of profits today to approximately 25% by the end of the forecast period. As a result, we believe the company can expand its operating margins, contributing to operating profits and free cash flow growing faster than revenues over our long-term investment horizon. We believe the assumptions embedded in Tesla’s share price underestimate the company’s significant long-term growth opportunities and the sustainability of its global market share. We believe the company’s shares currently sell at a significant discount to our estimate of intrinsic value and thereby offer a compelling reward-to-risk opportunity.
Natixis Loomis Sayles Focused Growth ETF
All aspects of our quality-growth-valuation investment thesis must be present simultaneously for us to make an investment. Often our research is completed well in advance of the opportunity to invest. We are patient investors and maintain coverage of high-quality businesses in order to take advantage of meaningful price dislocations if and when they occur. During the period there was no investment activity.
Outlook
Our investment process is characterized by bottom-up fundamental research and a long-term investment time horizon. The nature of the process leads to a lower-turnover portfolio in which sector positioning is the result of stock selection. The Fund ended the year with overweight positions in the communication services, consumer discretionary, financials, and healthcare sectors and was underweight in the information technology, industrials, and consumer staples sectors. We had no exposure to stocks in the materials, energy, utilities, or real estate sectors.
Top Ten Holdings as of December 31, 2023 |
| |
| |
| |
3 Meta Platforms, Inc., Class A | |
| |
5 Alphabet, Inc., Class A | |
| |
| |
8 Vertex Pharmaceuticals, Inc. | |
| |
| |
The portfolio is actively managed and holdings are subject to change. There is no guarantee the Fund continues to invest in the securities referenced. The holdings listed exclude any temporary cash investments, are presented on an individual security basis and do not represent holdings of the issuer. |
Natixis Loomis Sayles Focused Growth ETF
Hypothetical Growth of $10,000 Investment1 |
June 29, 2023 (inception) through December 31, 2023 |
Total Returns —December 31, 20231 |
| Life of Fund (Inception 6/29/23) | |
| | |
| | | |
| | | |
| | | |
Russell 1000® Growth Index2 | | | |
Performance data shown represents past performance and is no guarantee of, and not necessarily indicative of, future results. Total return and value will vary, and you may have a gain or loss when shares are sold. Current performance may be lower or higher than quoted. For most recent month-end performance, visit im.natixis.com/performance. You may not invest directly in an index. Performance for periods less than one year is cumulative, not annualized. Returns reflect changes in share price and reinvestment of dividends and capital gains, if any. The table(s) do not reflect taxes shareholders might owe on any fund distributions or when they redeem their shares.
| Fund performance has been increased by fee waivers and/or expense reimbursements, if any, without which performance would have been lower. |
| Russell 1000® Growth Index is an unmanaged index that measures the performance of the large-cap growth segment of the U.S. equity universe. It includes those Russell 1000® Index companies with higher price-to-book ratios and higher forecasted growth values. |
| Expense ratios are as shown in the Fund’s prospectus in effect as of the date of this report. The expense ratios for the current reporting period can be found in the Financial Highlights section of this report under Ratios to Average Net Assets. Net expenses reflect contractual expense limitations set to expire on 4/30/26. When a Fund’s expenses are below the limitation, gross and net expense ratios will be the same. See Note 6 of the Notes to Financial Statements for more information about the Fund’s expense limitations. |
| The NAV return is based on the NAV of the Fund, and the market return is based on the market price per share of the Fund, which is determined by using the midpoint between the highest bid and the lowest offer on the primary stock exchange on which shares of the Fund are listed for trading, as of the time that the Fund’s NAV is calculated. 6/29/23 represents the date trading of Fund shares commenced on the secondary market. 6/28/23 represents commencement of operations for accounting and financial reporting purposes only. NAV is used as a proxy for the opening market price on 6/29/23. Market and NAV returns assume that dividends and capital gain distributions have been reinvested in the Fund at market price and NAV, respectively. |
Natixis Loomis Sayles Short Duration Income ETF
|
|
|
|
Loomis, Sayles & Company, L.P.
|
Investment GoalThe Fund’s investment objective is current income consistent with preservation of capital.
Market Conditions
The bond market finished 2023 with positive total returns, but the favorable end result obscures the elevated volatility that occurred along the way. For most of the year, bonds were under pressure from concerns about persistent inflation and the US Federal Reserve’s (Fed) continued interest rate increases. As late as October, the headline US investment grade bond indexes were in negative territory on a year-to-date basis amid worries that the Fed would have to keep interest rates “higher for longer.”
This backdrop changed considerably in November and December, as the concerns that had weighed on the market throughout 2023 dissipated rapidly. Inflation continued to decline unabated, despite concerns about rising oil prices in the third quarter. In November, the headline Consumer Price Index came in at inflation rates not seen since early 2021. With inflation receding, the markets grew comfortable with the idea that the Fed was finished raising rates. In December, Fed Chairman Jerome Powell added to the upbeat tone with comments suggesting that rate cuts could begin as early as the first half of 2024. Bond prices took another leg higher in response, erasing all previous losses and helping the fixed income market close with solid gains for the full year. Income also made a meaningful contribution to total returns thanks to the increase in yields over the past two years.
US Treasuries registered gains for the year, albeit with unusually high volatility brought about by the shifting interest rate outlook. The yield on the two-year note, which came into 2023 at 4.41%, rose as high as 5.19% in mid-October before falling sharply to finish December at 4.23%. The ten-year issue took a similar path, moving from 3.88% at the end of 2022 to 4.99% in October and ultimately closing at the same 3.88% level where it began. The yield curve remained inverted for all of 2023, meaning that short-term debt offered higher yields than longer-term issues – an unusual condition that is often seen as a precursor to a recession. However, the extent of the inversion gradually receded from its July high during the remainder of the year.
Corporate bonds delivered a robust gain and outperformed US Treasuries. In addition to benefiting from the drop in Treasury yields in the fourth quarter, the asset class was boosted by the environment of positive economic growth, continued strength in corporate earnings, and investors’ hearty appetite for risk. Corporates’ above-average yield was an additional factor in their positive relative performance.
Securitized assets produced largely positive total returns in 2023. Collateralized loan obligations and commercial asset-backed securities delivered particularly strong gains. Portions of the residential mortgage-backed securities market also outperformed. Headwinds facing the commercial real estate sector emerged in the first half of 2023, negatively impacting non-agency commercial mortgage-backed securities’ performance for the full year. Generally, the higher-yielding securitized credit sectors performed best. A challenging supply-and-demand backdrop negatively impacted agency mortgage-backed securities (MBS) as elevated levels of interest-rate volatility continued and historically large buyers of agency MBS (banks and the US Federal Reserve) pulled back from the market. Still, agency MBS outperformed US Treasuries for the year.
Performance Results
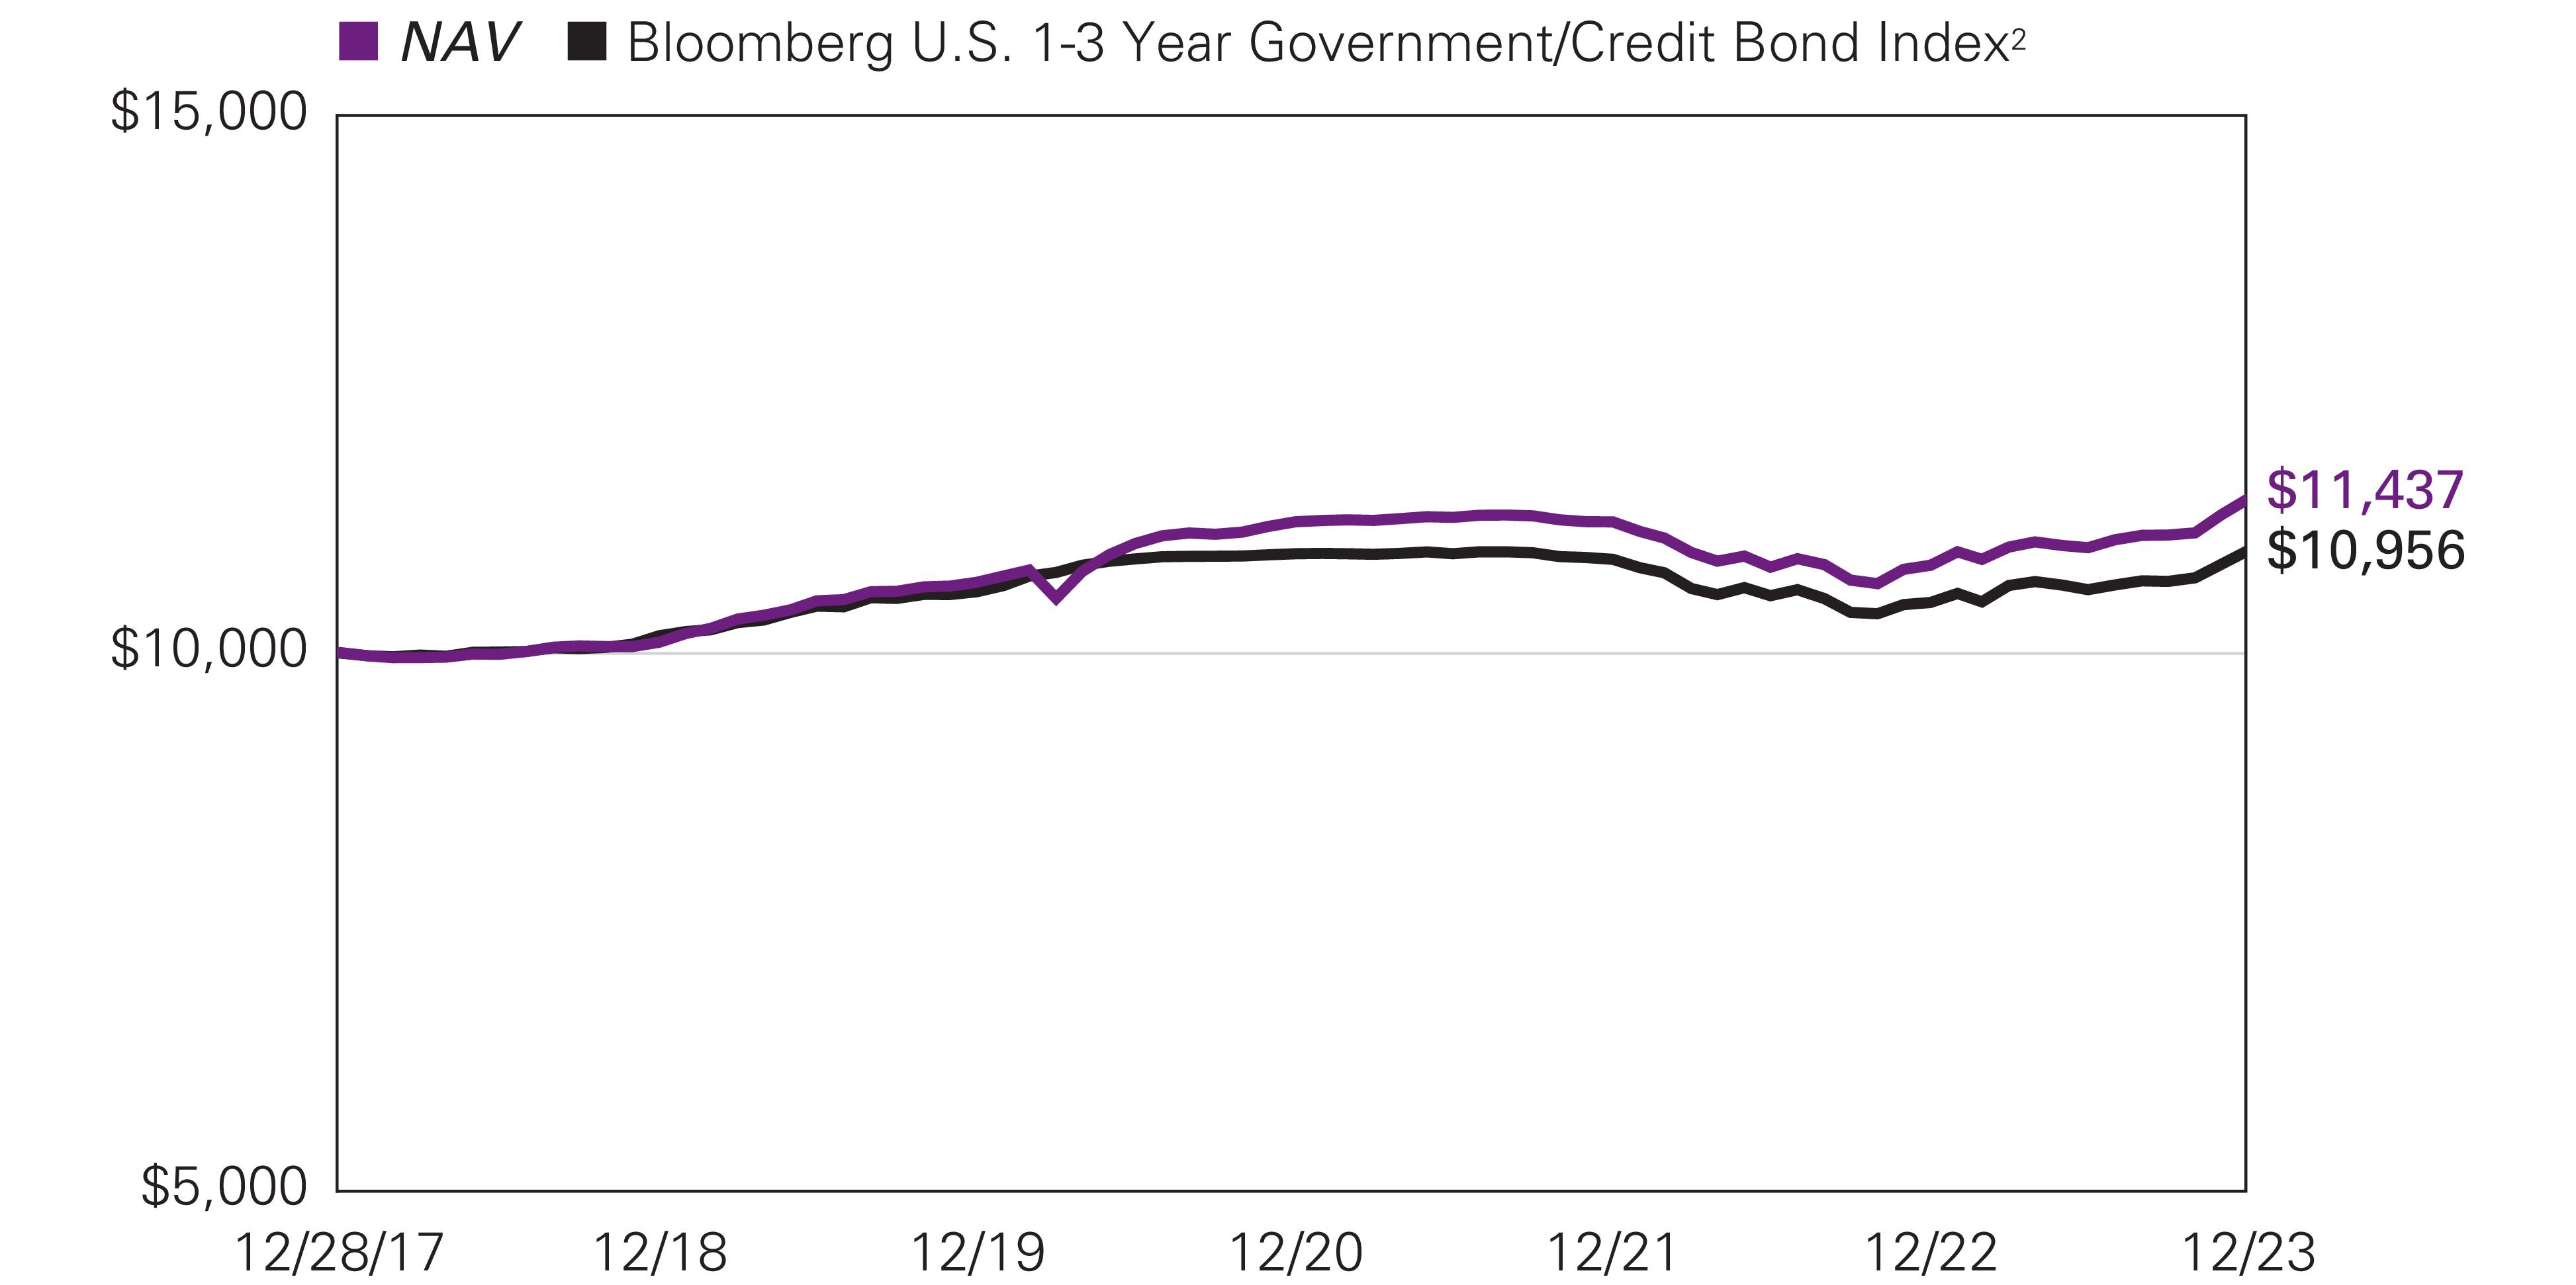
For the 12 months ended December 31, 2023, the Natixis Loomis Sayles Short Duration Income ETF returned 5.74%. The Fund outperformed its benchmark, the Bloomberg U.S. 1-3 Year Government/Credit Bond Index, which returned 4.61%.
Explanation of Fund Performance
Sector allocation and security selection effects provided a large contribution for the year. In sector allocation, positioning with respect to investment grade corporate bonds provided the largest benefit to relative performance. Securitized credit, particularly exposure to asset-backed securities, was also positive for the year. While the Fund’s positioning with respect to duration (and corresponding interest rate sensitivity) continues to be managed in line with the benchmark, tactical positioning along the yield curve (which depicts
Natixis Loomis Sayles Short Duration Income ETF
the relationship among bond yields across the maturity spectrum) resulted in a negative contribution to performance. The underweight allocation to US Treasuries hindered performance and exposure to US Agency securities was also negative for the period.
Outlook
The Fed elected to hold the fed funds rates steady at 5.25% throughout the fourth quarter. Forward guidance shifted from a hawkish to a dovish tone, as inflation surprised to the downside and softer economic data increased the odds of achieving the elusive "soft landing". In our view, the shift in tone caused market sentiment to dramatically reverse course; yields fell sharply while spreads tightened. Yields on the 10-year Treasury peaked at just over 5% in late-October before falling over 110 bps to 3.88% by year-end. Market expectations for any additional hikes disappeared, while expectations for easing monetary policy rose and were pulled forward into early 2024. Current pricing reflects 150 bps of anticipated cuts in the next 12 months, equivalent to three additional hikes on top of what is reflected in the Fed's Summary of Economic Projections. The yield curve steepened but remained inverted during the fourth quarter, with higher yields on shorter maturity Treasuries relative to longer-dated notes and bonds.
We continue to hold the view that we are in the late expansion phase of the credit cycle, with a significant probability of either a softer landing or more meaningful slowdown (i.e. downturn) sometime over the next 6-9 months. Corporate balance sheets have deteriorated, but from a very strong starting point; profit margins could continue to be pressured amid higher input costs, tighter credit conditions, and a slowdown in de-leveraging trends. We believe a relatively healthy middle class consumer and resilient labor market should prevent the economy from entering into a severe recession in this cycle.
We remain concerned about the lagged effects of significant monetary tightening, globally. This has come through traditional monetary policy tightening, including some central bank asset sales and/or balance sheet run-off, and covers many developed and emerging economies across the globe. Notable exceptions on the policy tightening side include the Bank of Japan, where policy remains very accommodative, and the Bank of China, where weakness in the Chinese property sector remains a concern. We also remain concerned about potential exogenous shocks to growth, possibly emanating from the ongoing conflict in the Middle East.
We continue to favor spread sectors, such as corporate bonds and securitized assets
Corporate bond risk relative to benchmark is currently below median, and sized to be approximately one-third of budget. The team continues to hold a small number of non-investment grade issuers we believe offer value.
We believe asset backed securities (ABS) continue to be a favorable alternative in the front end of the curve. We currently favor consumer related collateral and prefer the top of the capital stack, but are not limited to the highest quality band of the structure. The strategy’s ABS risk relative to benchmark remains around two-thirds of risk budget.
While the strategy continues to hold commercial mortgage-backed securities (CMBS), the exposure is typically on the low end of our risk range relative to benchmark. When opportunities arise within CMBS we tend to favor senior parts of the capital stack.
We continue to follow our process of seeking to build diversified exposures by asset class, industry and issuers.
Natixis Loomis Sayles Short Duration Income ETF
Hypothetical Growth of $10,000 Investment1 |
December 28, 2017 (inception) through December 31, 2023 |
Average Annual Total Returns —December 31, 20231 |
| | | Life of Fund (Inception 12/28/17) | |
| | |
| | | | | |
| | | | | |
| | | | | |
Bloomberg U.S. 1-3 Year Government/Credit Bond Index2 | | | | | |
Performance data shown represents past performance and is no guarantee of, and not necessarily indicative of, future results. Total return and value will vary, and you may have a gain or loss when shares are sold. Current performance may be lower or higher than quoted. For most recent month-end performance, visit im.natixis.com/performance. You may not invest directly in an index. Performance for periods less than one year is cumulative, not annualized. Returns reflect changes in share price and reinvestment of dividends and capital gains, if any. The table(s) do not reflect taxes shareholders might owe on any fund distributions or when they redeem their shares.
| Fund performance has been increased by fee waivers and/or expense reimbursements, if any, without which performance would have been lower. |
| Bloomberg U.S. 1-3 Year Government/Credit Bond Index is an unmanaged index which is a component of the U.S. Government/Credit Bond Index, which includes Treasury and agency securities (U.S. Government Bond Index) and publicly issued US corporate and foreign debentures and secured notes (U.S. Credit Bond Index). The bonds in the index are investment grade with a maturity between one and three years. |
| Expense ratios are as shown in the Fund’s prospectus in effect as of the date of this report. The expense ratios for the current reporting period can be found in the Financial Highlights section of this report under Ratios to Average Net Assets. Net expenses reflect contractual expense limitations set to expire on 4/30/26. When a Fund’s expenses are below the limitation, gross and net expense ratios will be the same. See Note 6 of the Notes to Financial Statements for more information about the Fund’s expense limitations. |
| The NAV return is based on the NAV of the Fund, and the market return is based on the market price per share of the Fund, which is determined by using the midpoint between the highest bid and the lowest offer on the primary stock exchange on which shares of the Fund are listed for trading, as of the time that the Fund’s NAV is calculated. 12/28/17 represents the date trading of Fund shares commenced on the secondary market. 12/27/17 represents commencement of operations for accounting and financial reporting purposes only. NAV is used as a proxy for the opening market price on 12/28/17. Market and NAV returns assume that dividends and capital gain distributions have been reinvested in the Fund at market price and NAV, respectively. |
Natixis Vaughan Nelson Mid Cap ETF
|
|
|
Chris D. Wallis, CFA®, CPA |
Vaughan Nelson Investment Management, L.P.
|
Investment GoalThe Fund seeks long-term capital appreciation.
Market Conditions
During the fiscal year ending December 31, 2023, the market began with sequential growth slowing in both the first and second quarters. Typically, banking stress develops once we are well into a recession as the ability for borrowers to service debt becomes impaired. Given the rapid increase in interest rates, regional banks fell under tremendous pressure.
As we moved through the summer months, global growth continued to deteriorate as the impact of aggressive rate increases affected economic fundamentals. In the U.S., the manufacturing and transportation sectors recessed and the service sector slowed further. Offsetting the deteriorating economic environment were continued liquidity injections by the major non-U.S. central banks and the U.S. Federal Reserve’s (Fed) reverse repo facility, which became the primary source of liquidity for rebuilding the U.S. Treasury’s general account. This flood of liquidity boosted equity markets and dampened fixed income volatility, compressing fixed income spreads (the difference in yield between bonds with similar maturity but different credit quality).
Inflation peaked in the fourth quarter of 2022 and economic growth bottomed, which set the stage for the move higher in U.S. equity markets during the first seven months of 2023. The reacceleration in growth coupled with declining inflation allowed the market to begin pricing in a “soft landing” for the U.S. economy despite aggressive monetary policy tightening, the emergence of a banking crisis, and rising U.S. Treasury yields as the U.S. Treasury struggled to fund rising deficit spending. The Fed added fuel to the rally by aggressively pumping liquidity into the banking system to offset the material losses on bank balance sheets.
During the fourth quarter, improving supply chains, rising employment participation rates, and the lagging influence of stabilized home prices and rental inflation continued to promote disinflationary conditions. Declining inflationary pressures, combined with stable economic growth, produced a material improvement in financial conditions as the market discounted future Fed rate cuts without any corresponding decrease in earnings expectations or economic weakness. The resulting decline in interest rates led to a powerful fourth quarter rally in equity and fixed income markets.
Performance Results
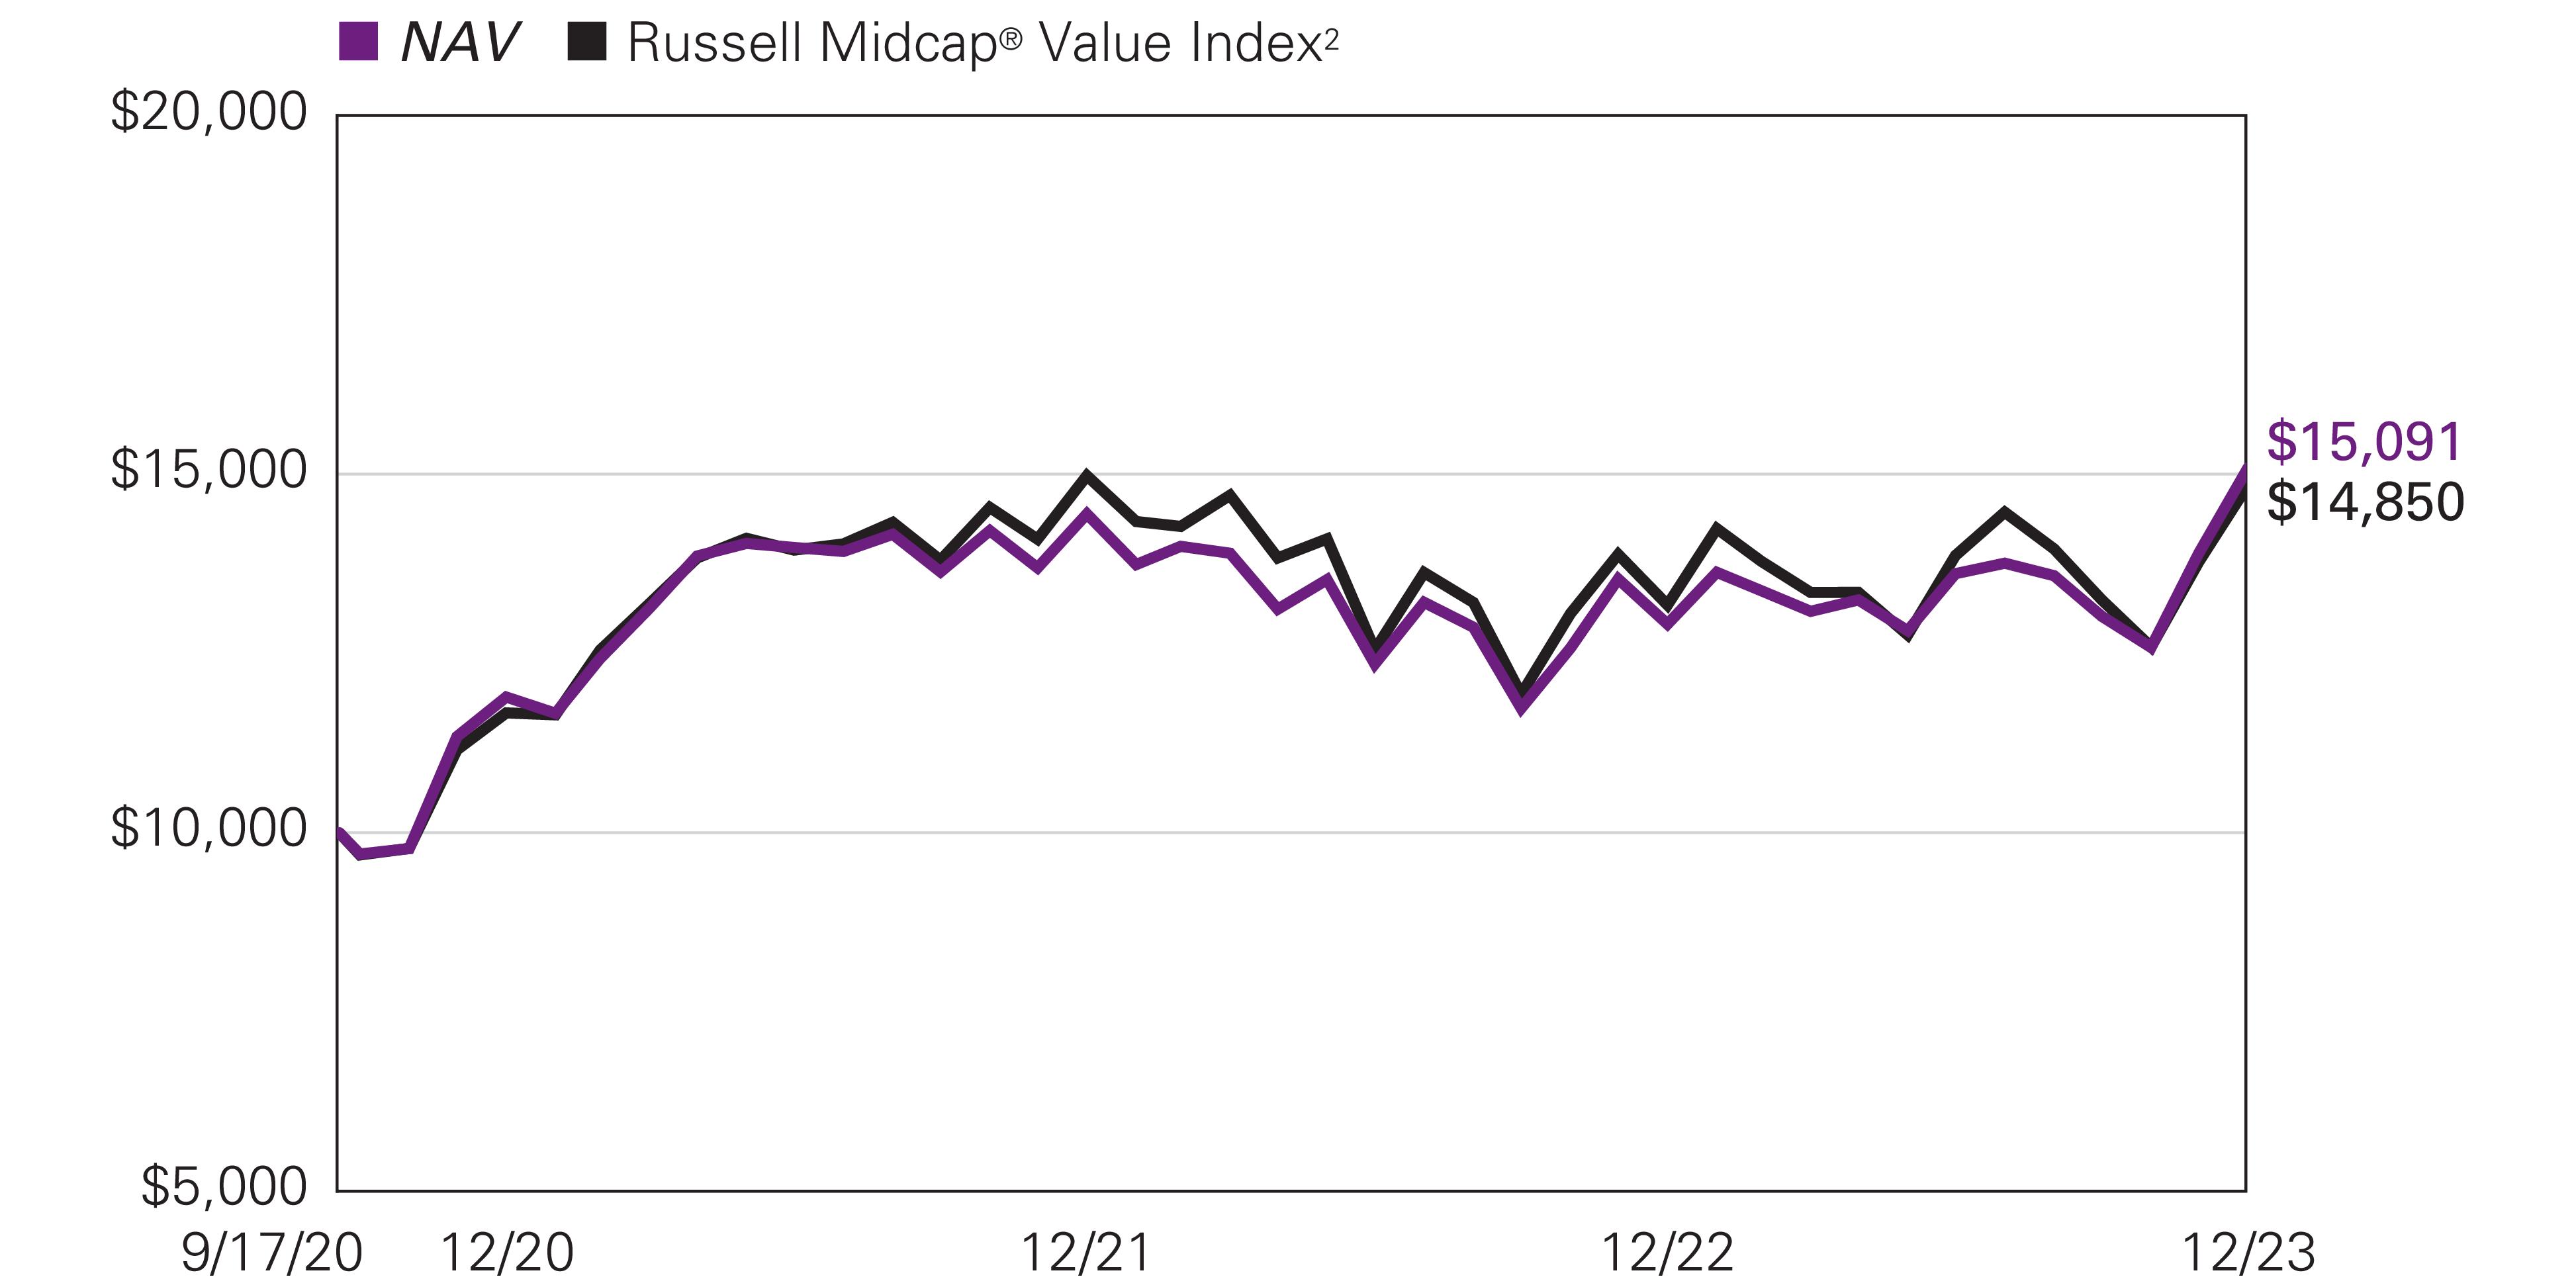
For the 12 months ended December 31, 2023, the Vaughan Nelson Mid Cap ETF returned 16.91% at net asset value. The Fund outperformed its benchmark, the Russell Mid Cap Value® Index, which returned 12.71%.
Explanation of Fund Performance
The Fund outperformed on a relative basis during the period.
Health care was the top performing sector with Cencora, Inc. leading the way. Cencora benefited from both multiple expansion and positive earnings revisions. The company’s consistent top-line and bottom-line growth combined with strong cash flow generation and return of capital were rewarded.
Materials outperformed driven by selection. Constellium SE Class A outperformed on a cycle of positive earnings revisions, as demand remained robust, and the company spoke to the end of destocking in packaging.
Overweight and selection within information technology aided performance. The strongest name was Motorola Solutions, Inc. Motorola’s public end markets continued to prove strong and consistent, as the company was able to beat and raise earnings expectations throughout the year.
Financials outperformed via selection with Comerica Incorporated leading the way. Comerica benefited with the rest of the regional banks as valuations had gotten too punitive for what may turn out to be a shallow recession.
Consumer staples’ outperformance was led by Church & Dwight Co., Inc. After a year of disappointing investors in 2022, Church & Dwight regained its credibility in 2023 by putting an end to the downward revision cycle, while recent acquisitions performed better
Natixis Vaughan Nelson Mid Cap ETF
than expectations. Additionally, with GLP1 headlines hurting packaged food and beverage stocks, Church & Dwight benefited on a relative basis as it is not impacted by GLP1s.
Further assisting in outperformance was Extra Space Storage Inc. within real estate. REITs outperformed in the fourth quarter as interest rates peaked, and Extra Space Storage outperformed REITs on solid fundamentals.
Selection within utilities assisted performance with Vistra Corp. as the top name. Vistra continued to show a strong recovery in earnings power as the company benefited from pricing during a very hot summer in Texas. The company outperformed regulated utilities which are dealing with ROE (return on equity) pressures.
An underweight to energy, an underperforming sector, added to relative performance.
Last, selection within consumer discretionary positively impacted performance. Floor & Decor Holdings, Inc. Class A outperformed as strong numbers and a desirable long-term algorithm led to the stock rising with other highly shorted names in the fourth quarter.
Selection within communication services hurt on a relative basis. Nexstar Media Group, Inc. detracted the most as softness in advertising markets coupled with worries about distribution held down the stock.
The Fund experienced negative attribution within industrials with WillScot Mobile Mini Holdings Corp. Class A being the largest drag. WillScot lagged due to slowing volumes coupled with an uncertain macro environment, especially in non-residential end markets.
Outlook
As we enter 2024, we expect modest economic weakness in the first half of the year followed by economic stability and an improvement in growth heading into the 2024 election cycle. Inflation will likely remain above the Fed’s 2% target, and with the recent dramatic easing in financial conditions, inflation may begin increasing in the fourth quarter of 2024. Should inflation expectations begin firming, we would expect some modest downward pressure on equity valuations.
Top Ten Holdings as of December 31, 2023 |
| |
1 Extra Space Storage, Inc. | |
2 EastGroup Properties, Inc. | |
3 Monolithic Power Systems, Inc. | |
| |
| |
6 Diamondback Energy, Inc. | |
| |
8 Marvell Technology, Inc. | |
9 Skechers USA, Inc., Class A | |
| |
The portfolio is actively managed and holdings are subject to change. There is no guarantee the Fund continues to invest in the securities referenced. The holdings listed exclude any temporary cash investments, are presented on an individual security basis and do not represent holdings of the issuer. |
Natixis Vaughan Nelson Mid Cap ETF
Hypothetical Growth of $10,000 Investment1 |
September 17, 2020 (inception) through December 31, 2023 |
Average Annual Total Returns —December 31, 20231 |
| | Life of Fund (Inception 9/17/20) | |
| | |
| | | | |
| | | | |
| | | | |
Russell Midcap® Value Index2 | | | | |
Performance data shown represents past performance and is no guarantee of, and not necessarily indicative of, future results. Total return and value will vary, and you may have a gain or loss when shares are sold. Current performance may be lower or higher than quoted. For most recent month-end performance, visit im.natixis.com/performance. You may not invest directly in an index. Performance for periods less than one year is cumulative, not annualized. Returns reflect changes in share price and reinvestment of dividends and capital gains, if any. The table(s) do not reflect taxes shareholders might owe on any fund distributions or when they redeem their shares.
| Fund performance has been increased by fee waivers and/or expense reimbursements, if any, without which performance would have been lower. |
| Russell Midcap® Value Index is an unmanaged index that measures the performance of the mid-cap value segment of the U.S. equity universe. It includes those Russell Midcap® Index companies with lower price-to-book ratios and lower forecasted growth values. |
| Expense ratios are as shown in the Fund’s prospectus in effect as of the date of this report. The expense ratios for the current reporting period can be found in the Financial Highlights section of this report under Ratios to Average Net Assets. Net expenses reflect contractual expense limitations set to expire on 4/30/26. When a Fund’s expenses are below the limitation, gross and net expense ratios will be the same. See Note 6 of the Notes to Financial Statements for more information about the Fund’s expense limitations. |
| The NAV return is based on the NAV of the Fund, and the market return is based on the market price per share of the Fund, which is determined by using the midpoint between the highest bid and the lowest offer on the primary stock exchange on which shares of the Fund are listed for trading, as of the time that the Fund’s NAV is calculated. 9/17/20 represents the date trading of Fund shares commenced on the secondary market. 9/16/20 represents commencement of operations for accounting and financial reporting purposes only. NAV is used as a proxy for the opening market price on 9/17/20. Market and NAV returns assume that dividends and capital gain distributions have been reinvested in the Fund at market price and NAV, respectively. |
Natixis Vaughan Nelson Select ETF
|
Chris D. Wallis, CFA®, CPA |
|
Vaughan Nelson Investment Management, L.P.
|
Investment GoalThe Fund seeks long-term capital appreciation.
Market Conditions
During the fiscal year ending December 31, 2023, the market began with sequential growth slowing in both the first and second quarters. Typically, banking stress develops once we are well into a recession as the ability for borrowers to service debt becomes impaired. Given the rapid increase in interest rates, regional banks fell under tremendous pressure.
As we moved through the summer months, global growth continued to deteriorate as the impact of aggressive rate increases affected economic fundamentals. In the U.S., the manufacturing and transportation sectors recessed and the service sector slowed further. Offsetting the deteriorating economic environment were continued liquidity injections by the major non-U.S. central banks and the U.S. Federal Reserve’s (Fed) reverse repo facility, which became the primary source of liquidity for rebuilding the U.S. Treasury’s general account. This flood of liquidity boosted equity markets and dampened fixed income volatility, compressing fixed income spreads (the difference in yield between bonds with similar maturity but different credit quality).
Inflation peaked in the fourth quarter of 2022 and economic growth bottomed, which set the stage for the move higher in U.S. equity markets during the first seven months of 2023. The reacceleration in growth coupled with declining inflation allowed the market to begin pricing in a “soft landing” for the U.S. economy despite aggressive monetary policy tightening, the emergence of a banking crisis, and rising U.S. Treasury yields as the U.S. Treasury struggled to fund rising deficit spending. The Fed added fuel to the rally by aggressively pumping liquidity into the banking system to offset the material losses on bank balance sheets.
During the fourth quarter, improving supply chains, rising employment participation rates, and the lagging influence of stabilized home prices and rental inflation continued to promote disinflationary conditions. Declining inflationary pressures, combined with stable economic growth, produced a material improvement in financial conditions as the market discounted future Fed rate cuts without any corresponding decrease in earnings expectations or economic weakness. The resulting decline in interest rates led to a powerful fourth quarter rally in equity and fixed income markets.
Performance Results
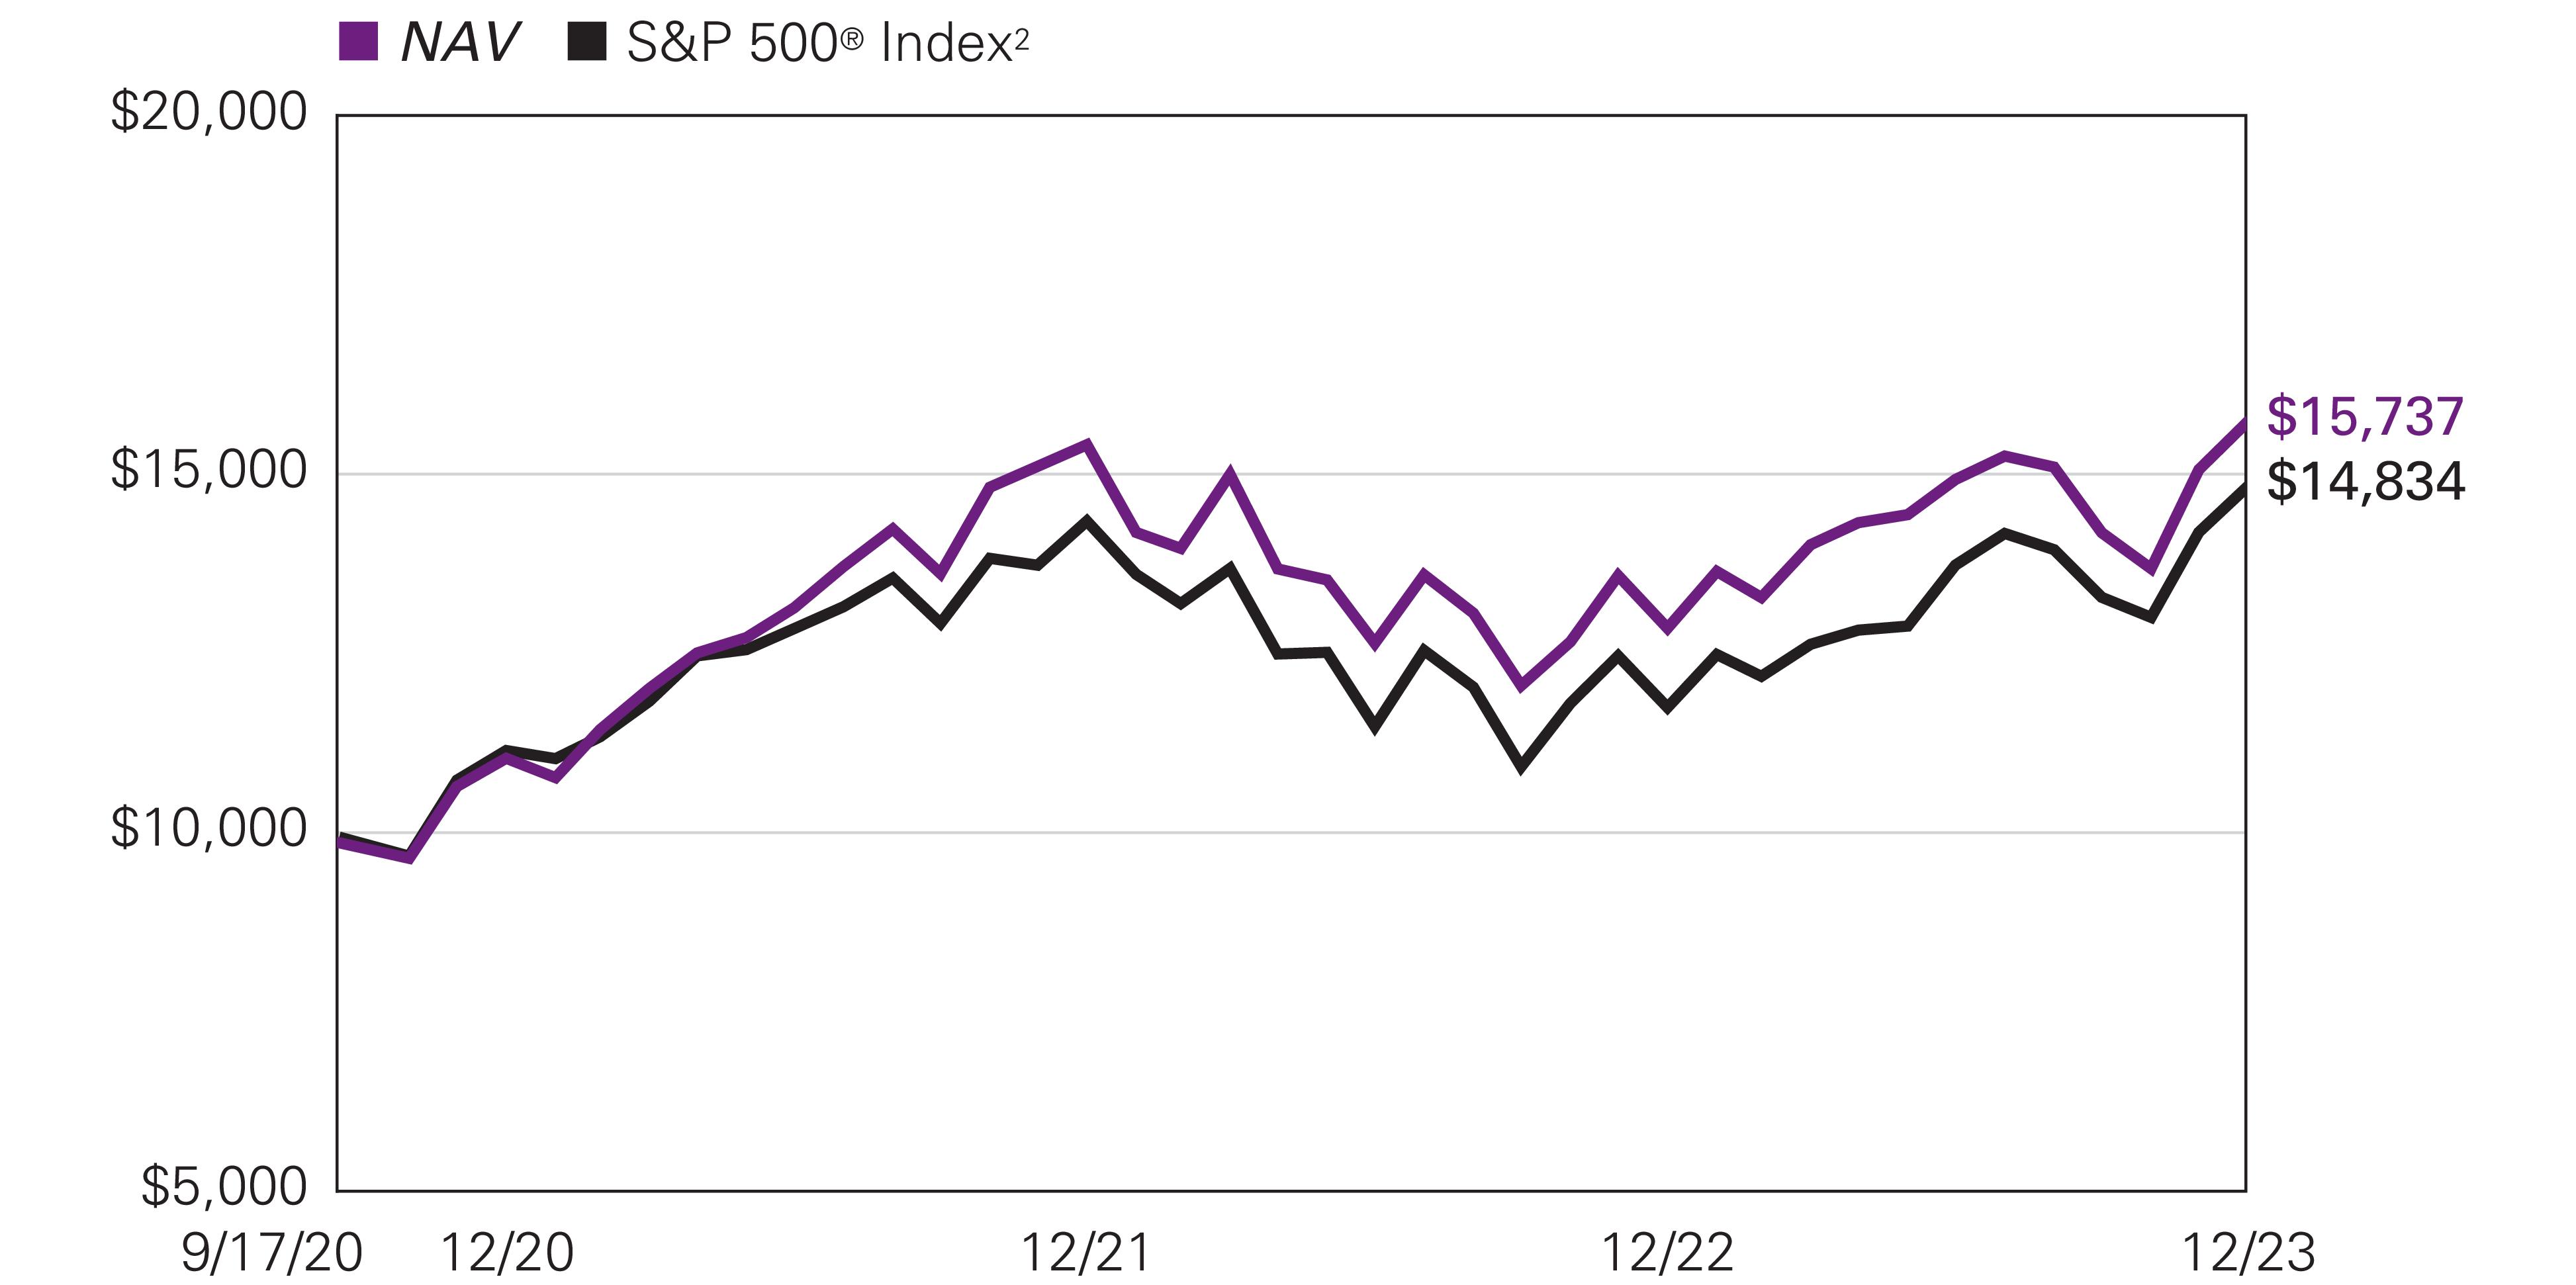
For the 12 months ended December 31, 2023, the Vaughan Nelson Select ETF returned 22.48% at net asset value. The Fund underperformed its benchmark, the S&P 500® Index, which returned 26.29%.
Explanation of Fund Performance
The Fund underperformed on a relative basis during the period.
The largest detractor was in consumer staples, driven by security selection, with Dollar General being the worst-performing name. Dollar General struggled with declining same-store sales due to lower-margin product mix shift, store safety and organization issues, and the lack of trade-down in consumer spend. While we expect management will be able to reverse these issues over time, the stock was sold to allocate capital into names with a better return opportunity.
An overweight to and selection within utilities impaired relative performance. NextEra Energy, Inc. was the most challenged name. NextEra Energy’s share price suffered from higher costs of capital threatening the growth rate for renewable energy projects. We expect the unregulated portion of the business will still be able to achieve outsized returns as capital costs stabilize.
An underweight to both communication services and information technology, which were top performing sectors, also detracted.
The Fund experienced positive attribution within industrials, with Saia, Inc. leading the way. Saia is gaining share as a best-in-class operator as it invests to add terminal capacity while over-levered competitors struggle to maintain operations.
An underweight to health care, an underperforming sector, and selection within it aided relative performance with DexCom, Inc. being the best name in the space. As the technology leader in continuous glucose monitoring (CGM), we expect that with increased insurance coverage and more data showing CGM use alongside semaglutide, Dexcom will achieve higher growth and profitability
Natixis Vaughan Nelson Select ETF
Sherwin-Wiliams Company assisted in materials outperformance. The company’s value proposition for its clients allows it the ability to maintain prices. As inflationary cost pressures abate, this strategic positioning has led to stronger margins.
An underweight to energy, an underperforming sector, contributed to performance.
Selection within real estate assisted, with the contribution led by Crown Castle Inc. (CCI). We believed that CCI’s small cell business was undervalued as higher data consumption would drive the need for densified coverage. Activist attention brought forward potential realization of that value in the form of a multiple re-rating.
Selection within consumer discretionary helped on a relative basis. Amazon.com was the best performer due to investment in higher-margin business products such as AWS, subscriptions, and advertising.
An underweight to and selection within financials aided relative performance. JPMorgan Chase & Co. was the top contributor. The company’s size and the balance sheet de-risking it instituted after the Global Financial Crisis has allowed it to gain share and protect against macroeconomic headwinds.
Outlook
As we enter 2024, we expect modest economic weakness in the first half of the year followed by economic stability and an improvement in growth heading into the 2024 election cycle. Inflationary pressures will likely remain above the Fed’s 2% target, and with the recent dramatic easing in financial conditions, inflation may begin increasing in the fourth quarter of 2024. Should inflation expectations begin firming, we would expect some modest downward pressure on equity valuations.
Top Ten Holdings as of December 31, 2023 |
| |
| |
| |
3 Intercontinental Exchange, Inc. | |
4 Alphabet, Inc., Class A | |
| |
| |
7 Monolithic Power Systems, Inc. | |
| |
9 O'Reilly Automotive, Inc. | |
| |
The portfolio is actively managed and holdings are subject to change. There is no guarantee the Fund continues to invest in the securities referenced. The holdings listed exclude any temporary cash investments, are presented on an individual security basis and do not represent holdings of the issuer. |
Natixis Vaughan Nelson Select ETF
Hypothetical Growth of $10,000 Investment1 |
September 17, 2020 (inception) through December 31, 2023 |
Average Annual Total Returns —December 31, 20231 |
| | Life of Fund (Inception 9/17/20) | |
| | |
| | | | |
| | | | |
| | | | |
| | | | |
Performance data shown represents past performance and is no guarantee of, and not necessarily indicative of, future results. Total return and value will vary, and you may have a gain or loss when shares are sold. Current performance may be lower or higher than quoted. For most recent month-end performance, visit im.natixis.com/performance. You may not invest directly in an index. Performance for periods less than one year is cumulative, not annualized. Returns reflect changes in share price and reinvestment of dividends and capital gains, if any. The table(s) do not reflect taxes shareholders might owe on any fund distributions or when they redeem their shares.
| Fund performance has been increased by fee waivers and/or expense reimbursements, if any, without which performance would have been lower. |
| S&P 500® Index is a widely recognized measure of U.S. stock market performance. It is an unmanaged index of 500 common stocks chosen for market size, liquidity, and industry group representation, among other factors. It also measures the performance of the large cap segment of the U.S. equities market. |
| Expense ratios are as shown in the Fund’s prospectus in effect as of the date of this report. The expense ratios for the current reporting period can be found in the Financial Highlights section of this report under Ratios to Average Net Assets. Net expenses reflect contractual expense limitations set to expire on 4/30/26. When a Fund’s expenses are below the limitation, gross and net expense ratios will be the same. See Note 6 of the Notes to Financial Statements for more information about the Fund’s expense limitations. |
| The NAV return is based on the NAV of the Fund, and the market return is based on the market price per share of the Fund, which is determined by using the midpoint between the highest bid and the lowest offer on the primary stock exchange on which shares of the Fund are listed for trading, as of the time that the Fund’s NAV is calculated. 9/17/20 represents the date trading of Fund shares commenced on the secondary market. 9/16/20 represents commencement of operations for accounting and financial reporting purposes only. NAV is used as a proxy for the opening market price on 9/17/20. Market and NAV returns assume that dividends and capital gain distributions have been reinvested in the Fund at market price and NAV, respectively. |
ADDITIONAL INFORMATION
The views expressed in this report reflect those of the portfolio managers as of the dates indicated. The managers’ views are subject to change at any time without notice based on changes in market or other conditions. References to specific securities or industries should not be regarded as investment advice. Because the Funds are actively managed, there is no assurance that they will continue to invest in the securities or industries mentioned.
All investing involves risk, including the risk of loss. There is no assurance that any investment will meet its performance objectives or that losses will be avoided.
ADDITIONAL INDEX INFORMATION
This document may contain references to third party copyrights, indexes, and trademarks, each of which is the property of its respective owner. Such owner is not affiliated with Natixis Investment Managers or any of its related or affiliated companies (collectively “Natixis Affiliates”) and does not sponsor, endorse or participate in the provision of any Natixis Affiliates services, funds or other financial products.
The index information contained herein is derived from third parties and is provided on an “as is” basis. The user of this information assumes the entire risk of use of this information. Each of the third party entities involved in compiling, computing or creating index information disclaims all warranties (including, without limitation, any warranties of originality, accuracy, completeness, timeliness, non-infringement, merchantability and fitness for a particular purpose) with respect to such information.
PROXY VOTING INFORMATION
A description of the Natixis Funds' proxy voting policies and procedures is available without charge, upon request, by calling Natixis Funds at 800-225-5478; on the Natixis Funds’ website at im.natixis.com, and on the Securities and Exchange Commission (“SEC”) website at www.sec.gov. Information about how the Natixis Funds voted proxies relating to portfolio securities during the most recent 12-month period ended June 30 is available through the Natixis Funds’ website and the SEC website.
QUARTERLY PORTFOLIO SCHEDULES
The Natixis Funds file a complete schedule of portfolio holdings with the SEC for the first and third quarters of each fiscal year as an exhibit to its reports on Form N-PORT. The Funds’ Form N-PORT reports are available on the SEC website at www.sec.gov. First and third quarter schedules of portfolio holdings are also available at im.natixis.com/funddocuments. A hard copy may be requested from the Fund at no charge by calling 800-225-5478.
TAILORED SHAREHOLDER REPORTS FOR MUTUAL FUNDS AND EXCHANGE-TRADED FUNDS
In October 2022, the SEC adopted rule and form amendments requiring mutual funds and exchange-traded funds to transmit concise and visually engaging streamlined annual and semiannual reports that highlight key information to shareholders. Other information, including financial statements, will no longer appear in the funds’ shareholder reports but will be available online, delivered free of charge upon request, and filed with the SEC on a semiannual basis on Form N-CSR. The rule and form amendments have a compliance date of July 24, 2024.
CFA® and Chartered Financial Analyst® are registered trademarks owned by the CFA Institute.
Understanding Fund Expenses
As a shareholder, you incur two types of costs: (1) transaction costs, which may include creation and redemption fees and brokerage charges, and (2) ongoing costs, including management fees and other fund expenses. These ongoing costs are described in more detail in the Fund’s prospectus. The following examples are intended to help you understand the ongoing costs of investing in the Fund and help you compare these with the ongoing costs of investing in other funds.
The first line in the table shows the actual account values and actual Fund expenses you would have paid on a $1,000 investment in the Fund from July 1, 2023, 2023 through December 31, 2023. To estimate the expenses you paid over the period, simply divide your account value by $1,000 (for example $8,600 account value divided by $1,000 = 8.60) and multiply the result by the number in the Expenses Paid During Period column as shown below for your class.
The second line in the table provides information about hypothetical account values and hypothetical expenses based on the Fund’s actual expense ratios and an assumed rate of return of 5% per year before expenses, which is not the Fund’s actual return. The
hypothetical account values and expenses may not be used to estimate the actual ending account balance or expenses you paid on your investment for the period. You may use this information to compare the ongoing costs of investing in the Fund and other funds. To do so, compare this 5% hypothetical example with the 5% hypothetical examples that appear in the shareholder reports of the other funds. Please note that the expenses shown reflect ongoing costs only, and do not include any transaction costs, such as brokerage commissions on purchases and sales of Fund shares. Therefore, the second line in the table is useful in comparing ongoing costs only, and will not help you determine the relative costs of owning different funds. If transaction costs were included, total costs would be higher.
Natixis Gateway Quality Income ETF | Beginning
Account Value
7/1/2023 | Ending
Account Value
12/31/2023 | Expenses Paid
During Period
|
| | | |
Hypothetical (5% return before expenses) | | | |
The chart above represents historical performance of a hypothetical investment of $1,000 in the fund for the most recent six-month period. Past performance does not guarantee future results. This chart does not reflect the deduction of taxes that a shareholder would pay on fund distributions or the redemption of fund shares. |
| Fund commenced operations on December 12, 2023. Actual expenses are equal to the Fund’s annualized expense ratio (after waiver/reimbursement) of 0.34%, multiplied by the average account value over the period, multiplied by the number of days in the most recent fiscal period (19), divided by 365 (to reflect the partial period). |
| Expenses are equal to the Fund's annualized expense ratio (after waiver/reimbursement) of 0.34%, multiplied by the average account value over the period, multiplied by the number of days in the most recent fiscal half–year (19), divided by 365 (to reflect the half–year period). |
Natixis Loomis Sayles Focused Growth ETF | Beginning
Account Value
7/1/2023 | Ending
Account Value
12/31/2023 | Expenses Paid
7/1/2023 – 12/31/2023 |
| | | |
Hypothetical (5% return before expenses) | | | |
The chart above represents historical performance of a hypothetical investment of $1,000 in the fund for the most recent six-month period. Past performance does not guarantee future results. This chart does not reflect the deduction of taxes that a shareholder would pay on fund distributions or the redemption of fund shares. |
| Expenses are equal to the Fund's annualized expense ratio (after waiver/reimbursement) of 0.59%, multiplied by the average account value over the period, multiplied by the number of days in the most recent fiscal half–year (184), divided by 365 (to reflect the half–year period). |
Natixis Loomis Sayles Short Duration Income ETF | Beginning
Account Value
7/1/2023 | Ending
Account Value
12/31/2023 | Expenses Paid
7/1/2023 – 12/31/2023 |
| | | |
Hypothetical (5% return before expenses) | | | |
The chart above represents historical performance of a hypothetical investment of $1,000 in the fund for the most recent six-month period. Past performance does not guarantee future results. This chart does not reflect the deduction of taxes that a shareholder would pay on fund distributions or the redemption of fund shares. |
| Expenses are equal to the Fund's annualized expense ratio (after waiver/reimbursement) of 0.35%, multiplied by the average account value over the period, multiplied by the number of days in the most recent fiscal half–year (184), divided by 365 (to reflect the half–year period). |
Natixis Vaughan Nelson Mid Cap ETF | Beginning
Account Value
7/1/2023 | Ending
Account Value
12/31/2023 | Expenses Paid
7/1/2023 – 12/31/2023 |
| | | |
Hypothetical (5% return before expenses) | | | |
The chart above represents historical performance of a hypothetical investment of $1,000 in the fund for the most recent six-month period. Past performance does not guarantee future results. This chart does not reflect the deduction of taxes that a shareholder would pay on fund distributions or the redemption of fund shares. |
| Expenses are equal to the Fund's annualized expense ratio (after waiver/reimbursement) of 0.85%, multiplied by the average account value over the period, multiplied by the number of days in the most recent fiscal half–year (184), divided by 365 (to reflect the half–year period). |
Natixis Vaughan Nelson Select ETF | Beginning
Account Value
7/1/2023 | Ending
Account Value
12/31/2023 | Expenses Paid
7/1/2023 – 12/31/2023 |
| | | |
Hypothetical (5% return before expenses) | | | |
The chart above represents historical performance of a hypothetical investment of $1,000 in the fund for the most recent six-month period. Past performance does not guarantee future results. This chart does not reflect the deduction of taxes that a shareholder would pay on fund distributions or the redemption of fund shares. |
| Expenses are equal to the Fund's annualized expense ratio (after waiver/reimbursement) of 0.80%, multiplied by the average account value over the period, multiplied by the number of days in the most recent fiscal half–year (184), divided by 365 (to reflect the half–year period). |
Portfolio of Investments – as of December 31, 2023Natixis Gateway Quality Income ETF
| | |
Common Stocks — 90.2% of Net Assets |
| Aerospace & Defense — 1.0% |
| | |
| Air Freight & Logistics — 0.7% |
| C.H. Robinson Worldwide, Inc. | |
| Expeditors International of Washington, Inc. | |
| United Parcel Service, Inc., Class B | |
| | |
| |
| | |
| |
| Monster Beverage Corp.(a) | |
| |
| | |
| Regeneron Pharmaceuticals, Inc.(a) | |
| Vertex Pharmaceuticals, Inc.(a) | |
| | |
| |
| | |
| |
| | |
| |
| MarketAxess Holdings, Inc. | |
| T. Rowe Price Group, Inc. | |
| | |
| |
| CF Industries Holdings, Inc. | |
| Commercial Services & Supplies — 1.8% |
| | |
| | |
| | |
| | |
| Communications Equipment — 0.9% |
| | |
| Consumer Staples Distribution & Retail — 6.0% |
| | |
| | |
| | |
| | |
| Walgreens Boots Alliance, Inc. | |
| | |
| | |
| Electric Utilities — 0.1% |
| | |
| Financial Services — 4.7% |
| Jack Henry & Associates, Inc. | |
| Mastercard, Inc., Class A | |
| | |
| | |
| |
| Archer-Daniels-Midland Co. | |
| | |
| | |
| | |
| Ground Transportation — 1.1% |
| J.B. Hunt Transport Services, Inc. | |
| Old Dominion Freight Line, Inc. | |
| | |
| Health Care Equipment & Supplies — 2.2% |
| Align Technology, Inc.(a) | |
| Edwards Lifesciences Corp.(a) | |
| IDEXX Laboratories, Inc.(a) | |
| | |
| Health Care Providers & Services — 4.7% |
| | |
| | |
| | |
| | |
| | |
| Molina Healthcare, Inc.(a) | |
| | |
| |
| | |
| Hotels, Restaurants & Leisure — 2.1% |
| | |
| Booking Holdings, Inc.(a) | |
| | |
| | |
| Household Durables — 0.5% |
| | |
| |
| | |
| | |
| | |
| Interactive Media & Services — 5.4% |
| Alphabet, Inc., Class A(a) | |
| Meta Platforms, Inc., Class A(a) | |
| | |
| |
| | |
| Life Sciences Tools & Services — 0.2% |
| West Pharmaceutical Services, Inc. | |
| |
| | |
| | |
| | |
| | |
| |
| Public Service Enterprise Group, Inc. | |
| Oil, Gas & Consumable Fuels — 5.6% |
| | |
| | |
| | |
| | |
| | |
| | |
| | |
| | |
| | |
See accompanying notes to financial statements.
Portfolio of Investments – as of December 31, 2023Natixis Gateway Quality Income ETF (continued) | | |
| Passenger Airlines — 1.0% |
| | |
| | |
| | |
| |
| | |
| Professional Services — 1.1% |
| | |
| | |
| | |
| | |
| Semiconductors & Semiconductor Equipment — 6.5% |
| | |
| | |
| | |
| | |
| | |
| |
| | |
| | |
| Cadence Design Systems, Inc.(a) | |
| | |
| | |
| Palo Alto Networks, Inc.(a) | |
| | |
| | |
| | |
| |
| | |
| | |
| | |
| | |
| | |
| Technology Hardware, Storage & Peripherals — 7.7% |
| | |
| Textiles, Apparel & Luxury Goods — 1.6% |
| Lululemon Athletica, Inc.(a) | |
| | |
| | |
| Trading Companies & Distributors — 1.7% |
| | |
| | |
| | |
| Total Common Stocks
(Identified Cost $36,349,205) | |
| | |
Equity-Linked Notes — 9.4% |
| BNP Paribas Issuance BV, (S&P 500 Index), 106.200%, 1/05/2024(b) | |
| | |
| Canadian Imperial Bank of Commerce, (S&P 500 Index), 67.500%, 1/19/2024(b) | |
| Morgan Stanley Finance LLC, (S&P 500 Index), 82.320%, 1/12/2024(b) | |
| UBS AG, (S&P 500 Index), 67.500%, 1/26/2024(b) | |
| Total Equity-Linked Notes
(Identified Cost $3,991,612) | |
|
|
Short-Term Investments — 0.1% |
| Tri-Party Repurchase Agreement with Fixed Income Clearing Corporation, dated 12/29/2023 at 2.500% to be repurchased at $49,147 on 1/02/2024 collateralized by $49,300 U.S. Treasury Note, 4.125% due 9/30/2027 valued at $50,193 including accrued interest (Note 2 of Notes to Financial Statements)
(Identified Cost $49,134) | |
| Total Investments — 99.7%
(Identified Cost $40,389,951) | |
| Other assets less liabilities — 0.3% | |
| | |
| See Note 2 of Notes to Financial Statements. |
| Non-income producing security. |
| All or a portion of these securities are exempt from registration under Rule 144A of the Securities Act of 1933. These securities may be resold in transactions exempt from registration, normally to qualified institutional buyers. At December 31, 2023, the value of Rule 144A holdings amounted to $3,873,537 or 9.4% of net assets. |
| Real Estate Investment Trusts |
Industry Summary at December 31, 2023
| |
Technology Hardware, Storage & Peripherals | |
Semiconductors & Semiconductor Equipment | |
Consumer Staples Distribution & Retail | |
Oil, Gas & Consumable Fuels | |
Interactive Media & Services | |
| |
Health Care Providers & Services | |
| |
| |
| |
Health Care Equipment & Supplies | |
Hotels, Restaurants & Leisure | |
Other Investments, less than 2% each | |
| |
| |
| |
Other assets less liabilities | |
| |
See accompanying notes to financial statements.
Portfolio of Investments – as of December 31, 2023Natixis Loomis Sayles Focused Growth ETF
| | |
Common Stocks — 98.8% of Net Assets |
| Aerospace & Defense — 4.8% |
| | |
| |
| | |
| |
| Monster Beverage Corp.(a) | |
| |
| Regeneron Pharmaceuticals, Inc.(a) | |
| Vertex Pharmaceuticals, Inc.(a) | |
| | |
| |
| | |
| |
| FactSet Research Systems, Inc. | |
| |
| | |
| | |
| | |
| Financial Services — 4.3% |
| | |
| Health Care Equipment & Supplies — 2.3% |
| Intuitive Surgical, Inc.(a) | |
| Hotels, Restaurants & Leisure — 2.1% |
| | |
| Interactive Media & Services — 16.7% |
| Alphabet, Inc., Class A(a) | |
| Meta Platforms, Inc., Class A(a) | |
| | |
| Life Sciences Tools & Services — 1.5% |
| | |
| Semiconductors & Semiconductor Equipment — 8.9% |
| | |
| |
| | |
| | |
| | |
| | |
| Workday, Inc., Class A(a) | |
| | |
| Total Common Stocks
(Identified Cost $5,177,031) | |
| | |
Short-Term Investments — 1.8% |
| Tri-Party Repurchase Agreement with Fixed Income Clearing Corporation, dated 12/29/2023 at 2.500% to be repurchased at $107,838 on 1/02/2024 collateralized by $123,000 U.S. Treasury Note, 0.500% due 4/30/2027 valued at $110,007 including accrued interest (Note 2 of Notes to Financial Statements)
(Identified Cost $107,808) | |
| Total Investments — 100.6%
(Identified Cost $5,284,839) | |
| Other assets less liabilities — (0.6)% | |
| | |
| See Note 2 of Notes to Financial Statements. |
| Non-income producing security. |
Industry Summary at December 31, 2023
| |
Interactive Media & Services | |
Semiconductors & Semiconductor Equipment | |
| |
| |
| |
| |
| |
| |
| |
| |
Health Care Equipment & Supplies | |
Hotels, Restaurants & Leisure | |
Life Sciences Tools & Services | |
| |
| |
Other assets less liabilities | |
| |
See accompanying notes to financial statements.
Portfolio of Investments – as of December 31, 2023Natixis Loomis Sayles Short Duration Income ETF
| | |
Bonds and Notes — 98.7% of Net Assets |
| |
| American Credit Acceptance Receivables Trust, Series 2020-4, Class C, 1.310%, 12/14/2026(a) | |
| American Credit Acceptance Receivables Trust, Series 2022-4, Class C, 7.860%, 2/15/2029(a) | |
| American Credit Acceptance Receivables Trust, Series 2023-3, Class C, 6.440%, 10/12/2029(a) | |
| American Credit Acceptance Receivables Trust, Series 2023-4, Class B, 6.630%, 2/14/2028(a) | |
| American Credit Acceptance Receivables Trust , Series 2021-3, Class C, 0.980%, 11/15/2027(a) | |
| AmeriCredit Automobile Receivables Trust, Series 2021-3, Class C, 1.410%, 8/18/2027 | |
| AmeriCredit Automobile Receivables Trust, Series 2023-1, Class B, 5.570%, 3/20/2028 | |
| AmeriCredit Automobile Receivables Trust , Series 2022-1, Class B, 2.770%, 4/19/2027 | |
| Avid Automobile Receivables Trust , Series 2023-1, Class A, 6.630%, 7/15/2026(a) | |
| Canada Pacer Auto Receivables Trust, Series 2021-1A, Class A3, 0.500%, 10/20/2025(a) | |
| Capital One Prime Auto Receivables Trust, Series 2023-2, Class A3, 5.820%, 6/15/2028 | |
| Capital One Prime Auto Receivables Trust , Series 2023-1, Class A3, 4.870%, 2/15/2028 | |
| Carvana Auto Receivables Trust, Series 2021-N4, Class C, 1.720%, 9/11/2028 | |
| Carvana Auto Receivables Trust, Series 2023-P1, Class A3, 5.980%, 12/10/2027(a) | |
| Drive Auto Receivables Trust, Series 2021-3, Class B, 1.110%, 5/15/2026 | |
| DT Auto Owner Trust, Series 2020-2A, Class C, 3.280%, 3/16/2026(a) | |
| DT Auto Owner Trust, Series 2021-4A, Class C, 1.500%, 9/15/2027(a) | |
| DT Auto Owner Trust, Series 2022-3A, Class B, 6.740%, 7/17/2028(a) | |
| DT Auto Owner Trust, Series 2023-2A, Class B, 5.410%, 2/15/2029(a) | |
| Enterprise Fleet Financing LLC, Series 2021-2, Class A2, 0.480%, 5/20/2027(a) | |
| Exeter Automobile Receivables Trust, Series 2021-4A, Class B, 1.050%, 5/15/2026 | |
| Exeter Automobile Receivables Trust, Series 2022-5A, Class B, 5.970%, 3/15/2027 | |
| Exeter Automobile Receivables Trust, Series 2023-5A, Class A3, 6.320%, 3/15/2027 | |
| First Investors Auto Owner Trust , Series 2022-1A, Class C, 3.130%, 5/15/2028(a) | |
| Flagship Credit Auto Trust, Series 2023-2, Class C, 5.810%, 5/15/2029(a) | |
| Flagship Credit Auto Trust , Series 2020-4, Class C, 1.280%, 2/16/2027(a) | |
| Ford Credit Auto Lease Trust , Series 2023-A, Class A3, 4.940%, 3/15/2026 | |
| Ford Credit Auto Owner Trust, Series 2021-A, Class A3, 0.300%, 8/15/2025 | |
| Ford Credit Auto Owner Trust, Series 2023-B, Class A3, 5.230%, 5/15/2028 | |
| Foursight Capital Automobile Receivables Trust, Series 2021-2, Class A3, 0.810%, 5/15/2026(a) | |
| | |
| |
| GLS Auto Select Receivables Trust, Series 2023-2A, Class A2, 6.370%, 6/15/2028(a) | |
| GM Financial Consumer Automobile Receivables Trust, Series 2023-4, Class A3, 5.780%, 8/16/2028 | |
| Harley-Davidson Motorcycle Trust, Series 2023-B, Class A3, 5.690%, 8/15/2028 | |
| Harley-Davidson Motorcycle Trust, Series 2023-B, Class A4, 5.780%, 4/15/2031 | |
| Honda Auto Receivables Owner Trust, Series 2021-1, Class A3, 0.270%, 4/21/2025 | |
| Honda Auto Receivables Owner Trust, Series 2023-4, Class A3, 5.670%, 6/21/2028 | |
| Hyundai Auto Receivables Trust, Series 2023-C, Class A3, 5.540%, 10/16/2028 | |
| LAD Auto Receivables Trust, Series 2023-4A, Class B, 6.390%, 10/16/2028(a) | |
| Navistar Financial Dealer Note Master Owner Trust II, Series 2023-1, Class A, 6.180%, 8/25/2028(a) | |
| OneMain Direct Auto Receivables Trust, Series 2023-1A, Class A, 5.410%, 11/14/2029(a) | |
| Prestige Auto Receivables Trust, Series 2023-1A, Class C, 5.650%, 2/15/2028(a) | |
| Santander Drive Auto Receivables Trust, Series 2023-3, Class C, 5.770%, 11/15/2030 | |
| Santander Drive Auto Receivables Trust, Series 2023-4, Class B, 5.770%, 12/15/2028 | |
| Santander Drive Auto Receivables Trust, Series 2023-5, Class B, 6.160%, 12/17/2029 | |
| SFS Auto Receivables Securitization Trust, Series 2023-1A, Class A3, 5.470%, 10/20/2028(a) | |
| Toyota Auto Receivables Owner Trust, Series 2021-C, Class A3, 0.430%, 1/15/2026 | |
| Toyota Lease Owner Trust, Series 2023-A, Class A3, 4.930%, 4/20/2026(a) | |
| VStrong Auto Receivables Trust, Series 2023-A, Class A3, 6.870%, 11/15/2027(a) | |
| Westlake Automobile Receivables Trust, Series 2021-2A, Class B, 0.620%, 7/15/2026(a) | |
| Westlake Automobile Receivables Trust, Series 2021-3A, Class C, 1.580%, 1/15/2027(a) | |
| Westlake Automobile Receivables Trust, Series 2023-3A, Class C, 6.020%, 9/15/2028(a) | |
| World Omni Auto Receivables Trust, Series 2023-D, Class A3, 5.790%, 2/15/2029 | |
| | |
| |
| Capital One Multi-Asset Execution Trust, Series 2021-A1, Class A1, 0.550%, 7/15/2026 | |
| Mercury Financial Credit Card Master Trust, Series 2022-1A, Class A, 2.500%, 9/21/2026(a) | |
| Synchrony Card Funding LLC, Series 2023-A2, Class A, 5.740%, 10/15/2029 | |
| World Financial Network Credit Card Master Trust, Series 2023-A, Class A, 5.020%, 3/15/2030 | |
| | |
| |
| Chesapeake Funding II LLC, Series 2023-1A, Class A1, 5.650%, 5/15/2035(a) | |
| Daimler Trucks Retail Trust, Series 2022-1, Class A2, 5.070%, 9/16/2024 | |
See accompanying notes to financial statements.
Portfolio of Investments – as of December 31, 2023Natixis Loomis Sayles Short Duration Income ETF (continued) | | |
| |
| Daimler Trucks Retail Trust, Series 2023-1, Class A4, 5.930%, 12/16/2030 | |
| Dell Equipment Finance Trust, Series 2023-3, Class A3, 5.930%, 4/23/2029(a) | |
| HPEFS Equipment Trust , Series 2023-1A, Class A3, 5.410%, 2/22/2028(a) | |
| Marlette Funding Trust, Series 2023-2A, Class A, 6.040%, 6/15/2033(a) | |
| SCF Equipment Leasing LLC, Series 2022-1A, Class A3, 2.920%, 7/20/2029(a) | |
| Verizon Master Trust, Series 2022-5, Class A1A, 3.720%, 7/20/2027 | |
| Wheels Fleet Lease Funding 1 LLC, Series 2023-1A, Class A, 5.800%, 4/18/2038(a) | |
| | |
| |
| Navient Private Education Refi Loan Trust, Series 2021-EA, Class A, 0.970%, 12/16/2069(a) | |
| Aerospace & Defense — 0.7% |
| Boeing Co., 4.875%, 5/01/2025 | |
| Huntington Ingalls Industries, Inc., 3.844%, 5/01/2025 | |
| RTX Corp., 5.750%, 11/08/2026 | |
| | |
| Agency Commercial Mortgage-Backed Securities — 0.1% |
| Federal Home Loan Mortgage Corp. Multifamily Structured Pass-Through Certificates, Series KF81, Class AL, 30 day USD SOFR Average + 0.474%, 5.805%, 6/25/2027(b) | |
| Federal Home Loan Mortgage Corp. Multifamily Structured Pass-Through Certificates, Series KF81, Class AS, 30 day USD SOFR Average + 0.400%, 5.731%, 6/25/2027(b) | |
| | |
| |
| Southwest Airlines Co., 5.250%, 5/04/2025 | |
| United Airlines, Inc., 4.375%, 4/15/2026(a) | |
| | |
| |
| Camden Property Trust, 5.850%, 11/03/2026 | |
| |
| General Motors Financial Co., Inc., 5.800%, 1/07/2029 | |
| General Motors Financial Co., Inc., 6.050%, 10/10/2025 | |
| Harley-Davidson Financial Services, Inc., 3.350%, 6/08/2025(a) | |
| Harley-Davidson Financial Services, Inc., 6.500%, 3/10/2028(a) | |
| Hyundai Capital America, 5.950%, 9/21/2026(a) | |
| Nissan Motor Acceptance Co. LLC, 7.050%, 9/15/2028(a) | |
| Toyota Motor Credit Corp., MTN, 5.000%, 8/14/2026 | |
| Toyota Motor Credit Corp., 5.550%, 11/20/2030 | |
| | |
| |
| Ally Financial, Inc., (fixed rate to 1/03/2029, variable rate thereafter), 6.848%, 1/03/2030 | |
| Ally Financial, Inc., 7.100%, 11/15/2027 | |
| | |
| |
| American Express Co., (fixed rate to 10/30/2030, variable rate thereafter), 6.489%, 10/30/2031 | |
| Bank of America Corp., MTN, (fixed rate to 4/02/2025, variable rate thereafter), 3.384%, 4/02/2026 | |
| Bank of Montreal, 5.266%, 12/11/2026 | |
| Bank of New York Mellon Corp., MTN, (fixed rate to 10/25/2028, variable rate thereafter), 6.317%, 10/25/2029 | |
| Capital One Financial Corp., (fixed rate to 6/08/2028, variable rate thereafter), 6.312%, 6/08/2029 | |
| Capital One Financial Corp., (fixed rate to 10/29/2026, variable rate thereafter), 7.149%, 10/29/2027 | |
| Citigroup, Inc., (fixed rate to 5/25/2033, variable rate thereafter), 6.174%, 5/25/2034 | |
| Fifth Third Bancorp, (fixed rate to 7/27/2028, variable rate thereafter), 6.339%, 7/27/2029 | |
| Goldman Sachs Group, Inc., (fixed rate to 8/10/2025, variable rate thereafter), 5.798%, 8/10/2026 | |
| Huntington Bancshares, Inc., (fixed rate to 8/21/2028, variable rate thereafter), 6.208%, 8/21/2029 | |
| JPMorgan Chase & Co., (fixed rate to 10/23/2028, variable rate thereafter), 6.087%, 10/23/2029 | |
| Macquarie Group Ltd., (fixed rate to 12/07/2033, variable rate thereafter), 6.255%, 12/07/2034(a) | |
| Royal Bank of Canada, GMTN, 5.200%, 7/20/2026 | |
| Royal Bank of Canada, GMTN, SOFR Index + 0.300%, 5.674%, 1/19/2024(b) | |
| State Street Corp., (fixed rate to 11/21/2028, variable rate thereafter), 5.684%, 11/21/2029 | |
| Synchrony Financial, 4.875%, 6/13/2025 | |
| Toronto-Dominion Bank, 5.264%, 12/11/2026 | |
| Truist Financial Corp., MTN, (fixed rate to 10/30/2028, variable rate thereafter), 7.161%, 10/30/2029 | |
| Wells Fargo & Co., MTN, (fixed rate to 4/25/2025, variable rate thereafter), 3.908%, 4/25/2026 | |
| | |
| |
| Cantor Fitzgerald LP, 7.200%, 12/12/2028(a) | |
| Jefferies Financial Group, Inc., 5.875%, 7/21/2028 | |
| | |
| |
| Charter Communications Operating LLC/Charter Communications Operating Capital, 6.150%, 11/10/2026 | |
| |
| Celanese U.S. Holdings LLC, 6.165%, 7/15/2027 | |
| EIDP, Inc., 4.500%, 5/15/2026 | |
| Nutrien Ltd., 5.900%, 11/07/2024 | |
| | |
| Collateralized Mortgage Obligations — 0.6% |
| Government National Mortgage Association, Series 2011-H23, Class HA, 3.000%, 12/20/2061(c) | |
| Government National Mortgage Association, Series 2012-H28, Class FA, 1 mo. USD SOFR + 0.694%, 4.977%, 9/20/2062(b)(c) | |
| Government National Mortgage Association, Series 2013-H04, Class BA, 1.650%, 2/20/2063(c) | |
| Government National Mortgage Association, Series 2013-H11, Class JA, 3.500%, 4/20/2063(c) | |
See accompanying notes to financial statements.
Portfolio of Investments – as of December 31, 2023Natixis Loomis Sayles Short Duration Income ETF (continued) | | |
| Collateralized Mortgage Obligations — continued |
| Government National Mortgage Association, Series 2016-H13, Class FT, 1 mo. USD SOFR + 0.694%, 6.017%, 5/20/2066(b)(c) | |
| Government National Mortgage Association, Series 2018-H02, Class FJ, 1 mo. USD SOFR + 0.314%, 5.637%, 10/20/2064(b)(c) | |
| Government National Mortgage Association, Series 2019-H01, Class FJ, 1 mo. USD SOFR + 0.414%, 5.737%, 9/20/2068(b)(c) | |
| Government National Mortgage Association, Series 2019-H01, Class FT, 1 mo. USD SOFR + 0.514%, 5.837%, 10/20/2068(b) | |
| Government National Mortgage Association, Series 2019-H05, Class FT, 1 yr. CMT + 0.430%, 5.840%, 4/20/2069(b) | |
| Government National Mortgage Association, Series 2019-H13, Class FT, 1 yr. CMT + 0.450%, 5.860%, 8/20/2069(b) | |
| Government National Mortgage Association, Series 2020-H01, Class FT, 1 yr. CMT + 0.500%, 5.910%, 1/20/2070(b) | |
| | |
| Construction Machinery — 0.5% |
| Caterpillar Financial Services Corp., 5.150%, 8/11/2025 | |
| CNH Industrial Capital LLC, 5.450%, 10/14/2025 | |
| | |
| Consumer Cyclical Services — 0.3% |
| Expedia Group, Inc., 6.250%, 5/01/2025(a) | |
| |
| AES Corp., 3.300%, 7/15/2025(a) | |
| Ameren Corp., 5.000%, 1/15/2029 | |
| Ameren Corp., 5.700%, 12/01/2026 | |
| American Electric Power Co., Inc., 5.200%, 1/15/2029 | |
| American Electric Power Co., Inc., 5.699%, 8/15/2025 | |
| CenterPoint Energy, Inc., 5.250%, 8/10/2026 | |
| Dominion Energy, Inc., 3.071%, 8/15/2024 | |
| DTE Energy Co., 4.220%, 11/01/2024 | |
| Edison International, 4.700%, 8/15/2025 | |
| ITC Holdings Corp., 4.950%, 9/22/2027(a) | |
| National Rural Utilities Cooperative Finance Corp., MTN, 5.600%, 11/13/2026 | |
| NextEra Energy Capital Holdings, Inc., 5.749%, 9/01/2025 | |
| NextEra Energy Capital Holdings, Inc., 6.051%, 3/01/2025 | |
| Pennsylvania Electric Co., 5.150%, 3/30/2026(a) | |
| Southern Co., Series 21-A, 0.600%, 2/26/2024 | |
| Vistra Operations Co. LLC, 5.125%, 5/13/2025(a) | |
| WEC Energy Group, Inc., 0.800%, 3/15/2024 | |
| WEC Energy Group, Inc., 5.600%, 9/12/2026 | |
| | |
| |
| GFL Environmental, Inc., 6.750%, 1/15/2031(a) | |
| |
| Air Lease Corp., MTN, 0.700%, 2/15/2024 | |
| Air Lease Corp., 0.800%, 8/18/2024 | |
| Aircastle Ltd., 2.850%, 1/26/2028(a) | |
| Aircastle Ltd., 6.500%, 7/18/2028(a) | |
| Ares Capital Corp., 3.250%, 7/15/2025 | |
| | |
| Finance Companies — continued |
| Ares Capital Corp., 7.000%, 1/15/2027 | |
| Avolon Holdings Funding Ltd., 5.500%, 1/15/2026(a) | |
| Bain Capital Specialty Finance, Inc., 2.550%, 10/13/2026 | |
| Barings BDC, Inc., 3.300%, 11/23/2026 | |
| Blackstone Private Credit Fund, 2.625%, 12/15/2026 | |
| Blackstone Private Credit Fund, 7.300%, 11/27/2028(a) | |
| Blackstone Secured Lending Fund, 2.850%, 9/30/2028 | |
| Blue Owl Capital Corp., 3.750%, 7/22/2025 | |
| Blue Owl Capital Corp. II, 8.450%, 11/15/2026(a) | |
| Blue Owl Credit Income Corp., 7.950%, 6/13/2028(a) | |
| FS KKR Capital Corp., 3.250%, 7/15/2027 | |
| Golub Capital BDC, Inc., 2.500%, 8/24/2026 | |
| Hercules Capital, Inc., 3.375%, 1/20/2027 | |
| Main Street Capital Corp., 3.000%, 7/14/2026 | |
| Morgan Stanley Direct Lending Fund, 4.500%, 2/11/2027 | |
| Navient Corp., 11.500%, 3/15/2031 | |
| | |
| |
| Cargill, Inc., 4.500%, 6/24/2026(a) | |
| Conagra Brands, Inc., 5.300%, 10/01/2026 | |
| Keurig Dr Pepper, Inc., 0.750%, 3/15/2024 | |
| PepsiCo, Inc., 5.125%, 11/10/2026 | |
| | |
| |
| GLP Capital LP/GLP Financing II, Inc., 5.250%, 6/01/2025 | |
| Government Owned - No Guarantee — 0.9% |
| NBN Co. Ltd., 0.875%, 10/08/2024(a) | |
| |
| UnitedHealth Group, Inc., 5.150%, 10/15/2025 | |
| |
| IQVIA, Inc., 6.250%, 2/01/2029(a) | |
| Thermo Fisher Scientific, Inc., 5.000%, 1/31/2029 | |
| | |
| |
| Forestar Group, Inc., 3.850%, 5/15/2026(a) | |
| Independent Energy — 1.0% |
| Civitas Resources, Inc., 8.625%, 11/01/2030(a) | |
| Crescent Energy Finance LLC, 9.250%, 2/15/2028(a) | |
| EQT Corp., 6.125%, 2/01/2025 | |
| Pioneer Natural Resources Co., 5.100%, 3/29/2026 | |
| Sitio Royalties Operating Partnership LP/Sitio Finance Corp., 7.875%, 11/01/2028(a) | |
| | |
| |
| Athene Holding Ltd., 5.875%, 1/15/2034 | |
| Brighthouse Financial Global Funding, 1.750%, 1/13/2025(a) | |
| Corebridge Global Funding, 5.750%, 7/02/2026(a) | |
| New York Life Global Funding, 5.450%, 9/18/2026(a) | |
| Northwestern Mutual Global Funding, 0.600%, 3/25/2024(a) | |
| Principal Life Global Funding II, 0.500%, 1/08/2024(a) | |
| | |
| |
| Hyatt Hotels Corp., 5.750%, 1/30/2027 | |
See accompanying notes to financial statements.
Portfolio of Investments – as of December 31, 2023Natixis Loomis Sayles Short Duration Income ETF (continued) | | |
| Media Entertainment — 0.4% |
| Take-Two Interactive Software, Inc., 3.300%, 3/28/2024 | |
| Warnermedia Holdings, Inc., 3.755%, 3/15/2027 | |
| | |
| |
| Mineral Resources Ltd., 9.250%, 10/01/2028(a) | |
| Nucor Corp., 3.950%, 5/23/2025 | |
| | |
| |
| Kinetik Holdings LP, 6.625%, 12/15/2028(a) | |
| Targa Resources Corp., 6.150%, 3/01/2029 | |
| TransCanada PipeLines Ltd., Series FRN, SOFR Index + 1.520%, 6.938%, 3/09/2026(b) | |
| Williams Cos., Inc., 5.400%, 3/02/2026 | |
| | |
| |
| Sempra, 5.400%, 8/01/2026 | |
| Non-Agency Commercial Mortgage-Backed Securities — 1.5% |
| BANK, Series 2023-5YR3, Class A3, 6.724%, 9/15/2056(b) | |
| BANK, Series 2023-5YR4, Class A3, 6.500%, 12/15/2056 | |
| Benchmark Mortgage Trust, Series 2023-V2, Class A3, 5.812%, 5/15/2055(b) | |
| Credit Suisse Mortgage Trust, Series 2014-USA, Class A2, 3.953%, 9/15/2037(a) | |
| MSBAM Commercial Mortgage Securities Trust, Series 2012-CKSV, Class A2, 3.277%, 10/15/2030(a) | |
| | |
| |
| Highwoods Realty LP, 7.650%, 2/01/2034 | |
| Hudson Pacific Properties LP, 5.950%, 2/15/2028 | |
| Piedmont Operating Partnership LP, 9.250%, 7/20/2028 | |
| | |
| |
| Starwood Property Trust, Inc., 3.750%, 12/31/2024(a) | |
| |
| Amcor Flexibles North America, Inc., 4.000%, 5/17/2025 | |
| Sonoco Products Co., 1.800%, 2/01/2025 | |
| | |
| |
| Federal Realty OP LP, 3.950%, 1/15/2024 | |
| |
| Advance Auto Parts, Inc., 5.900%, 3/09/2026 | |
| AutoZone, Inc., 5.050%, 7/15/2026 | |
| Lowe's Cos., Inc., 4.400%, 9/08/2025 | |
| O'Reilly Automotive, Inc., 5.750%, 11/20/2026 | |
| Tapestry, Inc., 7.350%, 11/27/2028 | |
| | |
| |
| Broadcom, Inc., 4.000%, 4/15/2029(a) | |
| Dell International LLC/EMC Corp., 5.850%, 7/15/2025 | |
| Fidelity National Information Services, Inc., 4.500%, 7/15/2025 | |
| Flex Ltd., 6.000%, 1/15/2028 | |
| | |
| |
| Global Payments, Inc., 1.500%, 11/15/2024 | |
| NXP BV/NXP Funding LLC/NXP USA, Inc., 3.150%, 5/01/2027 | |
| Qorvo, Inc., 1.750%, 12/15/2024 | |
| | |
| |
| Altria Group, Inc., 6.200%, 11/01/2028 | |
| Transportation Services — 0.7% |
| Element Fleet Management Corp., 6.319%, 12/04/2028(a) | |
| Penske Truck Leasing Co. LP/PTL Finance Corp., 5.550%, 5/01/2028(a) | |
| Ryder System, Inc., 6.300%, 12/01/2028 | |
| | |
| |
| U.S. Treasury Notes, 2.500%, 5/31/2024(d) | |
| U.S. Treasury Notes, 3.875%, 4/30/2025 | |
| U.S. Treasury Notes, 4.625%, 6/30/2025 | |
| U.S. Treasury Notes, 4.750%, 7/31/2025 | |
| U.S. Treasury Notes, 5.000%, 8/31/2025 | |
| U.S. Treasury Notes, 5.000%, 9/30/2025 | |
| U.S. Treasury Notes, 5.000%, 10/31/2025 | |
| | |
| |
| Crown Castle, Inc., 5.800%, 3/01/2034 | |
| |
| Bell Telephone Co. of Canada or Bell Canada, Series US-3, 0.750%, 3/17/2024 | |
| Verizon Communications, Inc., 3.000%, 3/22/2027 | |
| | |
| Total Bonds and Notes
(Identified Cost $20,095,477) | |
|
|
Short-Term Investments — 0.9% |
| Tri-Party Repurchase Agreement with Fixed Income Clearing Corporation, dated 12/29/2023 at 2.500% to be repurchased at $185,301 on 1/02/2024 collateralized by $211,300 U.S. Treasury Note, 0.500% due 4/30/2027 valued at $188,979 including accrued interest (Note 2 of Notes to Financial Statements)
(Identified Cost $185,250) | |
| Total Investments — 99.6%
(Identified Cost $20,280,727) | |
| Other assets less liabilities — 0.4% | |
| | |
| See Note 2 of Notes to Financial Statements. |
See accompanying notes to financial statements.
Portfolio of Investments – as of December 31, 2023Natixis Loomis Sayles Short Duration Income ETF (continued) | All or a portion of these securities are exempt from registration under Rule 144A of the Securities Act of 1933. These securities may be resold in transactions exempt from registration, normally to qualified institutional buyers. At December 31, 2023, the value of Rule 144A holdings amounted to $4,608,000 or 22.6% of net assets. |
| Variable rate security. Rate as of December 31, 2023 is disclosed. Issuers comprised of various lots with differing coupon rates have been aggregated for the purpose of presentation in the Portfolio of Investments and show a weighted average rate. Certain variable rate securities are not based on a published reference rate and spread, rather are determined by the issuer or agent and are based on current market conditions. These securities may not indicate a reference rate and/or spread in their description. |
| Level 3 security. Value has been determined using significant unobservable inputs. See Note 3 of Notes to Financial Statements. |
| Security (or a portion thereof) has been pledged as collateral for open derivative contracts. |
| |
| Constant Maturity Treasury |
| |
| |
| Real Estate Investment Trusts |
| Secured Overnight Financing Rate |
At December 31, 2023, open long futures contracts were as follows:
| | | | | Unrealized
Appreciation
(Depreciation) |
CBOT 2 Year U.S. Treasury Notes Futures | | | | | |
At December 31, 2023, open short futures contracts were as follows:
| | | | | Unrealized
Appreciation
(Depreciation) |
CBOT 10 Year U.S. Treasury Notes Futures | | | | | |
Industry Summary at December 31, 2023
| |
| |
| |
| |
| |
| |
| |
| |
Other Investments, less than 2% each | |
| |
| |
Other assets less liabilities (including futures contracts) | |
| |
See accompanying notes to financial statements.
Portfolio of Investments – as of December 31, 2023Natixis Vaughan Nelson Mid Cap ETF
| | |
Common Stocks — 100.4% of Net Assets |
| Aerospace & Defense — 1.4% |
| | |
| |
| Bank of NT Butterfield & Son Ltd. | |
| | |
| | |
| | |
| | |
| |
| | |
| | |
| | |
| |
| Ares Management Corp., Class A | |
| | |
| | |
| Raymond James Financial, Inc. | |
| | |
| |
| Axalta Coating Systems Ltd.(a) | |
| Commercial Services & Supplies — 0.5% |
| | |
| Communications Equipment — 0.9% |
| | |
| Construction & Engineering — 2.4% |
| WillScot Mobile Mini Holdings Corp.(a) | |
| Construction Materials — 2.5% |
| | |
| Consumer Staples Distribution & Retail — 1.1% |
| Performance Food Group Co.(a) | |
| Containers & Packaging — 2.2% |
| | |
| | |
| | |
| Electrical Equipment — 5.2% |
| | |
| | |
| | |
| | |
| | |
| Electronic Equipment, Instruments & Components — 2.4% |
| | |
| | |
| | |
| Energy Equipment & Services — 2.0% |
| | |
| Financial Services — 0.9% |
| Apollo Global Management, Inc. | |
| Ground Transportation — 1.1% |
| | |
| Health Care Providers & Services — 1.5% |
| | |
| Laboratory Corp. of America Holdings | |
| | |
| | |
| Independent Power & Renewable Electricity Producers — 2.0% |
| | |
| |
| EastGroup Properties, Inc. | |
| |
| | |
| | |
| First American Financial Corp. | |
| Reinsurance Group of America, Inc. | |
| | |
| |
| | |
| Life Sciences Tools & Services — 6.6% |
| Agilent Technologies, Inc. | |
| | |
| | |
| | |
| | |
| |
| | |
| | |
| | |
| |
| Nexstar Media Group, Inc. | |
| |
| | |
| Mortgage Real Estate Investment Trusts (REITs) — 1.7% |
| | |
| Oil, Gas & Consumable Fuels — 4.0% |
| | |
| | |
| | |
| Professional Services — 5.4% |
| CACI International, Inc., Class A(a) | |
| | |
| | |
| | |
| Semiconductors & Semiconductor Equipment — 8.1% |
| | |
| Monolithic Power Systems, Inc. | |
| ON Semiconductor Corp.(a) | |
| | |
| |
| Tyler Technologies, Inc.(a) | |
| |
| Extra Space Storage, Inc. | |
| |
| | |
| Floor & Decor Holdings, Inc., Class A(a) | |
| | |
| | |
| Textiles, Apparel & Luxury Goods — 2.5% |
| Skechers USA, Inc., Class A(a) | |
See accompanying notes to financial statements.
Portfolio of Investments – as of December 31, 2023Natixis Vaughan Nelson Mid Cap ETF (continued) | | |
| Trading Companies & Distributors — 2.2% |
| SiteOne Landscape Supply, Inc.(a) | |
| Total Common Stocks
(Identified Cost $3,092,206) | |
| | |
Short-Term Investments — 0.5% |
| Tri-Party Repurchase Agreement with Fixed Income Clearing Corporation, dated 12/29/2023 at 2.500% to be repurchased at $17,237 on 1/02/2024 collateralized by $19,700 U.S. Treasury Note, 0.500% due 4/30/2027 valued at $17,619 including accrued interest (Note 2 of Notes to Financial Statements)
(Identified Cost $17,232) | |
| Total Investments — 100.9%
(Identified Cost $3,109,438) | |
| Other assets less liabilities — (0.9)% | |
| | |
| See Note 2 of Notes to Financial Statements. |
| Non-income producing security. |
| Real Estate Investment Trusts |
Industry Summary at December 31, 2023
Semiconductors & Semiconductor Equipment | |
| |
Life Sciences Tools & Services | |
| |
| |
| |
| |
| |
| |
Oil, Gas & Consumable Fuels | |
| |
| |
Textiles, Apparel & Luxury Goods | |
| |
| |
Electronic Equipment, Instruments & Components | |
| |
Construction & Engineering | |
| |
Trading Companies & Distributors | |
| |
Energy Equipment & Services | |
Independent Power & Renewable Electricity Producers | |
Other Investments, less than 2% each | |
| |
| |
Other assets less liabilities | |
| |
See accompanying notes to financial statements.
Portfolio of Investments – as of December 31, 2023Natixis Vaughan Nelson Select ETF
| | |
Common Stocks — 98.3% of Net Assets |
| |
| | |
| |
| | |
| |
| Intercontinental Exchange, Inc. | |
| |
| | |
| Electric Utilities — 2.1% |
| | |
| |
| | |
| Financial Services — 3.5% |
| Berkshire Hathaway, Inc., Class B(a) | |
| Ground Transportation — 7.5% |
| | |
| | |
| | |
| Health Care Equipment & Supplies — 2.8% |
| | |
| Health Care Providers & Services — 1.9% |
| | |
| |
| | |
| |
| | |
| Interactive Media & Services — 4.8% |
| Alphabet, Inc., Class A(a) | |
| |
| | |
| | |
| | |
| Life Sciences Tools & Services — 2.8% |
| | |
| |
| Wheaton Precious Metals Corp. | |
| Oil, Gas & Consumable Fuels — 5.1% |
| | |
| | |
| | |
| Personal Care Products — 1.9% |
| Estee Lauder Cos., Inc., Class A | |
| |
| | |
| | |
| | |
| Professional Services — 2.8% |
| | |
| Semiconductors & Semiconductor Equipment — 7.9% |
| Monolithic Power Systems, Inc. | |
| | |
| | |
| | |
| |
| | |
| | |
| | |
| |
| O'Reilly Automotive, Inc.(a) | |
| Total Common Stocks
(Identified Cost $27,412,067) | |
| | |
Short-Term Investments — 2.0% |
| Tri-Party Repurchase Agreement with Fixed Income Clearing Corporation, dated 12/29/2023 at 2.500% to be repurchased at $633,162 on 1/02/2024 collateralized by $634,200 U.S. Treasury Note, 4.125% due 9/30/2027 valued at $645,687 including accrued interest (Note 2 of Notes to Financial Statements)
(Identified Cost $632,986) | |
| Total Investments — 100.3%
(Identified Cost $28,045,053) | |
| Other assets less liabilities — (0.3)% | |
| | |
| See Note 2 of Notes to Financial Statements. |
| Non-income producing security. |
| Real Estate Investment Trusts |
Industry Summary at December 31, 2023
| |
Semiconductors & Semiconductor Equipment | |
| |
| |
| |
| |
Oil, Gas & Consumable Fuels | |
| |
Interactive Media & Services | |
| |
| |
| |
| |
| |
Life Sciences Tools & Services | |
Health Care Equipment & Supplies | |
| |
| |
| |
| |
Other Investments, less than 2% each | |
| |
| |
Other assets less liabilities | |
| |
See accompanying notes to financial statements.
Statements of Assets and Liabilities
| Natixis
Gateway
Quality
Income
ETF | Natixis
Loomis
Sayles
Focused
Growth
ETF | Natixis
Loomis
Sayles Short
Duration Income
ETF | Natixis
Vaughan
Nelson
Mid Cap
ETF | Natixis
Vaughan
Nelson
Select
ETF |
| | | | | |
| | | | | |
Net unrealized appreciation (depreciation) | | | | | |
| | | | | |
| | | | | |
Receivable from investment adviser (Note 6) | | | | | |
Receivable for securities sold | | | | | |
Dividends and interest receivable | | | | | |
Receivable for variation margin on futures contracts (Note 2) | | | | | |
Prepaid expenses (Note 8) | | | | | |
| | | | | |
| | | | | |
Management fees payable (Note 6) | | | | | |
Deferred Trustees’ fees (Note 6) | | | | | |
Administrative fees payable (Note 6) | | | | | |
Audit and tax services fees payable | | | | | |
Other accounts payable and accrued expenses | | | | | |
| | | | | |
COMMITMENTS AND CONTINGENCIES(a) | | | | | |
| | | | | |
| | | | | |
| | | | | |
Accumulated earnings (loss) | | | | | |
| | | | | |
COMPUTATION OF NET ASSET VALUE AND OFFERING PRICE: | | | | | |
| | | | | |
Shares of beneficial interest | | | | | |
Net asset value, offering and redemption price per share | | | | | |
| As disclosed in the Notes to Financial Statements, if applicable. |
See accompanying notes to financial statements.
For the Year Ended December 31, 2023
| Natixis
Gateway
Quality
Income
ETF(a) | Natixis
Loomis
Sayles
Focused
Growth
ETF(b) | Natixis
Loomis
Sayles Short
Duration Income
ETF | Natixis
Vaughan
Nelson
Mid Cap
ETF | Natixis
Vaughan
Nelson
Select
ETF |
| | | | | |
| | | | | |
| | | | | |
Less net foreign taxes withheld | | | | | |
| | | | | |
| | | | | |
| | | | | |
Administrative fees (Note 6) | | | | | |
Trustees' fees and expenses (Note 6) | | | | | |
Transfer agent fees and expenses (Notes 6 and 7) | | | | | |
Audit and tax services fees | | | | | |
Custodian fees and expenses (Note 7) | | | | | |
| | | | | |
| | | | | |
Regulatory filing fees (Note 7) | | | | | |
Shareholder reporting expenses (Note 7) | | | | | |
| | | | | |
| | | | | |
Less waiver and/or expense reimbursement (Note 6) | | | | | |
| | | | | |
Net investment income (loss) | | | | | |
Net realized and unrealized gain (loss) on Investments and Futures contracts | | | | | |
Net realized gain (loss) on: | | | | | |
| | | | | |
| | | | | |
Net change in unrealized appreciation (depreciation) on: | | | | | |
| | | | | |
| | | | | |
Net realized and unrealized gain on Investments and Futures contracts | | | | | |
NET INCREASE IN NET ASSETS RESULTING FROM OPERATIONS | | | | | |
| From commencement of operations on December 12, 2023 through December 31, 2023. |
| From commencement of operations on June 28, 2023 through December 31, 2023. |
| Includes a non-recurring dividend of $19,440. |
See accompanying notes to financial statements.
Statements of Changes in Net Assets
| Natixis Gateway
Quality Income ETF | Natixis Loomis Sayles
Focused Growth ETF |
| Period Ended
December 31,2023(a) | Period Ended
December 31,2023(b) |
| | |
Net investment income (loss) | | |
Net realized gain (loss) on investments | | |
Net change in unrealized appreciation on investments | | |
Net increase in net assets resulting from operations | | |
FROM DISTRIBUTIONS TO SHAREHOLDERS: | | |
| | |
NET INCREASE IN NET ASSETS FROM CAPITAL
SHARES TRANSACTIONS (Note 10) | | |
Net increase in net assets | | |
| | |
| | |
| | |
| From commencement of operations on December 12, 2023 through December 31, 2023. |
| From commencement of operations on June 28, 2023 through December 31, 2023. |
See accompanying notes to financial statements.
Statements of Changes in Net Assets (continued)
| Natixis Loomis Sayles Short
Duration Income ETF | Natixis Vaughan Nelson Mid
Cap ETF |
| Year Ended
December 31,2023 | Year Ended
December 31,2022 | Year Ended
December 31,2023 | Year Ended
December 31,2022 |
| | | | |
| | | | |
Net realized gain (loss) on investments and futures contracts | | | | |
Net change in unrealized appreciation (depreciation) on investments and futures contracts | | | | |
Net increase (decrease) in net assets resulting from operations | | | | |
FROM DISTRIBUTIONS TO SHAREHOLDERS: | | | | |
| | | | |
NET DECREASE IN NET ASSETS FROM CAPITAL
SHARES TRANSACTIONS (Note 10) | | | | |
Net decrease in net assets | | | | |
| | | | |
| | | | |
| | | | |
See accompanying notes to financial statements.
Statements of Changes in Net Assets (continued)
| Natixis Vaughan Nelson
Select ETF |
| Year Ended
December 31,2023 | Year Ended
December 31,2022 |
| | |
| | |
Net realized gain (loss) on investments | | |
Net change in unrealized appreciation (depreciation) on investments | | |
Net increase (decrease) in net assets resulting from operations | | |
FROM DISTRIBUTIONS TO SHAREHOLDERS: | | |
| | |
NET INCREASE IN NET ASSETS FROM CAPITAL
SHARES TRANSACTIONS (Note 10) | | |
Net increase in net assets | | |
| | |
| | |
| | |
See accompanying notes to financial statements.
For a share outstanding throughout each period.
| Natixis Gateway Quality Income ETF |
| |
Net asset value, beginning of the year | |
INCOME (LOSS) FROM INVESTMENT OPERATIONS: | |
Net investment income(a)(b) | |
Net realized and unrealized gain | |
Total from Investment Operations | |
| |
| |
Net asset value, end of the year | |
| |
RATIOS TO AVERAGE NET ASSETS: | |
Net assets, end of the period (000's) | |
| |
| |
Net investment income(b)(f) | |
Portfolio turnover rate(g) | |
| From commencement of operations on December 12, 2023 through December 31, 2023. |
| Per share net investment income has been calculated using the average shares outstanding during the period. |
| Includes a non-recurring dividend. Without this dividend, net investment income per share would have been $0.13, total return would have been 1.91% and the ratio of net investment income to average net assets would have been 4.92%. |
| Total return is calculated at net asset value assuming reinvestment of dividends and capital gains, if any. Had certain expenses not been waived/reimbursed during the period, total returns would have been lower. |
| Periods less than one year are not annualized. |
| The investment adviser agreed to waive its fees and/or reimburse a portion of the Fund’s expenses during the period. Without this waiver/reimbursement, expenses would have been higher. |
| Computed on an annualized basis for periods less than one year. |
| Portfolio turnover rate excludes securities received or delivered from in–kind processing of creations or redemptions. |
See accompanying notes to financial statements.
Financial Highlights (continued)
For a share outstanding throughout each period.
| Natixis Loomis Sayles Focused Growth ETF |
| |
Net asset value, beginning of the year | |
INCOME (LOSS) FROM INVESTMENT OPERATIONS: | |
| |
Net realized and unrealized gain | |
Total from Investment Operations | |
| |
Net realized capital gains | |
Net asset value, end of the year | |
| |
RATIOS TO AVERAGE NET ASSETS: | |
Net assets, end of the period (000's) | |
| |
| |
| |
Portfolio turnover rate(f) | |
| From commencement of operations on June 28, 2023 through December 31, 2023. |
| Per share net investment loss has been calculated using the average shares outstanding during the period. |
| Total return is calculated at net asset value assuming reinvestment of dividends and capital gains, if any. Had certain expenses not been waived/reimbursed during the period, total returns would have been lower. |
| Periods less than one year are not annualized. |
| The investment adviser agreed to waive its fees and/or reimburse a portion of the Fund’s expenses during the period. Without this waiver/reimbursement, expenses would have been higher. |
| Computed on an annualized basis for periods less than one year. |
| Portfolio turnover rate excludes securities received or delivered from in–kind processing of creations or redemptions. |
See accompanying notes to financial statements.
Financial Highlights (continued)
For a share outstanding throughout each period.
| Natixis Loomis Sayles Short Duration Income ETF |
| Year Ended
December 31,
2023 | Year Ended
December 31,
2022 | Year Ended
December 31,
2021 | Year Ended
December 31,
2020 | Year Ended
December 31,
2019 |
Net asset value, beginning of the year | | | | | |
INCOME (LOSS) FROM INVESTMENT OPERATIONS: | | | | | |
| | | | | |
Net realized and unrealized gain (loss) | | | | | |
Total from Investment Operations | | | | | |
| | | | | |
| | | | | |
Net realized capital gains | | | | | |
| | | | | |
Net asset value, end of the year | | | | | |
| | | | | |
RATIOS TO AVERAGE NET ASSETS: | | | | | |
Net assets, end of the period (000's) | | | | | |
| | | | | |
| | | | | |
| | | | | |
Portfolio turnover rate(g) | | | | | |
| Per share net investment income has been calculated using the average shares outstanding during the period. |
| Amount rounds to less than $0.01. |
| Total return is calculated at net asset value assuming reinvestment of dividends and capital gains, if any. Had certain expenses not been waived/reimbursed during the period, total returns would have been lower. |
| Amount rounds to less than 0.01%. |
| The investment adviser agreed to waive its fees and/or reimburse a portion of the Fund’s expenses during the period. Without this waiver/reimbursement, expenses would have been higher. |
| Effective July 1, 2023, the expense limit decreased from 0.38% to 0.35%. See Note 6 of Notes to Financial Statements. |
| Portfolio turnover rate excludes securities received or delivered from in–kind processing of creations or redemptions. |
See accompanying notes to financial statements.
Financial Highlights (continued)
For a share outstanding throughout each period.
| Natixis Vaughan Nelson Mid Cap ETF |
| Year Ended
December 31,
2023 | Year Ended
December 31,
2022 | Year Ended
December 31,
2021 | |
Net asset value, beginning of the year | | | | |
INCOME (LOSS) FROM INVESTMENT OPERATIONS: | | | | |
| | | | |
Net realized and unrealized gain (loss) | | | | |
Total from Investment Operations | | | | |
| | | | |
| | | | |
Net realized capital gains | | | | |
| | | | |
Net asset value, end of the year | | | | |
| | | | |
RATIOS TO AVERAGE NET ASSETS: | | | | |
Net assets, end of the period (000's) | | | | |
| | | | |
| | | | |
| | | | |
Portfolio turnover rate(g) | | | | |
| From commencement of operations on September 16, 2020 through December 31, 2020. |
| Per share net investment income has been calculated using the average shares outstanding during the period. |
| Total return is calculated at net asset value assuming reinvestment of dividends and capital gains, if any. Had certain expenses not been waived/reimbursed during the period, total returns would have been lower. |
| Periods less than one year are not annualized. |
| The investment adviser agreed to waive its fees and/or reimburse a portion of the Fund’s expenses during the period. Without this waiver/reimbursement, expenses would have been higher. |
| Effective July 1, 2021, the expense limit decreased from 0.90% to 0.85%. |
| Computed on an annualized basis for periods less than one year. |
| Portfolio turnover rate excludes securities received or delivered from in–kind processing of creations or redemptions. |
See accompanying notes to financial statements.
Financial Highlights (continued)
For a share outstanding throughout each period.
| Natixis Vaughan Nelson Select ETF |
| Year Ended
December 31,
2023 | Year Ended
December 31,
2022 | Year Ended
December 31,
2021 | |
Net asset value, beginning of the year | | | | |
INCOME (LOSS) FROM INVESTMENT OPERATIONS: | | | | |
| | | | |
Net realized and unrealized gain (loss) | | | | |
Total from Investment Operations | | | | |
| | | | |
| | | | |
Net realized capital gains | | | | |
| | | | |
Net asset value, end of the year | | | | |
| | | | |
RATIOS TO AVERAGE NET ASSETS: | | | | |
Net assets, end of the period (000's) | | | | |
| | | | |
| | | | |
| | | | |
Portfolio turnover rate(h) | | | | |
| From commencement of operations on September 16, 2020 through December 31, 2020. |
| Per share net investment income has been calculated using the average shares outstanding during the period. |
| Includes a non-recurring dividend. Without this dividend, net investment income per share would have been $0.02, total return would have been 38.99% and the ratio of net investment income to average net assets would have been 0.07%. |
| Total return is calculated at net asset value assuming reinvestment of dividends and capital gains, if any. Had certain expenses not been waived/reimbursed during the period, total returns would have been lower. |
| Periods less than one year are not annualized. |
| The investment adviser agreed to waive its fees and/or reimburse a portion of the Fund’s expenses during the period. Without this waiver/reimbursement, expenses would have been higher. |
| Effective July 1, 2021, the expense limit decreased from 0.85% to 0.80%. |
| Computed on an annualized basis for periods less than one year. |
| Portfolio turnover rate excludes securities received or delivered from in–kind processing of creations or redemptions. |
See accompanying notes to financial statements.
Notes to Financial Statements
1.Organization. Natixis ETF Trust and Natixis ETF Trust II (the “Trusts” and each a “Trust”) are each organized as a Massachusetts business trust. Each Trust is registered under the Investment Company Act of 1940, as amended (the “1940 Act”), as an open-end management investment company. Each Declaration of Trust permits the Board of Trustees to authorize the issuance of an unlimited number of shares of beneficial interest of the Funds. Shares of the Funds are listed for trading on the NYSE Arca, Inc. (the “NYSE Arca”) and traded on other exchanges. The following funds (individually, a “Fund” and collectively, the “Funds”) are included in this report:
Natixis ETF Trust:
Natixis Gateway Quality Income ETF ("Quality Income ETF")
Natixis Loomis Sayles Short Duration Income ETF (“Short Duration Income ETF”)
Natixis ETF Trust II:
Natixis Loomis Sayles Focused Growth ETF (“Focused Growth ETF”)
Natixis Vaughan Nelson Mid Cap ETF (“Mid Cap ETF”)
Natixis Vaughan Nelson Select ETF (“Select ETF”)
Each Fund is a diversified investment company, except for Focused Growth ETF and Select ETF, which are non-diversified investment companies.
On June 28, 2023, Focused Growth ETF received an in-kind contribution from the Fund’s authorized participant (“Authorized Participant”) and commenced operations. Focused Growth ETF was initially funded via an in-kind contribution by an Authorized
Participant of approximately $5,250,000 in exchange for 210,000 shares. Natixis Investment Managers, LLC purchased 199,680 shares from the Authorized Participant in the secondary market on June 29, 2023.
On December 12, 2023, Quality Income ETF received an in-kind contribution from one of the Fund’s authorized participants (“Authorized Participant”) and commenced operations. Quality Income ETF was initially funded via an in-kind contribution by an Authorized Participant of approximately $40,500,000 in exchange for 810,000 shares. Natixis Investment Managers, LLC purchased 797,606 shares from the Authorized Participant in the secondary market on December 13, 2023.
Unlike traditional ETFs that provide daily disclosure of their portfolio holdings, Focused Growth ETF, Mid Cap ETF and Select ETF do not disclose the daily holdings of the actual portfolio. Instead, the Funds disclose a portfolio that is designed to reflect the economic exposure and risk characteristics of the actual portfolio on any given trading day (the “Proxy Portfolio”). Although the Proxy Portfolio is intended to provide Authorized Participants and other market participants with enough information to allow them to engage in effective arbitrage transactions that will keep the market price of the Funds’ shares trading at or close to the underlying net asset value (“NAV”) per share of the Fund, while at the same time enabling them to establish cost-effective hedging strategies to reduce risk, there is a risk that market prices will vary significantly from the underlying NAV of the Funds.
The Funds issue and redeem shares on a continuous basis through ALPS Distributors, Inc. (“ALPS”). Each Fund may pay ALPS, an unaffiliated distributor, fees under a plan adopted pursuant to Rule 12b-1 under the 1940 Act (the “12b-1 Plan”). Currently, no Rule 12b-1
fees are charged. Future payments may be made under the 12b-1 Plan without further shareholder approval.
Most expenses can be directly attributed to a Fund. Expenses which cannot be directly attributed to a Fund are generally apportioned based on the relative net assets of each of the Funds in Natixis Funds Trust I, Natixis Funds Trust II, Natixis Funds Trust IV and Gateway
Trust (“Natixis Funds Trusts”), Loomis Sayles Funds I and Loomis Sayles Funds II (“Loomis Sayles Funds Trusts”) and the Trusts.
2.Significant Accounting Policies. The following is a summary of significant accounting policies consistently followed by each Fund in the preparation of its financial statements. The Funds' financial statements follow the accounting and reporting guidelines provided for investment companies and are prepared in accordance with accounting principles generally accepted in the United States of America which require the use of management estimates that affect the reported amounts and disclosures in the financial statements. Actual results could differ from those estimates. Management has evaluated the events and transactions subsequent to year-end through the date the financial statements were issued and has determined that there were no material events that would require disclosure in the Funds' financial statements.
a. Valuation. Registered investment companies are required to value portfolio investments using an unadjusted, readily available market quotation. Each Fund obtains readily available market quotations from independent pricing services. Fund investments for which readily available market quotations are not available are priced at fair value pursuant to the Funds’ Valuation Procedures. The Board of Trustees has approved a valuation designee who is subject to the Board’s oversight.
Unadjusted readily available market quotations that are utilized for exchange traded equity securities (including shares of closed-end investment companies and exchange-traded funds) include the last sale price quoted on the exchange where the security is traded
Notes to Financial Statements (continued)
most extensively. Futures contracts are valued at the closing settlement price on the exchange on which the valuation designee believes that, over time, they are traded most extensively. Shares of open-end investment companies are valued at NAV per share.
Exchange traded equity securities for which there is no reported sale during the day are fair valued at the closing bid quotation as reported by an independent pricing service. Unlisted equity securities (except unlisted preferred equity securities) are fair valued at the last sale price quoted in the market where they are traded most extensively or, if there is no reported sale during the day, the closing bid quotation as reported by an independent pricing service. If there is no last sale price or closing bid quotation available, unlisted equity securities will be fair valued using evaluated bids furnished by an independent pricing service, if available.
Debt securities and unlisted preferred equity securities are fair valued based on evaluated bids furnished to the Fund by an independent pricing service or bid prices obtained from broker-dealers. Equity-linked notes are fair valued by the counterparty. Broker-dealer bid prices may be used to fair value debt and unlisted equities where an independent pricing service is unable to price an investment or where an independent pricing service does not provide a reliable price for the investment.
The Fund may also fair value investments in other circumstances such as when extraordinary events occur after the close of a foreign market, but prior to the close of the New York Stock Exchange. This may include situations relating to a single issuer (such as a declaration of bankruptcy or a delisting of the issuer’s security from the primary market on which it has traded) as well as events affecting the securities markets in general (such as market disruptions or closings and significant fluctuations in U.S. and/or foreign markets). When fair valuing a Fund’s investments, the valuation designee may, among other things, use modeling tools or other processes that may take into account factors such as issuer specific information, or other related market activity and/or information that occurred after the close of the foreign market but before the time the Fund’s NAV is calculated. Fair valuation by the Fund(s) valuation designee may require subjective determinations about the value of the investment, and fair values used to determine a Fund’s NAV may differ from quoted or published prices, or from prices that are used by others, for the same investments. In addition, the use of fair value pricing may not always result in adjustments to the prices of investments held by a Fund.
b. Investment Transactions and Related Investment Income. Investment transactions are accounted for on a trade date plus one day basis for daily NAV calculation. However, for financial reporting purposes, investment transactions are reported on trade date. Dividend income (including income reinvested) and foreign withholding tax, if applicable, are recorded on the ex-dividend date, or in the case of certain foreign securities, as soon as a Fund is notified, and interest income is recorded on an accrual basis. Dividends reinvested and stock dividends are reflected as non-cash dividends on the Statements of Operations. Interest income is increased by the accretion of discount and decreased by the amortization of premium, if applicable. For securities with pay down provisions, principal payments received are treated as a proportionate reduction to the cost basis of the securities, and excess or shortfall amounts are recorded as income. Distributions received from investments in securities that represent a return of capital or capital gain are recorded as a reduction of cost of investments or as a realized gain, respectively. In determining net gain or loss on securities sold, the cost of securities has been determined on an identified cost basis.
c. Foreign Currency Translation. The books and records of the Funds are maintained in U.S. dollars. The values of securities, currencies and other assets and liabilities denominated in currencies other than U.S. dollars, if any, are translated into U.S. dollars
based upon the World Market or “WM11” foreign exchange rates supplied by an independent pricing service. Purchases and sales of investment securities, income and expenses are translated into U.S. dollars on the respective dates of such transactions.
Net realized foreign exchange gains or losses arise from sales of foreign currency, changes in exchange rates between the trade and settlement dates on securities transactions and the difference between the amounts of dividends, interest and foreign withholding
taxes recorded in the Funds’ books and records and the U.S. dollar equivalent of the amounts actually received or paid. Net unrealized foreign exchange gains or losses arise from changes in the value of assets and liabilities, other than investment securities, as of the
end of the fiscal period, resulting from changes in exchange rates. Net realized foreign exchange gains or losses and the net change in unrealized foreign exchange gains or losses are disclosed in the Statements of Operations. For federal income tax purposes, net
realized foreign exchange gains or losses are characterized as ordinary income and may, if the Funds have net losses, reduce the amount of income available to be distributed by the Funds.
The values of investment securities are presented at the foreign exchange rates prevailing at the end of the period for financial reporting purposes. Net realized and unrealized gains or losses on investments reported in the Statements of Operations reflect gains
or losses resulting from changes in exchange rates and fluctuations which arise due to changes in market prices of investment securities.
The Funds may use foreign currency exchange contracts to facilitate transactions in foreign-denominated investments. Losses may arise from changes in the value of the foreign currency or if the counterparties do not perform under the contracts’ terms.
Notes to Financial Statements (continued)
d. Futures Contracts. A Fund may enter into futures contracts. Futures contracts are agreements between two parties to buy and sell a particular instrument or index for a specified price on a specified future date.
When a Fund enters into a futures contract, it is required to deposit with (or for the benefit of) its broker an amount of cash or short-term high-quality securities as “initial margin.” As the value of the contract changes, the value of the futures contract position increases or declines. Subsequent payments, known as “variation margin,” are made or received by a Fund, depending on the price fluctuations in the fair value of the contract and the value of cash or securities on deposit with the broker. The aggregate principal amounts of the contracts are not recorded in the financial statements. Daily fluctuations in the value of the contracts are recorded in the Statements of Assets and Liabilities as a receivable (payable) and in the Statements of Operations as unrealized appreciation (depreciation) until the contracts are closed, when they are recorded as realized gains (losses). Realized gain or loss on a futures position is equal to the difference between the value of the contract at the time it was opened and the value at the time it was closed, minus brokerage commissions. When a Fund enters into a futures contract certain risks may arise, such as illiquidity in the futures market, which may limit a Fund’s ability to close out a futures contract prior to settlement date, and unanticipated movements in the value of securities or interest rates. Futures contracts outstanding at the end of the period, if any, are listed in each applicable Fund’s Portfolio of Investments.
Futures contracts are exchange-traded. Exchange-traded futures contracts are standardized and are settled through a clearing house with fulfillment supported by the credit of the exchange. Therefore, counterparty credit risks to the Funds are reduced; however, in the event that a counterparty enters into bankruptcy, a Fund’s claim against initial/variation margin on deposit with the counterparty may be subject to terms of a final settlement in bankruptcy court.
e. Federal and Foreign Income Taxes. The Trusts treat each Fund as a separate entity for federal income tax purposes. Each Fund intends to meet the requirements of the Internal Revenue Code of 1986 ("IRC"), as amended, applicable to regulated investment companies, and to distribute to its shareholders substantially all of its net investment income and any net realized capital gains at least annually. Management has performed an analysis of each Fund’s tax positions for the open tax years as of December 31, 2023 and has concluded that no provisions for income tax are required. The Funds' federal tax returns for the prior three fiscal years, where applicable, remain subject to examination by the Internal Revenue Service. Management is not aware of any events that are reasonably possible to occur in the next twelve months that would result in the amounts of any unrecognized tax benefits significantly increasing or decreasing for the Funds. However, management’s conclusions regarding tax positions taken may be subject to review and adjustment at a later date based on factors including, but not limited to, new tax laws and accounting regulations and interpretations thereof.
A Fund may be subject to foreign withholding taxes on investment income and taxes on capital gains on investments that are accrued and paid based upon the Fund’s understanding of the tax rules and regulations that exist in the countries in which the Fund invests. Foreign withholding taxes on dividend and interest income are reflected on the Statements of Operations as a reduction of investment income, net of amounts that have been or are expected to be reclaimed and paid. Dividends and interest receivable on the Statements of Assets and Liabilities are net of foreign withholding taxes. Foreign withholding taxes where reclaims have been or are expected to be filed and paid are reflected on the Statements of Assets and Liabilities as tax reclaims receivable. Capital gains taxes paid are included in net realized gain (loss) on investments in the Statements of Operations. Accrued but unpaid capital gains taxes are reflected as foreign taxes payable on the Statements of Assets and Liabilities, if applicable, and reduce unrealized gains on investments. In the event that realized gains on investments are subsequently offset by realized losses, taxes paid on realized gains may be returned to a Fund. Such amounts, if applicable, are reflected as foreign tax rebates receivable on the Statements of Assets and Liabilities and are recorded as a realized gain when received.
f. Dividends and Distributions to Shareholders. Dividends and distributions are recorded on the ex-dividend date. The timing and characterization of certain income and capital gain distributions are determined in accordance with federal tax regulations, which may differ from accounting principles generally accepted in the United States of America. Permanent differences are primarily due to differing treatments for book and tax purposes of items such as premium amortization, distributions in excess of income and/or capital gain, return of capital distributions received, capital gain distribution received, redemptions in-kind, deferred Trustees' fees, futures contract mark-to-market, non-deductible expenses, net operating losses and paydown gains and losses. Permanent book and tax basis differences relating to shareholder distributions, net investment income and net realized gains will result in reclassifications to capital accounts reported on the Statements of Assets and Liabilities. Temporary differences between book and tax distributable earnings are primarily due to deferred Trustees’ fees, futures contract mark-to-market, return of capital distributions received, premium amortization, straddle loss deferral adjustments, capital gain distribution received, paydown gains and losses, net operating losses and wash sales. Amounts of income and capital gain available to be distributed on a tax basis are determined annually, and at other times
Notes to Financial Statements (continued)
during the Funds’ fiscal year as may be necessary to avoid knowingly declaring and paying a return of capital distribution. Distributions from net investment income and net realized short-term capital gains are reported as distributed from ordinary income for tax purposes.
The tax characterization of distributions is determined on an annual basis. The tax character of distributions paid to shareholders during the years ended December 31, 2023 and 2022 was as follows:
| | |
| | | | | | |
| | | | | | |
| | | | | | |
Short Duration Income ETF | | | | | | |
| | | | | | |
| | | | | | |
Distributions paid to shareholders from net investment income and net realized capital gains, based on accounting principles generally accepted in the United States of America, are consolidated and reported on the Statements of Changes in Net Assets as Distributions to Shareholders. Distributions paid to shareholders from net investment income and net realized capital gains expressed in per-share amounts, based on accounting principles generally accepted in the United States of America, are separately stated and reported within the Financial Highlights.
As of December 31, 2023, the components of distributable earnings on a tax basis were as follows:
| | | | | |
Undistributed ordinary income | | | | | |
Capital loss carryforward: | | | | | |
| | | | | |
| | | | | |
| | | | | |
| | | | | |
Total capital loss carryforward* | | | | | |
Unrealized appreciation (depreciation) | | | | | |
Total accumulated earnings (losses) | | | | | |
| Under Section 382 of the Internal Revenue Service Code, a portion of the capital loss carryforward for Short Duration Income ETF and Select ETF is subject to certain limitations upon availability, to offset future capital gains, if any. |
As of December 31, 2023, the tax cost of investments (including derivatives, if applicable) and unrealized appreciation (depreciation) on a federal tax basis were as follows:
| | | | | |
| | | | | |
| | | | | |
| | | | | |
Net tax appreciation (depreciation) | | | | | |
g. Equity-Linked Notes. Quality Income ETF may invest in equity-linked notes (“ELNs”). ELNs are hybrid instruments which combine both debt and equity characteristics into a single note form. ELN values are linked to the performance of an underlying index. ELNs are unsecured debt obligations of an issuer and may not be publicly listed or traded on an exchange. ELNs have a coupon which is accrued and recorded as interest income on the Fund's Statement of Operations. The risk of investing in ELNs depends on the principal protection offered. Some ELNs may guarantee total principal or partial principal while others may not provide any guarantee of
Notes to Financial Statements (continued)
principal. The maturity value may also be impacted to the extent of any limit on the return value as part of the note structure. ELNs are subject to counterparty credit risk in that issuers and/or counterparties may fail to make payments when due or default completely, which could result in a loss of all or part of the Fund’s investment. ELNs outstanding at the end of the period, if any, are listed in the Fund's Portfolio of Investments.
h. Repurchase Agreements. Each Fund may enter into repurchase agreements, under the terms of a Master Repurchase Agreement, under which each Fund acquires securities as collateral and agrees to resell the securities at an agreed upon time and at an agreed upon price. It is each Fund’s policy that the market value of the collateral for repurchase agreements be at least equal to 102% of the repurchase price, including interest. Certain repurchase agreements are tri-party arrangements whereby the collateral is held in a segregated account for the benefit of the Fund and on behalf of the counterparty. Repurchase agreements could involve certain risks in the event of default or insolvency of the counterparty including possible delays or restrictions upon the Fund’s ability to dispose of the underlying securities. As of December 31, 2023, each Fund, as applicable, had investments in repurchase agreements for which the value of the related collateral exceeded the value of the repurchase agreement. The gross value of repurchase agreements is included in the Statements of Assets and Liabilities for financial reporting purposes.
i. Indemnifications. Under the Trusts’ organizational documents, their officers and Trustees are indemnified against certain liabilities arising out of the performance of their duties to the Funds. Additionally, in the normal course of business, the Funds enter into contracts with service providers that contain general indemnification clauses. The Funds' maximum exposure under these arrangements is unknown as this would involve future claims that may be made against the Funds that have not yet occurred. However, based on experience, the Funds expect the risk of loss to be remote.
j. Regulatory Update. Effective January 24, 2023, the SEC adopted a release (the “Release”) containing rule and form amendments to require mutual funds and ETFs to transmit concise and visually engaging streamlined annual and semiannual reports to shareholders that highlight key information deemed important for retail investors to assess and monitor their fund investments. Other information, including financial statements, will no longer appear in the new tailored shareholder reports but will be available online, delivered free of charge upon request, and filed with the SEC on a semiannual basis on Form N-CSR. In addition to the removal of financial statements from the new tailored shareholder reports, the Release requires mandatory mailing of the reports, unless a shareholder specifically opts out and chooses electronic delivery. The Release also requires that the new tailored shareholder reports be no longer than 2-4 pages, include only a single share class of a single fund, and use a broad-based securities market index for performance comparison purposes. Management is evaluating the impact of the Release on the content of the current shareholder report and newly created tailored shareholder reports and expects to meet the required compliance date of July 24, 2024.
3.Fair Value Measurements. In accordance with accounting standards related to fair value measurements and disclosures, the Funds have categorized the inputs utilized in determining the value of each Fund’s assets or liabilities. These inputs are summarized in the three broad levels listed below:
• Level 1 — quoted prices in active markets for identical assets or liabilities;
• Level 2 — prices determined using other significant inputs that are observable either directly, or indirectly through corroboration with observable market data (which could include quoted prices for similar assets or liabilities, interest rates, credit risk, etc.); and
• Level 3 — prices determined using significant unobservable inputs when quoted prices or observable inputs are unavailable such as when there is little or no market activity for an asset or liability (unobservable inputs reflect each Fund’s own assumptions in determining the fair value of assets or liabilities and would be based on the best information available).
The inputs or methodology used for valuing securities are not necessarily an indication of the risk associated with investing in those securities.
The Funds' pricing policies have been approved by the Board of Trustees. Investments for which market quotations are readily available are categorized in Level 1. Other investments for which an independent pricing service is utilized are categorized in Level 2. Broker-dealer bid prices for which the Funds have knowledge of the inputs used by the broker-dealer are categorized in Level 2. All other investments, including broker-dealer bid prices for which the Funds do not have knowledge of the inputs used by the broker-dealer, as well as investments fair valued by the valuation designee, are categorized in Level 3. All Level 2 and 3 securities are defined as being fair valued.
Notes to Financial Statements (continued)
Under certain conditions and based upon specific facts and circumstances, the Fund’s valuation designee may determine that a fair valuation should be made for portfolio investment(s). These valuation designee fair valuations will be based upon a significant amount of Level 3 inputs.
The following is a summary of the inputs used to value the Funds' investments as of December 31, 2023, at value:
| Details of the major categories of the Fund’s investments are reflected within the Portfolio of Investments. |
| Details of the major categories of the Fund’s investments are reflected within the Portfolio of Investments. |
Short Duration Income ETF |
|
| | | | |
| | | | |
Collateralized Mortgage Obligations | | | | |
All Other Bonds and Notes(a) | | | | |
| | | | |
| | | | |
| | | | |
Futures Contracts (unrealized appreciation) | | | | |
| | | | |
|
Liability Valuation Inputs |
| | | | |
Futures Contracts (unrealized depreciation) | | | | |
| Details of the major categories of the Fund’s investments are reflected within the Portfolio of Investments. |
Notes to Financial Statements (continued)
| Details of the major categories of the Fund’s investments are reflected within the Portfolio of Investments. |
| Details of the major categories of the Fund’s investments are reflected within the Portfolio of Investments. |
The following is a reconciliation of Level 3 investments for which significant unobservable inputs were used to determine fair value as of December 31, 2022 and/or December 31, 2023:
Short Duration Income ETF |
|
| Balance as of
December 31,
2022 | Accrued
Discounts
(Premiums) | | Change in
Unrealized
Appreciation
(Depreciation) | | | | | Balance as of
December 31,
2023 | Change in
Unrealized
Appreciation
(Depreciation)
from
Investments
Still Held at
December 31,
2023 |
| | | | | | | | | | |
Collateralized Mortgage Obligations | | | | | | | | | | |
4.Derivatives. Derivative instruments are defined as financial instruments whose value and performance are based on the value and performance of an underlying asset, reference rate or index. Derivative instruments that Short Duration Income ETF used during the period include futures contracts.
The Fund is subject to the risk that changes in interest rates will affect the value of the Fund’s investments in fixed-income securities. The Fund will be subject to increased interest rate risk to the extent that it invests in fixed-income securities with longer maturities or durations, as compared to investing in fixed-income securities with shorter maturities or durations. The Fund may use futures contracts to hedge against changes in interest rates and to manage duration without having to buy or sell portfolio securities. During the year ended December 31, 2023, Short Duration Income ETF used futures contracts to manage duration.
Notes to Financial Statements (continued)
The following is a summary of derivative instruments for Short Duration Income ETF as of December 31, 2023, as reflected within the Statements of Assets and Liabilities:
| Unrealized
appreciation
on futures
|
Exchange-traded asset derivatives | |
| |
| Unrealized
depreciation
on futures
|
Exchange-traded liability derivatives | |
| |
| Represents cumulative unrealized appreciation (depreciation) on futures contracts. Only the current day’s variation margin on futures contracts is reported within the Statements of Assets and Liabilities as receivable or payable for variation margin, as applicable. |
Transactions in derivative instruments for Short Duration Income ETF during the year ended December 31, 2023, as reflected within the Statements of Operations were as follows:
Net Realized Gain (Loss) on: | |
| |
Net Change in Unrealized
Appreciation (Depreciation) on: | |
| |
As the Fund values its derivatives at fair value and recognizes changes in fair value through the Statement of Operations, it does not qualify for hedge accounting under authoritative guidance for derivative instruments. The Fund’s investments in derivatives may represent an economic hedge; however, they are considered to be non-hedge transactions for the purpose of these disclosures.
The volume of futures contract activity as a percentage of net assets, based on month-end notional amounts outstanding during the period, including long and short positions at absolute value, was as follows for the year ended December 31, 2023:
Short Duration Income ETF | |
Average Notional Amount Outstanding | |
Highest Notional Amount Outstanding | |
Lowest Notional Amount Outstanding | |
Notional Amount Outstanding as of December 31, 2023 | |
Notional amounts outstanding at the end of the prior period, if applicable, are included in the average notional amount outstanding.
Unrealized gain and/or loss on open futures contracts is recorded in the Statements of Assets and Liabilities. The aggregate notional values of futures contracts are not recorded in the Statements of Assets and Liabilities, and therefore are not included in the Fund’s net assets.
Counterparty risk is managed based on policies and procedures established by the Fund’s adviser. Such policies and procedures may include, but are not limited to, minimum counterparty credit rating requirements, monitoring of counterparty credit default swap spreads and posting of collateral. With exchange-traded derivatives, there is minimal counterparty credit risk to the Fund because the exchange’s clearing house, as counterparty to these instruments, stands between the buyer and the seller of the contract. Credit risk still exists in exchange-traded derivatives with respect to initial and variation margin that is held in a broker’s customer accounts. While brokers typically are required to segregate customer margin for exchange-traded derivatives from their own assets, in the event that a broker becomes insolvent or goes into bankruptcy and at that time there is a shortfall in the aggregate amount of margin held by the broker for all its customers, U.S. bankruptcy laws will typically allocate that shortfall on a pro rata basis across all of the broker’s customers, potentially resulting in losses to the Fund.
Notes to Financial Statements (continued)
5.Purchases and Sales of Securities. For the year ended (period ended for Quality Income ETF and Focused Growth ETF) December 31, 2023, purchases and sales of securities (excluding in-kind transactions and short-term investments and including paydowns) were as follows:
| U.S. Government/
Agency Securities | |
| | | | |
| | | | |
| | | | |
Short Duration Income ETF | | | | |
| | | | |
| | | | |
For the year ended (period ended for Quality Income ETF and Focused Growth ETF) December 31, 2023, in-kind transactions were as follows:
Mid Cap ETF and Select ETF realized a gain of $608,468 and $1,705,271, respectively on in-kind sales during the year ended December 31, 2023. Gains and losses realized on in-kind sales are not recognized for tax purposes and are re-classified from realized gain (loss) to paid-in-capital.
6.Management Fees and Other Transactions with Affiliates.
a. Management Fees. Natixis Advisors, LLC (“Natixis Advisors”), serves as investment adviser to each Fund. Natixis Advisors is a wholly-owned subsidiary of Natixis Investment Managers, LLC, which is part of Natixis Investment Managers, an international asset management group based in Paris, France. Under the terms of the management agreements, each Fund pays a management fee at the following annual rates, calculated daily and payable monthly, based on each Fund’s average daily net assets:
| Percentage of Average Daily Net Assets |
| | |
| | |
| | |
Short Duration Income ETF | | |
| | |
| | |
Natixis Advisors has entered into subadvisory agreements for each Fund as listed below.
| |
| Gateway Investment Advisers, LLC (“Gateway Advisers”) |
| Loomis, Sayles & Company, L.P. (“Loomis Sayles”) |
Short Duration Income ETF | |
| Vaughan Nelson Investment Management, L.P. (“Vaughan Nelson”) |
| |
Gateway Advisers and Vaughan Nelson are subsidiaries of Natixis Investment Managers, LLC. Loomis Sayles is a limited partnership whose sole general partner, Loomis, Sayles & Company, Inc., is indirectly owned by Natixis Investment Managers, LLC.
Notes to Financial Statements (continued)
Under the terms of the subadvisory agreements, each Fund has agreed to pay its respective subadviser a subadvisory fee at the following annual rates, calculated daily and payable monthly, based on each Fund’s average daily net assets:
| | Percentage of Average
Daily Net Assets |
| | | |
| | | |
| | | |
Short Duration Income ETF | | | |
| | | |
| | | |
Payments to Natixis Advisors are reduced by the amounts of payments to the subadvisers, as calculated based on the table above.
Natixis Advisors has given a binding undertaking to the Funds to waive management fees and/or reimburse certain expenses to limit the Funds’ operating expenses, exclusive of acquired fund fees and expenses, brokerage expenses, interest expense, taxes, organizational and extraordinary expenses such as litigation and indemnification expenses. This undertaking is in effect until April 30, 2026, may be terminated before then only with the consent of the Funds’ Board of Trustees, and is reevaluated on an annual basis. Management fees payable, as reflected on the Statements of Assets and Liabilities, is net of waivers and/or expense reimbursements, if any, pursuant to these undertakings. Waivers/reimbursements that exceed management fees payable are reflected on the Statements of Assets and Liabilities as receivable from investment adviser.
For the year ended (period ended for Quality Income ETF and Focused Growth ETF) December 31, 2023, the expense limits as a percentage of average daily net assets under the expense limitation agreements were as follows:
| |
| Expense Limit as a Percentage of
Average Daily Net Assets |
| |
| |
Short Duration Income ETF | |
| |
| |
Prior to July 1, 2023, the expense limits as a percentage of average daily net assets under the expense limitation agreements for Short Duration Income ETF were as follows:
| |
| Expense Limit as a Percentage of
Average Daily Net Assets |
Short Duration Income ETF | |
Natixis Advisors shall be permitted to recover expenses borne under the expense limitation agreements (whether through waiver of management fees or otherwise) in later periods to the extent the annual operating expenses of a Fund fall below both (1) a Funds’ expense limitation ratio in place at the time such amounts were waived/reimbursed and (2) a Funds’ current applicable expense limitation ratio, provided, however, that a Fund is not obligated to pay such waived/reimbursed fees or expenses more than one year after the end of the fiscal year in which the fees or expenses were waived/reimbursed.
Notes to Financial Statements (continued)
For the year ended (period ended for Quality Income ETF and Focused Growth ETF) December 31, 2023, the management fees and waiver of management fees for each Fund were as follows:
| | Contractual
Waivers of
Management
| | Percentage of
Average
Daily Net Assets |
| | |
| | | | | |
| | | | | |
Short Duration Income ETF | | | | | |
| | | | | |
| | | | | |
| Management fee waivers are subject to possible recovery until December 31, 2024. |
For the year ended (period ended for Quality Income ETF and Focused Growth ETF) December 31, 2023, expenses have been reimbursed as follows:
| |
| |
| |
Short Duration Income ETF | |
| |
| Expense reimbursement is subject to possible recovery until December 31, 2024. |
No expenses were recovered for any of the Funds during the year ended (period ended for Quality Income ETF and Focused Growth ETF) December 31, 2023 under the terms of the expense limitation agreements.
b. Administrative Fees. Natixis Advisors provides certain administrative services for the Funds and contracts with State Street Bank and Trust Company (“State Street Bank”) to serve as sub-administrator. Pursuant to an agreement among Natixis Funds Trusts, Loomis Sayles Funds Trusts, the Trusts and Natixis Advisors, each Fund pays Natixis Advisors monthly its pro rata portion of fees equal to an annual rate of 0.0540% of the first $15 billion of the average daily net assets of the Natixis Funds Trusts, Loomis Sayles Funds Trusts and the Trusts, 0.0500% of the next $15 billion, 0.0400% of the next $30 billion, 0.0275% of the next $30 billion and 0.0225% of such assets in excess of $90 billion, subject to an annual aggregate minimum fee for the Natixis Funds Trusts, Loomis Sayles Funds Trusts and the Trusts of $10 million, which is reevaluated on an annual basis.
For the year ended (period ended for Quality Income ETF and Focused Growth ETF) December 31, 2023, the administrative fees for each Fund were as follows:
| |
| |
| |
Short Duration Income ETF | |
| |
| |
c. Trustees Fees and Expenses. The Trusts do not pay any compensation directly to their officers or Trustees who are directors, officers or employees of Natixis Advisors, Natixis Distribution, LLC (“Natixis Distribution”), Natixis Investment Managers, LLC or their affiliates. The Chairperson of the Board of Trustees receives a retainer fee at the annual rate of $369,000. The Chairperson does not receive any meeting attendance fees for Board of Trustees meetings or committee meetings that he attends. Each Independent Trustee (other than the Chairperson) receives, in the aggregate, a retainer fee at the annual rate of $210,000. Each Independent Trustee also receives a meeting attendance fee of $10,000 for each meeting of the Board of Trustees that he or she attends in person and $5,000 for each meeting of the Board of Trustees that he or she attends telephonically. In addition, the chairperson of the Contract Review Committee, the chairperson of the Audit Committee and the chairperson of the Governance Committee each receive an additional retainer fee at the annual rate of $20,000. Each Contract Review Committee member is compensated $6,000 for each Committee meeting that he or she attends in person and $3,000 for each meeting that he or she attends telephonically. Each Audit Committee
Notes to Financial Statements (continued)
member is compensated $6,000 for each Committee meeting that he or she attends in person and $3,000 for each meeting that he or she attends telephonically. Each Governance Committee member is compensated $2,500 for each Committee meeting that he or she attends either in person or telephonically. These fees are allocated among the funds in the Natixis Funds Trusts, Loomis Sayles Funds Trusts and Natixis ETF Trusts based on a formula that takes into account, among other factors, the relative net assets of each fund. Trustees are reimbursed for travel expenses in connection with attendance at meetings.
Effective January 1, 2024, the Chairperson of the Board of Trustees will receive a retainer fee at the annual rate of $385,000 and each Independent Trustee (other than the Chairperson) will receive, in the aggregate, a retainer fee at the annual rate of $225,000. Each Independent Trustee will receive a meeting attendance fee of $10,000 for each meeting of the Board of Trustees that he or she attends in person. The chairperson of the Contract Review Committee and the chairperson of the Audit Committee each will receive an additional retainer fee at the annual rate of $25,000. All other Trustees fees will remain unchanged.
A deferred compensation plan (the “Plan”) is available to the Trustees on a voluntary basis. The value of a participating Trustee’s deferral account is based on theoretical investments of deferred amounts, on the normal payment dates, in certain funds of the Natixis Funds Trusts, Loomis Sayles Funds Trusts and Natixis ETF Trusts as designated by the participating Trustees. Changes in the value of participants’ deferral accounts are allocated pro rata among the funds in the Natixis Funds Trusts, Loomis Sayles Funds Trusts and Natixis ETF Trusts and are normally reflected as Trustees’ fees and expenses in the Statements of Operations. Deferred amounts remain in the funds until distributed in accordance with the provisions of the Plan. The portions of the accrued obligations allocated to the Funds under the Plan are reflected as Deferred Trustees’ fees in the Statements of Assets and Liabilities.
Certain officers and employees of Natixis Advisors and affiliates are also officers and/or Trustees of the Trusts.
d. Affiliated Ownership. As of December 31, 2023, the percentage of each Fund’s net assets owned by Natixis is as follows:
Investment activities of affiliated shareholders could have material impacts on the Funds.
7.Transfer Agent, Custodian, Regulatory Filing Fees and Shareholder Reporting Expenses. State Street Bank, transfer agent, custodian and sub-administrator to the Funds, agreed to waive its fees and expenses for the first 12 months of operations for Quality Income ETF and Focused Growth ETF. For the period ended December 31, 2023, total fees waived were $4,379 and $32,473, respectively.
8.Line of Credit. Short Duration Income ETF, Mid Cap ETF and Select ETF, together with certain other funds of Natixis Funds Trusts, Loomis Sayles Funds Trusts and Natixis ETF Trusts, entered into a syndicated, revolving, committed, unsecured line of credit with State Street Bank as administrative agent. The aggregate revolving commitment amount is $575,000,000. Any one Fund may borrow up to $402,500,000 under the line of credit agreement (as long as all borrowings by all Funds in the aggregate do not exceed the $575,000,000 limit at any time), subject to each Fund’s investment restrictions and its contractual obligations under the line of credit. Interest is charged to the Funds based upon the terms set forth in the agreement. In addition, a commitment fee of 0.15% per annum, payable at the end of each calendar quarter, is accrued and apportioned among the participating funds based on their average daily unused portion of the line of credit. The Funds paid certain legal fees in connection with the line of credit agreement, which are being amortized over a period of 364 days and are reflected in legal fees on the Statements of Operations. The unamortized balance is reflected as prepaid expenses on the Statements of Assets and Liabilities.
Prior to April 6, 2023, each Fund, together with certain other funds of Natixis Funds Trusts and Loomis Sayles Funds Trusts and Natixis ETF Trusts, entered into a $500,000,000 committed unsecured line of credit provided by State Street Bank. Any one Fund was able to borrow up to $350,000,000 under the line of credit agreement (as long as all borrowings by all Funds in the aggregate did not exceed the $500,000,000 limit at any time), subject to each Fund’s investment restrictions and its contractual obligations under the line of credit. Interest was charged to the Funds based upon the terms set forth in the agreement. In addition, a commitment fee of 0.15% per annum, payable at the end of each calendar quarter, was accrued and apportioned among the participating funds based on their average daily unused portion of the line of credit.
For the year ended December 31, 2023, the Funds had no borrowings under this agreement.
9.Risk. The Funds have exposure to certain types of risk as summarized below.
a. Authorized Participant Concentration Risk. Only an Authorized Participant may engage in creation or redemption transactions directly with the Funds. The Funds have a limited number of institutions that act as Authorized Participants, none of which are or will be
Notes to Financial Statements (continued)
obligated to engage in creation or redemption transactions. To the extent that these institutions exit the business or are unable to proceed with creation and/or redemption orders with respect to the Funds and no other Authorized Participant is able to step forward to create or redeem Creation Units, Fund shares may trade at a discount to NAV and possibly face trading halts and/or delisting.
b. Premium/Discount Risk. Shares of the Funds are listed for trading on the NYSE Arca and are bought and sold in the secondary market at market prices that may differ from their most recent NAV. The market value of the Funds’ shares will fluctuate, in some cases materially, in response to changes in the Funds’ NAV, the intraday value of the Funds’ holdings, and the relative supply and demand for the Funds’ shares on the exchange. Disruptions to creations and redemptions, the existence of extreme market volatility or potential lack of an active trading market for shares may result in shares trading at a significant premium or discount to NAV and/or in a reduced liquidity of your investment. If a shareholder purchases shares at a time when the market price is at a premium to the NAV or sells shares at a time when the market price is at a discount to the NAV, the shareholder may sustain losses.
c. Trading Issues Risk. Trading in shares on the NYSE Arca may be halted in certain circumstances. There can be no assurance that the requirements of the NYSE Arca necessary to maintain the listing of the Funds will continue to be met. Because Mid Cap ETF, Select ETF, Focused Growth ETF trade on the basis of a published Proxy Portfolio, they may trade at a wider bid/ask spread and may experience a wider premium/discount than traditional ETFs that publish their portfolios on a daily basis, and therefore, may cost investors more to trade especially during periods of market disruption or volatility.
d. Non-Diversified Risk. Focused Growth ETF and Select ETF are non-diversified, which means that the Funds are not limited under the 1940 Act to a percentage of assets that it may invest in any one issuer. Because the Funds may invest in the securities of a limited
number of issuers, an investment in the Funds may involve a higher degree of risk than would be present in a diversified portfolio.
e. Other. Geopolitical events (such as trading halts, sanctions or wars) could increase volatility and uncertainty in the financial markets and adversely affect regional and global economies. These, and other related events, could significantly impact a Fund's performance and the value of an investment in the Fund, even if the Fund does not have direct exposure to issuers in the country or countries involved.
10.Capital Shares. Shares of the Funds may be acquired or redeemed directly from the Funds by Authorized Participants only in aggregations of 50,000 shares for Short Duration Income ETF and 10,000 shares for Quality Income ETF, Focused Growth ETF, Mid Cap ETF and Select ETF (“Creation Units”), or multiples thereof. Each Authorized Participant enters into an Authorized Participant agreement with the Funds’ Distributor.
A creation transaction order, which is subject to acceptance by ALPS, generally takes place when an Authorized Participant deposits into the Funds a designated portfolio of securities and/or cash (including any portion of such securities for which cash may be substituted) and a specified amount of cash approximating the holdings of the Funds in exchange for a specified number of Creation Units.
Similarly, shares can be redeemed only in Creation Units, generally for a designated portfolio of securities and/or cash (including any portion of such securities for which cash may be substituted) held by the Funds and a specified amount of cash. Except when aggregated in Creation Units, shares are not redeemable directly with the Funds.
The prices at which creations and redemptions occur are based on the next calculation of NAV after a creation or redemption order is received in an acceptable form under the Authorized Participant agreement. These prices may differ from the market price of the Fund’s shares.
The Funds may impose a creation transaction fee and a redemption transaction fee to offset transfer and other transaction costs associated with the issuance and redemption of Creation Units. Transaction fees are included in capital share transactions on the Statements of Changes in Net Assets.
Transactions in capital shares were as follows:
|
| Period Ended
December 31, 2023(a) |
| | |
Issued from the sale of shares | | |
Increase from capital share transactions | | |
| From commencement of operations on December 12, 2023 through December 31, 2023. |
Notes to Financial Statements (continued)
10.Capital Shares (continued).
|
| Period Ended
December 31, 2023(a) |
| | |
Issued from the sale of shares | | |
Increase from capital share transactions | | |
| From commencement of operations on June 28, 2023 through December 31, 2023. |
|
| Year Ended
December 31, 2023 | Year Ended
December 31, 2022 |
Short Duration Income ETF | | | | |
Issued from the sale of shares | | | | |
| | | | |
Decrease from capital share transactions | | | | |
|
| Year Ended
December 31, 2023 | Year Ended
December 31, 2022 |
| | | | |
Issued from the sale of shares | | | | |
| | | | |
Decrease from capital share transactions | | | | |
|
| Year Ended
December 31, 2023 | Year Ended
December 31, 2022 |
| | | | |
Issued from the sale of shares | | | | |
| | | | |
Increase from capital share transactions | | | | |
11.Subsequent Event. On December 6, 2023, the Board of Trustees, on behalf of Mid Cap ETF and Select ETF, approved a change in each Fund’s structure from a “semi-transparent” ETF, which does not publicly disclose all its portfolio holdings on a daily basis, to a “transparent” ETF, which will disclose all its portfolio holdings daily and operate in reliance on Rule 6c-11 under the Investment Company Act of 1940. A daily proxy portfolio is no longer required. This change became effective on February 1, 2024.
Report of Independent Registered Public Accounting Firm
To the Boards of Trustees of Natixis ETF Trust and Natixis ETF Trust II and Shareholders of Natixis Gateway Quality Income ETF, Natixis Loomis Sayles Short Duration Income ETF, Natixis Loomis Sayles Focused Growth ETF, Natixis Vaughan Nelson Mid Cap ETF and Natixis Vaughan Nelson Select ETF
Opinions on the Financial Statements
We have audited the accompanying statements of assets and liabilities, including the portfolios of investments, of Natixis Gateway Quality Income ETF and Natixis Loomis Sayles Short Duration Income ETF (constituting Natixis ETF Trust), Loomis Sayles Focused Growth ETF, Natixis Vaughan Nelson Mid Cap ETF and Natixis Vaughan Nelson Select ETF (constituting Natixis ETF Trust II) (hereafter collectively referred to as the "Funds") as of December 31, 2023, the related statements of operations and of changes in net assets for each of the periods indicated in the table below, including the related notes, and the financial highlights for each of the periods indicated in the table below (collectively referred to as the “financial statements”). In our opinion, the financial statements present fairly, in all material respects, the financial position of each of the Funds as of December 31, 2023, the results of each of their operations, the changes in each of their net assets, and each of the financial highlights for each of the periods indicated in the table below, in conformity with accounting principles generally accepted in the United States of America.
| | Statement of changes in net assets | |
Natixis Gateway Quality Income ETF | For the period from December 12, 2023 (commencement of operations) to December 31, 2023 | For the period from December 12, 2023 (commencement of operations) to December 31, 2023 | For the period from December 12, 2023 (commencement of operations) to December 31, 2023 |
Natixis Loomis Sayles Short Duration Income ETF | For the year ended December 31, 2023 | For each of the two years in the period ended December 31, 2023 | For each of the five years in the period ended December 31, 2023 |
Natixis Loomis Sayles Focused Growth ETF | For the period from June 28, 2023 (commencement of operations) to December 31, 2023 | For the period from June 28, 2023 (commencement of operations) to December 31, 2023 | For the period from June 28, 2023 (commencement of operations) to December 31, 2023 |
Natixis Vaughan Nelson Mid Cap ETF | For the year ended December 31, 2023 | For each of the two years in the period ended December 31, 2023 | For the years ended December 31, 2023, 2022, 2021, and the period from September 16, 2020 (commencement of operations) to December 31, 2020 |
Natixis Vaughan Nelson Select ETF | For the year ended December 31, 2023 | For each of the two years in the period ended December 31, 2023 | For the years ended December 31, 2023, 2022, 2021, and the period from September 16, 2020 (commencement of operations) to December 31, 2020 |
Basis for Opinions
These financial statements are the responsibility of the Funds’ management. Our responsibility is to express an opinion on the Funds’ financial statements based on our audits. We are a public accounting firm registered with the Public Company Accounting Oversight Board (United States) (PCAOB) and are required to be independent with respect to the Funds in accordance with the U.S. federal securities laws and the applicable rules and regulations of the Securities and Exchange Commission and the PCAOB.
We conducted our audits of these financial statements in accordance with the standards of the PCAOB. Those standards require that we plan and perform the audit to obtain reasonable assurance about whether the financial statements are free of material misstatement, whether due to error or fraud.
Report of Independent Registered Public Accounting Firm
Our audits included performing procedures to assess the risks of material misstatement of the financial statements, whether due to error or fraud, and performing procedures that respond to those risks. Such procedures included examining, on a test basis, evidence regarding the amounts and disclosures in the financial statements. Our audits also included evaluating the accounting principles used and significant estimates made by management, as well as evaluating the overall presentation of the financial statements. Our procedures included confirmation of securities owned as of December 31, 2023 by correspondence with the custodian and brokers. We believe that our audits provide a reasonable basis for our opinions.
/s/PricewaterhouseCoopers LLP
Boston, Massachusetts
February 22, 2024
We have served as the auditor of one or more investment companies in Natixis Investment Company Complex since at least 1995. We have not been able to determine the specific year we began serving as auditor.
2023 U.S. Tax Distribution Information to Shareholders (Unaudited)
Corporate Dividends Received Deduction. For the fiscal year ended December 31, 2023, a percentage of dividends distributed by the Funds listed below qualify for the dividends received deduction for corporate shareholders. These percentages are as follows:
Qualified Dividend Income. For the fiscal year ended December 31, 2023, the Fund below will designate up to the maximum amount allowable pursuant to the Internal Revenue Code as qualified dividend income eligible for reduced tax rates. These lower rates range from 0% to 20% depending on an individual’s tax bracket. If the Fund pays a distribution during calendar year 2023, complete information will be reported in conjunction with Form 1099-DIV.
Trustee and Officer Information
The tables below provide certain information regarding the Trustees and officers of Natixis ETF Trust and Natixis ETF Trust II (the “Trusts”). Unless otherwise indicated, the address of all persons below is 888 Boylston Street, Suite 800, Boston, MA 02199-8197. The Funds' Statements of Additional Information include additional information about the Trustees of the Trusts and are available by calling Natixis ETFs at 800-458-7452.
| Position(s) Held with
the Trusts, Length
of Time Served and
| Principal
Occupation(s)
During Past 5 Years | Number of Portfolios
in Fund Complex
Overseen2and Other
Directorships Held
During Past 5 Years | Experience,
Qualifications,
Attributes, Skills for
Board Membership |
| | | | |
| Trustee since 2016 for
Natixis ETF Trust and
2020 for Natixis ETF
Trust II
Contract Review
Committee Member | Executive Chairman of Bob’s Discount Furniture (retail) | 51
Director, Burlington Stores, Inc. (retail); Director, Rue La La
(e-commerce retail) | Significant experience on the Board and on the boards of other business organizations (including retail companies and a bank); executive experience (including at a retail company) |
| Trustee since 2016 for
Natixis ETF Trust and
2020 for Natixis ETF
Trust II
Chairperson of the
Audit Committee | | 51
Formerly, Director of Triumph Group (aerospace industry) | Significant experience on the Board and executive experience (including his role as Vice President and treasurer of a defense company and experience at a financial services company) |
| Trustee since 2016 for
Natixis ETF Trust and
2020 for Natixis ETF
Trust II
Chairperson of the
Governance
Committee and
Contract Review
Committee Member | President, University of Massachusetts | | Significant experience on the Board and on the boards of other business organizations; experience as President of the University of Massachusetts; government experience (including as a member of the U.S. House of Representatives); academic experience |
Maureen B. Mitchell
(1951) | Trustee since 2017 for
Natixis ETF Trust and
2020 for Natixis ETF
Trust II
Chairperson of the
Contract Review
Committee | | 51
Director, Sterling Bancorp (bank) | Significant experience on the Board; financial services industry and executive experience (including role as President of global sales and marketing at a financial services company) |
Trustee and Officer Information
| Position(s) Held with the Trusts, Length of Time Served and Term of Office1 | Principal Occupation(s) During Past 5 Years | Number of Portfolios in Fund Complex Overseen2and Other Directorships Held During Past 5 Years | Experience, Qualifications, Attributes, Skills for Board Membership |
Independent Trustees − continued |
| Trustee since 2016 for
Natixis ETF Trust and
2020 for Natixis ETF
Trust II
Audit Committee
Member and
Governance
Committee Member | Founding Partner, Breton Capital Management, LLC (private equity); formerly, Partner, STEP Partners, LLC (private equity) | 51
Director, Candidly (chemicals and biofuels) | Significant experience on the Board; financial services industry and executive experience (including roles as Chief Executive Officer of client management and asset servicing for a banking and financial services company) |
| Chairperson of the
Board of Trustees since
2021
Trustee since 2016 for
Natixis ETF Trust and
2020 for Natixis ETF
Trust II
Ex Officio Member of
the Audit Committee,
Contract Review
Committee and
Governance
Committee | Retired; formerly, Professor of Finance at Babson College | | Significant experience on the Board; experience as Director of the Division of Trading and Markets at the Securities and Exchange Commission; academic experience; training as an economist |
| Trustee since 2016 for
Natixis ETF Trust and
2020 for Natixis ETF
Trust II
Contract Review
Committee Member | | | Significant experience on the Board; mutual fund industry and executive experience (including roles as President and Chief Executive Officer for an investment adviser) |
Trustee and Officer Information
| Position(s) Held with the Trusts, Length of Time Served and Term of Office1 | Principal Occupation(s) During Past 5 Years | Number of Portfolios in Fund Complex Overseen2and Other Directorships Held During Past 5 Years | Experience, Qualifications, Attributes, Skills for Board Membership |
Independent Trustees − continued |
| Trustee since 2019 for
Natixis ETF Trust and
2020 for Natixis ETF
Trust II
Audit Committee
Member and
Governance
Committee Member | Managing Director of Accordia Partners, LLC (real estate development); President of Primary Corporation (real estate development); Managing Principal of Merrick Capital Partners (infrastructure finance) | 51
Advisor/Risk Management Committee, Eastern Bank (bank); Director, Apartment Investment and Management Company (real estate investment trust); formerly, Director, Ares Commercial Real Estate Corporation (real estate investment trust) | Experience on the Board and significant experience on the boards of other business organizations (including real estate companies and banks) |
| Trustee since 2016 for
Natixis ETF Trust and
2020 for Natixis ETF
Trust II
Audit Committee
Member and
Governance
Committee Member | Retired; formerly, Deputy Dean for Finance and Administration, Yale University School of Medicine | | Significant experience on the Board; executive experience in a variety of academic organizations (including roles as dean for finance and administration) |
| | | | |
(1965)
One Financial Center
Boston, MA 02111 | Trustee since 2016 for
Natixis ETF Trust and
2020 for Natixis ETF
Trust II | President, Chief Executive Officer and Chairman of the Board of Directors, Loomis, Sayles & Company, L.P. | | Significant experience on the Board; continuing service as President, Chief Executive Officer and Chairman of the Board of Directors of Loomis, Sayles & Company, L.P. |
Trustee and Officer Information
| Position(s) Held with the Trusts, Length of Time Served and Term of Office1 | Principal Occupation(s) During Past 5 Years | Number of Portfolios in Fund Complex Overseen2and Other Directorships Held During Past 5 Years | Experience, Qualifications, Attributes, Skills for Board Membership |
Interested Trustees − continued |
| Trustee since 2015 for
Natixis ETF Trust and
2017 for Natixis ETF
Trust II
President and Chief
Executive Officer of
Natixis ETF Trust
since 2011; President
and Chief Executive
Officer of Natixis ETF
Trust II since 2017 | President and Chief Executive Officer, Natixis Advisors, LLC and Natixis Distribution, LLC | | Significant experience on the Board; experience as President and Chief Executive Officer of Natixis Advisors, LLC and Natixis Distribution, LLC |
| Each Trustee serves until retirement, resignation or removal from the Board. The current retirement age is 75. The position of Chairperson of the Board is appointed for a three-year term. |
| The Trustees of the Trusts serve as Trustees of a fund complex that includes all series of the Natixis Funds Trust I, Natixis Funds Trust II, Natixis Funds Trust IV, Gateway Trust, Loomis Sayles Funds I, Loomis Sayles Funds II, Natixis ETF Trust and Natixis ETF Trust II (collectively, the “Fund Complex”). |
| Mr. Charleston is deemed an “interested person” of the Trusts because he holds the following positions with an affiliated person of the Trusts: President, Chief Executive Officer and Chairman of the Board of Directors of Loomis, Sayles & Company, L.P. |
| Mr. Giunta is deemed an “interested person” of the Trusts because he holds the following positions with an affiliated person of the Trusts: President and Chief Executive Officer, Natixis Advisors, LLC and Natixis Distribution, LLC. |
Trustee and Officer Information
| Position(s) Held
with the Trusts | | |
| | | |
| Treasurer, Principal
Financial and
Accounting Officer | | Senior Vice President, Natixis Advisors, LLC and Natixis Distribution, LLC; formerly, Vice President, Natixis Advisors, LLC and Natixis Distribution, LLC; Assistant Treasurer of the Fund Complex |
| Secretary and Chief
Legal Officer | | Executive Vice President, General Counsel and Secretary, Natixis Advisors, LLC and Natixis Distribution, LLC; formerly, Executive Vice President and Chief Compliance Officer of Natixis Investment Managers (March 2019 – May 2022) and Senior Vice President and Head of Compliance, U.S. for Natixis Investment Managers (July 2011 – March 2019) |
| Chief Compliance
Officer, Assistant
Secretary and
Anti-Money
Laundering Officer | | Senior Vice President, Natixis Advisors, LLC and Natixis Distribution, LLC; formerly, Vice President, Head of Corporate Compliance, Global Atlantic Financial Group |
| Each officer of the Trusts serves for an indefinite term in accordance with the Trusts' current by-laws until the date his or her successor is elected and qualified, or until he or she sooner dies, retires, is removed or becomes disqualified. |
| Each person listed above, except as noted, holds the same position(s) with the Fund Complex. Previous positions during the past five years with Natixis Distribution, LLC, Natixis Advisors, LLC or Loomis, Sayles & Company, L.P. are omitted, if not materially different from an officer’s current position with such entity. |
This Page Intentionally Left Blank
This Page Intentionally Left Blank
Contact us
ALPS Distributors, Inc. is the distributor for the Natixis Loomis Sayles Short Duration Income ETF, Natixis U.S. Equity Opportunities ETF, Natixis Vaughan Nelson Mid Cap ETF and Natixis Vaughan Nelson Select ETF. Natixis Distribution, LLC is a marketing agent. ALPS Distributors, Inc. is not affiliated with Natixis Distribution, LLC.
˃To learn more about Natixis ETFs:
Visit:im.natixis.com Call800-225-5478.
Before investing, consider the fund’s investment objectives, risks, charges, and expenses. Visit im.natixis.com or call 800-225-5478 for a prospectus or summary prospectus containing this and other information.
Contact us by mail:
If you wish to communicate with the funds’ Board of Trustees, you may do so by writing to:
Secretary of the Funds
Natixis Advisors, LLC
888 Boylston Street, Suite 800
Boston, MA 02199-8197
The correspondence must (a) be signed by the shareholder; (b) include the shareholder’s name and address; and (c) identify the fund(s), account number, share class, and number of shares held in that fund, as of a recent date.
Or by e-mail:
secretaryofthefunds@natixis.com (Communications regarding recommendations for Trustee candidates may not be submitted by e-mail.)
Please note: Unlike written correspondence, e-mail is not secure. Please do NOT include your account number, Social Security number, PIN, or any other non-public personal information in an e-mail communication because this information may be viewed by others.
 Exp. 3/1/20256255503.1.1USIMV58A-1223
This page not part of shareholder report
NATIXIS ETF TRUST
NATIXIS GATEWAY QUALITY INCOME ETF
Supplement dated March 21, 2024 to the Annual Report of the Natixis Gateway Quality Income ETF, dated December 31, 2023
The information in this supplement is an amendment to the Natixis Gateway Quality Income ETF’s Annual Report dated December 31, 2023.
BOARD APPROVAL OF THE INITIAL ADVISORY AND SUB-ADVISORY AGREEMENTS FOR THE NATIXIS GATEWAY QUALITY INCOME ETF
The Investment Company Act of 1940, as amended (the “1940 Act”), requires that both the full Board of Trustees of the Trust (the “Board”) and a majority of the Trustees who are not “interested persons” (as defined in the 1940 Act) of the Trust (the “Independent Trustees”), voting separately, initially approve any new investment advisory and sub-advisory agreements for a registered investment company, including a newly formed fund such as the Natixis Gateway Quality Income ETF (the “Fund”). The Trustees, including the Independent Trustees, unanimously approved, for an initial two-year term, the proposed investment advisory and sub-advisory agreements (together, the “Agreements”) for the Fund at a meeting held on December 5-6, 2023.
In connection with this review, Fund management and other representatives of the Fund’s adviser, Natixis Advisors, LLC (the “Adviser”), and the Fund’s sub-adviser, Gateway Investment Advisers, LLC (the “Subadviser”), provided to the Trustees materials including, among other items, information regarding (i) the Fund’s investment objective, strategies and risks, (ii) the proposed advisory and sub-advisory fees and other expenses to be charged to the Fund, including information comparing the Fund’s expenses to those of peer groups and categories of funds and information on fees charged to other funds advised by the Adviser and Subadviser and the proposed expense cap, (iii) the size, education and experience of the Adviser’s and Subadviser’s respective investment staffs and the investment strategies proposed to be used in managing the Fund, (iv) proposed arrangements for the distribution and trading of the Fund’s shares, (v) information about the Adviser’s and Subadviser’s historical related performance, (vi) the Adviser’s experience sponsoring and managing ETFs, and (vii) the general economic outlook with particular emphasis on the asset management industry.
The Trustees also considered the fact that they oversee other funds advised by the Adviser and Subadviser, including other ETFs in the fund complex, as well as information about the Adviser and Subadviser they had received in connection with their oversight of those other funds. Because the Fund is newly formed and had not commenced operations at the time of the Trustees’ review, certain information, including data relating to Fund performance, was not available, and therefore could not be considered by the Trustees. Throughout the process, the Trustees were afforded the opportunity to ask questions of, and request additional materials from, the Adviser and the Subadviser. The Independent Trustees also met separately with independent legal counsel outside the presence of Adviser and Subadviser personnel.
In considering whether to initially approve the Agreements, the Board, including the Independent Trustees, did not identify any single factor as determinative. Individual Trustees may have evaluated the information presented differently from one another, giving different weights to various factors. Matters considered by the Trustees, including the Independent Trustees, in connection with their approval of the Agreements included, but were not limited to, the factors listed below.
The nature, extent and quality of the services to be provided to the Fund under the Agreements. The Trustees considered the nature, extent and quality of the services to be provided by the Adviser, the Subadviser and the Adviser’s affiliates to the Fund, which include advisory and non-advisory services directed to the needs and operations of the Fund as a fully-transparent, actively-managed ETF. The Trustees also considered the resources to be dedicated to the Fund by the Adviser, the Subadviser and the Adviser’s affiliates. The Trustees considered their experience with other funds advised or sub-advised by the Adviser and the Subadviser, including other ETFs in the fund complex, as well as the affiliation between the Adviser and Natixis Investment Managers, LLC (“Natixis Investment Managers”), whose affiliates provide investment advisory services to other funds in the same family of funds. In this regard, the Trustees considered not only the advisory and sub-advisory services proposed to be provided by the Adviser and the Subadviser to the Fund, but also the monitoring and oversight services proposed to be provided by the Adviser. They also considered the administrative and shareholder services proposed to be provided by the Adviser and its affiliates to the Fund.
After reviewing these and related factors, the Trustees concluded, within the context of their overall conclusions regarding the Agreements, that the scope of the services to be provided to the Fund under the Agreements seemed consistent with the Fund’s operational requirements, and that the Adviser and the Subadviser had the capabilities, resources and personnel necessary to provide the advisory and sub-advisory services that would be required by the Fund. The Trustees determined that the nature, extent and quality of services proposed to be provided under the Agreements supported approval of the Agreements.
Investment performance of the Fund, the Adviser and the Subadviser. Because the Fund had not yet commenced operations, performance information for the Fund was not considered; however, the Board considered the performance of other funds and accounts managed by the Adviser and the Subadviser.
The Trustees also considered the Adviser’s and the Subadviser’s performance and reputation generally, the performance of the fund family generally, and the historical responsiveness of the Adviser and Subadviser to Trustee concerns about performance and the willingness of the Adviser and Subadviser to take steps intended to improve performance.
After reviewing these and related factors, the Trustees concluded, within the context of their overall conclusions regarding the Agreements, that these relevant factors supported approval of the Agreements.
The costs of the services to be provided by the Adviser and the profits to be realized by the Adviser and its affiliates from their respective relationships with the Fund. Although the Fund had not yet commenced operations at the time of the Trustees’ review of the Agreements, the Trustees reviewed information comparing the proposed advisory and sub-advisory fees and estimated total expenses of the Fund with the fees and expenses of comparable funds included in a peer group created by a third-party, including information about how those funds were selected and information about differences in such fees. In evaluating the Fund’s proposed advisory and sub-advisory fees, the Trustees also took into account the demands, complexity and quality of the investment management services to be provided to the Fund, including the additional responsibilities of the Adviser and the Subadviser and their affiliates in managing an ETF. The Trustees also noted that the Fund would have an expense cap in place. In addition, the Trustees considered information regarding the administrative fees to be paid by the Fund to the Adviser.
Because the Fund had not yet commenced operations, historical profitability information with respect to the Fund was not considered. However, the Trustees noted the information provided in court cases in which adviser profitability was an issue, the estimated expense level of the Fund, and that the Fund would be subject to an expense cap.
After reviewing these and related factors, the Trustees concluded, within the context of their overall conclusions regarding the Agreements, that the advisory and sub-advisory fees and expenses proposed to be charged to the Fund were fair and reasonable and supported the approval of the Agreements.
Economies of scale. The Trustees considered the extent to which the Adviser and the Subadviser may realize economies of scale in the provision of services by the Adviser and the Subadviser, respectively, and whether those economies could be shared with the Fund through breakpoints in its investment advisory and sub-advisory fees or other means, such as an expense cap. The Trustees noted that the Fund will be subject to an expense cap. After reviewing these and related factors, the Trustees concluded, within the context of their overall conclusions regarding the Agreements, that the extent to which economies of scale might be shared with the Fund supported the approval of the Agreements.
The Trustees also considered other factors, which included but were not limited to the following:
| | • | | The compliance-related resources the Adviser, the Subadviser and the Adviser’s affiliates would provide to the Fund. |
| | • | | The nature, quality, cost and extent of administrative and shareholder services to be performed by the Adviser and its affiliates, both under the Agreements and under separate agreements covering administrative services. |
| | • | | So-called “fallout benefits” to the Adviser and its affiliates, such as the engagement of the Adviser to provide administrative services to the Fund, the benefits to Natixis Investment Managers and the Adviser of being able to offer an additional ETF in the Natixis family of funds, and the benefits of research made available to the Subadviser by reason of brokerage commissions generated by the Fund’s securities transactions. The Trustees considered the possible conflicts of interest associated with these fallout and other benefits, and the reporting, disclosure and other processes in place to disclose and monitor such possible conflicts of interest. |
Based on their evaluation of all factors that they deemed to be material, including those factors described above, and assisted by the advice of independent counsel, the Trustees, including the Independent Trustees, concluded that the Agreements should be approved.
(b) Not Applicable.
Item 2. Code of Ethics.
The Registrant has adopted a code of ethics that applies to the Registrant’s principal executive officer, principal financial officer and persons performing similar functions. There have been no amendments or waivers of the Registrant’s code of ethics during the period.
Item 3. Audit Committee Financial Expert.
The Board of Trustees of the Registrant has established an audit committee. Mr. Richard A. Goglia, Mr. James P. Palermo, Mr. Kirk A. Sykes and Ms. Cynthia L. Walker are members of the audit committee and have been designated as “audit committee financial experts” by the Board of Trustees. Each of these individuals is also an Independent Trustee of the Registrant.
Item 4. Principal Accountant Fees and Services.
Fees billed by the Principal Accountant for services rendered to the Registrant.
The table below sets forth fees billed by the principal accountant, PricewaterhouseCoopers LLP, for the past two fiscal years for professional services rendered in connection with a) the audit of the Registrant’s annual financial statements and services provided in connection with regulatory filings; b) audit-related services (including services that are reasonably related to the performance of the audit of the Registrant’s financial statements but not reported under “Audit Fees”); c) tax compliance, tax advice and tax planning and d) all other fees billed for professional services rendered by the principal accountant to the Registrant, other than the services reported as a part of (a) through (c) of this Item.
| | | | | | | | | | | | | | | | | | | | | | | | | | | | | | | | |
| | | Audit fees | | | Audit-related fees1 | | | Tax fees2 | | | All other fees | |
| | | 1/1/22-12/31/22 | | | 1/1/23-12/31/23 | | | 1/1/22-12/31/22 | | | 1/1/23-12/31/23 | | | 1/1/22-12/31/22 | | | 1/1/23-12/31/23 | | | 1/1/22-12/31/22 | | | 1/1/23-12/31/23 | |
Natixis ETF Trust | | $ | 36,283 | | | $ | 65,871 | | | $ | 8 | | | $ | 9 | | | $ | 8,613 | | | $ | 14,871 | | | $ | — | | | $ | — | |
| | 1. | Audit-related fees consist of: |
2022 & 2023 – performance of agreed-upon procedures related to the Registrant’s deferred compensation plan.
2022 & 2023 – review of the Registrant’s tax returns (2022 & 2023) and consulting services related to tax treatments for specific security types (2023).
Aggregate fees billed to the Registrant for non-audit services during 2022 and 2023 were $8,621 and $14,880, respectively.
Fees billed by the Principal Accountant for services rendered to the Adviser and Control Affiliates.
The following table sets forth the fees billed by the Registrant’s principal accountant for non-audit services rendered to Natixis Advisors, LLC (“Natixis Advisors”) and entities controlling, controlled by or under common control with Natixis Advisors (“Control Affiliates”) that provide ongoing services to the Registrant, for engagements that related directly to the operations and financial reporting of the Registrant for the last two fiscal years.
| | | | | | | | | | | | | | | | | | | | | | | | |
| | | Audit-related fees | | | Tax fees | | | All other fees | |
| | | 1/1/22-12/31/22 | | | 1/1/2312/31/23 | | | 1/1/22-12/31/22 | | | 1/1/23-12/31/23 | | | 1/1/22-12/31/22 | | | 1/1/23-12/31/23 | |
Control Affiliates | | $ | — | | | $ | — | | | $ | — | | | $ | — | | | $ | 50,000 | | | $ | — | |
The following table sets forth the aggregate fees billed by the Registrant’s principal accountant for non-audit services rendered to Natixis Advisors, and Control Affiliates that provide ongoing services to the Registrant, for the last two fiscal years, including the fees disclosed in the table above.
| | | | | | | | |
| | | Aggregate Non-Audit Fees | |
| | | 1/1/22-12/31/22 | | | 1/1/23-12/31/23 | |
Control Affiliates | | $ | 50,000 | | | $ | 113,500 | |
None of the services described above were approved pursuant to paragraph (c)(7)(i)(C) of Regulation S-X.
Audit Committee Pre Approval Policies.
Annually, the Registrant’s Audit Committee reviews the audit, audit-related, tax and other non-audit services together with the projected fees, for services proposed to be rendered to the Registrant and/or other entities for which pre-approval is required during the upcoming year. Any subsequent revisions to already pre-approved services or fees (including fee increases) and requests for pre-approval of new services would be presented for consideration quarterly as needed.
If, in the opinion of management, a proposed engagement by the Registrant’s independent accountants needs to commence before the next regularly scheduled Audit Committee meeting, any member of the Audit Committee who is an independent Trustee of the Registrant is authorized to pre-approve the engagement, but only for engagements to provide audit, audit related and tax services. This approval is subject to review by the full Audit Committee at its next quarterly meeting. All other engagements require the approval of all the members of the Audit Committee.
Item 5. Audit Committee of Listed Registrants.
Not applicable.
Item 6. Schedule of Investments.
Included as part of the Report to Shareholders filed as Item 1 herewith.
Item 7. Disclosure of Proxy Voting Policies and Procedures for Closed-End Management Investment Companies.
Not applicable.
Item 8. Portfolio Managers of Closed-End Management Investment Companies.
Not applicable.
Item 9. Purchases of Equity Securities by Closed-End Management Investment Companies and Affiliated Purchasers.
Not applicable.
Item 10. Submission of Matters to a Vote of Securities Holders.
There were no material changes to the procedures by which shareholders may recommend nominees to the Registrant’s Board of Trustees.
Item 11. Controls and Procedures.
The Registrant’s principal executive officer and principal financial officer have concluded that the Registrant’s disclosure controls and procedures are sufficient to ensure that information required to be disclosed by the Registrant in this Form N-CSR was recorded, processed, summarized and reported within the time periods specified in the Securities and Exchange Commission’s rules and forms, based upon such officers’ evaluation of these controls and procedures as of a date within 90 days of the filing date of the report.
There were no changes in the Registrant’s internal control over financial reporting that occurred during the period covered by the report that have materially affected, or are reasonably likely to materially affect, the Registrant’s internal control over financial reporting.
Item 12. Disclosure of Securities Lending Activities for Closed-End Management Investment Companies.
Not applicable.
Item 13. Recovery of Erroneously Awarded Compensation.
Not applicable.
Item 14. Exhibits.
SIGNATURES
Pursuant to the requirements of the Securities Exchange Act of 1934 and the Investment Company Act of 1940, the Registrant has duly caused this report to be signed on its behalf by the undersigned, thereunto duly authorized.
| | |
| Natixis ETF Trust |
| |
| By: | | /s/ David L. Giunta |
| Name: | | David L. Giunta |
| Title: | | President and Chief Executive Officer |
| Date: | | March 20, 2024 |
Pursuant to the requirements of the Securities Exchange Act of 1934 and the Investment Company Act of 1940, this report has been signed by the following persons on behalf of the Registrant and in the capacities and on the dates indicated.
| | |
| By: | | /s/ David L. Giunta |
| Name: | | David L. Giunta |
| Title: | | President and Chief Executive Officer |
| Date: | | March 20, 2024 |
| |
| By: | | /s/ Matthew Block |
| Name: | | Matthew Block |
| Title: | | Treasurer and Principal Financial and |
| | Accounting Officer |
| Date: | | March 20, 2024 |