UNITED STATES
SECURITIES AND EXCHANGE COMMISSION
Washington, D.C. 20549
FORM N-CSR
CERTIFIED SHAREHOLDER REPORT OF REGISTERED
MANAGEMENT INVESTMENT COMPANIES
Investment Company Act file number: 811-23146
Natixis ETF Trust
(Exact name of Registrant as specified in charter)
888 Boylston Street, Suite 800 Boston, Massachusetts 02199-8197
(Address of principal executive offices) (Zip code)
Susan McWhan Tobin, Esq.
Natixis Distribution, LLC
888 Boylston Street, Suite 800
Boston, Massachusetts 02199-8197
(Name and address of agent for service)
Registrant’s telephone number, including area code: (617) 449-2139
Date of fiscal year end: December 31
Date of reporting period: June 30, 2024
Item 1. Reports to Stockholders.
| | (a) | The Registrant’s Tailored Shareholder Reports transmitted to shareholders pursuant to Rule 30e-1 under the Investment Company Act of 1940 are as follows: |
Principal Listing Exchange: NYSEArca
Natixis Gateway Quality Income ETF
Semi-annual Shareholder Report - June 30, 2024
This semi-annual shareholder report contains important information about Natixis Gateway Quality Income ETF for the period of January 1, 2024 to June 30, 2024. You can find additional information (including tax information) about the Fund at im.natixis.com/funddocuments.You can also request the information by contacting us at 800-225-5478 or by contacting your financial intermediary directly.
What were the fund costs for the last six months? (based on a hypothetical $10,000 investment)
| Fund Name | Cost of a $10,000 investment | Costs paid as a percentage of a $10,000 investment |
|---|
| Natixis Gateway Quality Income ETF | $18 | 0.34% |
| Total Net Assets | $102,697,380 |
| # of Portfolio Holdings (including overnight repurchase agreements) | 110 |
| Portfolio Turnover Rate | 25% |
| Total Advisory Fees Paid | $0 |
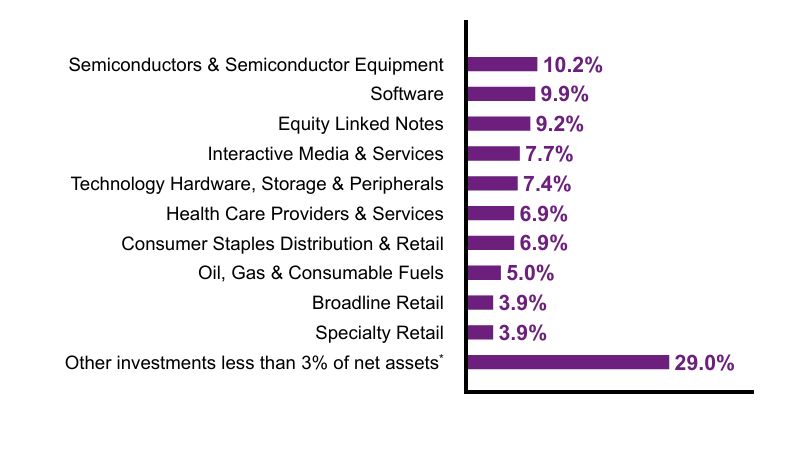
What did the Fund invest in? (% of Net Assets)
| Value | Value |
|---|
Other investments less than 3% of net assetsFootnote Reference* | 29.0% |
| Specialty Retail | 3.9% |
| Broadline Retail | 3.9% |
| Oil, Gas & Consumable Fuels | 5.0% |
| Consumer Staples Distribution & Retail | 6.9% |
| Health Care Providers & Services | 6.9% |
| Technology Hardware, Storage & Peripherals | 7.4% |
| Interactive Media & Services | 7.7% |
| Equity Linked Notes | 9.2% |
| Software | 9.9% |
| Semiconductors & Semiconductor Equipment | 10.2% |
| Footnote | Description |
Footnote* | Net of other assets less liabilities |
| Apple, Inc. | 7.4% |
| NVIDIA Corp. | 6.9% |
| Microsoft Corp. | 6.0% |
| Alphabet, Inc., Class A | 4.5% |
| Amazon.com, Inc. | 3.9% |
| Meta Platforms, Inc., Class A | 3.2% |
| Costco Wholesale Corp. | 2.1% |
| Home Depot, Inc. | 2.1% |
| BNP Paribas Issuance BV (France) | 2.0% |
| Royal Bank of Canada (Canada) | 2.0% |
There were no material fund changes during the period.
There were no changes in or disagreements with Accountants during the period.
For additional information about the Fund, including its prospectus, financial information, holdings and proxy information, scan the QR code or visit im.natixis.com/funddocuments
Phone: 800-225-5478
Email: secretaryofthefunds@natixis.com
Principal Listing Exchange: NYSEArca
Natixis Loomis Sayles Short Duration Income ETF
Semi-annual Shareholder Report - June 30, 2024
This semi-annual shareholder report contains important information about Natixis Loomis Sayles Short Duration Income ETF for the period of January 1, 2024 to June 30, 2024. You can find additional information (including tax information) about the Fund at im.natixis.com/funddocuments.You can also request the information by contacting us at 800-225-5478 or by contacting your financial intermediary directly.
What were the fund costs for the last six months? (based on a hypothetical $10,000 investment)
| Fund Name | Cost of a $10,000 investment | Costs paid as a percentage of a $10,000 investment |
|---|
| Natixis Loomis Sayles Short Duration Income ETF | $18 | 0.35% |
| Total Net Assets | $16,701,980 |
| # of Portfolio Holdings (including overnight repurchase agreements and derivatives) | 264 |
| Portfolio Turnover Rate | 112% |
| Total Advisory Fees Paid | $0 |
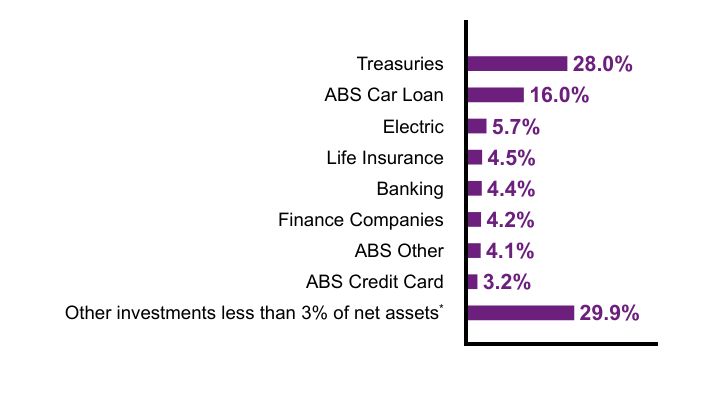
What did the Fund invest in? (% of Net Assets)
| Value | Value |
|---|
Other investments less than 3% of net assetsFootnote Reference* | 29.9% |
| ABS Credit Card | 3.2% |
| ABS Other | 4.1% |
| Finance Companies | 4.2% |
| Banking | 4.4% |
| Life Insurance | 4.5% |
| Electric | 5.7% |
| ABS Car Loan | 16.0% |
| Treasuries | 28.0% |
| Footnote | Description |
Footnote* | Net of other assets less liabilities (including futures contracts) |
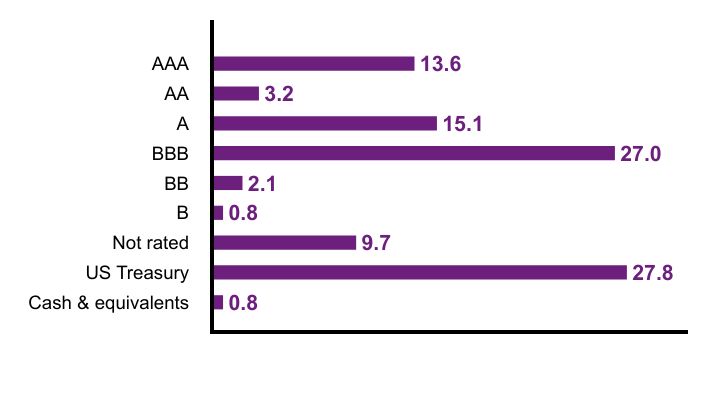
Credit QualityFootnote Reference†
| Value | Value |
|---|
| Cash & equivalents | 0.8 |
| US Treasury | 27.8 |
| Not rated | 9.7 |
| B | 0.8 |
| BB | 2.1 |
| BBB | 27.0 |
| A | 15.1 |
| AA | 3.2 |
| AAA | 13.6 |
| Footnote | Description |
Footnote† | Credit ratings are by S&P Global Ratings. A credit rating is an assessment provided by a nationally recognized statistical rating organization (NRSRO) of the creditworthiness of an issuer with respect to debt obligations except for those debt obligations that are only privately rated. Ratings are measured on a scale that generally ranges from AAA (highest) to D (lowest). The credit ratings shown relate to the creditworthiness of the issuers of the underlying securities in the Fund, and not to the Fund or its shares. Credit ratings are subject to change. |
There were no material fund changes during the period.
There were no changes in or disagreements with Accountants during the period.
For additional information about the Fund, including its prospectus, financial information, holdings and proxy information, scan the QR code or visit im.natixis.com/funddocuments
Phone: 800-225-5478
Email: secretaryofthefunds@natixis.com
Natixis Loomis Sayles Short Duration Income ETF
Semi-annual Shareholder Report
June 30, 2024
Item 2. Code of Ethics.
Not applicable.
Item 3. Audit Committee Financial Expert.
Not applicable.
Item 4. Principal Accountant Fees and Services.
Not applicable.
Item 5. Audit Committee of Listed Registrants.
Not applicable.
Item 6. Schedule of Investments.
The Schedule of Investments are incorporated by reference as part of the Financial Statements and Other Important Information for Open-End Management Investment Companies filed as Item 7 herewith.
Item 7. Financial Statements and Financial Highlights for Open-End Management Investment Companies.
The Registrant’s Financial Statements and Other Important Information are as follows:
Semi-annual Financial Statements and Other Important Information
Natixis Gateway Quality Income ETF |
Natixis Loomis Sayles Focused Growth ETF |
Natixis Loomis Sayles Short Duration Income ETF |
Natixis Vaughan Nelson Mid Cap ETF |
Natixis Vaughan Nelson Select ETF |
Portfolio of Investments – as of June 30, 2024 (Unaudited)Natixis Gateway Quality Income ETF
| | |
Common Stocks — 90.2% of Net Assets |
| Aerospace & Defense — 0.1% |
| | |
| Air Freight & Logistics — 0.8% |
| C.H. Robinson Worldwide, Inc. | |
| Expeditors International of Washington, Inc. | |
| United Parcel Service, Inc., Class B | |
| | |
| |
| | |
| |
| Monster Beverage Corp.(a) | |
| |
| | |
| Regeneron Pharmaceuticals, Inc.(a) | |
| Vertex Pharmaceuticals, Inc.(a) | |
| | |
| |
| | |
| |
| | |
| Builders FirstSource, Inc.(a) | |
| | |
| | |
| |
| MarketAxess Holdings, Inc. | |
| |
| CF Industries Holdings, Inc. | |
| LyondellBasell Industries NV, Class A | |
| | |
| Commercial Services & Supplies — 1.0% |
| | |
| | |
| | |
| Communications Equipment — 0.2% |
| | |
| Consumer Staples Distribution & Retail — 6.9% |
| | |
| | |
| | |
| | |
| Walgreens Boots Alliance, Inc. | |
| | |
| | |
| |
| | |
| Electrical Equipment — 0.2% |
| | |
| Electronic Equipment, Instruments & Components — 0.8% |
| | |
| | |
| | |
| |
| | |
| | |
| Financial Services — 2.8% |
| Mastercard, Inc., Class A | |
| | |
| | |
| |
| Archer-Daniels-Midland Co. | |
| | |
| | |
| Tyson Foods, Inc., Class A | |
| | |
| Ground Transportation — 0.9% |
| J.B. Hunt Transport Services, Inc. | |
| Old Dominion Freight Line, Inc. | |
| | |
| Health Care Equipment & Supplies — 1.1% |
| Align Technology, Inc.(a) | |
| IDEXX Laboratories, Inc.(a) | |
| | |
| Health Care Providers & Services — 6.9% |
| | |
| | |
| | |
| | |
| | |
| | |
| | |
| Molina Healthcare, Inc.(a) | |
| | |
| | |
| Hotels, Restaurants & Leisure — 2.0% |
| | |
| | |
| | |
| Household Durables — 0.5% |
| | |
| Household Products — 2.2% |
| | |
| | |
| | |
| | |
| Interactive Media & Services — 7.7% |
| | |
| Meta Platforms, Inc., Class A | |
| | |
| |
| | |
| Cognizant Technology Solutions Corp., Class A | |
| | |
| | |
| | |
| Life Sciences Tools & Services — 1.0% |
| Mettler-Toledo International, Inc.(a) | |
| West Pharmaceutical Services, Inc. | |
| | |
See accompanying notes to financial statements.
Portfolio of Investments – as of June 30, 2024 (Unaudited)Natixis Gateway Quality Income ETF (continued) | | |
| |
| | |
| Illinois Tool Works, Inc. | |
| | |
| |
| | |
| | |
| | |
| Oil, Gas & Consumable Fuels — 5.0% |
| | |
| | |
| | |
| | |
| | |
| | |
| | |
| Passenger Airlines — 0.3% |
| | |
| |
| | |
| | |
| | |
| | |
| | |
| Professional Services — 0.6% |
| | |
| | |
| | |
| | |
| Semiconductors & Semiconductor Equipment — 10.2% |
| | |
| | |
| | |
| Monolithic Power Systems, Inc. | |
| | |
| | |
| | |
| | |
| |
| | |
| Cadence Design Systems, Inc.(a) | |
| | |
| Palo Alto Networks, Inc.(a) | |
| | |
| | |
| | |
| |
| | |
| | |
| | |
| | |
| | |
| Technology Hardware, Storage & Peripherals — 7.4% |
| | |
| Textiles, Apparel & Luxury Goods — 1.3% |
| | |
| | |
| Textiles, Apparel & Luxury Goods — continued |
| Lululemon Athletica, Inc.(a) | |
| | |
| | |
| Trading Companies & Distributors — 1.5% |
| | |
| | |
| | |
| Total Common Stocks
(Identified Cost $86,085,443) | |
| | |
Equity-Linked Notes — 9.2% |
| BNP Paribas Issuance BV, (S&P 500 Index), 58.270%, 7/08/2024(b) | |
| BNP Paribas Issuance BV, (S&P 500 Index), 66.900%, 7/19/2024(b) | |
| Royal Bank of Canada, (S&P 500 Index), 69.110%, 7/26/2024(b) | |
| Royal Bank of Canada, (S&P 500 Index), 68.230%, 8/02/2024(b) | |
| UBS AG, (S&P 500 Index), 70.100%, 7/12/2024(b) | |
| Total Equity-Linked Notes
(Identified Cost $9,833,385) | |
|
|
Short-Term Investments — 0.3% |
| Tri-Party Repurchase Agreement with Fixed Income Clearing Corporation, dated 6/28/2024 at 3.500% to be repurchased at $289,759 on 7/01/2024 collateralized by $236,600 U.S. Treasury Inflation Indexed Note, 0.125% due 7/15/2026 valued at $295,706 including accrued interest (Note 2 of Notes to Financial Statements)
(Identified Cost $289,674) | |
| Total Investments — 99.7%
(Identified Cost $96,208,502) | |
| Other assets less liabilities — 0.3% | |
| | |
| See Note 2 of Notes to Financial Statements. |
| Non-income producing security. |
| All or a portion of these securities are exempt from registration under Rule 144A of the Securities Act of 1933. These securities may be resold in transactions exempt from registration, normally to qualified institutional buyers. At June 30, 2024, the value of Rule 144A holdings amounted to $9,456,023 or 9.2% of net assets. |
See accompanying notes to financial statements.
Portfolio of Investments – as of June 30, 2024 (Unaudited)Natixis Gateway Quality Income ETF (continued) Industry Summary at June 30, 2024 (Unaudited)
Semiconductors & Semiconductor Equipment | |
| |
Interactive Media & Services | |
Technology Hardware, Storage & Peripherals | |
Health Care Providers & Services | |
Consumer Staples Distribution & Retail | |
Oil, Gas & Consumable Fuels | |
| |
| |
| |
| |
| |
Hotels, Restaurants & Leisure | |
Other Investments, less than 2% each | |
| |
| |
| |
Other assets less liabilities | |
| |
See accompanying notes to financial statements.
Portfolio of Investments – as of June 30, 2024 (Unaudited)Natixis Loomis Sayles Focused Growth ETF
| | |
Common Stocks — 99.0% of Net Assets |
| Aerospace & Defense — 3.5% |
| | |
| |
| | |
| |
| Monster Beverage Corp.(a) | |
| |
| | |
| Regeneron Pharmaceuticals, Inc.(a) | |
| Vertex Pharmaceuticals, Inc.(a) | |
| | |
| |
| | |
| |
| FactSet Research Systems, Inc. | |
| |
| | |
| | |
| | |
| Financial Services — 3.7% |
| | |
| Health Care Equipment & Supplies — 2.9% |
| Intuitive Surgical, Inc.(a) | |
| Hotels, Restaurants & Leisure — 1.6% |
| | |
| Interactive Media & Services — 17.3% |
| | |
| Meta Platforms, Inc., Class A | |
| | |
| Life Sciences Tools & Services — 1.1% |
| | |
| Semiconductors & Semiconductor Equipment — 13.8% |
| | |
| |
| | |
| | |
| | |
| | |
| Workday, Inc., Class A(a) | |
| | |
| Total Common Stocks
(Identified Cost $160,001,344) | |
| | |
Short-Term Investments — 0.3% |
| Tri-Party Repurchase Agreement with Fixed Income Clearing Corporation, dated 6/28/2024 at 3.500% to be repurchased at $537,900 on 7/01/2024 collateralized by $439,100 U.S. Treasury Inflation Indexed Note, 0.125% due 7/15/2026 valued at $548,646 including accrued interest (Note 2 of Notes to Financial Statements)
(Identified Cost $537,743) | |
| Total Investments — 99.3%
(Identified Cost $160,539,087) | |
| Other assets less liabilities — 0.7% | |
| | |
| See Note 2 of Notes to Financial Statements. |
| Non-income producing security. |
Industry Summary at June 30, 2024 (Unaudited)
| |
Interactive Media & Services | |
Semiconductors & Semiconductor Equipment | |
| |
| |
| |
| |
| |
| |
| |
Health Care Equipment & Supplies | |
| |
Other Investments, less than 2% each | |
| |
| |
Other assets less liabilities | |
| |
See accompanying notes to financial statements.
Portfolio of Investments – as of June 30, 2024 (Unaudited)Natixis Loomis Sayles Short Duration Income ETF
| | |
Bonds and Notes — 99.7% of Net Assets |
| |
| American Credit Acceptance Receivables Trust, Series 2023-3, Class C, 6.440%, 10/12/2029(a) | |
| American Credit Acceptance Receivables Trust, Series 2023-4, Class B, 6.630%, 2/14/2028(a) | |
| AmeriCredit Automobile Receivables Trust, Series 2021-3, Class C, 1.410%, 8/18/2027 | |
| AmeriCredit Automobile Receivables Trust, Series 2023-1, Class B, 5.570%, 3/20/2028 | |
| AmeriCredit Automobile Receivables Trust, Series 2024-1, Class A3, 5.430%, 1/18/2029 | |
| AmeriCredit Automobile Receivables Trust , Series 2022-1, Class B, 2.770%, 4/19/2027 | |
| Avid Automobile Receivables Trust , Series 2023-1, Class A, 6.630%, 7/15/2026(a) | |
| Avis Budget Rental Car Funding AESOP LLC, Series 2024-1A, Class A, 5.360%, 6/20/2030(a) | |
| Bridgecrest Lending Auto Securitization Trust, Series 2024-2, Class A3, 5.840%, 6/15/2028 | |
| Canada Pacer Auto Receivables Trust, Series 2021-1A, Class A3, 0.500%, 10/20/2025(a) | |
| Capital One Prime Auto Receivables Trust, Series 2023-2, Class A3, 5.820%, 6/15/2028 | |
| Capital One Prime Auto Receivables Trust , Series 2023-1, Class A3, 4.870%, 2/15/2028 | |
| Carvana Auto Receivables Trust, Series 2023-P1, Class A3, 5.980%, 12/10/2027(a) | |
| Carvana Auto Receivables Trust, Series 2024-P2, Class A3, 5.330%, 7/10/2029 | |
| DT Auto Owner Trust, Series 2021-4A, Class C, 1.500%, 9/15/2027(a) | |
| DT Auto Owner Trust, Series 2022-3A, Class B, 6.740%, 7/17/2028(a) | |
| DT Auto Owner Trust, Series 2023-2A, Class B, 5.410%, 2/15/2029(a) | |
| Enterprise Fleet Financing LLC, Series 2021-2, Class A2, 0.480%, 5/20/2027(a) | |
| Exeter Automobile Receivables Trust, Series 2022-5A, Class B, 5.970%, 3/15/2027 | |
| Exeter Automobile Receivables Trust, Series 2023-5A, Class A3, 6.320%, 3/15/2027 | |
| First Investors Auto Owner Trust , Series 2022-1A, Class C, 3.130%, 5/15/2028(a) | |
| Flagship Credit Auto Trust, Series 2023-2, Class C, 5.810%, 5/15/2029(a) | |
| Flagship Credit Auto Trust , Series 2020-4, Class C, 1.280%, 2/16/2027(a) | |
| Ford Credit Auto Lease Trust , Series 2023-A, Class A3, 4.940%, 3/15/2026 | |
| Ford Credit Auto Owner Trust, Series 2021-A, Class A3, 0.300%, 8/15/2025 | |
| Ford Credit Auto Owner Trust, Series 2023-B, Class A3, 5.230%, 5/15/2028 | |
| GLS Auto Select Receivables Trust, Series 2023-2A, Class A2, 6.370%, 6/15/2028(a) | |
| GLS Auto Select Receivables Trust, Series 2024-3A, Class A2, 5.590%, 10/15/2029(a) | |
| GM Financial Consumer Automobile Receivables Trust, Series 2023-4, Class A3, 5.780%, 8/16/2028 | |
| Harley-Davidson Motorcycle Trust, Series 2023-B, Class A3, 5.690%, 8/15/2028 | |
| | |
| |
| Harley-Davidson Motorcycle Trust, Series 2023-B, Class A4, 5.780%, 4/15/2031 | |
| Huntington Auto Trust, Series 2024-1A, Class A3, 5.230%, 1/16/2029(a) | |
| Hyundai Auto Receivables Trust, Series 2023-C, Class A3, 5.540%, 10/16/2028 | |
| Hyundai Auto Receivables Trust, Series 2024-A, Class A3, 4.990%, 2/15/2029 | |
| LAD Auto Receivables Trust, Series 2023-4A, Class B, 6.390%, 10/16/2028(a) | |
| LAD Auto Receivables Trust, Series 2024-1A, Class A3, 5.230%, 1/18/2028(a) | |
| Nissan Auto Receivables Owner Trust, Series 2024-A, Class A3, 5.280%, 12/15/2028 | |
| Prestige Auto Receivables Trust, Series 2023-1A, Class C, 5.650%, 2/15/2028(a) | |
| Santander Drive Auto Receivables Trust, Series 2023-3, Class C, 5.770%, 11/15/2030 | |
| Santander Drive Auto Receivables Trust, Series 2023-4, Class B, 5.770%, 12/15/2028 | |
| Santander Drive Auto Receivables Trust, Series 2023-5, Class B, 6.160%, 12/17/2029 | |
| SBNA Auto Receivables Trust, Series 2024-A, Class A3, 5.320%, 12/15/2028(a) | |
| SFS Auto Receivables Securitization Trust, Series 2023-1A, Class A3, 5.470%, 10/20/2028(a) | |
| SFS Auto Receivables Securitization Trust, Series 2024-2A, Class A3, 5.330%, 11/20/2029(a) | |
| Toyota Auto Receivables Owner Trust, Series 2021-C, Class A3, 0.430%, 1/15/2026 | |
| Toyota Lease Owner Trust, Series 2023-A, Class A3, 4.930%, 4/20/2026(a) | |
| VStrong Auto Receivables Trust, Series 2023-A, Class A3, 6.870%, 11/15/2027(a) | |
| VStrong Auto Receivables Trust, Series 2024-A, Class B, 5.770%, 7/15/2030(a) | |
| Westlake Automobile Receivables Trust, Series 2023-3A, Class C, 6.020%, 9/15/2028(a) | |
| Westlake Automobile Receivables Trust, Series 2024-2A, Class A3, 5.560%, 2/15/2028(a) | |
| World Omni Auto Receivables Trust, Series 2023-D, Class A3, 5.790%, 2/15/2029 | |
| | |
| |
| Brex Commercial Charge Card Master Trust, Series 2024-1, Class A1, 6.050%, 7/15/2027(a) | |
| Capital One Multi-Asset Execution Trust, Series 2021-A1, Class A1, 0.550%, 7/15/2026 | |
| Synchrony Card Funding LLC, Series 2023-A2, Class A, 5.740%, 10/15/2029 | |
| World Financial Network Credit Card Master Trust, Series 2023-A, Class A, 5.020%, 3/15/2030 | |
| | |
| |
| Chesapeake Funding II LLC, Series 2023-1A, Class A1, 5.650%, 5/15/2035(a) | |
| Dell Equipment Finance Trust, Series 2023-3, Class A3, 5.930%, 4/23/2029(a) | |
| HPEFS Equipment Trust , Series 2023-1A, Class A3, 5.410%, 2/22/2028(a) | |
See accompanying notes to financial statements.
Portfolio of Investments – as of June 30, 2024 (Unaudited)Natixis Loomis Sayles Short Duration Income ETF (continued) | | |
| |
| Marlette Funding Trust, Series 2023-2A, Class A, 6.040%, 6/15/2033(a) | |
| SCF Equipment Leasing LLC, Series 2022-1A, Class A3, 2.920%, 7/20/2029(a) | |
| Verizon Master Trust, Series 2024-4, Class A1A, 5.210%, 6/20/2029 | |
| Wheels Fleet Lease Funding 1 LLC, Series 2023-1A, Class A, 5.800%, 4/18/2038(a) | |
| | |
| |
| Navient Private Education Refi Loan Trust, Series 2021-EA, Class A, 0.970%, 12/16/2069(a) | |
| Aerospace & Defense — 0.9% |
| Boeing Co., 4.875%, 5/01/2025 | |
| Boeing Co., 6.298%, 5/01/2029(a) | |
| Bombardier, Inc., 7.250%, 7/01/2031(a) | |
| Huntington Ingalls Industries, Inc., 3.844%, 5/01/2025 | |
| RTX Corp., 5.750%, 11/08/2026 | |
| | |
| Agency Commercial Mortgage-Backed Securities — 0.1% |
| Federal Home Loan Mortgage Corp. Multifamily Structured Pass-Through Certificates, Series KF81, Class AL, 30 day USD SOFR Average + 0.474%, 5.799%, 6/25/2027(b) | |
| Federal Home Loan Mortgage Corp. Multifamily Structured Pass-Through Certificates, Series KF81, Class AS, 30 day USD SOFR Average + 0.400%, 5.724%, 6/25/2027(b) | |
| | |
| |
| Southwest Airlines Co., 5.250%, 5/04/2025 | |
| United Airlines, Inc., 4.375%, 4/15/2026(a) | |
| | |
| |
| General Motors Financial Co., Inc., 5.550%, 7/15/2029 | |
| General Motors Financial Co., Inc., 5.600%, 6/18/2031 | |
| General Motors Financial Co., Inc., 6.050%, 10/10/2025 | |
| Harley-Davidson Financial Services, Inc., 5.950%, 6/11/2029(a) | |
| Harley-Davidson Financial Services, Inc., 6.500%, 3/10/2028(a) | |
| Hyundai Capital America, 5.300%, 6/24/2029(a) | |
| Hyundai Capital America, 5.950%, 9/21/2026(a) | |
| PACCAR Financial Corp., 5.000%, 5/13/2027 | |
| Toyota Motor Credit Corp., MTN, 5.000%, 8/14/2026 | |
| Toyota Motor Credit Corp., 5.050%, 5/16/2029 | |
| | |
| |
| Ally Financial, Inc., 7.100%, 11/15/2027 | |
| Bank of America Corp., MTN, (fixed rate to 4/02/2025, variable rate thereafter), 3.384%, 4/02/2026 | |
| Bank of Montreal, 5.511%, 6/04/2031 | |
| Bank of Nova Scotia, GMTN, 5.450%, 8/01/2029 | |
| Canadian Imperial Bank of Commerce, 5.237%, 6/28/2027 | |
| Capital One Financial Corp., (fixed rate to 10/29/2026, variable rate thereafter), 7.149%, 10/29/2027 | |
| | |
| |
| Comerica, Inc., (fixed rate to 1/30/2029, variable rate thereafter), 5.982%, 1/30/2030 | |
| Goldman Sachs Bank USA, (fixed rate to 3/18/2026, variable rate thereafter), 5.283%, 3/18/2027 | |
| Goldman Sachs Bank USA, (fixed rate to 5/21/2026, variable rate thereafter), 5.414%, 5/21/2027 | |
| Huntington Bancshares, Inc., (fixed rate to 8/21/2028, variable rate thereafter), 6.208%, 8/21/2029 | |
| PNC Financial Services Group, Inc., (fixed rate to 5/14/2029, variable rate thereafter), 5.492%, 5/14/2030 | |
| Royal Bank of Canada, GMTN, 5.200%, 7/20/2026 | |
| Santander Holdings USA, Inc., (fixed rate to 5/31/2034, variable rate thereafter), 6.342%, 5/31/2035 | |
| State Street Corp., 4.993%, 3/18/2027 | |
| Synchrony Financial, 4.875%, 6/13/2025 | |
| Wells Fargo & Co., MTN, (fixed rate to 4/25/2025, variable rate thereafter), 3.908%, 4/25/2026 | |
| Wells Fargo & Co., MTN, (fixed rate to 4/22/2027, variable rate thereafter), 5.707%, 4/22/2028 | |
| | |
| |
| Brookfield Finance, Inc., 5.675%, 1/15/2035 | |
| Cantor Fitzgerald LP, 7.200%, 12/12/2028(a) | |
| Jefferies Financial Group, Inc., 5.875%, 7/21/2028 | |
| | |
| Building Materials — 0.2% |
| Builders FirstSource, Inc., 6.375%, 3/01/2034(a) | |
| |
| Charter Communications Operating LLC/Charter Communications Operating Capital, 6.100%, 6/01/2029 | |
| |
| Celanese U.S. Holdings LLC, 6.165%, 7/15/2027 | |
| EIDP, Inc., 4.500%, 5/15/2026 | |
| Nutrien Ltd., 5.400%, 6/21/2034 | |
| Nutrien Ltd., 5.900%, 11/07/2024 | |
| | |
| Collateralized Mortgage Obligations — 0.4% |
| Government National Mortgage Association, Series 2012-H28, Class FA, 1 mo. USD SOFR + 0.694%, 6.017%, 9/20/2062(b)(c) | |
| Government National Mortgage Association, Series 2013-H04, Class BA, 1.650%, 2/20/2063(c) | |
| Government National Mortgage Association, Series 2013-H11, Class JA, 3.500%, 4/20/2063(c) | |
| Government National Mortgage Association, Series 2016-H13, Class FT, 1 mo. USD SOFR + 0.694%, 6.017%, 5/20/2066(b)(c) | |
| Government National Mortgage Association, Series 2019-H01, Class FT, 1 mo. USD SOFR + 0.514%, 5.837%, 10/20/2068(b) | |
| Government National Mortgage Association, Series 2019-H05, Class FT, 1 yr. CMT + 0.430%, 5.610%, 4/20/2069(b) | |
See accompanying notes to financial statements.
Portfolio of Investments – as of June 30, 2024 (Unaudited)Natixis Loomis Sayles Short Duration Income ETF (continued) | | |
| Collateralized Mortgage Obligations — continued |
| Government National Mortgage Association, Series 2019-H13, Class FT, 1 yr. CMT + 0.450%, 5.630%, 8/20/2069(b) | |
| Government National Mortgage Association, Series 2020-H01, Class FT, 1 yr. CMT + 0.500%, 5.680%, 1/20/2070(b) | |
| | |
| Construction Machinery — 1.0% |
| Caterpillar Financial Services Corp., 5.000%, 5/14/2027 | |
| CNH Industrial Capital LLC, 5.450%, 10/14/2025 | |
| John Deere Capital Corp., MTN, 4.850%, 6/11/2029 | |
| | |
| Consumer Cyclical Services — 0.4% |
| Expedia Group, Inc., 6.250%, 5/01/2025(a) | |
| |
| Hasbro, Inc., 6.050%, 5/14/2034 | |
| Diversified Manufacturing — 0.3% |
| Ingersoll Rand, Inc., 5.176%, 6/15/2029 | |
| |
| AES Corp., 3.300%, 7/15/2025(a) | |
| Alliant Energy Finance LLC, 5.400%, 6/06/2027(a) | |
| Ameren Corp., 5.700%, 12/01/2026 | |
| American Electric Power Co., Inc., 5.699%, 8/15/2025 | |
| CenterPoint Energy, Inc., 5.250%, 8/10/2026 | |
| Dominion Energy, Inc., 3.071%, 8/15/2024 | |
| DTE Energy Co., 4.220%, 11/01/2024 | |
| Duke Energy Corp., 4.850%, 1/05/2027 | |
| Duke Energy Corp., 5.450%, 6/15/2034 | |
| Edison International, 4.700%, 8/15/2025 | |
| Florida Power & Light Co., 5.150%, 6/15/2029 | |
| Georgia Power Co., 5.004%, 2/23/2027 | |
| ITC Holdings Corp., 4.950%, 9/22/2027(a) | |
| National Rural Utilities Cooperative Finance Corp., MTN, 5.100%, 5/06/2027 | |
| National Rural Utilities Cooperative Finance Corp., MTN, 5.600%, 11/13/2026 | |
| NextEra Energy Capital Holdings, Inc., 5.749%, 9/01/2025 | |
| Puget Sound Energy, Inc., 5.330%, 6/15/2034 | |
| Vistra Operations Co. LLC, 5.125%, 5/13/2025(a) | |
| WEC Energy Group, Inc., 5.600%, 9/12/2026 | |
| | |
| |
| Waste Management, Inc., 4.950%, 7/03/2027 | |
| |
| Air Lease Corp., 0.800%, 8/18/2024 | |
| Air Lease Corp., MTN, 5.200%, 7/15/2031 | |
| Aircastle Ltd., 2.850%, 1/26/2028(a) | |
| Aircastle Ltd., 5.950%, 2/15/2029(a) | |
| Aircastle Ltd., 6.500%, 7/18/2028(a) | |
| Ares Capital Corp., 3.250%, 7/15/2025 | |
| Ares Capital Corp., 5.950%, 7/15/2029 | |
| Ares Capital Corp., 7.000%, 1/15/2027 | |
| Ares Strategic Income Fund, 6.350%, 8/15/2029(a) | |
| Aviation Capital Group LLC, 5.375%, 7/15/2029(a) | |
| Avolon Holdings Funding Ltd., 5.500%, 1/15/2026(a) | |
| Bain Capital Specialty Finance, Inc., 2.550%, 10/13/2026 | |
| | |
| Finance Companies — continued |
| Blackstone Secured Lending Fund, 5.875%, 11/15/2027 | |
| Blue Owl Capital Corp., 3.750%, 7/22/2025 | |
| Blue Owl Capital Corp. II, 8.450%, 11/15/2026(a) | |
| Blue Owl Credit Income Corp., 7.950%, 6/13/2028 | |
| Blue Owl Technology Finance Corp. II, 6.750%, 4/04/2029(a) | |
| FS KKR Capital Corp., 6.875%, 8/15/2029 | |
| GATX Corp., 5.400%, 3/15/2027 | |
| Goldman Sachs BDC, Inc., 6.375%, 3/11/2027 | |
| Golub Capital BDC, Inc., 2.500%, 8/24/2026 | |
| HPS Corporate Lending Fund, 6.250%, 9/30/2029(a) | |
| Main Street Capital Corp., 3.000%, 7/14/2026 | |
| Main Street Capital Corp., 6.500%, 6/04/2027 | |
| Navient Corp., 11.500%, 3/15/2031 | |
| New Mountain Finance Corp., 6.875%, 2/01/2029 | |
| PennyMac Financial Services, Inc., 7.125%, 11/15/2030(a) | |
| Sixth Street Lending Partners, 6.500%, 3/11/2029(a) | |
| Sixth Street Specialty Lending, Inc., 6.125%, 3/01/2029 | |
| | |
| |
| Campbell Soup Co., 5.200%, 3/19/2027 | |
| Conagra Brands, Inc., 5.300%, 10/01/2026 | |
| General Mills, Inc., 4.700%, 1/30/2027 | |
| | |
| |
| GLP Capital LP/GLP Financing II, Inc., 5.250%, 6/01/2025 | |
| Government Owned - No Guarantee — 1.2% |
| NBN Co. Ltd., 0.875%, 10/08/2024(a) | |
| |
| Health Care Service Corp. A Mutual Legal Reserve Co., 5.200%, 6/15/2029(a) | |
| UnitedHealth Group, Inc., 5.150%, 10/15/2025 | |
| | |
| |
| IQVIA, Inc., 6.250%, 2/01/2029 | |
| Smith & Nephew PLC, 5.150%, 3/20/2027 | |
| Solventum Corp., 5.450%, 2/25/2027(a) | |
| | |
| |
| Forestar Group, Inc., 3.850%, 5/15/2026(a) | |
| Independent Energy — 0.8% |
| Crescent Energy Finance LLC, 7.375%, 1/15/2033(a) | |
| Crescent Energy Finance LLC, 9.250%, 2/15/2028(a) | |
| Pioneer Natural Resources Co., 5.100%, 3/29/2026 | |
| Sitio Royalties Operating Partnership LP/Sitio Finance Corp., 7.875%, 11/01/2028(a) | |
| | |
| |
| Athene Global Funding, 5.620%, 5/08/2026(a) | |
| Brighthouse Financial Global Funding, 1.750%, 1/13/2025(a) | |
| CNO Global Funding, 5.875%, 6/04/2027(a) | |
| Corebridge Global Funding, 5.750%, 7/02/2026(a) | |
| F&G Annuities & Life, Inc., 6.500%, 6/04/2029 | |
See accompanying notes to financial statements.
Portfolio of Investments – as of June 30, 2024 (Unaudited)Natixis Loomis Sayles Short Duration Income ETF (continued) | | |
| Life Insurance — continued |
| F&G Global Funding, 5.875%, 6/10/2027(a) | |
| MetLife, Inc., 5.300%, 12/15/2034 | |
| Mutual of Omaha Cos Global Funding, 5.350%, 4/09/2027(a) | |
| New York Life Global Funding, 4.900%, 4/02/2027(a) | |
| New York Life Global Funding, 5.000%, 6/06/2029(a) | |
| Northwestern Mutual Global Funding, 5.070%, 3/25/2027(a) | |
| Reinsurance Group of America, Inc., 5.750%, 9/15/2034 | |
| RGA Global Funding, 5.448%, 5/24/2029(a) | |
| | |
| |
| Choice Hotels International, Inc., 5.850%, 8/01/2034 | |
| Hyatt Hotels Corp., 5.250%, 6/30/2029 | |
| Hyatt Hotels Corp., 5.750%, 1/30/2027 | |
| | |
| Media Entertainment — 0.5% |
| Take-Two Interactive Software, Inc., 5.400%, 6/12/2029 | |
| Warnermedia Holdings, Inc., 3.755%, 3/15/2027 | |
| | |
| |
| ArcelorMittal SA, 6.000%, 6/17/2034 | |
| Mineral Resources Ltd., 9.250%, 10/01/2028(a) | |
| Nucor Corp., 3.950%, 5/23/2025 | |
| Steel Dynamics, Inc., 5.375%, 8/15/2034 | |
| | |
| |
| Energy Transfer LP, 5.250%, 7/01/2029 | |
| Kinetik Holdings LP, 6.625%, 12/15/2028(a) | |
| TransCanada PipeLines Ltd., SOFR Index + 1.520%, 6.891%, 3/09/2026(b) | |
| Williams Cos., Inc., 5.400%, 3/02/2026 | |
| | |
| |
| CenterPoint Energy Resources Corp., 5.400%, 7/01/2034 | |
| NiSource, Inc., 5.200%, 7/01/2029 | |
| Sempra, 5.400%, 8/01/2026 | |
| Spire, Inc., 5.300%, 3/01/2026 | |
| | |
| Non-Agency Commercial Mortgage-Backed Securities — 2.0% |
| Bank, Series 2023-5YR3, Class A3, 6.724%, 9/15/2056(b) | |
| Bank, Series 2023-5YR4, Class A3, 6.500%, 12/15/2056 | |
| BBCMS Mortgage Trust, Series 2024-5C25, Class A3, 5.946%, 3/15/2057 | |
| Benchmark Mortgage Trust, Series 2023-V2, Class A3, 5.812%, 5/15/2055(b) | |
| Credit Suisse Mortgage Trust, Series 2014-USA, Class A2, 3.953%, 9/15/2037(a) | |
| MSBAM Commercial Mortgage Securities Trust, Series 2012-CKSV, Class A2, 3.277%, 10/15/2030(a) | |
| | |
| |
| Hudson Pacific Properties LP, 5.950%, 2/15/2028 | |
| | |
| Oil Field Services — 0.5% |
| Schlumberger Holdings Corp., 5.000%, 11/15/2029(a) | |
| |
| Public Storage Operating Co., SOFR Index + 0.700%, 6.056%, 4/16/2027(b) | |
| Starwood Property Trust, Inc., 3.750%, 12/31/2024(a) | |
| | |
| |
| Amcor Flexibles North America, Inc., 4.000%, 5/17/2025 | |
| Berry Global, Inc., 5.800%, 6/15/2031(a) | |
| Sonoco Products Co., 1.800%, 2/01/2025 | |
| | |
| |
| Royalty Pharma PLC, 5.150%, 9/02/2029 | |
| Property & Casualty Insurance — 1.1% |
| Allstate Corp., 5.050%, 6/24/2029 | |
| AmWINS Group, Inc., 6.375%, 2/15/2029(a) | |
| Enact Holdings, Inc., 6.250%, 5/28/2029 | |
| Essent Group Ltd., 6.250%, 7/01/2029 | |
| NMI Holdings, Inc., 6.000%, 8/15/2029 | |
| Radian Group, Inc., 6.200%, 5/15/2029 | |
| SiriusPoint Ltd., 7.000%, 4/05/2029 | |
| | |
| |
| Agree LP, 5.625%, 6/15/2034 | |
| |
| Advance Auto Parts, Inc., 5.900%, 3/09/2026 | |
| AutoZone, Inc., 5.050%, 7/15/2026 | |
| AutoZone, Inc., 5.100%, 7/15/2029 | |
| Lowe's Cos., Inc., 4.400%, 9/08/2025 | |
| O'Reilly Automotive, Inc., 5.750%, 11/20/2026 | |
| Tapestry, Inc., 7.350%, 11/27/2028 | |
| | |
| |
| Dell International LLC/EMC Corp., 5.850%, 7/15/2025 | |
| Flex Ltd., 6.000%, 1/15/2028 | |
| Global Payments, Inc., 1.500%, 11/15/2024 | |
| NXP BV/NXP Funding LLC/NXP USA, Inc., 3.150%, 5/01/2027 | |
| PayPal Holdings, Inc., 5.150%, 6/01/2034 | |
| Zebra Technologies Corp., 6.500%, 6/01/2032(a) | |
| | |
| |
| Altria Group, Inc., 6.200%, 11/01/2028 | |
| Transportation Services — 0.5% |
| Element Fleet Management Corp., 5.643%, 3/13/2027(a) | |
| Penske Truck Leasing Co. LP/PTL Finance Corp., 5.250%, 7/01/2029(a) | |
| | |
| |
| U.S. Treasury Notes, 3.875%, 4/30/2025 | |
| U.S. Treasury Notes, 4.625%, 6/30/2025(d) | |
| U.S. Treasury Notes, 4.625%, 6/30/2026 | |
| U.S. Treasury Notes, 4.750%, 7/31/2025 | |
See accompanying notes to financial statements.
Portfolio of Investments – as of June 30, 2024 (Unaudited)Natixis Loomis Sayles Short Duration Income ETF (continued) | | |
| |
| U.S. Treasury Notes, 4.875%, 4/30/2026 | |
| U.S. Treasury Notes, 4.875%, 5/31/2026 | |
| | |
| |
| Verizon Communications, Inc., 3.000%, 3/22/2027 | |
| Total Bonds and Notes
(Identified Cost $16,725,676) | |
|
|
Short-Term Investments — 1.5% |
| Tri-Party Repurchase Agreement with Fixed Income Clearing Corporation, dated 6/28/2024 at 3.500% to be repurchased at $254,953 on 7/01/2024 collateralized by $272,200 U.S. Treasury Note, 1.875% due 6/30/2026 valued at $260,019 including accrued interest (Note 2 of Notes to Financial Statements)
(Identified Cost $254,878) | |
| Total Investments — 101.2%
(Identified Cost $16,980,554) | |
| Other assets less liabilities — (1.2)% | |
| | |
| See Note 2 of Notes to Financial Statements. |
| All or a portion of these securities are exempt from registration under Rule 144A of the Securities Act of 1933. These securities may be resold in transactions exempt from registration, normally to qualified institutional buyers. At June 30, 2024, the value of Rule 144A holdings amounted to $4,784,083 or 28.6% of net assets. |
| Variable rate security. Rate as of June 30, 2024 is disclosed. Issuers comprised of various lots with differing coupon rates have been aggregated for the purpose of presentation in the Portfolio of Investments and show a weighted average rate. Certain variable rate securities are not based on a published reference rate and spread, rather are determined by the issuer or agent and are based on current market conditions. These securities may not indicate a reference rate and/or spread in their description. |
| Level 3 security. Value has been determined using significant unobservable inputs. See Note 3 of Notes to Financial Statements. |
| Security (or a portion thereof) has been pledged as collateral for open derivative contracts. |
| |
| Constant Maturity Treasury |
| |
| |
| Real Estate Investment Trusts |
| Secured Overnight Financing Rate |
At June 30, 2024, open long futures contracts were as follows:
| | | | | Unrealized
Appreciation
(Depreciation) |
CBOT 2 Year U.S. Treasury Notes Futures | | | | | |
At June 30, 2024, open short futures contracts were as follows:
| | | | | Unrealized
Appreciation
(Depreciation) |
CBOT 10 Year U.S. Treasury Notes Futures | | | | | |
Ultra 10-Year U.S. Treasury Notes Futures | | | | | |
| | | | | |
Industry Summary at June 30, 2024 (Unaudited)
| |
| |
| |
| |
| |
| |
| |
| |
| |
Non-Agency Commercial Mortgage-Backed Securities | |
| |
Other Investments, less than 2% each | |
| |
| |
Other assets less liabilities (including futures contracts) | |
| |
See accompanying notes to financial statements.
Portfolio of Investments – as of June 30, 2024 (Unaudited)Natixis Vaughan Nelson Mid Cap ETF
| | |
Common Stocks — 99.3% of Net Assets |
| Aerospace & Defense — 2.4% |
| | |
| |
| | |
| | |
| | |
| | |
| |
| | |
| | |
| | |
| Builders FirstSource, Inc.(a) | |
| | |
| |
| ARES Management Corp., Class A | |
| | |
| | |
| Raymond James Financial, Inc. | |
| | |
| |
| | |
| Communications Equipment — 1.1% |
| | |
| Construction Materials — 2.6% |
| | |
| Consumer Staples Distribution & Retail — 1.7% |
| Performance Food Group Co.(a) | |
| Containers & Packaging — 0.5% |
| | |
| Electrical Equipment — 4.8% |
| | |
| | |
| | |
| | |
| | |
| Electronic Equipment, Instruments & Components — 1.7% |
| | |
| Energy Equipment & Services — 1.5% |
| | |
| Financial Services — 2.2% |
| Apollo Global Management, Inc. | |
| Ground Transportation — 4.7% |
| | |
| | |
| | |
| Health Care Providers & Services — 1.5% |
| | |
| Hotels, Restaurants & Leisure — 7.6% |
| | |
| DoorDash, Inc., Class A(a) | |
| Royal Caribbean Cruises Ltd.(a) | |
| | |
| Independent Power & Renewable Electricity Producers — 0.7% |
| | |
| | |
| |
| EastGroup Properties, Inc. | |
| |
| | |
| | |
| Reinsurance Group of America, Inc. | |
| | |
| Life Sciences Tools & Services — 7.3% |
| Agilent Technologies, Inc. | |
| | |
| | |
| | |
| | |
| |
| | |
| | |
| | |
| | |
| |
| | |
| Oil, Gas & Consumable Fuels — 4.3% |
| | |
| | |
| | |
| | |
| Professional Services — 2.8% |
| CACI International, Inc., Class A(a) | |
| | |
| | |
| Semiconductors & Semiconductor Equipment — 8.0% |
| | |
| Monolithic Power Systems, Inc. | |
| ON Semiconductor Corp.(a) | |
| | |
| |
| Tyler Technologies, Inc.(a) | |
| |
| Extra Space Storage, Inc. | |
| |
| | |
| | |
| Floor & Decor Holdings, Inc., Class A(a) | |
| | |
| Textiles, Apparel & Luxury Goods — 1.3% |
| Skechers USA, Inc., Class A(a) | |
| Trading Companies & Distributors — 1.2% |
| SiteOne Landscape Supply, Inc.(a) | |
| Total Common Stocks
(Identified Cost $3,677,345) | |
See accompanying notes to financial statements.
Portfolio of Investments – as of June 30, 2024 (Unaudited)Natixis Vaughan Nelson Mid Cap ETF (continued)
| | |
Short-Term Investments — 1.8% |
| Tri-Party Repurchase Agreement with Fixed Income Clearing Corporation, dated 6/28/2024 at 3.500% to be repurchased at $73,529 on 7/01/2024 collateralized by $80,500 U.S. Treasury Note, 0.875% due 6/30/2026 valued at $75,028 including accrued interest (Note 2 of Notes to Financial Statements)
(Identified Cost $73,507) | |
| Total Investments — 101.1%
(Identified Cost $3,750,852) | |
| Other assets less liabilities — (1.1)% | |
| | |
| See Note 2 of Notes to Financial Statements. |
| Non-income producing security. |
| Real Estate Investment Trusts |
Industry Summary at June 30, 2024 (Unaudited)
Semiconductors & Semiconductor Equipment | |
Hotels, Restaurants & Leisure | |
Life Sciences Tools & Services | |
| |
| |
| |
| |
Oil, Gas & Consumable Fuels | |
| |
| |
| |
| |
| |
| |
| |
| |
| |
| |
| |
| |
| |
Other Investments, less than 2% each | |
| |
| |
Other assets less liabilities | |
| |
See accompanying notes to financial statements.
Portfolio of Investments – as of June 30, 2024 (Unaudited)Natixis Vaughan Nelson Select ETF
| | |
Common Stocks — 97.6% of Net Assets |
| |
| | |
| |
| Coca-Cola Consolidated, Inc. | |
| |
| | |
| |
| Intercontinental Exchange, Inc. | |
| |
| | |
| | |
| | |
| |
| | |
| Financial Services — 3.7% |
| Berkshire Hathaway, Inc., Class B(a) | |
| Ground Transportation — 5.3% |
| | |
| | |
| | |
| Health Care Equipment & Supplies — 3.5% |
| | |
| Hotels, Restaurants & Leisure — 1.9% |
| DoorDash, Inc., Class A(a) | |
| |
| Kinsale Capital Group, Inc. | |
| Interactive Media & Services — 6.3% |
| | |
| Life Sciences Tools & Services — 3.0% |
| | |
| Oil, Gas & Consumable Fuels — 4.2% |
| Antero Resources Corp.(a) | |
| | |
| | |
| Personal Care Products — 2.3% |
| Estee Lauder Cos., Inc., Class A | |
| |
| | |
| Semiconductors & Semiconductor Equipment — 16.5% |
| Monolithic Power Systems, Inc. | |
| | |
| ON Semiconductor Corp.(a) | |
| | |
| |
| | |
| | |
| | |
| | |
| | |
| |
| O'Reilly Automotive, Inc.(a) | |
| Total Common Stocks
(Identified Cost $26,574,127) | |
| | |
Short-Term Investments — 3.1% |
| Tri-Party Repurchase Agreement with Fixed Income Clearing Corporation, dated 6/28/2024 at 3.500% to be repurchased at $1,023,499 on 7/01/2024 collateralized by $1,092,700 U.S. Treasury Note, 1.875% due 6/30/2026 valued at $1,043,764 including accrued interest (Note 2 of Notes to Financial Statements)
(Identified Cost $1,023,201) | |
| Total Investments — 100.7%
(Identified Cost $27,597,328) | |
| Other assets less liabilities — (0.7)% | |
| | |
| See Note 2 of Notes to Financial Statements. |
| Non-income producing security. |
Industry Summary at June 30, 2024 (Unaudited)
Semiconductors & Semiconductor Equipment | |
| |
Interactive Media & Services | |
| |
| |
| |
| |
| |
Oil, Gas & Consumable Fuels | |
| |
| |
| |
| |
Health Care Equipment & Supplies | |
| |
Life Sciences Tools & Services | |
| |
Other Investments, less than 2% each | |
| |
| |
Other assets less liabilities | |
| |
See accompanying notes to financial statements.
Statements of Assets and Liabilities
June 30, 2024 (Unaudited)
| Natixis
Gateway
Quality
Income
ETF | Natixis
Loomis
Sayles
Focused
Growth
ETF | Natixis
Loomis
Sayles Short
Duration Income
ETF | Natixis
Vaughan
Nelson
Mid Cap
ETF | Natixis
Vaughan
Nelson
Select
ETF |
| | | | | |
| | | | | |
Net unrealized appreciation (depreciation) | | | | | |
| | | | | |
| | | | | |
Receivable from investment adviser (Note 6) | | | | | |
Receivable for securities sold | | | | | |
Dividends and interest receivable | | | | | |
Receivable for variation margin on futures contracts (Note 2) | | | | | |
| | | | | |
| | | | | |
| | | | | |
Payable for securities purchased | | | | | |
Management fees payable (Note 6) | | | | | |
Deferred Trustees’ fees (Note 6) | | | | | |
Administrative fees payable (Note 6) | | | | | |
Audit and tax services fees payable | | | | | |
Other accounts payable and accrued expenses | | | | | |
| | | | | |
COMMITMENTS AND CONTINGENCIES(a) | | | | | |
| | | | | |
| | | | | |
| | | | | |
Accumulated earnings (loss) | | | | | |
| | | | | |
COMPUTATION OF NET ASSET VALUE AND OFFERING PRICE: | | | | | |
| | | | | |
Shares of beneficial interest | | | | | |
Net asset value, offering and redemption price per share | | | | | |
| As disclosed in the Notes to Financial Statements, if applicable. |
See accompanying notes to financial statements.
For the Six Months Ended June 30, 2024 (Unaudited)
| Natixis
Gateway
Quality
Income
ETF | Natixis
Loomis
Sayles
Focused
Growth
ETF | Natixis
Loomis
Sayles Short
Duration Income
ETF | Natixis
Vaughan
Nelson
Mid Cap
ETF | Natixis
Vaughan
Nelson
Select
ETF |
| | | | | |
| | | | | |
| | | | | |
Less net foreign taxes withheld | | | | | |
| | | | | |
| | | | | |
| | | | | |
Administrative fees (Note 6) | | | | | |
Trustees' fees and expenses (Note 6) | | | | | |
Transfer agent fees and expenses (Notes 6 and 7) | | | | | |
Audit and tax services fees | | | | | |
Custodian fees and expenses (Note 7) | | | | | |
| | | | | |
| | | | | |
Regulatory filing fees (Note 7) | | | | | |
Shareholder reporting expenses (Note 7) | | | | | |
| | | | | |
| | | | | |
Less waiver and/or expense reimbursement (Note 6) | | | | | |
| | | | | |
Net investment income (loss) | | | | | |
Net realized and unrealized gain (loss) on Investments and Futures contracts | | | | | |
Net realized gain (loss) on: | | | | | |
| | | | | |
| | | | | |
Net change in unrealized appreciation (depreciation) on: | | | | | |
| | | | | |
| | | | | |
Net realized and unrealized gain (loss) on Investments and Futures contracts | | | | | |
NET INCREASE IN NET ASSETS RESULTING FROM OPERATIONS | | | | | |
See accompanying notes to financial statements.
Statements of Changes in Net Assets
| Natixis Gateway
Quality Income ETF | Natixis Loomis Sayles
Focused Growth ETF |
| Six Months Ended
June 30,2024
(Unaudited) | Period Ended
December 31,2023(a) | Six Months Ended
June 30,2024
(Unaudited) | Period Ended
December 31,2023(b) |
| | | | |
Net investment income (loss) | | | | |
Net realized gain (loss) on investments | | | | |
Net change in unrealized appreciation on investments | | | | |
Net increase in net assets resulting from operations | | | | |
FROM DISTRIBUTIONS TO SHAREHOLDERS: | | | | |
| | | | |
NET INCREASE IN NET ASSETS
FROM CAPITAL SHARES TRANSACTIONS
(Note 10) | | | | |
Net increase in net assets | | | | |
| | | | |
| | | | |
| | | | |
| From commencement of operations on December 12, 2023 through December 31, 2023. |
| From commencement of operations on June 28, 2023 through December 31, 2023. |
See accompanying notes to financial statements.
Statements of Changes in Net Assets (continued)
| Natixis Loomis Sayles Short
Duration Income ETF | Natixis Vaughan Nelson Mid
Cap ETF |
| Six Months Ended
June 30,2024
(Unaudited) | Year Ended
December 31,2023 | Six Months Ended
June 30,2024
(Unaudited) | Year Ended
December 31,2023 |
| | | | |
| | | | |
Net realized gain (loss) on investments and futures contracts | | | | |
Net change in unrealized appreciation (depreciation) on investments and futures contracts | | | | |
Net increase in net assets resulting from operations | | | | |
FROM DISTRIBUTIONS TO SHAREHOLDERS: | | | | |
| | | | |
NET INCREASE (DECREASE) IN NET ASSETS
FROM CAPITAL SHARES TRANSACTIONS
(Note 10) | | | | |
Net increase (decrease) in net assets | | | | |
| | | | |
| | | | |
| | | | |
See accompanying notes to financial statements.
Statements of Changes in Net Assets (continued)
| Natixis Vaughan Nelson
Select ETF |
| Six Months Ended
June 30,2024
(Unaudited) | Year Ended
December 31,2023 |
| | |
Net investment income (loss) | | |
Net realized gain on investments | | |
Net change in unrealized appreciation on investments | | |
Net increase in net assets resulting from operations | | |
FROM DISTRIBUTIONS TO SHAREHOLDERS: | | |
| | |
NET INCREASE (DECREASE) IN NET ASSETS
FROM CAPITAL SHARES TRANSACTIONS
(Note 10) | | |
Net increase in net assets | | |
| | |
| | |
| | |
See accompanying notes to financial statements.
For a share outstanding throughout each period.
| Natixis Gateway Quality Income ETF |
| Six Months
Ended
June 30,
2024
(Unaudited) | |
Net asset value, beginning of the period | | |
INCOME (LOSS) FROM INVESTMENT OPERATIONS: | | |
| | |
Net realized and unrealized gain | | |
Total from Investment Operations | | |
| | |
| | |
Net asset value, end of the period | | |
| | |
RATIOS TO AVERAGE NET ASSETS: | | |
Net assets, end of the period (000's) | | |
| | |
| | |
| | |
Portfolio turnover rate(g) | | |
| From commencement of operations on December 12, 2023 through December 31, 2023. |
| Per share net investment income has been calculated using the average shares outstanding during the period. |
| Includes a non-recurring dividend. Without this dividend, net investment income per share would have been $0.13, total return would have been 1.91% and the ratio of net investment income to average net assets would have been 4.92%. |
| Total return is calculated at net asset value assuming reinvestment of dividends and capital gains, if any. Had certain expenses not been waived/reimbursed during the period, total returns would have been lower. |
| Periods less than one year are not annualized. |
| The investment adviser agreed to waive its fees and/or reimburse a portion of the Fund’s expenses during the period. Without this waiver/reimbursement, expenses would have been higher. |
| Computed on an annualized basis for periods less than one year. |
| Portfolio turnover rate excludes securities received or delivered from in–kind processing of creations or redemptions. |
See accompanying notes to financial statements.
Financial Highlights (continued)
For a share outstanding throughout each period.
| Natixis Loomis Sayles Focused Growth ETF |
| Six Months
Ended
June 30,
2024
(Unaudited) | |
Net asset value, beginning of the period | | |
INCOME (LOSS) FROM INVESTMENT OPERATIONS: | | |
| | |
Net realized and unrealized gain | | |
Total from Investment Operations | | |
| | |
Net realized capital gains | | |
Net asset value, end of the period | | |
| | |
RATIOS TO AVERAGE NET ASSETS: | | |
Net assets, end of the period (000's) | | |
| | |
| | |
| | |
Portfolio turnover rate(f) | | |
| From commencement of operations on June 28, 2023 through December 31, 2023. |
| Per share net investment loss has been calculated using the average shares outstanding during the period. |
| Total return is calculated at net asset value assuming reinvestment of dividends and capital gains, if any. Had certain expenses not been waived/reimbursed during the period, total returns would have been lower. |
| Periods less than one year are not annualized. |
| The investment adviser agreed to waive its fees and/or reimburse a portion of the Fund’s expenses during the period. Without this waiver/reimbursement, expenses would have been higher. |
| Computed on an annualized basis for periods less than one year. |
| Portfolio turnover rate excludes securities received or delivered from in–kind processing of creations or redemptions. |
See accompanying notes to financial statements.
Financial Highlights (continued)
For a share outstanding throughout each period.
| Natixis Loomis Sayles Short Duration Income ETF |
| Six Months
Ended
June 30,
2024
(Unaudited) | Year Ended
December 31,
2023 | Year Ended
December 31,
2022 | Year Ended
December 31,
2021 | Year Ended
December 31,
2020 | Year Ended
December 31,
2019 |
Net asset value, beginning of the period | | | | | | |
INCOME (LOSS) FROM INVESTMENT OPERATIONS: | | | | | | |
| | | | | | |
Net realized and unrealized gain (loss) | | | | | | |
Total from Investment Operations | | | | | | |
| | | | | | |
| | | | | | |
Net realized capital gains | | | | | | |
| | | | | | |
Net asset value, end of the period | | | | | | |
| | | | | | |
RATIOS TO AVERAGE NET ASSETS: | | | | | | |
Net assets, end of the period (000's) | | | | | | |
| | | | | | |
| | | | | | |
| | | | | | |
Portfolio turnover rate(i) | | | | | | |
| Per share net investment income has been calculated using the average shares outstanding during the period. |
| Amount rounds to less than $0.01. |
| Total return is calculated at net asset value assuming reinvestment of dividends and capital gains, if any. Had certain expenses not been waived/reimbursed during the period, total returns would have been lower. |
| Periods less than one year are not annualized. |
| Amount rounds to less than 0.01%. |
| The investment adviser agreed to waive its fees and/or reimburse a portion of the Fund’s expenses during the period. Without this waiver/reimbursement, expenses would have been higher. |
| Computed on an annualized basis for periods less than one year. |
| Effective July 1, 2023, the expense limit decreased from 0.38% to 0.35%. |
| Portfolio turnover rate excludes securities received or delivered from in–kind processing of creations or redemptions. |
See accompanying notes to financial statements.
Financial Highlights (continued)
For a share outstanding throughout each period.
| Natixis Vaughan Nelson Mid Cap ETF |
| Six Months
Ended
June 30,
2024
(Unaudited) | Year Ended
December 31,
2023 | Year Ended
December 31,
2022 | Year Ended
December 31,
2021 | |
Net asset value, beginning of the period | | | | | |
INCOME (LOSS) FROM INVESTMENT OPERATIONS: | | | | | |
| | | | | |
Net realized and unrealized gain (loss) | | | | | |
Total from Investment Operations | | | | | |
| | | | | |
| | | | | |
Net realized capital gains | | | | | |
| | | | | |
Net asset value, end of the period | | | | | |
| | | | | |
RATIOS TO AVERAGE NET ASSETS: | | | | | |
Net assets, end of the period (000's) | | | | | |
| | | | | |
| | | | | |
| | | | | |
Portfolio turnover rate(g) | | | | | |
| From commencement of operations on September 16, 2020 through December 31, 2020. |
| Per share net investment income has been calculated using the average shares outstanding during the period. |
| Total return is calculated at net asset value assuming reinvestment of dividends and capital gains, if any. Had certain expenses not been waived/reimbursed during the period, total returns would have been lower. |
| Periods less than one year are not annualized. |
| The investment adviser agreed to waive its fees and/or reimburse a portion of the Fund’s expenses during the period. Without this waiver/reimbursement, expenses would have been higher. |
| Computed on an annualized basis for periods less than one year. |
| Effective July 1, 2021, the expense limit decreased from 0.90% to 0.85%. |
| Portfolio turnover rate excludes securities received or delivered from in–kind processing of creations or redemptions. |
See accompanying notes to financial statements.
Financial Highlights (continued)
For a share outstanding throughout each period.
| Natixis Vaughan Nelson Select ETF |
| Six Months
Ended
June 30,
2024
(Unaudited) | Year Ended
December 31,
2023 | Year Ended
December 31,
2022 | Year Ended
December 31,
2021 | |
Net asset value, beginning of the period | | | | | |
INCOME (LOSS) FROM INVESTMENT OPERATIONS: | | | | | |
Net investment income (loss)(a) | | | | | |
Net realized and unrealized gain (loss) | | | | | |
Total from Investment Operations | | | | | |
| | | | | |
| | | | | |
Net realized capital gains | | | | | |
| | | | | |
Net asset value, end of the period | | | | | |
| | | | | |
RATIOS TO AVERAGE NET ASSETS: | | | | | |
Net assets, end of the period (000's) | | | | | |
| | | | | |
| | | | | |
Net investment income (loss) | | | | | |
Portfolio turnover rate(i) | | | | | |
| From commencement of operations on September 16, 2020 through December 31, 2020. |
| Per share net investment income (loss) has been calculated using the average shares outstanding during the period. |
| Includes a non-recurring dividend. Without this dividend, net investment income per share would have been $0.02, total return would have been 38.99% and the ratio of net investment income to average net assets would have been 0.07%. |
| Amount rounds to less than $0.01 per share. |
| Total return is calculated at net asset value assuming reinvestment of dividends and capital gains, if any. Had certain expenses not been waived/reimbursed during the period, total returns would have been lower. |
| Periods less than one year are not annualized. |
| The investment adviser agreed to waive its fees and/or reimburse a portion of the Fund’s expenses during the period. Without this waiver/reimbursement, expenses would have been higher. |
| Computed on an annualized basis for periods less than one year. |
| Effective July 1, 2021, the expense limit decreased from 0.85% to 0.80%. |
| Portfolio turnover rate excludes securities received or delivered from in–kind processing of creations or redemptions. |
See accompanying notes to financial statements.
Notes to Financial Statements
June 30, 2024 (Unaudited)
1.Organization. Natixis ETF Trust and Natixis ETF Trust II (the “Trusts” and each a “Trust”) are each organized as a Massachusetts business trust. Each Trust is registered under the Investment Company Act of 1940, as amended (the “1940 Act”), as an open-end management investment company. Each Declaration of Trust permits the Board of Trustees to authorize the issuance of an unlimited number of shares of beneficial interest of the Funds. Shares of the Funds are listed for trading on the NYSE Arca, Inc. (the “NYSE Arca”) and traded on other exchanges. The following funds (individually, a “Fund” and collectively, the “Funds”) are included in this report:
Natixis Gateway Quality Income ETF ("Quality Income ETF")
Natixis Loomis Sayles Short Duration Income ETF (“Short Duration Income ETF”)
Natixis Loomis Sayles Focused Growth ETF (“Focused Growth ETF”)
Natixis Vaughan Nelson Mid Cap ETF (“Mid Cap ETF”)
Natixis Vaughan Nelson Select ETF (“Select ETF”)
Each Fund is a diversified investment company, except for Focused Growth ETF and Select ETF, which are non-diversified investment companies.
Unlike traditional ETFs that provide daily disclosure of their portfolio holdings, Focused Growth ETF does not disclose the daily holdings of the actual portfolio. Instead, the Fund discloses a portfolio that is designed to reflect the economic exposure and risk characteristics of the actual portfolio on any given trading day (the “Proxy Portfolio”). Although the Proxy Portfolio is intended to provide Authorized Participants and other market participants with enough information to allow them to engage in effective arbitrage transactions that will keep the market price of the Funds’ shares trading at or close to the underlying net asset value (“NAV”) per share of the Fund, while at the same time enabling them to establish cost-effective hedging strategies to reduce risk, there is a risk that market prices will vary significantly from the underlying NAV of the Funds.
The Funds issue and redeem shares on a continuous basis through ALPS Distributors, Inc. (“ALPS”). Each Fund may pay ALPS, an unaffiliated distributor, fees under a plan adopted pursuant to Rule 12b-1 under the 1940 Act (the “12b-1 Plan”). Currently, no Rule 12b-1
fees are charged. Future payments may be made under the 12b-1 Plan without further shareholder approval.
Most expenses can be directly attributed to a Fund. Expenses which cannot be directly attributed to a Fund are generally apportioned based on the relative net assets of each of the Funds in Natixis Funds Trust I, Natixis Funds Trust II, Natixis Funds Trust IV and Gateway
Trust (“Natixis Funds Trusts”), Loomis Sayles Funds I and Loomis Sayles Funds II (“Loomis Sayles Funds Trusts”) and the Trusts.
2.Significant Accounting Policies. The following is a summary of significant accounting policies consistently followed by each Fund in the preparation of its financial statements. The Funds' financial statements follow the accounting and reporting guidelines provided for investment companies and are prepared in accordance with accounting principles generally accepted in the United States of America which require the use of management estimates that affect the reported amounts and disclosures in the financial statements. Actual results could differ from those estimates. Management has evaluated the events and transactions subsequent to period-end through the date the financial statements were issued and has determined that there were no material events that would require disclosure in the Funds' financial statements.
a. Valuation. Registered investment companies are required to value portfolio investments using an unadjusted, readily available market quotation. Each Fund obtains readily available market quotations from independent pricing services. Fund investments for which readily available market quotations are not available are priced at fair value pursuant to the Funds’ Valuation Procedures. The Board of Trustees has approved a valuation designee who is subject to the Board’s oversight.
Unadjusted readily available market quotations that are utilized for exchange traded equity securities (including shares of closed-end investment companies and exchange-traded funds) include the last sale price quoted on the exchange where the security is traded most extensively. Futures contracts are valued at the closing settlement price on the exchange on which the valuation designee believes that, over time, they are traded most extensively. Shares of open-end investment companies are valued at NAV per share.
Exchange traded equity securities for which there is no reported sale during the day are fair valued at the closing bid quotation as reported by an independent pricing service. Unlisted equity securities (except unlisted preferred equity securities) are fair valued at the last sale price quoted in the market where they are traded most extensively or, if there is no reported sale during the day, the closing bid quotation as reported by an independent pricing service. If there is no last sale price or closing bid quotation available, unlisted equity securities will be fair valued using evaluated bids furnished by an independent pricing service, if available.
Notes to Financial Statements (continued)
June 30, 2024 (Unaudited)
Debt securities and unlisted preferred equity securities are fair valued based on evaluated bids furnished to the Fund by an independent pricing service or bid prices obtained from broker-dealers. Equity-linked notes are fair valued by the counterparty. Broker-dealer bid prices may be used to fair value debt and unlisted equities where an independent pricing service is unable to price an investment or where an independent pricing service does not provide a reliable price for the investment.
The Fund may also fair value investments in other circumstances such as when extraordinary events occur after the close of a foreign market, but prior to the close of the New York Stock Exchange. This may include situations relating to a single issuer (such as a declaration of bankruptcy or a delisting of the issuer’s security from the primary market on which it has traded) as well as events affecting the securities markets in general (such as market disruptions or closings and significant fluctuations in U.S. and/or foreign markets). When fair valuing a Fund’s investments, the valuation designee may, among other things, use modeling tools or other processes that may take into account factors such as issuer specific information, or other related market activity and/or information that occurred after the close of the foreign market but before the time the Fund’s NAV is calculated. Fair valuation by the Fund(s) valuation designee may require subjective determinations about the value of the investment, and fair values used to determine a Fund’s NAV may differ from quoted or published prices, or from prices that are used by others, for the same investments. In addition, the use of fair value pricing may not always result in adjustments to the prices of investments held by a Fund.
b. Investment Transactions and Related Investment Income. Investment transactions are accounted for on a trade date plus one day basis for daily NAV calculation. However, for financial reporting purposes, investment transactions are reported on trade date. Dividend income (including income reinvested) and foreign withholding tax, if applicable, are recorded on the ex-dividend date, or in the case of certain foreign securities, as soon as a Fund is notified, and interest income is recorded on an accrual basis. Dividends reinvested and stock dividends are reflected as non-cash dividends on the Statements of Operations. Interest income is increased by the accretion of discount and decreased by the amortization of premium, if applicable. For securities with pay down provisions, principal payments received are treated as a proportionate reduction to the cost basis of the securities, and excess or shortfall amounts are recorded as income. Distributions received from investments in securities that represent a return of capital or capital gain are recorded as a reduction of cost of investments or as a realized gain, respectively. In determining net gain or loss on securities sold, the cost of securities has been determined on an identified cost basis.
c. Foreign Currency Translation. The books and records of the Funds are maintained in U.S. dollars. The values of securities, currencies and other assets and liabilities denominated in currencies other than U.S. dollars, if any, are translated into U.S. dollars
based upon the World Market or “WM11” foreign exchange rates supplied by an independent pricing service. Purchases and sales of investment securities, income and expenses are translated into U.S. dollars on the respective dates of such transactions.
Net realized foreign exchange gains or losses arise from sales of foreign currency, changes in exchange rates between the trade and settlement dates on securities transactions and the difference between the amounts of dividends, interest and foreign withholding
taxes recorded in the Funds’ books and records and the U.S. dollar equivalent of the amounts actually received or paid. Net unrealized foreign exchange gains or losses arise from changes in the value of assets and liabilities, other than investment securities, as of the
end of the fiscal period, resulting from changes in exchange rates. Net realized foreign exchange gains or losses and the net change in unrealized foreign exchange gains or losses are disclosed in the Statements of Operations. For federal income tax purposes, net
realized foreign exchange gains or losses are characterized as ordinary income and may, if the Funds have net losses, reduce the amount of income available to be distributed by the Funds.
The values of investment securities are presented at the foreign exchange rates prevailing at the end of the period for financial reporting purposes. Net realized and unrealized gains or losses on investments reported in the Statements of Operations reflect gains
or losses resulting from changes in exchange rates and fluctuations which arise due to changes in market prices of investment securities.
The Funds may use foreign currency exchange contracts to facilitate transactions in foreign-denominated investments. Losses may arise from changes in the value of the foreign currency or if the counterparties do not perform under the contracts’ terms.
d. Futures Contracts. A Fund may enter into futures contracts. Futures contracts are agreements between two parties to buy and sell a particular instrument or index for a specified price on a specified future date.
When a Fund enters into a futures contract, it is required to deposit with (or for the benefit of) its broker an amount of cash or short-term high-quality securities as “initial margin.” As the value of the contract changes, the value of the futures contract position increases or declines. Subsequent payments, known as “variation margin,” are made or received by a Fund, depending on the price fluctuations in the fair value of the contract and the value of cash or securities on deposit with the broker. The aggregate principal amounts of the contracts are not recorded in the financial statements. Daily fluctuations in the value of the contracts are recorded in the Statements of Assets and Liabilities as a receivable (payable) and in the Statements of Operations as unrealized appreciation (depreciation) until the contracts are closed, when they are recorded as realized gains (losses). Realized gain or loss on a futures
Notes to Financial Statements (continued)
June 30, 2024 (Unaudited)
position is equal to the difference between the value of the contract at the time it was opened and the value at the time it was closed, minus brokerage commissions. When a Fund enters into a futures contract certain risks may arise, such as illiquidity in the futures market, which may limit a Fund’s ability to close out a futures contract prior to settlement date, and unanticipated movements in the value of securities or interest rates. Futures contracts outstanding at the end of the period, if any, are listed in each applicable Fund’s Portfolio of Investments.
Futures contracts are exchange-traded. Exchange-traded futures contracts are standardized and are settled through a clearing house with fulfillment supported by the credit of the exchange. Therefore, counterparty credit risks to the Funds are reduced; however, in the event that a counterparty enters into bankruptcy, a Fund’s claim against initial/variation margin on deposit with the counterparty may be subject to terms of a final settlement in bankruptcy court.
e. Federal and Foreign Income Taxes. The Trusts treat each Fund as a separate entity for federal income tax purposes. Each Fund intends to meet the requirements of the Internal Revenue Code of 1986 ("IRC"), as amended, applicable to regulated investment companies, and to distribute to its shareholders substantially all of its net investment income and any net realized capital gains at least annually. Management has performed an analysis of each Fund’s tax positions for the open tax years as of June 30, 2024 and has concluded that no provisions for income tax are required. The Funds' federal tax returns for the prior three fiscal years, where applicable, remain subject to examination by the Internal Revenue Service. Management is not aware of any events that are reasonably possible to occur in the next six months that would result in the amounts of any unrecognized tax benefits significantly increasing or decreasing for the Funds. However, management’s conclusions regarding tax positions taken may be subject to review and adjustment at a later date based on factors including, but not limited to, new tax laws and accounting regulations and interpretations thereof.
A Fund may be subject to foreign withholding taxes on investment income and taxes on capital gains on investments that are accrued and paid based upon the Fund’s understanding of the tax rules and regulations that exist in the countries in which the Fund invests. Foreign withholding taxes on dividend and interest income are reflected on the Statements of Operations as a reduction of investment income, net of amounts that have been or are expected to be reclaimed and paid. Dividends and interest receivable on the Statements of Assets and Liabilities are net of foreign withholding taxes. Foreign withholding taxes where reclaims have been or are expected to be filed and paid are reflected on the Statements of Assets and Liabilities as tax reclaims receivable. Capital gains taxes paid are included in net realized gain (loss) on investments in the Statements of Operations. Accrued but unpaid capital gains taxes are reflected as foreign taxes payable on the Statements of Assets and Liabilities, if applicable, and reduce unrealized gains on investments. In the event that realized gains on investments are subsequently offset by realized losses, taxes paid on realized gains may be returned to a Fund. Such amounts, if applicable, are reflected as foreign tax rebates receivable on the Statements of Assets and Liabilities and are recorded as a realized gain when received.
f. Dividends and Distributions to Shareholders. Dividends and distributions are recorded on the ex-dividend date. The timing and characterization of certain income and capital gain distributions are determined in accordance with federal tax regulations, which may differ from accounting principles generally accepted in the United States of America. Permanent differences are primarily due to differing treatments for book and tax purposes of items such as premium amortization, distributions in excess of income and/or capital gain, return of capital distributions received, capital gain distribution received, redemptions in-kind, deferred Trustees' fees, futures contract mark-to-market, non-deductible expenses, net operating losses and paydown gains and losses. Permanent book and tax basis differences relating to shareholder distributions, net investment income and net realized gains will result in reclassifications to capital accounts reported on the Statements of Assets and Liabilities. Temporary differences between book and tax distributable earnings are primarily due to deferred Trustees’ fees, futures contract mark-to-market, return of capital distributions received, premium amortization, straddle loss deferral adjustments, capital gain distribution received, paydown gains and losses, net operating losses and wash sales. Amounts of income and capital gain available to be distributed on a tax basis are determined annually, and at other times during the Funds’ fiscal year as may be necessary to avoid knowingly declaring and paying a return of capital distribution. Distributions from net investment income and net realized short-term capital gains are reported as distributed from ordinary income for tax purposes.
Notes to Financial Statements (continued)
June 30, 2024 (Unaudited)
The tax characterization of distributions is determined on an annual basis. The tax character of distributions paid to shareholders during the year ended December 31, 2023 was as follows:
| |
| | | |
| | | |
| | | |
Short Duration Income ETF | | | |
| | | |
| | | |
Distributions paid to shareholders from net investment income and net realized capital gains, based on accounting principles generally accepted in the United States of America, are consolidated and reported on the Statements of Changes in Net Assets as Distributions to Shareholders. Distributions paid to shareholders from net investment income and net realized capital gains expressed in per-share amounts, based on accounting principles generally accepted in the United States of America, are separately stated and reported within the Financial Highlights.
As of December 31, 2023, capital loss carryforwards were as follows:
| | | | | |
Capital loss carryforward: | | | | | |
| | | | | |
| | | | | |
| | | | | |
| | | | | |
Total capital loss carryforward* | | | | | |
| Under Section 382 of the Internal Revenue Service Code, a portion of the capital loss carryforward for Short Duration Income ETF and Select ETF is subject to certain limitations upon availability, to offset future capital gains, if any. |
As of June 30, 2024, the tax cost of investments (including derivatives, if applicable) and unrealized appreciation (depreciation) on a federal tax basis were as follows:
| | | | | |
| | | | | |
| | | | | |
| | | | | |
Net tax appreciation (depreciation) | | | | | |
Amounts in the table above exclude certain adjustments that will be made at the end of the Fund’s fiscal year for tax purposes. Adjustments may include, but are not limited to, wash sales and derivatives mark-to-market.
g. Equity-Linked Notes. Quality Income ETF may invest in equity-linked notes (“ELNs”). ELNs are hybrid instruments which combine both debt and equity characteristics into a single note form. ELN values are linked to the performance of an underlying index. ELNs are unsecured debt obligations of an issuer and may not be publicly listed or traded on an exchange. ELNs have a coupon which is accrued and recorded as interest income on the Fund's Statement of Operations. The risk of investing in ELNs depends on the principal protection offered. Some ELNs may guarantee total principal or partial principal while others may not provide any guarantee of principal. The maturity value may also be impacted to the extent of any limit on the return value as part of the note structure. ELNs are subject to counterparty credit risk in that issuers and/or counterparties may fail to make payments when due or default completely, which could result in a loss of all or part of the Fund’s investment. ELNs outstanding at the end of the period, if any, are listed in the Fund's Portfolio of Investments.
Notes to Financial Statements (continued)
June 30, 2024 (Unaudited)
h. Repurchase Agreements. Each Fund may enter into repurchase agreements, under the terms of a Master Repurchase Agreement, under which each Fund acquires securities as collateral and agrees to resell the securities at an agreed upon time and at an agreed upon price. It is each Fund’s policy that the market value of the collateral for repurchase agreements be at least equal to 102% of the repurchase price, including interest. Certain repurchase agreements are tri-party arrangements whereby the collateral is held in a segregated account for the benefit of the Fund and on behalf of the counterparty. Repurchase agreements could involve certain risks in the event of default or insolvency of the counterparty including possible delays or restrictions upon the Fund’s ability to dispose of the underlying securities. As of June 30, 2024, each Fund, as applicable, had investments in repurchase agreements for which the value of the related collateral exceeded the value of the repurchase agreement. The gross value of repurchase agreements is included in the Statements of Assets and Liabilities for financial reporting purposes.
i. Indemnifications. Under the Trusts’ organizational documents, their officers and Trustees are indemnified against certain liabilities arising out of the performance of their duties to the Funds. Additionally, in the normal course of business, the Funds enter into contracts with service providers that contain general indemnification clauses. The Funds' maximum exposure under these arrangements is unknown as this would involve future claims that may be made against the Funds that have not yet occurred. However, based on experience, the Funds expect the risk of loss to be remote.
3.Fair Value Measurements In accordance with accounting standards related to fair value measurements and disclosures, the Funds have categorized the inputs utilized in determining the value of each Fund’s assets or liabilities. These inputs are summarized in the three broad levels listed below:
• Level 1 — quoted prices in active markets for identical assets or liabilities;
• Level 2 — prices determined using other significant inputs that are observable either directly, or indirectly through corroboration with observable market data (which could include quoted prices for similar assets or liabilities, interest rates, credit risk, etc.); and
• Level 3 — prices determined using significant unobservable inputs when quoted prices or observable inputs are unavailable such as when there is little or no market activity for an asset or liability (unobservable inputs reflect each Fund’s own assumptions in determining the fair value of assets or liabilities and would be based on the best information available).
The inputs or methodology used for valuing securities are not necessarily an indication of the risk associated with investing in those securities.
The Funds' pricing policies have been approved by the Board of Trustees. Investments for which market quotations are readily available are categorized in Level 1. Other investments for which an independent pricing service is utilized are categorized in Level 2. Broker-dealer bid prices for which the Funds have knowledge of the inputs used by the broker-dealer are categorized in Level 2. All other investments, including broker-dealer bid prices for which the Funds do not have knowledge of the inputs used by the broker-dealer, as well as investments fair valued by the valuation designee, are categorized in Level 3. All Level 2 and 3 securities are defined as being fair valued.
Under certain conditions and based upon specific facts and circumstances, the Fund’s valuation designee may determine that a fair valuation should be made for portfolio investment(s). These valuation designee fair valuations will be based upon a significant amount of Level 3 inputs.
The following is a summary of the inputs used to value the Funds' investments as of June 30, 2024, at value:
| Details of the major categories of the Fund’s investments are reflected within the Portfolio of Investments. |
Notes to Financial Statements (continued)
June 30, 2024 (Unaudited)
| Details of the major categories of the Fund’s investments are reflected within the Portfolio of Investments. |
Short Duration Income ETF |
|
| | | | |
| | | | |
Collateralized Mortgage Obligations | | | | |
All Other Bonds and Notes(a) | | | | |
| | | | |
| | | | |
| | | | |
Futures Contracts (unrealized appreciation) | | | | |
| | | | |
|
Liability Valuation Inputs |
| | | | |
Futures Contracts (unrealized depreciation) | | | | |
| Details of the major categories of the Fund’s investments are reflected within the Portfolio of Investments. |
| Details of the major categories of the Fund’s investments are reflected within the Portfolio of Investments. |
| Details of the major categories of the Fund’s investments are reflected within the Portfolio of Investments. |
Notes to Financial Statements (continued)
June 30, 2024 (Unaudited)
The following is a reconciliation of Level 3 investments for which significant unobservable inputs were used to determine fair value as of December 31, 2023 and/or June 30, 2024:
Short Duration Income ETF |
|
| Balance as of
December 31,
2023 | Accrued
Discounts
(Premiums) | | Change in
Unrealized
Appreciation
(Depreciation) | | | | | Balance as of
June 30,
2024 | Change in
Unrealized
Appreciation
(Depreciation)
from
Investments
Still Held at
June 30,
2024 |
| | | | | | | | | | |
Collateralized Mortgage Obligations | | | | | | | | | | |
4.Derivatives. Derivative instruments are defined as financial instruments whose value and performance are based on the value and performance of an underlying asset, reference rate or index. Derivative instruments that Short Duration Income ETF used during the period include futures contracts.
The Fund is subject to the risk that changes in interest rates will affect the value of the Fund’s investments in fixed-income securities. The Fund will be subject to increased interest rate risk to the extent that it invests in fixed-income securities with longer maturities or durations, as compared to investing in fixed-income securities with shorter maturities or durations. The Fund may use futures contracts to hedge against changes in interest rates and to manage duration without having to buy or sell portfolio securities. During the six months ended June 30, 2024, Short Duration Income ETF used futures contracts to manage duration.
The following is a summary of derivative instruments for Short Duration Income ETF as of June 30, 2024, as reflected within the Statements of Assets and Liabilities:
| Unrealized
appreciation
on futures
|
Exchange-traded asset derivatives | |
| |
| Unrealized
depreciation
on futures
|
Exchange-traded liability derivatives | |
| |
| Represents cumulative unrealized appreciation (depreciation) on futures contracts. Only the current day’s variation margin on futures contracts is reported within the Statements of Assets and Liabilities as receivable or payable for variation margin, as applicable. |
Transactions in derivative instruments for Short Duration Income ETF during the six months ended June 30, 2024, as reflected within the Statements of Operations were as follows:
Net Realized Gain (Loss) on: | |
| |
Notes to Financial Statements (continued)
June 30, 2024 (Unaudited)
Net Change in Unrealized
Appreciation (Depreciation) on: | |
| |
As the Fund values its derivatives at fair value and recognizes changes in fair value through the Statement of Operations, it does not qualify for hedge accounting under authoritative guidance for derivative instruments. The Fund’s investments in derivatives may represent an economic hedge; however, they are considered to be non-hedge transactions for the purpose of these disclosures.
The volume of futures contract activity as a percentage of net assets, based on month-end notional amounts outstanding during the period, including long and short positions at absolute value, was as follows for the six months ended June 30, 2024:
Short Duration Income ETF | |
Average Notional Amount Outstanding | |
Highest Notional Amount Outstanding | |
Lowest Notional Amount Outstanding | |
Notional Amount Outstanding as of June 30, 2024 | |
Notional amounts outstanding at the end of the prior period, if applicable, are included in the average notional amount outstanding.
Unrealized gain and/or loss on open futures contracts is recorded in the Statements of Assets and Liabilities. The aggregate notional values of futures contracts are not recorded in the Statements of Assets and Liabilities, and therefore are not included in the Fund’s net assets.
Counterparty risk is managed based on policies and procedures established by the Fund’s adviser. Such policies and procedures may include, but are not limited to, minimum counterparty credit rating requirements, monitoring of counterparty credit default swap spreads and posting of collateral. With exchange-traded derivatives, there is minimal counterparty credit risk to the Fund because the exchange’s clearing house, as counterparty to these instruments, stands between the buyer and the seller of the contract. Credit risk still exists in exchange-traded derivatives with respect to initial and variation margin that is held in a broker’s customer accounts. While brokers typically are required to segregate customer margin for exchange-traded derivatives from their own assets, in the event that a broker becomes insolvent or goes into bankruptcy and at that time there is a shortfall in the aggregate amount of margin held by the broker for all its customers, U.S. bankruptcy laws will typically allocate that shortfall on a pro rata basis across all of the broker’s customers, potentially resulting in losses to the Fund.
5.Purchases and Sales of Securities. For the six months ended June 30, 2024, purchases and sales of securities (excluding in-kind transactions and short-term investments and including paydowns) were as follows:
| U.S. Government/
Agency Securities | |
| | | | |
| | | | |
| | | | |
Short Duration Income ETF | | | | |
| | | | |
| | | | |
For the six months ended June 30, 2024, in-kind transactions were as follows:
Quality Income ETF, Mid Cap ETF and Select ETF realized a gain of $2,822,379, $98,716 and $955,110, respectively on in-kind sales during the six months ended June 30, 2024. Gains and losses realized on in-kind sales are not recognized for tax purposes and are re-classified from realized gain (loss) to paid-in-capital.
Notes to Financial Statements (continued)
June 30, 2024 (Unaudited)
6.Management Fees and Other Transactions with Affiliates.
a. Management Fees. Natixis Advisors, LLC (“Natixis Advisors”), serves as investment adviser to each Fund. Natixis Advisors is a wholly-owned subsidiary of Natixis Investment Managers, LLC, which is part of Natixis Investment Managers, an international asset management group based in Paris, France. Under the terms of the management agreements, each Fund pays a management fee at the following annual rates, calculated daily and payable monthly, based on each Fund’s average daily net assets:
| Percentage of Average Daily Net Assets |
| | |
| | |
| | |
Short Duration Income ETF | | |
| | |
| | |
Natixis Advisors has entered into subadvisory agreements for each Fund as listed below.
| |
| Gateway Investment Advisers, LLC (“Gateway Advisers”) |
| Loomis, Sayles & Company, L.P. (“Loomis Sayles”) |
Short Duration Income ETF | |
| Vaughan Nelson Investment Management, L.P. (“Vaughan Nelson”) |
| |
Gateway Advisers and Vaughan Nelson are subsidiaries of Natixis Investment Managers, LLC. Loomis Sayles is a limited partnership whose sole general partner, Loomis, Sayles & Company, Inc., is indirectly owned by Natixis Investment Managers, LLC.
Under the terms of the subadvisory agreements, each Fund has agreed to pay its respective subadviser a subadvisory fee at the following annual rates, calculated daily and payable monthly, based on each Fund’s average daily net assets:
| | Percentage of Average
Daily Net Assets |
| | | |
| | | |
| | | |
Short Duration Income ETF | | | |
| | | |
| | | |
Payments to Natixis Advisors are reduced by the amounts of payments to the subadvisers, as calculated based on the table above.
Natixis Advisors has given a binding undertaking to the Funds to waive management fees and/or reimburse certain expenses to limit the Funds’ operating expenses, exclusive of acquired fund fees and expenses, brokerage expenses, interest expense, taxes, organizational and extraordinary expenses such as litigation and indemnification expenses. This undertaking is in effect until April 30, 2026 for Quality Income ETF, Focused Growth ETF and Short Duration Income ETF and April 30, 2027 for Mid Cap ETF and Select ETF, may be terminated before then only with the consent of the Funds’ Board of Trustees, and is reevaluated on an annual basis. Management fees payable, as reflected on the Statements of Assets and Liabilities, is net of waivers and/or expense reimbursements, if any, pursuant to these undertakings. Waivers/reimbursements that exceed management fees payable are reflected on the Statements of Assets and Liabilities as receivable from investment adviser.
Notes to Financial Statements (continued)
June 30, 2024 (Unaudited)
For the six months ended June 30, 2024, the expense limits as a percentage of average daily net assets under the expense limitation agreements were as follows:
| |
| Expense Limit as a Percentage of
Average Daily Net Assets |
| |
| |
Short Duration Income ETF | |
| |
| |
Natixis Advisors shall be permitted to recover expenses borne under the expense limitation agreements (whether through waiver of management fees or otherwise) in later periods to the extent the annual operating expenses of a Fund fall below both (1) a Funds’ expense limitation ratio in place at the time such amounts were waived/reimbursed and (2) a Funds’ current applicable expense limitation ratio, provided, however, that a Fund is not obligated to pay such waived/reimbursed fees or expenses more than one year after the end of the fiscal year in which the fees or expenses were waived/reimbursed.
For the six months ended June 30, 2024, the management fees and waiver of management fees for each Fund were as follows:
| | Contractual
Waivers of
Management
| | Percentage of
Average
Daily Net Assets |
| | |
| | | | | |
| | | | | |
Short Duration Income ETF | | | | | |
| | | | | |
| | | | | |
| Management fee waivers are subject to possible recovery until December 31, 2025. |
For the six months ended June 30, 2024, expenses have been reimbursed as follows:
| |
| |
Short Duration Income ETF | |
| |
| Expense reimbursement is subject to possible recovery until December 31, 2025. |
No expenses were recovered for any of the Funds during the six months ended June 30, 2024 under the terms of the expense limitation agreements.
b. Administrative Fees. Natixis Advisors provides certain administrative services for the Funds and contracts with State Street Bank and Trust Company (“State Street Bank”) to serve as sub-administrator. Pursuant to an agreement among Natixis Funds Trusts, Loomis Sayles Funds Trusts, the Trusts and Natixis Advisors, each Fund pays Natixis Advisors monthly its pro rata portion of fees equal to an annual rate of 0.0540% of the first $15 billion of the average daily net assets of the Natixis Funds Trusts, Loomis Sayles Funds Trusts and the Trusts, 0.0500% of the next $15 billion, 0.0400% of the next $30 billion, 0.0275% of the next $30 billion and 0.0225% of such assets in excess of $90 billion, subject to an annual aggregate minimum fee for the Natixis Funds Trusts, Loomis Sayles Funds Trusts and the Trusts of $10 million, which is reevaluated on an annual basis.
Notes to Financial Statements (continued)
June 30, 2024 (Unaudited)
For the six months ended June 30, 2024, the administrative fees for each Fund were as follows:
| |
| |
| |
Short Duration Income ETF | |
| |
| |
c. Trustees Fees and Expenses. The Trusts do not pay any compensation directly to their officers or Trustees who are directors, officers or employees of Natixis Advisors, Natixis Distribution, Natixis Investment Managers, LLC or their affiliates. The Chairperson of the Board of Trustees receives a retainer fee at the annual rate of $400,000. The Chairperson does not receive any meeting attendance fees for Board of Trustees meetings or committee meetings that he attends. Each Independent Trustee (other than the Chairperson) receives, in the aggregate, a retainer fee at the annual rate of $225,000. Each Independent Trustee also receives a meeting attendance fee of $10,000 for each meeting of the Board of Trustees that he or she attends in person and $5,000 for each meeting of the Board of Trustees that he or she attends telephonically. In addition, the Chairperson of the Contract Review Committee and the Chairperson of the Audit Committee each receive an additional retainer fee at the annual rate of $25,000. The Chairperson of the Governance Committee receives an additional retainer fee at the annual rate of $20,000. Each Contract Review Committee member is compensated $6,000 for each Committee meeting that he or she attends in person and $3,000 for each meeting that he or she attends telephonically. Each Audit Committee member is compensated $6,000 for each Committee meeting that he or she attends in person and $3,000 for each meeting that he or she attends telephonically. Each Governance Committee member is compensated $2,500 for each Committee meeting that he or she attends. These fees are allocated among the funds in the Natixis Funds Trusts, Loomis Sayles Funds Trusts and Natixis ETF Trusts based on a formula that takes into account, among other factors, the relative net assets of each fund. Trustees are reimbursed for travel expenses in connection with attendance at meetings.
A deferred compensation plan (the “Plan”) is available to the Trustees on a voluntary basis. The value of a participating Trustee’s deferral account is based on theoretical investments of deferred amounts, on the normal payment dates, in certain funds of the Natixis Funds Trusts, Loomis Sayles Funds Trusts and Natixis ETF Trusts as designated by the participating Trustees. Changes in the value of participants’ deferral accounts are allocated pro rata among the funds in the Natixis Funds Trusts, Loomis Sayles Funds Trusts and Natixis ETF Trusts and are normally reflected as Trustees’ fees and expenses in the Statements of Operations. Deferred amounts remain in the funds until distributed in accordance with the provisions of the Plan. The portions of the accrued obligations allocated to the Funds under the Plan are reflected as Deferred Trustees’ fees in the Statements of Assets and Liabilities.
Certain officers and employees of Natixis Advisors and affiliates are also officers and/or Trustees of the Trusts.
d. Affiliated Ownership. As of June 30, 2024, the percentage of each Fund’s net assets owned by affiliates is as follows:
| |
| |
Natixis Investment Managers, LLC | |
| |
Natixis Investment Managers, LLC | |
Loomis Sayles Growth Fund | |
| |
| |
Natixis Investment Managers, LLC | |
Investment activities of affiliated shareholders could have material impacts on the Funds.
7.Transfer Agent, Custodian, Regulatory Filing Fees and Shareholder Reporting Expenses. State Street Bank, transfer agent, custodian and sub-administrator to the Funds, agreed to waive its fees and expenses for the first 12 months of operations for Quality Income ETF and Focused Growth ETF. For the period ended June 30, 2024, total fees waived were $33,558 and $25,042, respectively.
Notes to Financial Statements (continued)
June 30, 2024 (Unaudited)
8.Line of Credit. Short Duration Income ETF, Mid Cap ETF and Select ETF, together with certain other funds of Natixis Funds Trusts, Loomis Sayles Funds Trusts and Natixis ETF Trusts, entered into a syndicated, revolving, committed, unsecured line of credit with State Street Bank as administrative agent. The aggregate revolving commitment amount is $575,000,000. Any one Fund may borrow up to $402,500,000 under the line of credit agreement (as long as all borrowings by all Funds in the aggregate do not exceed the $575,000,000 limit at any time), subject to each Fund’s investment restrictions and its contractual obligations under the line of credit. Interest is charged to the Funds based upon the terms set forth in the agreement. In addition, a commitment fee of 0.15% per annum, payable at the end of each calendar quarter, is accrued and apportioned among the participating funds based on their average daily unused portion of the line of credit.
For the six months ended June 30, 2024, the Funds had no borrowings under this agreement.
9.Risk. The Funds have exposure to certain types of risk as summarized below.
a. Authorized Participant Concentration Risk. Only an Authorized Participant may engage in creation or redemption transactions directly with the Funds. The Funds have a limited number of institutions that act as Authorized Participants, none of which are or will be obligated to engage in creation or redemption transactions. To the extent that these institutions exit the business or are unable to proceed with creation and/or redemption orders with respect to the Funds and no other Authorized Participant is able to step forward to create or redeem Creation Units, Fund shares may trade at a discount to NAV and possibly face trading halts and/or delisting.
b. Premium/Discount Risk. Shares of the Funds are listed for trading on the NYSE Arca and are bought and sold in the secondary market at market prices that may differ from their most recent NAV. The market value of the Funds’ shares will fluctuate, in some cases materially, in response to changes in the Funds’ NAV, the intraday value of the Funds’ holdings, and the relative supply and demand for the Funds’ shares on the exchange. Disruptions to creations and redemptions, the existence of extreme market volatility or potential lack of an active trading market for shares may result in shares trading at a significant premium or discount to NAV and/or in a reduced liquidity of your investment. If a shareholder purchases shares at a time when the market price is at a premium to the NAV or sells shares at a time when the market price is at a discount to the NAV, the shareholder may sustain losses.
c. Trading Issues Risk. Trading in shares on the NYSE Arca may be halted in certain circumstances. There can be no assurance that the requirements of the NYSE Arca necessary to maintain the listing of the Funds will continue to be met. Because Focused Growth ETF trades on the basis of a published Proxy Portfolio, the Fund may trade at a wider bid/ask spread and may experience a wider premium/discount than traditional ETFs that publish their portfolios on a daily basis, and therefore, may cost investors more to trade especially during periods of market disruption or volatility.
d. Non-Diversified Risk. Focused Growth ETF and Select ETF are non-diversified, which means that the Funds are not limited under the 1940 Act to a percentage of assets that it may invest in any one issuer. Because the Funds may invest in the securities of a limited
number of issuers, an investment in the Funds may involve a higher degree of risk than would be present in a diversified portfolio.
e. Other. Geopolitical events (such as trading halts, sanctions or wars) could increase volatility and uncertainty in the financial markets and adversely affect regional and global economies. These, and other related events, could significantly impact a Fund's performance and the value of an investment in the Fund, even if the Fund does not have direct exposure to issuers in the country or countries involved.
10.Capital Shares. Shares of the Funds may be acquired or redeemed directly from the Funds by Authorized Participants only in aggregations of 50,000 shares for Short Duration Income ETF and 10,000 shares for Quality Income ETF, Focused Growth ETF, Mid Cap ETF and Select ETF (“Creation Units”), or multiples thereof. Each Authorized Participant enters into an Authorized Participant agreement with the Funds’ Distributor.
A creation transaction order, which is subject to acceptance by ALPS, generally takes place when an Authorized Participant deposits into the Funds a designated portfolio of securities and/or cash (including any portion of such securities for which cash may be substituted) and a specified amount of cash approximating the holdings of the Funds in exchange for a specified number of Creation Units.
Similarly, shares can be redeemed only in Creation Units, generally for a designated portfolio of securities and/or cash (including any portion of such securities for which cash may be substituted) held by the Funds and a specified amount of cash. Except when aggregated in Creation Units, shares are not redeemable directly with the Funds.
The prices at which creations and redemptions occur are based on the next calculation of NAV after a creation or redemption order is received in an acceptable form under the Authorized Participant agreement. These prices may differ from the market price of the Fund’s shares.
Notes to Financial Statements (continued)
June 30, 2024 (Unaudited)
10.Capital Shares (continued).
The Funds may impose a creation transaction fee and a redemption transaction fee to offset transfer and other transaction costs associated with the issuance and redemption of Creation Units. Transaction fees are included in capital share transactions on the Statements of Changes in Net Assets.
Transactions in capital shares were as follows:
|
| Six Months Ended
June 30, 2024 | Period Ended
December 31, 2023(a) |
| | | | |
Issued from the sale of shares | | | | |
| | | | |
Increase from capital share transactions | | | | |
| From commencement of operations on December 12, 2023 through December 31, 2023. |
|
| Six Months Ended
June 30, 2024 | Period Ended
December 31, 2023(a) |
| | | | |
Issued from the sale of shares | | | | |
Increase from capital share transactions | | | | |
| From commencement of operations on June 28, 2023 through December 31, 2023. |
|
| Six Months Ended
June 30, 2024 | Year Ended
December 31, 2023 |
Short Duration Income ETF | | | | |
Issued from the sale of shares | | | | |
| | | | |
Decrease from capital share transactions | | | | |
|
| Six Months Ended
June 30, 2024 | Year Ended
December 31, 2023 |
| | | | |
Issued from the sale of shares | | | | |
| | | | |
Increase (decrease) from capital share transactions | | | | |
|
| Six Months Ended
June 30, 2024 | Year Ended
December 31, 2023 |
| | | | |
Issued from the sale of shares | | | | |
| | | | |
Increase (decrease) from capital share transactions | | | | |
Notes to Financial Statements (continued)
June 30, 2024 (Unaudited)
11.Subsequent Event. On June 12, 2024, the Board of Trustees approved a plan to liquidate Mid Cap ETF. Liquidation took place on July 30, 2024.
BOARD APPROVAL OF THE EXISTING ADVISORY AND SUB-ADVISORY AGREEMENTS
The Board of Trustees of the Trust (the “Board”), including the Independent Trustees, considers matters bearing on each Fund’s advisory agreement and sub-advisory agreement (collectively, the “Agreements”), at most of its meetings throughout the year. Each year, usually in the spring, the Contract Review Committee of the Board meets to review the Agreements to determine whether to recommend that the full Board approve the continuation of the Agreements, typically for an additional one-year period. This meeting typically includes all the Independent Trustees, including the Trustees who do not serve on the Contract Review Committee. After the Contract Review Committee has made its recommendation, the full Board, including the Independent Trustees, determines whether to approve the continuation of the Agreements at its June Board meeting. The Natixis Loomis Sayles Focused Growth ETF and Natixis Gateway Quality Income ETF were not included in the most recent annual review as the Funds’ initial Board-approved investment advisory agreements are effective until June 28, 2025 and December 13, 2025, respectively.
In connection with these meetings, the Trustees receive materials that the Funds’ investment advisers and sub-advisers, as applicable (collectively, the “Advisers”), believe to be reasonably necessary for the Trustees to evaluate the Agreements. These materials generally include, among other items, (i) information on the investment performance of the Funds and the performance of peer groups of funds and the Funds’ performance benchmarks, (ii) information on the Funds’ advisory fees and sub-advisory fees, if any, and other expenses, including information comparing the Funds’ advisory fees and sub-advisory fees, if any, to the fees charged to institutional accounts with similar strategies managed by the Advisers, if any, and to those of peer groups of funds, including, if applicable, the Fund’s corresponding mutual fund, and information about any applicable expense limitations and/or fee “breakpoints,” (iii) sales, redemption and trading data in respect of the Funds, (iv) information about the profitability of the Agreements to the Advisers, including how profitability is determined for the Funds, and (v) information obtained through the completion by the Advisers of questionnaires distributed on behalf of the Trustees throughout the year. The Board, including the Independent Trustees, also considers other matters such as (i) each Fund’s investment objective and strategies and the size, education and experience of the Advisers’ respective investment staffs and their use of technology, external research and trading cost measurement tools, (ii) arrangements in respect of the distribution and trading of the Funds’ shares and the related costs, (iii) the allocation of the Funds’ brokerage, if any, including, if applicable, allocations to brokers affiliated with the Advisers and the use of “soft” commission dollars to pay for research and other similar services, (iv) each Adviser’s policies and procedures relating to, among other things, compliance, trading and best execution, proxy voting, liquidity and valuation, (v) information about amounts invested by the Funds’ portfolio managers in the Funds or in similar accounts that they manage and (vi) the general economic outlook with particular emphasis on the asset management industry. Throughout the process, the Trustees are afforded the opportunity to ask questions of and request additional materials from the Advisers and the Independent Trustees meet separately with independent legal counsel outside the presence of Adviser personnel.
In addition to the materials requested by the Trustees in connection with their annual consideration of the continuation of the Agreements, the Trustees receive materials in advance of each regular quarterly meeting of the Board that provide detailed information about the Funds’ investment performance and the fees charged to the Funds for advisory and other services. The information received by the Trustees generally includes, among other things, an internal performance rating for each Fund based on agreed-upon criteria, total return information for various periods, and performance rankings provided by a third-party data provider for various periods comparing a Fund against similarly categorized funds. The portfolio management team for each Fund or other representatives of the Advisers make periodic presentations to the Contract Review Committee and/or the full Board, and if a Fund is identified as presenting possible performance concerns it may be subject to more frequent Board or Committee presentations and reviews. In addition, the Trustees are periodically provided with detailed statistical information about each Fund’s portfolio. The Trustees also receive periodic updates between meetings, both at the Board and at the Committee level.
The Board most recently approved the continuation of the applicable Agreements for a one-year period at its meeting held in June 2024. In considering whether to approve the continuation of the applicable Agreements, the Board, including the Independent Trustees, did not identify any single factor as determinative. Individual Trustees may have evaluated the information presented differently from one another, giving different weights to various factors. Matters considered by the Trustees, including the Independent Trustees, in connection with their approval of the Agreements included, but were not limited to, the factors listed below.
The nature, extent and quality of the services provided to the Funds under the Agreements. The Trustees considered the nature, extent and quality of the services provided by the Advisers and their affiliates to the Funds, which include advisory and non-advisory services directed to the needs and operations of each of the Funds as an ETF. The Trustees also considered the resources dedicated to the Funds by the Advisers and their affiliates. The Trustees noted that although certain Funds are relatively new, the Advisers had extensive experience managing other types of funds and had made significant investments in the resources necessary for the management of ETFs, such as resources dedicated to the Funds’ creation and redemption processes. The Trustees also considered their experience with other funds advised or sub-advised by the Advisers, as well as the affiliation between the Advisers and Natixis Investment Managers, LLC, whose affiliates provide investment advisory services to other funds in the Natixis family of funds. The Trustees considered that certain of the Funds use a semi-transparent structure, and the Trustees considered the unique services required to operate such a structure, including the additional systems, processes and portfolio management oversight structures needed to ensure proper creation and disclosure of the proxy portfolio for such Funds.
The Trustees considered not only the advisory and sub-advisory services provided by the Advisers to the Funds, but also the benefits to the Funds from the monitoring and oversight services provided by Natixis Advisors, LLC (“Natixis Advisors”). They also considered the administrative and shareholder services provided by Natixis Advisors and its affiliates to the Funds. They also took into consideration increases in the services provided resulting from new regulatory requirements, such as recent rules relating to the fair valuation of investments and the use of derivatives, implementation of tailored shareholder reports and amendments to the Names Rule, as well as from monitoring proposed rules, such as those relating to cybersecurity, environmental, social, and governance-specific regulatory changes, and vendor oversight.
After reviewing these and related factors, the Trustees concluded, within the context of their overall conclusions regarding each of the Agreements, that the nature, extent and quality of services provided supported the renewal of the Agreements.
Investment performance of the Funds and the Advisers. As noted above, the Trustees received information about the performance of each of the Funds except for the Natixis Loomis Sayles Focused Growth ETF and Natixis Gateway Quality Income ETF (the “Existing Funds”) over various time periods, including information that compared the performance of such Funds to the performance of peer groups and categories of funds and the Funds’ respective performance benchmarks. The Board noted that while it found the data provided by the independent third-party data provider useful, it recognized its limitations, including, in particular, that notable differences may exist between the Funds and the performance comparisons (for example, with respect to investment strategies) and that the results of the performance comparisons may vary depending on (i) the end dates for the performance periods that were selected and (ii) the selection of the performance comparisons. The Trustees also received information about how comparative peer groups are constructed. In addition, the Trustees reviewed data prepared by an independent third-party rating organization that analyzed the performance of the Funds using a variety of performance metrics, including metrics that measured the performance of the Funds on a risk adjusted basis. The Trustees noted that the Natixis Loomis Sayles Focused Growth ETF and Natixis Gateway Quality Income ETF did not yet have one year of performance.
The Board noted that, through December 31, 2023, each Existing Fund’s one-, three- and five-year net asset value performance, as applicable, stated as percentile rankings within categories selected by the independent third-party data provider, was as follows (where the best performance would be in the first percentile of its category):
| | | |
Natixis Loomis Sayles Short Duration Income ETF | | | |
Natixis Vaughan Nelson Mid Cap ETF | | | |
Natixis Vaughan Nelson Select ETF | | | |
In the case of the Fund that had performance that lagged that of a relevant category median as determined by the independent third-party data provider for certain (though not necessarily all) periods, the Board concluded that other factors relevant to performance supported renewal of the Fund’s Agreement. These factors included the following: (1) that the underperformance was attributable, to a significant extent, to investment decisions (such as security selection or sector allocation) by the Adviser that were reasonable and consistent with the Fund’s investment objective and policies; (2) that the Fund’s longer-term (three- and five-year) performance was stronger relative to its category; and (3) that the Fund had outperformed its relevant benchmark for the one-year period ended December 31, 2023. The Board also considered information about the Funds’ more recent performance, including how performance over various periods had been impacted by various factors such as market and economic events.
The Trustees also considered each Adviser’s performance and reputation generally, the performance of the fund family generally, and the historical responsiveness of the Advisers to Trustee concerns about performance and the willingness of the Advisers to take steps intended to improve performance.
After reviewing these and related factors, the Trustees concluded, within the context of their overall conclusions regarding each of the Agreements, that the performance of the Funds and the Advisers and/or other relevant factors supported the renewal of the Agreements.
The costs of the services provided and the profits realized by the Advisers and their affiliates from their respective relationships with the Funds. The Trustees considered the fees charged to the Funds for advisory, sub-advisory and administrative services, as applicable, as well as the total expense levels of the Funds. This information included comparisons (provided by an independent third party) of the Funds’ advisory fees and total expense levels to those of its category groups. In evaluating each Fund’s advisory and sub-advisory fees, as applicable, the Trustees also took into account the demands, complexity and quality of the investment management of the Funds, including the additional responsibilities of the Advisers in overseeing an ETF, and the need for the Advisers to offer competitive compensation and the potential need to expend additional resources to the extent the Funds grow in size. The Trustees also considered that over the past several years, management had demonstrated its intention to have competitive fee levels by making recommendations regarding reductions in advisory fee rates, implementation of advisory fee breakpoints and the institution of advisory fee waivers and expense limitations for various funds in the fund family. They noted that the Funds have expense limitations in place
and they considered the amounts waived or reimbursed by the Advisers for the Funds under their expense limitation agreements. The Trustees also noted that Natixis Loomis Sayles Short Duration Income ETF had a total advisory fee rate that was equal to the median of its peer group of funds. The Board also considered that the fee and expense information reflected information as of a certain date and that historical asset levels may differ from current asset levels, particularly in a period of market volatility.
The Trustees noted that each of Natixis Vaughan Nelson Mid Cap ETF and Natixis Vaughan Nelson Select ETF had a total advisory fee rate that was above the median of a peer group of funds. In this regard, the Trustees considered factors that management believed justified the relatively higher advisory fee rates, including (1) that peer grouping for the Natixis Vaughan Nelson Mid Cap ETF and the Natixis Vaughan Nelson Select ETF was challenging given the lack of competitive products offered under the unique semi-transparent structure, and management believes it is more appropriate to use the peer groupings for the corresponding mutual fund versions of the Funds’ respective strategies; (2) that the advisory fee rate for the corresponding mutual fund version of the Natixis Vaughan Nelson Mid Cap ETF, which is the same as the advisory fee rate for the Natixis Vaughan Nelson Mid Cap ETF, was 1 basis point higher than its peer group, which management believes is competitive; and (3) that the advisory fee rate for the corresponding mutual fund version of the Natixis Vaughan Nelson Select ETF, which is the same as the advisory fee rate for the Natixis Vaughan Nelson Select ETF, was 5 basis points higher than its peer group, which management believes is competitive. Management also noted that, during the year, the Natixis Vaughan Nelson Mid Cap ETF and Natixis Vaughan Nelson Select ETF each operated as a semi-transparent ETF; however, effective February 1, 2024, the fund structure of each such Fund changed from semi-transparent to fully transparent.
The Trustees also considered the compensation directly or indirectly received by the Advisers and their affiliates from their relationships with the Funds. The Trustees reviewed information provided by management as to the profitability of the Advisers’ and their affiliates’ relationships with the Funds, and information about how expenses are determined and allocated for purposes of profitability calculations. They also reviewed information provided by management about the effect of distribution costs and changes in asset levels on Adviser profitability, including information regarding resources spent on distribution activities. When reviewing profitability, the Trustees also considered information about court cases in which adviser compensation or profitability were issues, the performance of the Funds, the expense levels of the Funds, whether the Advisers had implemented breakpoints and/or expense limitations with respect to the Funds and the overall profit margin of Natixis Investment Managers, LLC compared to that of certain other investment managers for which such data was available. The Board also noted the competitive nature of the global asset management industry.
After reviewing these and related factors, the Trustees concluded, within the context of their overall conclusions regarding each of the Agreements, that the advisory and sub-advisory fees charged to each of the Funds were fair and reasonable, and that the costs of these services generally and the related profitability of the Advisers and their affiliates in respect of their relationships with the Funds supported the renewal of the Agreements.
Economies of Scale. The Trustees considered the existence of any economies of scale in the provision of services by the Advisers and whether those economies are shared with the Funds through breakpoints in their investment advisory fees or other means, such as expense limitations. The Trustees also considered management’s explanation of the factors that are taken into account with respect to the implementation of breakpoints in investment advisory fees or expense limitations, which reduced the total expenses borne by shareholders. With respect to economies of scale, the Trustees noted that Natixis Vaughan Nelson Mid Cap ETF has breakpoints in its advisory fee and that each of the Funds was subject to an expense limitation. In considering these issues, the Trustees also took note of the costs of the services provided (both on an absolute and on a relative basis) and the profitability to the Advisers and their affiliates of their relationships with the Funds, as discussed above. The Trustees also considered that the Funds have benefitted from the substantial reinvestment each Adviser has made into its business. They also considered that because of their relatively small size, the Funds did not benefit from significant economies of scale.
After reviewing these and related factors, the Trustees concluded, within the context of their overall conclusions regarding each of the Agreements, that the extent to which economies of scale were shared with the Funds supported the renewal of the Agreements.
The Trustees also considered other factors, which included but were not limited to the following:
• The effect of various factors and recent market and economic events, such as recent market volatility, geopolitical instability, aggressive domestic and foreign central bank policies, and adverse developments affecting the financial services industry generally, as applicable, on the performance, asset levels and expense ratios of each Fund.
• Whether each Fund has operated in accordance with its investment objective and the Fund’s record of compliance with its investment restrictions, and the compliance programs of the Funds and the Advisers. They also considered the compliance-related resources the Advisers and their affiliates were providing to the Funds.
• So-called “fallout benefits” to the Advisers, such as the engagement of affiliates of the Advisers to provide distribution, administrative and brokerage services to the Funds, as may be applicable, the ability to offer ETFs in the Natixis family of funds, and the benefits of research made available to the Advisers by reason of brokerage commissions (if any) generated by the Funds’ securities transactions. The Trustees considered the possible conflicts of interest associated with these fallout and other benefits, and the reporting, disclosure and other processes in place to disclose and monitor such possible conflicts of interest.
• The Trustees’ review and discussion of the Funds’ advisory arrangements in prior years, and management’s record of responding to Trustee concerns raised during the year and in prior years.
Based on their evaluation of all factors that they deemed to be material, including those factors described above, and assisted by the advice of independent counsel, the Trustees, including the Independent Trustees, concluded that each of the existing Agreements should be continued through June 30, 2025.
ALPS Distributors, Inc. is the distributor for the Natixis Gateway Quality Income ETF, Natixis Loomis Sayles Focused Growth ETF, Natixis Loomis Sayles Short Duration Income ETF, Natixis Vaughan Nelson Mid Cap ETF and Natixis Vaughan Nelson Select ETF. Natixis Distribution, LLC is a marketing agent. ALPS Distributors, Inc. is not affiliated with Natixis Distribution, LLC.
˃To learn more about Natixis ETFs:
Visit:im.natixis.com Call800-225-5478.
Before investing, consider the fund’s investment objectives, risks, charges, and expenses. Visit im.natixis.com or call 800-225-5478 for a prospectus or summary prospectus containing this and other information.
Contact us by mail:
If you wish to communicate with the funds’ Board of Trustees, you may do so by writing to:
Secretary of the Funds
Natixis Advisors, LLC
888 Boylston Street, Suite 800
Boston, MA 02199-8197
The correspondence must (a) be signed by the shareholder; (b) include the shareholder’s name and address; and (c) identify the fund(s), account number, share class, and number of shares held in that fund, as of a recent date.
Or by e-mail:
secretaryofthefunds@natixis.com (Communications regarding recommendations for Trustee candidates may not be submitted by e-mail.)
Please note: Unlike written correspondence, e-mail is not secure. Please do NOT include your account number, Social Security number, PIN, or any other non-public personal information in an e-mail communication because this information may be viewed by others.
 Exp. 8/30/20255884221.2.1USIMV58SA-0624
This page is not part of the financial statements and other important information
Item 8. Changes in and Disagreements with Accountants for Open-End Management Investment Companies
Not applicable.
Item 9. Proxy Disclosures for Open-End Management Investment Companies.
Not applicable.
Item 10. Remuneration Paid to Directors, Officers, and Others of Open-End Management Investment Companies.
The remuneration paid to Directors and Officers are incorporated by reference as part of the Financial Statements and Other Important Information for Open-End Management Investment Companies filed as Item 7 herewith.
Item 11. Statement Regarding Basis for Approval of Investment Advisory Contract.
The statements regarding basis for approval of investment advisory contracts are incorporated by reference as part of the Financial Statements and Other Important Information for Open-End Management Investment Companies filed as Item 7 herewith.
Item 12. Disclosure of Proxy Voting Policies and Procedures for Closed-End Management Investment Companies.
Not applicable.
Item 13. Portfolio Managers of Closed-End Management Investment Companies.
Not applicable.
Item 14. Purchases of Equity Securities by Closed-End Management Investment Companies and Affiliated Purchasers.
Not applicable.
Item 15. Submission of Matters to a Vote of Securities Holders.
There were no material changes to the procedures by which shareholders may recommend nominees to the Registrant’s Board of Trustees.
Item 16. Controls and Procedures.
The Registrant’s principal executive officer and principal financial officer have concluded that the Registrant’s disclosure controls and procedures are sufficient to ensure that information required to be disclosed by the Registrant in this Form N-CSR was recorded, processed, summarized and reported within the time periods specified in the Securities and Exchange Commission’s rules and forms, based upon such officers’ evaluation of these controls and procedures as of a date within 90 days of the filing date of the report.
There were no changes in the Registrant’s internal control over financial reporting that occurred during the period covered by the report that have materially affected, or are reasonably likely to materially affect, the Registrant’s internal control over financial reporting.
Item 17. Disclosure of Securities Lending Activities for Closed-End Management Investment Companies.
Not applicable.
Item 18. Recovery of Erroneously Awarded Compensation.
Not applicable.
Item 19. Exhibits.
SIGNATURES
Pursuant to the requirements of the Securities Exchange Act of 1934 and the Investment Company Act of 1940, the Registrant has duly caused this report to be signed on its behalf by the undersigned, thereunto duly authorized.
| | |
| Natixis ETF Trust |
|
| By: /s/ David L. Giunta |
| |
| Name: | | David L. Giunta |
| Title: | | President and Chief Executive Officer |
| Date: | | August 21, 2024 |
Pursuant to the requirements of the Securities Exchange Act of 1934 and the Investment Company Act of 1940, this report has been signed by the following persons on behalf of the Registrant and in the capacities and on the dates indicated.
| | |
| By: /s/ David L. Giunta |
| |
| Name: | | David L. Giunta |
| Title: | | President and Chief Executive Officer |
| Date: | | August 21, 2024 |
|
| By: /s/ Matthew J. Block |
| |
| Name: | | Matthew J. Block |
| Title: | | Treasurer and Principal Financial and
Accounting Officer |
| Date: | | August 21, 2024 |