Use these links to rapidly review the document
TABLE OF CONTENTS
Item 8. FINANCIAL STATEMENTS AND SUPPLEMENTARY DATA.
Table of Contents
UNITED STATES
SECURITIES AND EXCHANGE COMMISSION
Washington, D.C. 20549
Form 10-K
| | |
| (Mark One) | | |
ý |
|
ANNUAL REPORT PURSUANT TO SECTION 13 OR 15(d) OF THE SECURITIES EXCHANGE ACT OF 1934 |
For the fiscal year ended December 31, 2012 |
OR |
o |
|
TRANSITION REPORT PURSUANT TO SECTION 13 OR 15(d) OF THE SECURITIES EXCHANGE ACT OF 1934 |
For the transition period from to .
|
Commission File Number 001-35549
IGNITE RESTAURANT GROUP, INC.
(Exact Name of Registrant as Specified in Its Charter)
| | |
Delaware
(State or Other Jurisdiction of
Incorporation or Organization) | | 94-3421359
(I.R.S. Employer
Identification No.) |
9900 Westpark Drive, Suite 300, Houston, Texas
(Address of Principal Executive Offices) |
|
77063
(Zip Code) |
Telephone Number:(713) 366-7500
Securities registered pursuant to Section 12(b) of the Act:
| | |
| Title of Each Class | | Name of Each Exchange on which Registered |
|---|
| Common Stock, $0.01 par value | | NASDAQ Global Select Market |
Securities registered pursuant to Section 12(g) of the Act:None
Indicate by check mark if the registrant is a well-known seasoned issuer, as defined in Rule 405 of the Securities Act. Yes o No ý.
Indicate by check mark if the registrant is not required to file reports pursuant to Section 13 or Section 15(d) of the Act. Yes o No ý.
Indicate by check mark whether the registrant (1) has filed all reports required to be filed by Section 13 or 15(d) of the Securities Exchange Act of 1934 during the preceding 12 months (or for such shorter period that the registrant was required to file such reports), and (2) has been subject to such filing requirements for the past 90 days. Yes ý No o.
Indicate by check mark whether the registrant has submitted electronically and posted on its corporate Web site, if any, every Interactive Data File required to be submitted and posted pursuant to Rule 405 of Regulation S-T during the preceding 12 months (or for such shorter period that the registrant was required to submit and post such files). Yes ý No o.
Indicate by check mark if disclosure of delinquent filers pursuant to Item 405 of Regulation S-K is not contained herein, and will not be contained, to the best of registrant's knowledge, in definitive proxy or information statements incorporated by reference in Part III of this Form 10-K or any amendment to this Form 10-K. o
Indicate by check mark whether the registrant is a large accelerated filer, an accelerated filer, a non-accelerated filer or a smaller reporting company. See the definitions of "large accelerated filer," "accelerated filer" and "smaller reporting company" in Rule 12b-2 of the Exchange Act. (Check one):
| | | | | | |
| Large accelerated filer o | | Accelerated filer o | | Non-accelerated filer ý
(Do not check if a
smaller reporting company) | | Smaller reporting company o |
Indicate by check mark whether the registrant is a shell company (as defined in Rule 12b-2 of the Act). Yes o No ý.
State the aggregate market value of the voting and non-voting common equity held by
non-affiliates of the registrant.
The aggregate market value of the common stock of the Registrant held by non-affiliates as of June 18, 2012 (the last business day of the most recently completed second quarter) was $126,550,861, calculated based on the closing price of our common stock as reported by the NASDAQ Global Select market on such date.
Indicate the number of shares outstanding of each of the registrant's classes of common stock,
as of the latest practicable date.
As of March 18, 2013, 25,636,602 shares of the Registrant's common stock were outstanding.
Documents Incorporated by Reference
Portions of the Registrant's Proxy Statement for its Annual Meeting of Shareholders on June 4, 2013, to be filed with the Securities and Exchange Commission no later than 120 days after December 31, 2012, are incorporated by reference into Part III of this Report.
Table of Contents
TABLE OF CONTENTS
| | | | | | |
| |
| | Page | |
|---|
PART I | |
Item 1. | | Business | | |
3 | |
Item 1A. | | Risk Factors | | | 16 | |
Item 1B. | | Unresolved Staff Comments | | | 35 | |
Item 2. | | Properties | | | 36 | |
Item 3. | | Legal Proceedings | | | 37 | |
Item 4. | | Mine Safety Disclosures | | | 38 | |
PART II | |
Item 5. | | Market for Registrant's Common Equity, Related Stockholder Matters and Issuer Purchases of Equity Securities | | |
38 | |
Item 6. | | Selected Financial Data | | | 39 | |
Item 7. | | Management's Discussion and Analysis of Financial Condition and Results of Operations | | | 41 | |
Item 7A. | | Quantitative and Qualitative Disclosures About Market Risk | | | 62 | |
Item 8. | | Financial Statements and Supplementary Data | | | 63 | |
Item 9. | | Changes in and Disagreements With Accountants on Accounting and Financial Disclosure | | | 87 | |
Item 9A. | | Controls and Procedures | | | 87 | |
Item 9B. | | Other Information | | | 90 | |
PART III | |
Item 10. | | Directors, Executive Officers and Corporate Governance | | |
91 | |
Item 11. | | Executive Compensation | | | 91 | |
Item 12. | | Security Ownership of Certain Beneficial Owners and Management and Related Stockholder Matters | | | 91 | |
Item 13. | | Certain Relationships and Related Transactions, and Director Independence | | | 91 | |
Item 14. | | Principal Accounting Fees and Services | | | 91 | |
PART IV | |
Item 15. | | Exhibits, Financial Statement Schedules | | |
92 | |
SIGNATURES
| | |
96 | |
2
Table of Contents
PART I
Item 1. BUSINESS.
Our Company
Ignite Restaurant Group, Inc., a Delaware corporation incorporated in 2002, operates two restaurant brands, Joe's Crab Shack ("Joe's") and Brick House Tavern + Tap ("Brick House"). Each of our restaurant brands offers a variety of high-quality food and beverages in a distinctive, casual, high-energy atmosphere. Joe's Crab Shack and Brick House Tavern + Tap operate in a diverse set of markets across the United States.
Joe's Crab Shack, founded in 1991, is an established, national chain of casual seafood restaurants serving a variety of high-quality seafood items, with an emphasis on crab. Joe's is a high-energy, family-friendly restaurant that encourages guests to "roll up your sleeves and crack into some crab."
Brick House Tavern + Tap, founded in 2008, is a casual restaurant brand that provides guests a differentiated "gastro pub" experience by offering a distinctive blend of menu items in a polished setting. As a next generation bar and grill, Brick House appeals to a broad audience by providing guests with an elevated experience. In 2011, Brick House was listed as the #1 "up and comer" full-service, varied-menu restaurant business by Technomic, a leading restaurant industry consulting and research firm, and recently was named by Nation's Restaurant News as one of the 50 Breakout Brands of 2013.
Our comparable restaurant sales have increased for 18 consecutive fiscal quarters and outperformed the KNAPP-TRACK™ report of casual dining restaurants, which is an average of approximately 50 casual dining restaurant brands, over the same period of time. We have grown our comparable restaurant sales by 15% on a cumulative basis over the last three years, which has outperformed the KNAPP-TRACK growth rate of 2% by more than 1,200 basis points on a cumulative basis over the same period of time. During fiscal year 2012, 2011 and 2010, our comparable restaurant sales increased by 2.2%, 6.9% and 4.9%, respectively, over the comparable period in our prior fiscal year.
The majority of our current management team was put in place in fiscal year 2007. This team developed and implemented many of the initiatives and strategies which serve as the foundation for what our company is today. The impact of these strategies began to take effect in fiscal year 2008. From the fiscal year ended January 3, 2011 through the fiscal year ended December 31, 2012, total revenues and Adjusted EBITDA (a non-GAAP financial measure) have improved at compounded annual growth rates of 15.1% and 14.9%, respectively. Over the same period, our total revenues increased from $351.3 million to $465.1 million and Adjusted EBITDA increased from $39.4 million to $52.0 million. We opened 32 new restaurants, including two conversions, and closed seven restaurants, including four conversions, which resulted in a net total of 25 new restaurants over the same period of time. For fiscal year 2012, we opened eleven new restaurants, including one conversion.
3
Table of Contents
As of December 31, 2012, we owned and operated 144 restaurants in 33 states.
On February 6, 2013, we entered into an agreement to acquire all of the issued and outstanding equity interest of Mac Parent LLC ("Mac Grill"), which, with its subsidiaries, operates and franchises the right to operate Romano's Macaroni Grill restaurants, for approximately $55.0 million in an all-cash transaction from private equity firm Golden Gate Capital, management and other investors. Mac Grill owns and operates 186 and franchises five Romano's Macaroni Grill units across 36 states, and franchises an additional 19 units in nine U.S. territories and foreign countries. The acquisition is expected to be completed in the second quarter of fiscal year 2013. To fund this acquisition, we received a commitment from our current lenders to upsize our new senior secured credit facility by adding a $50.0 million term loan facility.
Our Restaurants
Joe's Crab Shack
Joe's Crab Shack is a come-as-you-are, family restaurant that offers guests an environment that is laid-back, comfortable, fun, and energetic. Most locations offer an outdoor patio for guests to enjoy eating and drinking and a children's playground as part of the "I'm relaxed" restaurant experience. Joe's also has many locations that are located on waterfront property. Interior design elements include a nautical, vacation theme to invoke memories of beach vacations and a genuine crab shack experience. Table tops are decorated with art to prompt dinner conversation, while picnic tables across the patio and interior help guests feel the relaxed tropical vacation experience. Joe's Crab Shack restaurants are largely free-standing and average 8,000 square feet with over 200 seats. Most Joe's Crab Shack bars are separated from the dining area to provide for a distinct place to grab a drink while waiting for a table. Colorful party lights, a disco ball and bright paint colors enhance the dining experience. Many of our restaurants also include a small gift shop where guests can purchase souvenirs to commemorate their dining experience. Our new restaurant prototype, introduced in fiscal year 2010, contemporizes many of our key brand elements, while maintaining our authentic crab shack appeal.
Joe's Crab Shack restaurants perform well in targeted markets with high population density and a propensity for seafood as well as "destination" markets with national and regional tourist attractions, both of which are key characteristics of our new site selection strategy.
Brick House Tavern + Tap
Brick House is a trend-forward "gastro pub" set in an inviting, comfortable and modern venue that provides a distinctive guest experience. Brick House's interior décor includes custom lighting, dark mahogany woods, open sight lines, HD TVs, and an inviting fireplace. The interior design of Brick House Tavern + Tap consists of diverse seating and gathering areas where guests can pick multiple ways to enjoy their experience. In addition to a traditional dining room and bar area, Brick House also offers large communal tables and a section of leather recliners positioned in front of large HD TVs,
4
Table of Contents
where guests receive their own TV tray for dining. Each restaurant has a state-of-the-art entertainment package and provides guests with a clear line of sight to at least two HD TVs from every seat, making Brick House restaurants an ideal gathering place for sports enthusiasts. Outdoor seating is also available on the patio or around an open fire pit at nearly all locations. Both food and beverages are served by personable and engaging service staff. The typical Brick House restaurant is approximately 8,500 square feet and averages approximately 250 seats, which includes both traditional tables and unique seating options.
Our Business Strengths
We are focused on developing brands that have category leading and defendable positions within the casual dining segment. As a result, our core business strengths include the following:
Highly Differentiated Restaurant Brands. Our restaurants strive to provide a unique guest experience in a "come-as-you-are," upbeat and inviting restaurant environment. Both Joe's Crab Shack and Brick House Tavern + Tap are distinctively positioned restaurant brands, designed to have unique guest appeal. Joe's Crab Shack is a leading casual seafood brand that offers more than just a meal—a visit to Joe's is an event for the whole family. We provide a memorable, shareable "crab-cracking experience" where guests can roll up their sleeves and "break out of their shell" in a vacation-themed environment that offers an escape from the everyday. Brick House Tavern + Tap offers a comfortable, trend-forward yet timeless setting where guests can gather and share their passion for elevated, chef-inspired comfort food, while enjoying their favorite local, national or imported brand of beer and cheering for their favorite team. Each brand features food offerings and an atmosphere that attracts a diverse group of guests.
Authentic and Unique Menu Offerings. We offer high-quality, authentic seafood at Joe's Crab Shack and trend-forward, chef-inspired, contemporary tavern food at Brick House Tavern + Tap. Signature dishes at both brands feature craveable flavor profiles. Food menus are complemented by an assortment of beverages and distinctive cocktails, including Joe's Shark Bite and Brick House's tap-at-your-table Beer Bongs. Our culinary and beverage teams develop recipes and menu offerings for both Joe's and Brick House to ensure that all items feature distinctive twists on classic items, as well as items exclusive to each brand.
Memorable Guest Service. Our servers are friendly, attentive and responsive to the needs of our guests. In addition, our servers strive to provide guests an unforgettable dining experience. Joe's staff creates a fun-loving atmosphere through high-energy special occasion celebrations, while the staff at Brick House is focused on providing hospitable and personalized service to guests. We achieve this through experienced restaurant management teams that implement training programs specific to the menu and culture of each brand. We believe our distinctive guest service models provide an additional layer of brand differentiation.
Attractive Unit Economics. We have successfully increased our restaurant average unit volumes at a compounded annual growth rate of 4.2%, from $2.8 million in fiscal year 2010 to $3.1 million in fiscal year 2012. Over the same period of time, we have increased our restaurant-level profit margin (a non-GAAP financial measure) by 30 basis points from 16.6% to 16.9%.
Experienced Management Team. Our experienced team of industry veterans has an average of over 20 years of experience with restaurant companies such as T.G.I. Friday's, Darden, Applebee's, The Cheesecake Factory, Landry's and Sbarro. Our management team is led by Raymond A. Blanchette, III, our Chief Executive Officer, who joined us in 2007. Mr. Blanchette was a former President for Pick Up Stix and Executive Director of International Business at T.G.I. Friday's, both are brands operated by Carlson Restaurants Worldwide. Within twelve months of his arrival, Mr. Blanchette transformed our leadership team by recruiting several highly experienced restaurant
5
Table of Contents
executives. Despite a difficult economic environment, we have achieved 18 consecutive fiscal quarters of comparable restaurant sales growth, expanded our geographic footprint and improved our financial performance. From fiscal year 2010 to fiscal year 2012, we increased Adjusted EBITDA from $39.4 million to $52.0 million. The experience of our management team has allowed us to transform Joe's Crab Shack into a market leader while simultaneously developing and launching Brick House Tavern + Tap.
Our Strategy
Our strategies include the following:
Disciplined New Restaurant Growth. We believe there are meaningful opportunities to grow the number of restaurants of both Joe's Crab Shack and Brick House Tavern + Tap. We seek to maximize free cash flow for reinvestment into new restaurants at attractive returns. For both brands, we target new restaurant cash-on-cash returns, which we define as restaurant-level profit per store divided by total build-out cost (excluding capitalized interest) and cash pre-opening costs, to exceed 25%.
- •
- Joe's Crab Shack. We target steady state new restaurant average unit volumes of approximately $3.9 million for Joe's Crab Shack. Joe's has a narrowly defined new restaurant development strategy that predominantly targets (i) specific geographies with high population density and a propensity for seafood and (ii) locations in close proximity to regional and national tourist attractions. In fiscal year 2010, we developed a new restaurant prototype for Joe's Crab Shack, which has given Joe's a polished look and feel while maintaining the authentic crab shack ambiance. As of December 31, 2012, we have successfully opened 20 new restaurants using this new prototype and development strategy.
- •
- Brick House Tavern + Tap. We target steady state new restaurant average unit volumes of approximately $3.2 million for Brick House Tavern + Tap. We believe Brick House has significant growth potential and intend to focus future development in the top 50 designated market areas across the country. We initially opened a limited number of Brick House restaurants across a broad range of geographies with the intent of optimizing the brand prior to a continued build out.
For fiscal year 2013, we target opening as many as 14 new restaurants, the vast majority of which will be new Joe's Crab Shack restaurants, and converting as many as four existing restaurants to either a Joe's Crab Shack or a Brick House Tavern + Tap. Historically, our new restaurant growth had been substantially weighted towards new Joe's Crab Shack restaurants. However, with the impending acquisition of Mac Grill, we are evaluating our current restaurant development options.
Focus on Comparable Restaurant Sales Growth. We believe the following strategies have contributed to our successful growth and will allow us to generate comparable restaurant sales growth in the future:
- •
- Continuous Menu Innovation. We believe menu innovation is a critical factor in building guest loyalty and frequency. Both Joe's Crab Shack and Brick House Tavern + Tap have signature food and beverage offerings and a tradition of consistent menu innovation. New menu items are typically introduced at both brands twice a year and we test new menu items in restaurants across several diverse geographies before they are introduced into the broader base of restaurants. We have successfully introduced new and innovative items at both brands with such additions as Queen Crab, Skillet Paella and Mason Jars at Joe's Crab Shack and Brick Pizza, Meat and Cheese Board, Fried Stuffed Olives and Chicken & Waffles at Brick House Tavern + Tap. We plan to continue our tradition of menu innovation in the future.
- •
- Marketing our Restaurant Brands. We believe that our marketing strategies will continue to increase brand awareness while driving new guest trial and repeat guest visits. Our current
6
Table of Contents
marketing strategy for Joe's Crab Shack is supported by quantitative analysis that is designed to increase comparable restaurant sales and guest count, as well as build the brand for the future. We advertise using a national cable platform, which provides television advertising reach to the Joe's Crab Shack restaurants that are outside of the spot/local television markets and previews the Joe's Crab Shack brand in new development markets. These national marketing efforts are complemented by a combination of local marketing programs and social media. Brick House Tavern + Tap is primarily marketed through local marketing, digital media and social media outlets. We also promote both brands using other in-restaurant sales initiatives, which are typically focused on products and are not price point promotions.
- •
- Driving Guest Satisfaction. We believe our focus on menu innovation and guest service has contributed to Joe's Crab Shack's overall guest satisfaction. At Joe's Crab Shack, we use this third party research consisting of feedback from more than 40,000 guests, to develop operational initiatives, which we expect will continue to deliver high levels of guest satisfaction. We implemented a similar program at Brick House Tavern + Tap during the fourth quarter of fiscal year 2011. We believe improving guest satisfaction will continue to build loyalty and lead to increased sales from our guests.
Leverage our Scale to Enhance our Profitability. We believe we have a scalable infrastructure and can continue to expand our margins as we execute our strategy. While both brands have independent field operations, we use our shared services platform to handle many of the administrative functions for both brands. This leverageable structure should further our ability to enhance our profitability as we grow.
Menu and Menu Development
We are focused on continually elevating our unique and high-quality food and beverage offerings. Born out of consumer insights, our in-house Marketing department continually creates new chef-driven food and beverage products for both Joe's Crab Shack and Brick House Tavern + Tap, which are intended to exceed guest expectations. A variety of research tools are used to identify opportunities and evaluate current offerings, including a brand-tracker program, segmentation and core menu studies, brand screens, focus groups and in-restaurant surveys. We use a third party econometric consulting firm to provide statistical analysis around pricing, allowing us to make fact-based decisions on pricing and menu engineering.
Joe's Crab Shack
Joe's Crab Shack aims to offer signature, craveable items to its guests by continuously seeking to innovate our menu offerings. For example, we have dramatically shifted the menu mix at Joe's to focus on entrées featuring crab over the past three fiscal years. Crab is strategically positioned center stage in our menu through the Steampots and Crab in a Bucket categories, highlighting the importance of the menu item that defines Joe's Crab Shack. Joe's Steampot and Crab in a Bucket offerings allow guests to choose between four varieties of crabs (Queen, Snow, Dungeness and King) and whole lobster. Steampots, our bestselling item, are overflowing with generous portions of crab, other seafood, red potatoes, a fresh ear of corn and sausage seasoned to our guests' tastes. Our Crab in a Bucket entrées allow guests to pair their favorite crab selection with several distinctive preparations ranging from BBQ to Chesapeake Style or Garlic Herb. Joe's Crab Shack also leverages its crab-forward menu with other craveable crab items, including Made-From-Scratch Crab Cakes, Crab Nachos and Crazy-Good Crab Dip. As a result of this strategy, the percentage of entrées at Joe's featuring crab is currently over 50% of total food revenues. We believe this crab-focused menu mix has contributed to increases in guest satisfaction, comparable restaurant sales and gross profit dollars. In addition to our core crab-focused menu, Joe's also offers a broad range of entrées featuring a variety of seafood, including the Get Stuffed Snapper, Surf 'N Turf Burger and The Big Hook Up, as well as a wide range of traditional
7
Table of Contents
seafood entrées like the Fisherman's Platter. Joe's also offers several "out of water" options such as Pan Fried Cheesy Chicken and Whiskey Smoked Ribs. In addition, alcoholic beverages have significantly evolved to support the elevated food strategy, with vacation-style drinks, including the 'Shark Bite,' 'Category 5 Hurricane' and Mason Jar cocktails emerging as guests' top choices.
Joe's menu includes more than 29 items made with either Queen, Snow, Dungeness or King Crabs sourced from government regulated and sustainable fisheries. Our current menu offers 14 appetizers, including Made-From-Scratch Crab Cakes, Crab Nachos and Crazy-Good Crab Dip, and over 50 entrées, including Steampots, Crab in a Bucket, Skillet Paella, Stuffed Snapper and "out of water" options like Whiskey Smoked Ribs. For fiscal year 2012, Joe's average check was $23.80, lunch and dinner represented 27% and 73% of revenue, respectively, and revenue distribution was 86% food, 13% alcohol and 1% retail. Prices currently range from $6.79 to $46.99 for items on Joe's menu, including appetizers ordered as entrées and entrées that are frequently shared.
Menu implementation roll-outs occur in April/May and November. For all new menu roll-outs, new product launches are combined with a new menu design and updated pricing to reflect the current economic environment, as well as the current strategic marketing and creative plan. A menu change typically includes the introduction of four to seven new menu items while maintaining a balance of approximately 75 total menu items, including appetizers. Menu items are added or removed only after thorough testing and analysis, which includes guest satisfaction feedback.
Brick House Tavern + Tap
The Brick House Tavern + Tap food and beverage menu was created to make the brand feel aspirational while inherently approachable. We believe Brick House's elevated menu has changed the game for the bar and grill customer by offering an innovative premium food selection, along with approximately 80 varieties of beer.
Brick House offers its guests a broad selection of high-quality, chef-inspired, contemporary tavern food. Brick House's menu includes 17 appetizers and over 53 entrées. Unique handcrafted appetizers include Deviled Eggs, Meatloaf Sliders, Brick Pizza, Meat and Cheese Board and Fried Stuffed Olives. Brick House offers an array of burgers, including The Kobe, which is hand formed from high-quality American Wagyu beef. Guests can also choose from a broad selection of homemade entrées such as Drunken Chops, BBQ Baby Backs, Chicken & Waffles, and our Prime Rib Sandwich. A daily special menu encourages continued innovation with featured items like Prosciutto Wrapped Meatloaf and Shepherd's Pie. In addition, Brick House's Brick Burgers, including the Gun Show Burger and the Black & Bleu Burger, offer guests a distinct take on the traditional burger. Brick House's beverage selection includes imported and domestic beers along with hand-pulled cask beer. Beer is served in vessels unique to our industry such as 40s and Brick House's signature tap-at-your table beer bongs. All Brick House restaurants have a full bar that supports a variety of liquor drinks, wine and beer cocktails like the Shandy and Bee Sting as well as specialty cocktails like the Dark & Stormy, Moscow Mule and The Zombie. For fiscal year 2012, Brick House had four full day parts with lunch, afternoon, dinner and late night accounting for 19%, 25%, 39% and 17%, respectively, and Brick House's revenue distribution was approximately 54% food and 46% alcohol. Brick House's entrées range in price from $7.50 to $20.00, including appetizers ordered as entrées.
Continuous menu innovation is a key strategy for Brick House Tavern + Tap. We revise the Brick House Tavern + Tap menu twice a year with design, pricing and product offerings assessed before each menu implementation. New menu offerings are created to reinforce differentiation in our appetizers, entrées and beverage offerings as part of our effort to provide our guests with exceptional food. Testing of new menu items is executed in-restaurant before a new item is rolled out system-wide.
8
Table of Contents
Marketing
Over 80% of our marketing budget is invested in advertising through television (national cable, syndication and satellite), and digital advertising (including location-based media, on-demand media as well as in the social media such as Facebook and Twitter), with the balance of the budget being spent on marketing research, in-restaurant advertising, menus and production costs. Our marketing strategy is fact-based, using consumer insights to build brand affinity, and drive menu optimization. Our marketing expenditures were 4.4%, 4.4% and 4.9% of revenues for the fiscal years 2012, 2011 and 2010, respectively.
Joe's Crab Shack's advertising campaigns typically occur four times per year and are annual, seasonal and frequency-focused campaigns aimed at attracting guests and communicating new menu items through quality-focused messaging. We engage in a national cable advertising campaign for Joe's that currently consists of 24 weeks on air. We supplement Joe's national advertising with innovative media support, including digital advertising, social media outreach, location-based mobile media, weather-triggered advertising, and added-value media. The Joe's email club currently has approximately 450,000 members.
Brick House Tavern + Tap's marketing efforts are focused on menu innovation and local marketing initiatives. Local marketing includes events such as bike nights and pint nights. In April 2011, we added a Happy Hour program using local sports radio, in-house promotion through check attachments, posters and banners, and social media to support the rollout. The Brick House email club currently has approximately 60,000 members and has more than doubled since January 2011. Digital advertising and public relations have been used to support initiatives around March Madness, football season, menu launches, and live music series.
Guest Satisfaction
We use third party vendors to systematically gather, record and analyze key guest data for both of our brands. Our marketing research tools include:
- •
- AAU, or attitude, awareness and usage surveys;
- •
- third party guest satisfaction surveys;
- •
- annual core menu studies; and
- •
- TURF, or total unduplicated reach and frequency analysis.
We use the insights gathered from market research and data analytics to support strategic and tactical decisions. We embrace and rely on the use of market research as a tool to better understand our business and drive improved performance. These market research and data analytics provide us with critical guest feedback that guide us to change or refine individual menu items and implement operational initiatives to drive positive results on "Satisfaction," "Likely to Return" and "Likely to Recommend" metrics. Our AAU also guides us on changes to perception and awareness of the Joe's Crab Shack brand when considering shifts in our marketing and advertising strategies and tactics. We believe improved performance of our menu items, in our restaurants and in the effectiveness of our advertising is driven by understanding guest feedback and making changes accordingly.
In particular, we use a third party vendor to conduct detailed guest satisfaction surveys of our current guests and provide comparable industry satisfaction survey data for industry peers. Several surveys have been conducted since 2008 for Joe's Crab Shack and 11 other anonymous national and regional casual dining restaurant chains. While we are unable to confirm the extent to which the results of the surveys represents a comparison to our primary competitors, of the seven casual dining companies included in the population study using phone surveys, Joe's ranks second at 77% for overall satisfaction (top box only) versus the leading company at 80%.
9
Table of Contents
We have also initiated the same guest satisfaction survey for Brick House. Since its pilot testing starting December 2010, Brick House registered an 1,800 basis point improvement. Brick House is also currently undergoing a customer segmentation study.
Restaurant Operations and Shared Services
While both brands have independent field operations, we maintain a shared services platform, which handles many of the administrative functions for both brands. We believe this provides a scalable infrastructure, which will allow us to increase our profitability and continue to grow.
Joe's Crab Shack
Joe's Crab Shack operations are currently led by a brand president and three regional vice presidents. Each regional vice president oversees five to eight directors of operations, who typically manage seven to ten restaurants. Restaurant-level management at Joe's typically includes a general manager, an assistant general manager, a restaurant manager and flex managers, as required. The flex manager is an hourly employee that is trained during the off-season and may be called upon to perform a managerial role during the peak season. Each restaurant also has a brand ambassador that coordinates with members of the local community on behalf of Joe's for group sales and fundraisers. Our restaurant managers have bonus incentives that are based on sales and restaurant-level profits.
The Joe's Crab Shack training has three distinct levels. Our manager training is designed to fit all manager levels from the hourly flex manager to general manager. This comprehensive program is up to nine weeks in length, depending on the knowledge base and skill of the trainee and is both classroom and on-the-job based. Our certified trainer training is a special workshop designed to develop training specialists that reside in a restaurant or market that can oversee the training programs in that area. In order to be a certified trainer, candidates must be a fully validated hourly team member with recommendations from their general manager and director of operations. Hourly trainees are orientated by the general manager of their home restaurant with their program, schedule of activities and on-the-job training then set by the certified trainer. Through the training process, hourly trainees will attend classroom sessions, take examinations, watch videos and work alongside a certified trainer or a highly recommended individual that reports back to the certified trainer on performance and progress.
Brick House Tavern + Tap
The Brick House team is led by a brand president who oversees three directors of operations who, in turn, each manage five to seven restaurants. Typical restaurant management includes a general manager, service manager, back-of-the-house manager, whom we refer to as our "executive chef," and bar manager. Brick House Tavern + Tap restaurant managers have bonus incentives that are based on sales and restaurant-level profits.
Our training programs are seven weeks for all salaried managers and one to two weeks for all hourly positions. Our new hire training program is conducted by in-house trainers who have been certified by our restaurant lead trainer. At the end of training, there is a comprehensive written test and an on-the-job training review that must be completed before permission to work independently is granted.
Shared Services
Both Joe's Crab Shack and Brick House Tavern + Tap are supported by our Restaurant Support Center located in Houston, Texas. The Restaurant Support Center provides support services to both brands including marketing, menu development, accounting, real estate and development, human resources, legal, purchasing and information systems. We believe our Restaurant Support Center allows
10
Table of Contents
us to leverage our scale and share best practices across key functional areas that are common to both of our brands.
Site Selection
We focus our development strategy for Joe's Crab Shack on new locations in narrowly defined geographic regions with high population density and a propensity for seafood and in close proximity to regional and national tourist attractions. Our development strategy for Brick House Tavern + Tap is largely intended to focus on opening new locations in the top 50 designated market areas across the country.We have a dedicated development team that takes an analytical, data-driven approach to selecting new sites, which is largely based upon, but not limited to, the following criteria:
- •
- with respect to Joe's, attractiveness of locations from a regional/national and/or "destination market" perspective;
- •
- local market demographics and psychographic profiles;
- •
- characteristics similar to our most successful existing restaurants;
- •
- regional consumer trends and preferences;
- •
- local performance of nationally branded peers;
- •
- vehicle traffic patterns, visibility and access;
- •
- occupancy rates and other performance data from local hotels and other retail establishments, offices and other establishments that draw restaurant traffic;
- •
- available square footage, parking and lease economics;
- •
- local investment and operating costs; and
- •
- development and expansion constraints.
Restaurant Development and Economics
We have in-house real estate and development capabilities. During 2012, we opened 11 new restaurants (all Joe's), which included one conversion of an existing Brick House restaurant. Our capital investment, which includes build-out costs and cash pre-opening costs, amounted to $41.7 million for restaurants opened in 2012. Factors contributing to the fluctuation in capital investment include size of the property, geographical location, type of construction, cost of liquor and other licenses, and concessions received from landlords. A majority of the Joe's Crab Shack restaurants opened during 2012 were newly developed and built restaurants. Conversions of other existing restaurants to Joe's or Brick House typically require less capital investment than newly developed and built restaurants.
We target steady state new restaurant average unit volumes of approximately $3.9 million for Joe's Crab Shack and $3.2 million for Brick House, and cash-on-cash returns, which is defined as restaurant-level profit per store divided by total build-out costs and cash pre-opening costs, to exceed 25%. For fiscal year 2013, we target opening as many as 14 new restaurants, the vast majority of which will be new Joe's Crab Shack restaurants, and converting as many as four of our own restaurants. With the impending acquisition of Mac Grill, we are evaluating our current restaurant development options.
Purchasing and Distribution
Our dedicated purchasing team sources, negotiates and purchases all food supplies, operating supplies, and all restaurant equipment, furniture and fixtures. We have developed an extensive network of suppliers, with many relationships dating back over 20 years. We maintain relationships with many
11
Table of Contents
suppliers and have the ability to shift purchasing among suppliers, should more favorable terms become available in the market. In addition, we maintain multiple approved suppliers for all key components of our menu to mitigate risk and ensure supply. Suppliers are chosen based upon their ability to provide (i) a continuous supply of product that meets all safety and quality specifications, (ii) logistics expertise and freight management, (iii) product innovation, (iv) customer service, (v) transparency of business relationship and (vi) competitive pricing. Specified products are distributed to all restaurants through a national distribution company under a negotiated contract. This distributor delivers products directly to our restaurants either two or three times per week depending on restaurant requirements. Produce is purchased locally from an approved supplier network to maximize operating efficiencies and to ensure freshness and product quality.
Our top selling menu items are based on Queen Crab, Snow Crab, Dungeness Crab, King Crab, whole lobster and shrimp, which collectively accounted for approximately 49% of our total food purchases in fiscal year 2012. We have established long-term relationships with key seafood vendors and usually source product directly from producers to get advantageous product access at the most competitive prices. As market conditions warrant, we can use these relationships to lock in forward pricing for six to 18 months. Pricing agreements are entered into for a minimum volume of product and are structured around current and historical prices and the projected menu mix. We employ a team at the Restaurant Support Center that is solely responsible for actively managing these contracts, which typically roll on a continuous basis.
In addition to using fixed price contracts, our Joe's menu provides inherent flexibility to help manage food cost. Crab is deliberately placed center stage as a defining item to the Joe's experience. Joe's Steampot and Crab in a Bucket offerings allow guests to choose between four varieties of crabs (Queen, Snow, Dungeness and King) and lobster. Each of these species has multiple fisheries and seasons. In addition to the ability to direct guests to other crab varieties, Steampots, the top selling item on the menu, provide additional product flexibility. The Steampot is a variety of both shellfish and non-seafood items served together in a simmering pot that have individual ingredients that can be adjusted based on prevailing market prices and general input availability. We believe this strategy greatly reduces our reliance on individual inputs and is largely opaque to the guest. In addition, should input prices increase, we have the ability to adjust menu prices very quickly, even within a few days, if appropriate.
Crab is harvested during seasons and in accordance with regulations which are determined by various regulatory agencies. Crab is processed, frozen and shipped to either cold storage or to the master distributor. The master distributor fulfills restaurant orders by delivering frozen crab, which our restaurants store in a frozen state until preparation for service to the guest. We believe our strong supplier relationships, coupled with the inherent flexibility of our menu, minimizes our exposure to seafood supply chain shortages and market price increases. Cost of sales as a percentage of revenues for fiscal year 2012, 2011 and 2010 were 31.3%, 31.5%, and 29.6%, respectively. In fiscal year 2012, our largest supplier accounted for 20% of our total food purchases.
Food Safety
We have food safety and quality assurance programs which are designed to ensure that our restaurant team members and managers are trained in proper food handling techniques. Our restaurants operate in various municipalities, which require us to have systems in place to adhere to various locals standards. With the goal of achieving industry leadership in the area of restaurant food safety and sanitation, we have implemented a national operating standard, which includes comprehensive, unannounced inspections by a third party service provider. Restaurant managers receive feedback and coaching as an integral part of the semi-annual visits to each restaurant.
12
Table of Contents
Our operations, procurement and culinary teams work in close coordination to exceed industry standards. Our procurement team works to ensure that product fulfillment fits to the specifications set by our culinary experts. This process requires that our seafood products are caught, produced or processed in environments that meet and often exceed legal requirements. Our culinary team works to use products that are safe for processing and handling in our restaurants' environment. Our training team provides both proprietary and non-proprietary materials and programs to educate salaried and hourly team members, while our operations team implements programs and sets standards for measurement of performance to ensure consistent performance at our restaurants.
We require all of our suppliers to adhere to strict Hazard Analysis and Critical Control Points, or HACCP, quality control and environmental standards in the development, harvest, catch, and production of food products. We require chemical, physical and microbiological testing of seafood and other commodities for conformance to safety and quality requirements.
All potential suppliers are required to meet our specified minimum standards to achieve approved supplier status for the Ignite system.
Information Systems and Restaurant Reporting
All of our restaurants use computerized management information systems, which are designed to improve operating efficiencies, provide restaurant and Restaurant Support Center management with timely access to financial and operating data and reduce administrative time and expense. Our integrated management information systems platform is a combination of in-house and outsourced systems. The major management information systems are divided by function:
- •
- restaurant point-of-sale;
- •
- restaurant back-of-house;
- •
- financial;
- •
- payroll/human resources; and
- •
- internal operational reports.
All of our restaurants are equipped with computerized point-of-sale, or POS, and back-of-house systems. We use a third party vendor for our restaurant POS System. We have the ability to generate weekly and period-to-date operating results on a company-wide, brand-wide, regional and/or individual restaurant basis. Together, this allows us to closely monitor sales, food and beverage costs and labor and operating expenses at each of our restaurants. Our system was updated in 2010 and runs on non-proprietary hardware with open architecture, intuitive touch screen interface and integrated credit and gift card processing. Our back-of-house systems include a kitchen display system for many of our restaurants. These systems also run on non-proprietary hardware with open architecture.
We contract with a third party service provider for outsourced business process services that include accounts payable, general ledger and internal financial reporting. Our third party service solution provides a complete web-based reporting package allowing for detailed profit and loss visibility at the restaurant-level. Our accounting department prepares period and year-to-date profit and loss statements, which provide a detailed analysis of sales and costs, and which are compared to budgets and to prior periods. Additionally, we use outsourced payroll processing and human resources information systems. These outsourced systems support standard payroll functions as well as hiring, promotion, and benefits administration.
13
Table of Contents
Employees
As of December 31, 2012, we employed approximately 9,700 employees, of whom 130 were Restaurant Support Center, executive management and multi-unit restaurant management personnel, 461 were restaurant-level management personnel and the remainder were hourly restaurant personnel. During 2012, total employee counts ranged from 12,800 during peak summer season to 9,700 during the winter. None of our employees are covered by collective bargaining agreements, and we believe we have good relations with our employees.
Competition
The restaurant industry is fragmented and intensely competitive. We believe guests make their dining selection based on a variety of factors such as menu offering, taste, quality and price of food offered, perceived value, service, atmosphere, location and overall dining experience. Our competitive landscape includes nationally-branded restaurant chains as well as regional and local restaurant operators.
For Joe's Crab Shack, our primary competitors in the casual seafood segment include Red Lobster, Bonefish Grill, Landry's Seafood and Bubba Gump Shrimp Company. Joe's is America's only national crab house. Red Lobster is our only large-scale, nationally branded seafood competitor. Both brands also compete with a broader range of other casual dining restaurants including newer brands such as BJ's Restaurants, Yard House, Cheesecake Factory, Bravo Brio and Buffalo Wild Wings, as well as traditional brands such as Applebee's, Chili's, T.G.I. Friday's, Texas Roadhouse and Outback Steakhouse.
Seasonality
There is a seasonal component to Joe's Crab Shack's business which typically peaks in the summer months (June, July and August) and slows in the winter months (November, December, January). Because of the seasonality of our system-wide business, results for any fiscal quarter are not necessarily indicative of the results that may be achieved for future fiscal quarters or for the full fiscal year.
Trademarks and Service Marks
Our registered trademarks and service marks include Joe's Crab Shack® and logo design, and Brick House Tavern + Tap® and logo design. We have used or intend to use all the foregoing marks in connection with our restaurants. We believe that our trademarks and service marks have significant value and are important to our brand-building efforts and identity and the marketing of our restaurant brand.
Licensing Arrangements
In addition to our Joe's Crab Shack restaurant operations, we have a licensing agreement to provide branded seafood options under the Joe's Crab Shack brand at various retailers. We receive royalty revenues in connection with the license of the Joe's Crab Shack brand name based on a percentage of product sales, subject to a minimum royalty requirement. We believe that this initiative further enhances Joe's Crab Shack brand awareness to prospective guests of our Joe's Crab Shack restaurants.
We also receive royalty revenues from a license granted to Landry's in connection with two Joe's Crab Shack restaurants. The license allows Landry's to use certain of our intellectual property, including the Joe's Crab Shack name, to operate its two restaurants. Under the license, we receive royalty revenues based on a percentage of sales at such restaurants. We do not receive any revenues from the operation of the restaurants other than license royalty revenues, and such restaurants are
14
Table of Contents
operated by Landry's entirely independent from our Joe's Crab Shack restaurants. Although Landry's is required to adhere to certain minimum quality standards under the license, including with respect to menu, promotional materials and the specification and preparation of food and beverage items, we do not have operational control over such restaurants, and they may not be operated in a manner consistent with the standards we uphold at our restaurants. Landry's closed one of its Joe's Crab Shack restaurants in February 2013 and has notified us that they intend to close the second restaurant in April 2013.
Government Regulation
We are subject to a variety of federal, state and local laws. Each of our restaurants is subject to permits, licensing and regulation by a number of government authorities, relating to alcoholic beverage control, health, safety, sanitation, building and fire codes, including compliance with the applicable zoning, land use and environmental laws and regulations. Difficulties in obtaining or failure to obtain required licenses or approvals could delay or prevent the development of a new restaurant in a particular area.
Alcoholic beverage control regulations require each of our restaurants to apply to a state authority and, in certain locations, county or municipal authorities for a license that typically, must be renewed annually and may be revoked or suspended for cause at any time. Alcoholic beverage control regulations affect many aspects of restaurant operations, including minimum age of patrons and employees, hours of operation, advertising, trade practices, wholesale purchasing, inventory control and handling, storage and dispensing of alcoholic beverages.
We are subject in certain states to "dram shop" statutes, which generally provide a person injured by an intoxicated person the right to recover damages from an establishment that wrongfully served alcoholic beverages to the intoxicated person. We carry liquor liability coverage as part of our comprehensive general liability insurance policy.
Our restaurant operations are also subject to federal and state laws governing employment (including the Fair Labor Standards Act of 1938, the Immigration Reform and Control Act of 1986), regarding such matters as the minimum hourly wage, unemployment tax rates, sales tax and similar matters. Significant numbers of our service, food preparation and other personnel are paid at rates related to the federal minimum wage, which currently is $7.25 per hour. The tip credit allowance is the amount an employer is permitted to assume an employee receives in tips when the employer calculates the employee's hourly wage for minimum wage compliance purposes.
In addition, our restaurants must comply with the applicable requirements of the ADA and related state accessibility statutes. Under the ADA and related state laws, we must provide equivalent service to disabled persons and make reasonable accommodation for their employment, and when constructing or undertaking significant remodeling of our restaurants, we must make those facilities accessible.
We are also subject to laws and regulations relating to nutritional content, nutritional labeling, product safety, menu labeling and other regulations imposed by the FDA. Regulations relating to nutritional labeling may lead to increased operational complexity and expenses and may impact our sales.
Litigation
Occasionally, we are a defendant or otherwise involved in lawsuits arising in the ordinary course of our business including claims resulting from "slip and fall" accidents, "dram shop" claims, construction-related disputes, employment-related claims, and claims from guests or employees alleging illness, injury or other food quality, health or operational concerns. When the potential liability can be estimated and the loss is considered probable, we record the estimated loss. Due to uncertainties
15
Table of Contents
related to the resolution of lawsuits and claims, the ultimate outcome may differ from our estimates. As of the date of this report, we do not believe the potential exposure with respect to any of these pending lawsuits and claims will have a material adverse effect on our consolidated financial position, results of operations or cash flows.
Available Information
We maintain a website with the addresswww.igniterestaurants.com. On our website, we make available at no charge our annual report on Form 10-K, quarterly reports on Form 10-Q, current reports on Form 8-K, all amendments to those reports, and our proxy statement, as soon as reasonable practicable after these materials are filed with or furnished to the SEC. Our filings are also available on the SEC's website atwww.sec.gov. The public may read and copy any materials that we file with the SEC at the SEC's Public Reference Room at 100 F Street, NE, Washington, D.C. 20549. The public may also obtain information on the operation of the Public Reference Room by calling the SEC at 1-800-SEC-0330. The contents of our website are not incorporated by reference into this Form 10-K.
Item 1A. RISK FACTORS.
You should carefully consider the following factors, which could materially affect our business, financial condition or results of operations. You should read these Risk Factors in conjunction with "Management's Discussion and Analysis of Financial Condition and Results of Operations" in Item 7 and our Consolidated Financial Statements and related notes in Item 8.
Risks Related to Our Business
You should not rely on past increases in our comparable restaurant sales or our average unit volumes as an indication of our future results of operations because they may fluctuate significantly.
A number of factors have historically affected, and will continue to affect, our comparable restaurant sales and average unit volumes, including, among other factors:
- •
- our ability to execute our business strategy effectively;
- •
- unusually strong initial sales performance by new restaurants;
- •
- competition;
- •
- consumer trends and confidence;
- •
- introduction of new menu items; and
- •
- regional and national macroeconomic conditions.
Our comparable restaurant sales and average unit volumes may not increase at rates achieved over the past several fiscal years. Changes in our comparable restaurant sales and average unit volumes could cause the price of our common stock to fluctuate substantially.
If we fail to execute our growth strategy, which largely depends on our ability to open new restaurants that are profitable, our business could suffer.
One of the key means of achieving our growth strategies will be through opening new restaurants and operating those restaurants on a profitable basis. We expect this to be the case for the foreseeable future. For fiscal year 2013, we target opening as many as 14 new Joe's Crab Shack and/or Brick House restaurants. Because of the economic downturn, there are fewer new developments, such as shopping centers, being constructed, which reduce the supply of new restaurant locations. As a result, competition for prime locations is intense and the prices commanded for such locations have remained high. There is no guarantee that a sufficient number of locations will be available in desirable areas or
16
Table of Contents
on terms that are acceptable to us in order to achieve our growth plan. Delays or failures in opening new restaurants, or achieving lower than expected sales in new restaurants, could materially adversely affect our growth strategy. Once we have identified suitable restaurant sites, our ability to open new restaurants successfully and on the development schedule we anticipate will also depend on numerous other factors, some of which are beyond our control, including, among other items, the following:
- •
- our ability to secure suitable new restaurant sites;
- •
- our ability to control construction and development costs of new restaurants;
- •
- our ability to negotiate suitable lease terms;
- •
- our ability to secure required governmental approvals and permits in a timely manner and any changes in local, state or federal laws and regulations that adversely affect our costs or ability to open new restaurants;
- •
- the cost and availability of capital to fund construction costs and pre-opening expenses;
- •
- consumer acceptance of our new restaurants; and
- •
- limitations under our current and future credit facilities.
Although we target specified new restaurant average unit volumes, cash on cash returns and capital investment for both Joe's and Brick House, new restaurants may not meet these targets. Any restaurant we open may not be profitable or achieve operating results similar to those of our existing restaurants. We may not be able to respond on a timely basis to all of the changing demands that our planned expansion will impose on management and on our existing infrastructure, or be able to hire or retain the necessary management and operating personnel. Our existing restaurant management systems, financial and management controls and information systems may not be adequate to support our planned expansion. Our ability to manage our growth effectively will require us to continue to enhance these systems, procedures and controls and to locate, hire, train and retain management and operating personnel.
There is also the potential that some of our new restaurants will be located near areas where we have existing restaurants, thereby reducing the revenues of such existing restaurants.
Macroeconomic conditions could adversely affect our ability to increase the sales and profits of existing restaurants or to open new restaurants.
Although the global economy showed signs of recovery in 2012, the United States may continue to suffer from depressed economic activity. Recessionary economic cycles, higher fuel and other energy costs, lower housing values, low consumer confidence, inflation, increases in commodity prices, higher interest rates, higher levels of unemployment, higher consumer debt levels, higher tax rates and other changes in tax laws or other economic factors that may affect discretionary consumer spending could adversely affect our revenues and profit margins and make opening new restaurants more difficult. Our guests may have lower disposable income and reduce the frequency with which they dine out. This could result in reduced guest traffic, reduced average checks or limitations on the prices we can charge for our menu items, any of which could reduce our sales and profit margins. In addition, many of our Joe's Crab Shack restaurants are located in areas that we consider tourist or vacation destinations. Therefore, in those locations, we depend in large part on vacation travelers to frequent our Joe's Crab Shack restaurants, and such destinations typically experience a reduction in visitors during economic downturns, thereby reducing the potential guests that could visit our restaurants. Also, businesses in the shopping vicinity in which some of our restaurants are located may experience difficulty as a result of macroeconomic trends or cease to operate, which could, in turn, further negatively affect guest traffic at our restaurants. All of these factors could have a material adverse impact on our results of operations and growth strategy.
17
Table of Contents
Our success depends on our ability to compete with many other restaurants.
The restaurant industry is intensely competitive, and we compete with many well-established restaurant companies on the basis of food taste, price of products offered, guest service, atmosphere, location and overall guest experience. Our competitors include restaurant chains and individual restaurants that range from independent local operators to well-capitalized national and regional restaurant companies. Our Joe's Crab Shack restaurants compete against other casual seafood restaurants, including national and regional chains and local seafood restaurants, as well as against casual dining restaurants that provide a different type of food. Our Brick House Tavern + Tap restaurants compete against casual restaurants in the bar and grill segment and restaurants in the casual dining segment.
Some of our competitors have substantially greater financial and other resources than we do, which may allow them to react to changes in the restaurant industry better than we can. Other competitors are local restaurants that in some cases have a loyal guest base and strong brand recognition within a particular market. As our competitors expand their operations or as new competitors enter the industry, we expect competition to intensify. Should our competitors increase their spending on advertising and promotions, we could experience a loss of guest traffic to our competitors. Also, if our advertising and promotions become less effective than those of our competitors, we could experience a material adverse effect on our results of operations. We also compete with other restaurant chains and other retail businesses for quality site locations, management and hourly employees.
Our failure to establish and maintain effective disclosure controls and procedures and internal controls over financial reporting contributed to the restatement of our previously issued financial statements. If we fail to remediate material weaknesses in our internal controls over financial reporting or otherwise establish and maintain effective internal controls over financial reporting and disclosure controls and procedures, we may have additional material misstatements in our financial statements and we may not be able to report our financial results in a timely manner.
Our CEO and CFO performed an evaluation of the effectiveness of the design and operation of our disclosure controls and procedures and concluded that they were not effective as of December 31, 2012 as a result of the material weaknesses in our internal controls over financial reporting described below. A "material weakness" is a deficiency, or combination of deficiencies, in internal controls such that there is a reasonable possibility that a material misstatement of our financial statements will not be prevented or detected in a timely basis. The following material weaknesses were identified in connection with the restatement of our previously issued financial statements:
- •
- lack of sufficient qualified accounting and tax personnel;
- •
- lack of adequate supervision;
- •
- lack of effective controls over the accounting for leases; and
- •
- lack of effective controls over the existence, completeness and accuracy of fixed assets and related depreciation and amortization expense.
These material weaknesses in our internal controls over financial reporting contributed to the restatement of our previously issued financial statements. We are taking steps to remediate the identified material weaknesses and we will continue to review our internal controls over financial reporting in the areas identified above and other areas and update our accounting policies and procedures accordingly. However, there is no guarantee that additional material weaknesses will not be identified in the future or that any of these measures will ensure that we implement and maintain adequate controls over our financial processes and reporting in the future. Any failure to implement new or improved controls or difficulties encountered in their implementation could cause us to fail to meet our reporting obligations. In particular, if the material weaknesses described above are not
18
Table of Contents
remediated, they could result in a misstatement of our accounts and disclosures that could result in a material misstatement to our annual or interim consolidated financial statements in future periods that would not be prevented or detected. If our financial statements are not timely or accurate, then, in addition to the risks described above, investors may lose confidence in our reported information and our ability to prevent fraud, we could be delisted from NASDAQ and we could lose our ability to access capital markets. For further discussion of our disclosure controls and procedures and internal controls over financial reporting, see Item 9A of Part II, "Controls and Procedures."
We have not completed the formal evaluation of our internal controls over financial reporting pursuant to Section 404 of the Sarbanes-Oxley Act of 2002 because we are not currently required to do so. Our first Section 404 report will be prepared in connection with our Annual Report on Form 10-K for the fiscal year ending December 30, 2013. We cannot assure you that we will not uncover additional material weaknesses as of December 30, 2013 following this review. Also, until fully remediated, the control deficiencies outlined above could result in a material misstatement to our future annual or interim financial statements that would not be prevented or detected. In addition, our independent registered public accounting firm will not be required to formally attest to the effectiveness of our internal controls over financial reporting pursuant to Section 404 until the later of the fiscal year ending December 30, 2013, or the date we are no longer an "emerging growth company" as defined in the JOBS Act, if we continue to take advantage of the exemptions contained in the JOBS Act. We expect that we will remain an "emerging growth company" until the earliest of (i) the last day of our fiscal year following the fifth anniversary of our initial public offering (IPO); (ii) the last day of our fiscal year in which we have annual gross revenue of $1.0 billion or more; (iii) the date on which we have, during the previous three-year period, issued more than $1.0 billion in non-convertible debt; and (iv) the date on which we are deemed to be a "large accelerated filer," which will occur at such time as we have (1) an aggregate worldwide market value of common equity securities held by non-affiliates of $700 million or more as of the last business day of our most recently completed second fiscal quarter, (2) been required to file annual, quarterly and current reports under the Exchange Act of 1934, as amended, or the Exchange Act, for a period of at least 12 calendar months, and (3) filed at least one annual report pursuant to the Exchange Act. As a result, we may qualify as an "emerging growth company" until as late as May 10, 2017. At such time, our independent registered public accounting firm may issue a report that is adverse in the event it is not satisfied with the level at which our controls are documented, designed or operating.
Legal proceedings or regulatory actions commenced in connection with the restatement could require us to incur significant costs and have an adverse impact on our business, financial condition and results of operations.
As a result of the restatement of our previously issued financial statements, a putative class action complaint was filed in the U.S. District Court for the Southern District of Texas against us, certain of our current directors and officers and the underwriters in the IPO. The plaintiffs allege that all the defendants violated Section 11 of the Securities Act of 1933 (the "Securities Act"), the underwriters violated Section 12 of the Securities Act and certain of our directors and officers have control person liability under Section 15 of the Securities Act, based on allegations that in light of the July 18, 2012 restatement announcement, our IPO registration statement and prospectus contained untrue statements of material facts, omitted to state other facts necessary to make the statements made not misleading, and omitted to state material facts required to be stated therein. Plaintiffs seek unspecified compensatory damages and attorneys' fees and costs. In addition to the IPO litigation, we may become subject to additional scrutiny from, or formal investigations by, regulatory authorities such as the SEC or additional civil litigation, all of which could require us to incur significant legal expenses, pay fines or other penalties or damages and divert time, money and other valuable resources away from our operations and, thereby, harm our business.
19
Table of Contents
Changes in food and supply costs, including the cost of crab, could adversely affect our results of operations.
Our profitability depends in part on our ability to anticipate and react to changes in food and supply costs. Operating margins for our restaurants are subject to changes in the price and availability of food commodities, including crab, shrimp, lobster and other seafood. In fiscal year 2012, Queen Crab, Snow Crab, Dungeness Crab, King Crab, lobster and shrimp accounted for approximately 49% of our total food purchases. Any increase in food prices, particularly for these food items, could adversely affect our operating results. In addition, we are susceptible to increases in food costs as a result of factors beyond our control, such as weather conditions (including hurricanes), oil spills, fisherman strikes, food safety concerns, costs of distribution, product recalls and government regulations. Furthermore, the introduction of or changes to tariffs on seafood, such as imported crab and shrimp or other food products, could increase our costs and possibly impact the supply of those products. We cannot predict whether we will be able to anticipate and react to changing food costs by adjusting our purchasing practices and menu items and prices, and a failure to do so could adversely affect our operating results. In addition, because our menu items are moderately priced, we may not seek to or be able to pass along price increases to our guests. If we adjust pricing there is no assurance that we will realize the full benefit of any adjustment due to changes in our guests' menu item selections and guest traffic.
Brick House is a newer and still evolving brand and our plans to expand Brick House may not be successful.
While Joe's and Brick House are subject to the risks and uncertainties described herein, there is an enhanced level of risk and uncertainty related to the expansion of Brick House, our newer brand. While Brick House has grown to 15 locations since its founding in 2008, it is still evolving and has not yet proven its long-term growth potential.
Initially, we opened Brick House restaurants across a broad range of geographies with the intent of optimizing the brand prior to a continued build out. We continue to incorporate key insights into our new restaurant rollout plans. There can be no assurance that the enhancements we intend to implement as part of the brand optimization process will be successful or that additional new restaurant growth will occur. Brick House will be subject to the risks and uncertainties that accompany any emerging restaurant brand. If Brick House fails to expand and/or continue generating profits, our operating results could suffer.
Food safety and food-borne illness concerns may have an adverse effect on our business.
Food safety is a top priority, and we dedicate substantial resources to ensure that our guests enjoy safe, quality food products. However, food-borne illnesses, such as salmonella, E. coli, hepatitis A, trichinosis or "mad cow disease," and food safety issues have occurred in the food industry in the past, and could occur in the future. In addition, publicity regarding certain illnesses and contaminations related to seafood, including high levels of mercury or other carcinogens, oil contaminations, vibrio vulnificus and the Norwalk virus could affect consumer preferences and the consumption of seafood. Any report or publicity linking us to instances of food-borne illness or other food safety issues, including food tampering or contamination, could adversely affect our brands and reputation as well as our revenues and profits. Even instances of food-borne illness, food tampering or food contamination occurring solely at restaurants of our competitors could result in negative publicity about the food service industry or seafood restaurants generally and adversely impact our sales.
In addition, our reliance on third-party food suppliers and distributors increases the risk that food-borne illness incidents could be caused by factors outside of our control and that multiple locations would be affected rather than a single restaurant. Although we inspect food products when they are delivered to us, we cannot assure that all food items are properly maintained during transport throughout the supply chain and that our employees will identify all products that may be spoiled and
20
Table of Contents
should not be used in our restaurants. New illnesses resistant to any precautions may develop in the future, or diseases with long incubation periods could arise, such as "mad cow disease," which could give rise to claims or allegations on a retroactive basis. In addition, our industry has long been subject to the threat of food tampering by suppliers, employees or guests, such as the addition of foreign objects in the food that we sell. Reports, whether or not true, of injuries caused by food tampering have in the past severely injured the reputations and brands of restaurant chains in the quick service restaurant segment and could affect us in the future as well. If our guests become ill from food-borne illnesses, we could also be forced to temporarily close some restaurants. Furthermore, any instances of food contamination, whether or not at our restaurants, could subject us or our suppliers to a food recall pursuant to the Food and Drug Administration Food Safety Modernization Act.
Changes in consumer preferences could harm our performance.
Consumer preferences often change rapidly and without warning, moving from one trend to another among many product or retail concepts. We also depend on trends regarding away-from-home dining. Consumer preferences towards away-from-home dining or certain food products might shift as a result of, among other things, health concerns or dietary trends related to cholesterol, carbohydrate, fat and salt content of certain food items, including crab or other seafood items, in favor of foods that are perceived as more healthy. Our menu is currently comprised of crab and other menu items and a change in consumer preferences away from these offerings would have a material adverse effect on our business. Negative publicity over the health aspects of such food items may adversely affect demand for our menu items and could result in lower guest traffic, sales and results of operations.
If we fail to continue to develop and maintain our restaurant brands, our business could suffer.
We believe that maintaining and developing our restaurant brands are critical to our success and our growth strategy, and that the importance of brand recognition is significant as a result of competitors offering products similar to our products. We have made significant marketing expenditures to create and maintain brand loyalty as well as to increase awareness of our brands. If our brand-building strategy is unsuccessful, these expenses may never be recovered, and we may be unable to increase our future sales or implement our business strategy.
Any incident that erodes consumer affinity for our brands could significantly reduce their respective values and damage our business. If guests perceive or experience a reduction in food quality, service or ambiance, or in any way believe we failed to deliver a consistently positive experience, our brand value could suffer and our business may be adversely affected.
In addition, in connection with our acquisition by JCS Holdings, LLC, our former parent, we granted a license to Landry's that allows Landry's to use certain of our intellectual property, including the Joe's Crab Shack name, to operate two Joe's Crab Shack restaurants. Although Landry's is required to adhere to certain minimum quality standards under the license, including with respect to menu, promotional materials and the specification and preparation of food and beverage items, we do not have operational control over the two restaurants. As a result, such Joe's Crab Shack restaurants owned and operated by Landry's may not be operated in a manner consistent with the standards we uphold at our restaurants. If such restaurants do not maintain operational standards consistent with the standards we demand of our restaurants, the image and brand reputation of Joe's Crab Shack may suffer and our business may be materially affected. Landry's has closed one of its Joe's Crab Shack restaurants it operated and has notified us that they intend to close the second restaurant in April 2013.
The impact of new restaurant openings could result in fluctuations in our financial performance.
As discussed above, for fiscal year 2013, we target opening as many as 14 new restaurants and may convert as many as four additional restaurants. New restaurants typically experience an adjustment
21
Table of Contents
period before sales levels and operating margins normalize. When our new restaurants open, they typically encounter startup costs, but also significant guest traffic and, therefore, high sales in their initial months. However, over time, these new restaurants may experience a decrease in guest traffic and sales compared to their opening months. Accordingly, sales achieved by new or converted restaurants may not be indicative of future operating results. Also, due to the foregoing factors, results for any one fiscal quarter are not necessarily indicative of results to be expected for any other fiscal quarter or for a full fiscal year.
We rely heavily on certain vendors, suppliers and distributors, which could adversely affect our business.
Our ability to maintain consistent price and quality throughout our restaurants depends in part upon our ability to acquire specified food products and supplies in sufficient quantities, especially with respect to shellfish such as crab. While our seafood offerings are generally caught from government regulated fisheries, crab and other fish are caught in the wild, which could cause volatility in supply. In some cases, we may have only one supplier or a limited number of suppliers for a particular food product. We cannot make assurances regarding the continued supply of our food items since we do not have control over the businesses of our suppliers. Furthermore, such food items are perishable, and we cannot assure that such items will be delivered by such third parties in appropriate condition for sale in our restaurants. In addition, we rely on one primary distributor to deliver products to our restaurants. If any of these vendors, our other suppliers or our distributor is unable to fulfill their obligations, or if we are unable to find replacement providers in the event of a supply or service disruption, we could encounter supply shortages and incur higher costs to secure adequate supplies, which would materially harm our business.
In addition, we use various third-party vendors to provide, support and maintain most of our management information systems. We also outsource certain accounting, payroll and human resources functions to business process service providers. Such third-party vendors may not be able to handle the volume of activity or perform the quality of service necessary for our operations. The failure of such vendors to fulfill their support and maintenance obligations or service obligations could disrupt our operations. Furthermore, the outsourcing of certain of our business processes could negatively impact our internal control processes.
Approximately 43% of our restaurants are located in California, Texas and Florida and, as a result, we are sensitive to economic and other trends and developments in those states.
As of December 31, 2012, 62 of our 144 restaurants were spread across California (13), Texas (34) and Florida (15). As a result, we are particularly susceptible to adverse trends and economic conditions in those states, including their labor markets. In addition, given our geographic concentration in these states, negative publicity regarding any of our restaurants in such States could have a material adverse effect on our business and operations, as could other occurrences in these regions such as local competitive changes, changes in consumer preferences, local strikes, new or revised laws or regulations, energy shortages or increases in energy prices, droughts, hurricanes, fires, floods or other natural disasters.
In addition, many of our restaurants in Florida and California are located in areas that we consider tourist or vacation destinations. Therefore, we depend in large part on vacation travelers to frequent our restaurants in these locations. Any change in consumer preferences away from Florida and California as their choice of destination could have a material adverse effect on our business and results of operation.
22
Table of Contents
Allergy concerns relating to crab and other shellfish items could affect consumer preferences and could negatively impact our results of operations.
Many of our food items contain crab or other shellfish items. In recent years, there has been negative publicity concerning, shellfish and other food allergies. This negative publicity, as well as any other negative publicity concerning food products we serve, may adversely impact demand for our food and could result in a decrease in guest traffic to our restaurants. Owing to the severe nature of certain shellfish allergies, shellfish have recently been identified by the U.S. Food and Drug Administration as a significant allergen. The introduction of seafood and shellfish labeling regulations to the restaurant industry could cause us to modify the operations or atmosphere of our restaurants, which could adversely affect our business and brand differentiation.
Health concerns arising from outbreaks of viruses may have a material adverse effect on our business.
The United States and other countries have experienced, and may experience in the future, outbreaks of viruses, such as H1N1, avian influenza, SARS and various other forms of influenza. To the extent that a virus is transmitted by human-to-human contact, our employees or guests could become infected, or could choose to, or be advised to avoid gathering in public places and avoid eating in restaurant establishments, which could adversely affect our business.
Information technology system failures or breaches of our network security could interrupt our operations and adversely affect our business.
We rely on our computer systems and network infrastructure across our operations, including point-of-sale processing at our restaurants. Our operations depend upon our ability to protect our computer equipment and systems against damage from physical theft, fire, power loss, telecommunications failure or other catastrophic events, as well as from internal and external security breaches, viruses, worms and other disruptive problems. Any damage or failure of our computer systems or network infrastructure that causes an interruption in our operations could have a material adverse effect on our business and subject us to litigation or actions by regulatory authorities. While we utilize our personnel, as well as a variety of hardware and software, to monitor our systems, controls, firewalls and encryption and intend to maintain and upgrade our security technology and operational procedures to prevent damage, breaches or other disruptive problems, there can be no assurance that these security measures will be successful.
We may incur costs resulting from breaches of security of confidential guest information related to our electronic processing of credit and debit card transactions.
The majority of our restaurant sales are by credit or debit cards. Other retailers have experienced security breaches in which credit and debit card information has been stolen. Although we use secure private networks to transmit confidential information, third parties may have the technology or know-how to breach the security of the guest information transmitted in connection with credit and debit card sales, and our security measures and those of technology vendors may not effectively prohibit others from obtaining improper access to this information. If a person is able to circumvent these security measures, he or she could destroy or steal valuable information or disrupt our operations. We may in the future become subject to claims for purportedly fraudulent transactions arising out of the actual or alleged theft of credit or debit card information, and we may also be subject to lawsuits or other proceedings relating to these types of incidents. Any such claim or proceeding could cause us to incur significant unplanned expenses, which could have an adverse impact on our financial condition, results of operations and cash flows. Further, adverse publicity resulting from these allegations could significantly harm our reputation and may have a material adverse effect on us and our restaurants.
23
Table of Contents
We depend upon our executive officers and may not be able to retain or replace these individuals or recruit additional personnel, which could harm our business.
We believe that we have benefited substantially from the leadership and experience of our executive officers, including our Chief Executive Officer, Raymond A. Blanchette, III. The loss of the services of any of our executive officers could have a material adverse effect on our business and prospects, as we may not be able to find suitable individuals to replace such personnel on a timely basis. In addition, any such departure could be viewed in a negative light by investors and analysts, which could cause our common stock price to decline. As our business expands, our future success will depend greatly on our continued ability to attract and retain highly skilled and qualified executive-level personnel. Our inability to attract and retain qualified executive officers in the future could impair our growth and harm our business.
We are dependent on attracting and retaining qualified employees while also controlling labor costs.
We are dependent upon the availability of qualified restaurant personnel. Our future performance will depend on our ability to attract, motivate and retain our brand presidents, regional vice presidents, directors of operations and restaurant-level managers. Competition for these employees is intense. The loss of the services of members of our restaurant management team or the inability to attract additional qualified personnel as needed could materially harm our business.
If restaurant management and staff turnover trends increase, we could suffer higher direct costs associated with recruiting, training and retaining replacement personnel. Moreover, we could suffer from significant indirect costs, including restaurant disruptions due to management changeover and potential delays in new restaurant openings or adverse guest reactions to inadequate guest service levels due to staff shortages. Competition for qualified employees may exert upward pressure on wages paid to attract such personnel, resulting in higher labor costs, together with greater recruitment and training expense.
We must comply with the Fair Labor Standards Act and various federal and state laws governing employment matters, such as minimum wage, tip credit allowance, overtime pay practices, child labor laws and other working conditions and citizenship requirements. Federal, state and municipal laws may also require us to provide new or increased levels of employee benefits to our employees, many of whom are not currently eligible for such benefits. Many of our employees are hourly workers whose wages are likely to be affected by an increase in the federal or state minimum wage or changes to the tip credit allowance. Proposals have been made, and continue to be made, at federal and state levels to increase minimum wage levels, including changes to the tip credit allowance. An increase in the minimum wage or a change in the tip credit allowance may require an increase or create pressure to increase the pay scale for our employees. In addition, while we take certain measures to operate our restaurants in strict compliance with federal immigration regulations and the requirements of certain states, some of our employees, especially given the location of many of our restaurants, may fail to meet federal work authorization or residency requirements, which could result in disruptions in our work force, sanctions against us and adverse publicity. A shortage in the labor pool or other general inflationary pressures or changes could also increase our labor costs. A shortage in the labor pool could also cause our restaurants to be required to operate with reduced staff, which could negatively impact our ability to provide adequate service levels to our guests.
Among the federal laws with which we must comply is the National Labor Relations Act that applies to the election by employees to be represented by a labor organization for purposes of collective bargaining over wages, hours, working conditions and terms and conditions of employment. Currently, none of our employees are represented by labor organizations for these purposes. However, potential union representation and collectively bargaining agreements may result in increased labor
24
Table of Contents
costs that can have an impact on competitiveness. Labor disputes, as well, may precipitate strikes and picketing that may have an impact on business, including guest patronage and supplier deliveries.
Our existing senior secured credit facility contains financial covenants, negative covenants and other restrictions and failure to comply with these requirements could cause the related indebtedness to become due and payable and limit our ability to incur additional debt.
The lenders' obligation to extend credit under our existing senior secured credit facility depends upon our maintaining certain financial covenants. In particular, our senior secured credit facility requires us to maintain a leverage ratio of rent adjusted debt to EBITDAR (earnings before interest, taxes, depreciation and amortization expense and rent expense, plus certain additional addbacks more particularly specified in the credit agreement), and a minimum fixed charge coverage ratio. These ratios are computed at the end of each fiscal quarter for the most recent 12-month period. The facility allows for a maximum leverage ratio of 4.75x and a minimum fixed charge coverage ratio of 1.50x. Failure to maintain these ratios could result in an acceleration of outstanding amounts under the facility and restrict us from borrowing amounts under the facility to fund our future liquidity requirements. In addition, our credit facility contains certain negative covenants, which, among other things, limit our ability to:
- •
- incur additional indebtedness;
- •
- create or permit liens;
- •
- make certain investments, guarantees or loans;
- •
- make acquisitions;
- •
- pay dividends or make other restricted payments;
- •
- enter into sale-leaseback transactions; and
- •
- engage in certain transactions with affiliates; and
- •
- merge, consolidate or otherwise dispose of assets other than in the ordinary course of business.
Our ability to make scheduled payments and comply with financial covenants will depend on our operating and financial performance, which in turn, is subject to prevailing economic conditions and to other financial, business and other factors beyond our control described herein. Our obligations and the guarantees under the senior secured credit facility are secured by substantially all of our and such subsidiaries' present and future assets and a perfected first priority lien on the capital stock or other equity interests of our direct and indirect subsidiaries.
We may need additional capital in the future, and it may not be available on acceptable terms.
The development of our business may require significant additional capital in the future to fund our operations and growth, among other activities. We have historically relied upon cash generated by our operations and our senior secured credit facility to fund our expansion. In the future, we intend to rely on funds from operations and, if necessary, our senior secured credit facility. We may also need to access the debt and equity capital markets. There can be no assurance, however, that these sources of financing will be available on acceptable terms, or at all. Our ability to obtain additional financing will be subject to a number of factors, including market conditions, our operating performance, investor sentiment and our ability to incur additional debt in compliance with agreements governing our then-outstanding debt. These factors may make the timing, amount, terms or conditions of additional financings unattractive to us. If we are unable to generate sufficient funds from operations or raise additional capital, our growth could be impeded.
25
Table of Contents
As of December 31, 2012, we had approximately $45.0 million of total indebtedness outstanding and available borrowing capacity of $53.2 million under our current credit agreement. We may not be able to refinance our indebtedness prior to or at its maturity on acceptable terms or at all.
Legal complaints or litigation may hurt us.
Occasionally, restaurant guests and/or employees file complaints or lawsuits against us alleging that we are responsible for some illness or injury they suffered at or after a visit to our restaurants, or that we have problems with food quality or operations. We are also subject to a variety of other claims arising in the ordinary course of our business, including personal injury claims, contract claims and claims alleging violations of federal and state law regarding workplace and employment matters, discrimination and similar matters. We could also become subject to class action lawsuits related to these matters in the future. In recent years, a number of restaurant companies have been subject to lawsuits, including class action lawsuits, alleging violations of federal and state law regarding workplace conditions, employment and similar matters. A number of these industry lawsuits have resulted in the payment of substantial damages by defendants. The restaurant industry has also been subject to a growing number of claims that the menus and actions of restaurant chains have led to the obesity of certain of their guests.
Regardless, however, of whether any claim brought against us in the future is valid or whether we are liable, such a claim would be expensive to defend and may divert time, money and other valuable resources away from our operations and, thereby, hurt our business.
We are subject to state and local "dram shop" statutes, which may subject us to uninsured liabilities. These statutes generally allow a person injured by an intoxicated person to recover damages from an establishment that wrongfully served alcoholic beverages to the intoxicated person. In the past, after allegedly consuming alcoholic beverages at our restaurants, there have been isolated instances where certain individuals have been killed or injured or have killed or injured third parties. Because a plaintiff may seek punitive damages, which may not be fully covered by insurance, this type of action could have an adverse impact on our financial condition and results of operations. A judgment in such an action significantly in excess of our insurance coverage could adversely affect our financial condition, results of operations or cash flows. Further, adverse publicity resulting from any such allegations may adversely affect us and our restaurants taken as a whole.
Failure to obtain and maintain required licenses and permits or to comply with alcoholic beverage or food control regulations could lead to the loss of our liquor and food service licenses and, thereby, harm our business.
The restaurant industry is subject to various federal, state and local government regulations, including those relating to the sale of food and alcoholic beverages. Such regulations are subject to change from time to time. The failure to obtain and maintain these licenses, permits and approvals could adversely affect our operating results. Typically, licenses must be renewed annually and may be revoked, suspended or denied renewal for cause at any time if governmental authorities determine that our conduct violates applicable regulations. Difficulties or failure to maintain or obtain the required licenses and approvals could adversely affect our existing restaurants and delay or result in our decision to cancel the opening of new restaurants, which would adversely affect our business.
In fiscal year 2012, approximately 13% of Joe's Crab Shack revenues and 46% of Brick House Tavern + Tap revenues were attributable to the sale of alcoholic beverages, and our alcoholic beverage sales may increase in the future. Alcoholic beverage control regulations require each of our restaurants to apply to a state authority and, in certain locations, county or municipal authorities for a license or permit to sell alcoholic beverages on-premises and to provide service for extended hours and on Sundays. Alcoholic beverage control regulations relate to numerous aspects of daily operations of our
26
Table of Contents
restaurants, including minimum age of patrons and employees, hours of operation, advertising, trade practices, wholesale purchasing, other relationships with alcohol manufacturers, wholesalers and distributors, inventory control and handling, storage and dispensing of alcoholic beverages. In the past, we have been subject to fines for violations of alcoholic beverage control regulations. Any future failure to comply with these regulations and obtain or retain liquor licenses could adversely affect our results of operations and overall financial condition.
We are subject to many federal, state and local laws with which compliance is both costly and complex.
The restaurant industry is subject to extensive federal, state and local laws and regulations, including the recently enacted comprehensive health care reform legislation and those relating to building and zoning requirements and those relating to the preparation and sale of food. The development and operation of restaurants depend to a significant extent on the selection and acquisition of suitable sites, which are subject to zoning, land use, environmental, traffic and other regulations and requirements. We are also subject to licensing and regulation by state and local authorities relating to health, sanitation, safety and fire standards and liquor licenses, federal and state laws governing our relationships with employees (including the Fair Labor Standards Act of 1938, the Immigration Reform and Control Act of 1986 and applicable requirements concerning the minimum wage, overtime, family leave, tip credits, working conditions, safety standards, immigration status, unemployment tax rates, workers' compensation rates and state and local payroll taxes), federal and state laws which prohibit discrimination and other laws regulating the design and operation of facilities, such as the Americans With Disabilities Act of 1990, or the ADA.
In March 2010, the United States federal government enacted comprehensive health care reform legislation which, among other things, includes guaranteed coverage requirements, eliminates pre-existing condition exclusions and annual and lifetime maximum limits, restricts the extent to which policies can be rescinded and imposes new and significant taxes on health insurers and health care benefits. The legislation imposes implementation effective dates that extend through 2020, and many of the changes require additional guidance from government agencies or federal regulations. Due to the breadth and complexity of federal health care legislation and the staggered implementation of its provisions and corresponding regulations, it is difficult to predict the overall impact of the health care legislation on our business over the coming years. To date, we have not experienced material costs related to such legislation. However, due to the phased-in nature of the implementation and the lack of interpretive guidance, it is difficult to determine at this time what impact the health care reform legislation will have on our financial results. Possible adverse effects could include increased costs, exposure to expanded liability and requirements for us to revise the ways in which we provide healthcare and other benefits to our employees. Providing more extensive health insurance benefits to employees than the health insurance benefits we currently provide and to a potentially larger proportion of our employees, or the payment of penalties if the specified level of coverage is not provided at an affordable cost to employees, could have a material adverse effect on our results of operations and financial position. In addition, these laws require employers to comply with a significant number of new reporting and notice requirements from the Departments of Treasury, Labor and Health and Human Services, and we will have to develop systems and processes to track the requisite information and to comply with the reporting and notice requirements. Our suppliers also may be affected by higher minimum wage and benefit standards, which could result in higher costs for goods and services supplied to us.
The impact of current laws and regulations, the effect of future changes in laws or regulations that impose additional requirements and the consequences of litigation relating to current or future laws and regulations, or our inability to respond effectively to significant regulatory or public policy issues, could increase our compliance and other costs of doing business and therefore have an adverse effect on our results of operations. Failure to comply with the laws and regulatory requirements of federal,
27
Table of Contents
state and local authorities could result in, among other things, revocation of required licenses, administrative enforcement actions, fines and civil and criminal liability. In addition, certain laws, including the ADA, could require us to expend significant funds to make modifications to our restaurants if we failed to comply with applicable standards. Compliance with all of these laws and regulations can be costly and can increase our exposure to litigation or governmental investigations or proceedings.
New information or attitudes regarding diet and health could result in additional menu labeling laws and changes in regulations and consumer eating habits that could adversely affect our results of operations.
Regulations and consumer eating habits may continue to change as a result of new information and attitudes regarding diet and health. These changes may include regulations that impact the ingredients and nutritional content of our menu items. The federal government as well as a number of states (including California), counties and cities have enacted menu labeling laws requiring multi-unit restaurant operators to make certain nutritional information available to guests (including caloric, sugar, sodium and fat content) or have enacted legislation prohibiting the sales of certain types of ingredients in restaurants. The success of our restaurant operations depends, in part, upon our ability to effectively respond to changes in consumer health and disclosure regulations and to adapt our menu offerings to fit the dietary needs and eating habits of our guests without sacrificing flavor. If consumer health regulations or consumer eating habits change significantly, we may be required to modify or discontinue certain menu items. To the extent we are unable to respond with appropriate changes to our menu offerings, it could materially affect guest traffic and our results of operations. Furthermore, a change in our menu could result in a decrease in guest traffic.
We may be subject to increased scrutiny as the result of growing public concern over seafood mislabeling.
Although we source our seafood from third-party food suppliers and distributors that we believe accurately identify and label the seafood items that they sell and inspect food products when they are delivered to us, we do not conduct DNA sampling on the products we purchase. Therefore, we cannot assure that the seafood items we purchase from third-parties have been accurately labeled, which could cause us to inadvertently mislabel such items in our restaurants. Recent studies have shown a number of instances of fish products being inaccurately labeled as other species in retail outlets, including grocery stores and restaurants. Although neither of our restaurant brands was included in these studies, negative publicity regarding seafood mislabeling, even when not related to our restaurants, could affect consumer preferences and the consumption of seafood and consequently impact our sales. In addition, if any incident of seafood mislabeling were to occur at one of our restaurants, it could erode consumer affinity for our brands and significantly reduce their respective values and damage our business. Furthermore, public concern over seafood mislabeling could result in new regulations relating to the sourcing and labeling of seafood products. For instance, a bill was introduced to the U.S. Congress in July 2012 that was intended to address seafood fraud by requiring fish suppliers and restaurants to provide more information to their customers about the seafood they sell. Although such bill was not enacted, future bills may be proposed and enacted and compliance with any such regulations could cause us to incur additional costs.
We have recorded impairment charges in past periods and may record additional impairment charges in future periods.
We periodically evaluate possible impairment at the individual restaurant-level, and record an impairment loss whenever we determine impairment factors are present. We also periodically evaluate the criteria we use as an indication of restaurant impairment. We consider a history of restaurant operating losses to be a primary indicator of potential impairment for individual restaurant locations. A
28
Table of Contents
lack of improvement at restaurants we are monitoring, or deteriorating results at other restaurants, could result in additional impairment charges.
Our current insurance may not provide adequate levels of coverage against claims.
We currently maintain insurance customary for businesses of our size and type. However, there are types of losses we may incur that cannot be insured against or that we believe are not economically reasonable to insure. Such losses could have a material adverse effect on our business and results of operations. In addition, we self-insure a significant portion of expected losses under our workers' compensation, general liability and property insurance programs. Unanticipated changes in the actuarial assumptions and management estimates underlying our reserves for these losses could result in materially different amounts of expense under these programs, which could have a material adverse effect on our financial condition, results of operations and liquidity.
Our failure or inability to enforce our trademarks or other proprietary rights could adversely affect our competitive position or the value of our brand.
Our registered trademarks and service marks include Joe's Crab Shack and the design, our stylized logos, and Brick House Tavern + Tap and the design, which are protected under applicable intellectual property laws. We believe that our trademarks and other proprietary rights are important to our success and our competitive position, and, therefore, we devote resources to the protection of our trademarks and proprietary rights. The protective actions that we take, however, may not be enough to prevent unauthorized use or imitation by others, which could harm our image, brand or competitive position. If we commence litigation to enforce our rights, we will incur significant legal fees.
We cannot assure you that third parties will not claim infringement by us of their proprietary rights in the future. Any such claim, whether or not it has merit, could be time-consuming and distracting for executive management, result in costly litigation, cause changes to existing menu items or delays in introducing new menu items, or require us to enter into royalty or licensing agreements. As a result, any such claim could have a material adverse effect on our business, results of operations and financial condition.
Our quarterly operating results may fluctuate significantly and could fall below the expectations of securities analysts and investors due to seasonality and other factors, some of which are beyond our control, resulting in a decline in our stock price.
Our quarterly operating results may fluctuate significantly because of several factors, including:
- •
- the timing of new restaurant openings and related expense;
- •
- restaurant operating costs for our newly-opened restaurants, which are often materially greater during the first several months of operation than thereafter;
- •
- labor availability and costs for hourly and management personnel;
- •
- profitability of our restaurants, especially in new markets;
- •
- changes in interest rates;
- •
- increases and decreases in average unit volumes and comparable restaurant sales;
- •
- impairment of long-lived assets and any loss on restaurant closures;
- •
- macroeconomic conditions, both nationally and locally;
- •
- negative publicity relating to the consumption of seafood or other products we serve;
- •
- changes in consumer preferences and competitive conditions;
29
Table of Contents
- •
- expansion to new markets;
- •
- increases in infrastructure costs; and
- •
- fluctuations in commodity prices.
Our business is also subject to seasonal fluctuations. Our revenues are typically highest in the summer months (June, July and August) and lowest in the winter months (November, December and January) especially with respect to Joe's Crab Shack restaurants. As a result, our quarterly and annual operating results and comparable restaurant sales may fluctuate significantly as a result of seasonality and the factors discussed above. Accordingly, results for any one fiscal quarter are not necessarily indicative of results to be expected for any other fiscal quarter or for any fiscal year and comparable restaurant sales for any particular future period may decrease. In the future, operating results may fall below the expectations of securities analysts and investors. In that event, the price of our common stock would likely decrease.
Significant adverse weather conditions and other disasters could negatively impact our results of operations.
Adverse weather conditions and acts of god, such as regional winter storms, fires, floods, hurricanes, tropical storms and earthquakes, and other disasters, such as oil spills and nuclear meltdowns, could negatively impact our results of operations. In particular, a number of our restaurants are located in states which are particularly susceptible to hurricanes, tropical storms, flooding and earthquakes.
Any strategic transactions or initiatives that we consider in the future may have unanticipated consequences that could harm our business and our financial condition.
From time to time, we evaluate potential mergers, acquisitions of restaurants joint ventures or other strategic initiatives to acquire or develop additional restaurant brands. To successfully execute any acquisition or development strategy, we will need to identify suitable acquisition or development candidates, negotiate acceptable acquisition or development terms and obtain appropriate financing. Any acquisition or future development that we pursue, whether or not successfully completed, may involve risks, including:
- •
- material adverse effects on our operating results, particularly in the fiscal quarters immediately following the acquisition or development as the restaurants are integrated into our operations;
- •
- risks associated with entering into new domestic markets or conducting operations where we have no or limited prior experience, including international markets;
- •
- risks inherent in accurately assessing the value, future growth potential, strengths, weaknesses, contingent and other liabilities and potential profitability of acquisition candidates and newly developed restaurant brands, and our ability to achieve projected economic and operating synergies;
- •
- negative impacts on the reputation of our current brands; and
- •
- the diversion of management's attention from other business concerns.
On February 6, 2013, we announced our proposed acquisition of Mac Grill. The acquisition and integration of Mac Grill involves a number of risks. The core risks relate to the valuation of the Mac Grill business and managing the complex process of integrating Mac Grill's restaurants, people, brand, technology and other assets so as to realize the projected value of Mac Grill and the synergies projected to be realized in connection with the acquisition. Other risks include the inaccurate assessment of disclosed liabilities, inconsistencies in standards, controls, procedures and policies,
30
Table of Contents
including internal control and regulatory requirements under the Sarbanes-Oxley Act of 2002, and personnel turnover.
The success of the Mac Grill acquisition will depend, in part, on our ability to realize the anticipated benefits from integrating Mac Grill with our existing businesses. The integration process may be complex, costly and time consuming. The process of integrating the operations of Mac Grill could cause an interruption of, or loss of momentum in, the activities of our other restaurant brands and the possible loss of key personnel. The diversion of management's attention and any delays or difficulties encountered in connection with the Mac Grill acquisition and the integration of Mac Grill's operations with ours could have an adverse effect on our financial position and results of operations.
Following completion of the Mac Grill acquisition, we may not be able to maintain the levels of revenue, earnings or operating efficiency that we and Mac Grill have achieved or might have achieved separately. In addition, the success of the Mac Grill acquisition will depend, in part, on our ability to realize the anticipated benefits from the acquisition, including anticipated synergies and costs savings. Furthermore, in order to finance the acquisition of Mac Grill, we expect to upsize our senior secured credit facility by adding a $50.0 million term loan facility. Finally, the Mac Grill business includes the franchising of international restaurant locations. We do not currently franchise or operate in any foreign jurisdictions, and the addition of international operations following the acquisition of Mac Grill will involve additional risks to us, including complying with foreign regulatory requirements and general economic and political conditions in such foreign markets.
We intend to become a party to franchise relationships and such future franchisees could take actions that could be harmful to our business.
Following completion of our proposed acquisition of Mac Grill, a portion of the newly acquired business will consist of the payment of royalties by franchisees. In addition, we are currently evaluating opportunities to franchise our other restaurant brands. Our ability to pursue future franchise relationships depends in part upon our ability to find and attract quality franchisees. Any franchisees will be contractually obligated to operate their restaurants in accordance with our standards and all applicable laws. However, although we will attempt to properly train and support any franchisees, franchisees are independent third parties that we will not control, and the franchisees own, operate and oversee the daily operations of their restaurants. As a result, the ultimate success and quality of any franchised restaurant rests with the franchisee. Adverse events beyond our control, such as quality issues related to a food product or a failure to maintain quality standards at a franchised restaurant, could negatively impact our brand, business and results of operations. Further, the failure of any future franchisees or any of their restaurants to remain financially viable could result in their failure to pay royalties owed to us.
We have incurred and expect to continue to incur increased costs as a result of operating as a public company.
Prior to our IPO, we had not been subject to the reporting requirements of the Exchange Act or the other rules and regulations of the Securities Exchange Commission, or the SEC, or any securities exchange relating to public companies. Following the IPO, we identified those areas in which changes should be made to our financial and management control systems to manage our growth and our obligations as a public company. These areas included corporate governance, corporate control, internal audit, disclosure controls and procedures and financial reporting and accounting systems. We have made, and may continue to make, changes in these and other areas. Ongoing compliance with the various reporting and other requirements applicable to public companies also require considerable time and attention of management, particularly if we are no longer an "emerging growth company."
31
Table of Contents
Congress enacted the Jumpstart Our Business Startups Act of 2012, or the "JOBS Act," on April 5, 2012. Pursuant to the provisions of the JOBS Act, we qualify as an "emerging growth company." Section 102 of the JOBS Act provides that an "emerging growth company" can take advantage of the extended transition period provided in Section 7(a)(2)(B) of the Securities Act for complying with new or revised accounting standards. However, we chose to "opt out" of such extended transition period, and as a result, we comply with new or revised accounting standards on the relevant dates on which adoption of such standards is required for non-emerging growth companies. Our decision to opt out of the extended transition period was irrevocable.
For as long as we remain an "emerging growth company" as defined in the JOBS Act, we may take advantage of certain exemptions from various reporting requirements that are applicable to other public companies that are not "emerging growth companies" including, but not limited to, not being required to comply with the auditor attestation requirements of Section 404 of the Sarbanes-Oxley Act, reduced disclosure obligations regarding executive compensation in our periodic reports and proxy statements, and exemptions from the requirements of holding a nonbinding advisory vote on executive compensation and shareholder approval of any golden parachute payments not previously approved. We may take advantage of these reporting exemptions until we are no longer an "emerging growth company."
We anticipate that we will remain an "emerging growth company" until the earlier of the end of the fiscal year during which we have total annual gross revenues of $1.0 billion or more and May 10, 2017.
Risks Related to Ownership of Our Common Stock
Concentration of ownership by J.H. Whitney VI may prevent new investors from influencing significant corporate decisions.
J.H. Whitney VI owns, in the aggregate, approximately 68% of our outstanding common stock. As a result, J.H. Whitney VI is able to exercise control over all matters requiring stockholder approval, including the election of directors, amendment of our amended and restated certificate of incorporation and approval of significant corporate transactions and has significant control over our management and policies. In addition, two of the six members of our board of directors are principals of J.H. Whitney. J.H. Whitney VI can take actions that have the effect of delaying or preventing a change in control of us or discouraging others from making tender offers for our shares, which could prevent stockholders from receiving a premium for their shares. These actions may be taken even if other stockholders oppose them. The concentration of voting power with J.H. Whitney VI may have an adverse effect on the price of our common stock. The interests of J.H. Whitney VI may not be consistent with your interests as a stockholder. J.H. Whitney VI is also able to transfer control of us to a third-party by transferring their common stock, which would not require the approval of our board of directors or our other stockholders.
Our amended and restated certificate of incorporation provides that the doctrine of corporate opportunity does not apply against J.H. Whitney, or any of our directors who are employees of or affiliated with J.H. Whitney, in a manner that would prohibit them from investing or participating in competing businesses. To the extent J.H. Whitney affiliated funds invest in such other businesses, they may have differing interests than our other stockholders. For example, J.H. Whitney affiliated funds may choose to own other restaurant brands through other investments, which may compete with our brands.
32
Table of Contents
We are a "controlled company" within the meaning of The NASDAQ Stock Market rules, and, as a result, we rely on exemptions from certain corporate governance requirements that provide protection to stockholders of other companies.
J.H. Whitney VI owns more than 50% of the total voting power of our common stock and therefore, we are a "controlled company" under The NASDAQ Stock Market corporate governance listing standards. As a controlled company, we are exempt under The NASDAQ Stock Market listing standards from the obligation to comply with certain of The NASDAQ Stock Market corporate governance requirements, including the requirements:
- •
- that a majority of our board of directors consist of independent directors, as defined under the rules of The NASDAQ Stock Market;
- •
- that we have a corporate governance and nominating committee that is composed entirely of independent directors with a written charter addressing the committee's purpose and responsibilities; and
- •
- that we have a compensation committee that is composed entirely of independent directors with a written charter addressing the committee's purpose and responsibilities.
Our stock price may be volatile or may decline regardless of our operating performance.
The market price of our common stock may fluctuate significantly in response to a number of factors, most of which we cannot control, including those described under "—Risks Related to Our Business" and the following:
- •
- potential fluctuation in our annual or quarterly operating results due to seasonality and other factors;
- •
- changes in capital market conditions that could affect valuations of restaurant companies in general or our goodwill in particular or other adverse economic conditions;
- •
- changes in financial estimates by any securities analysts who follow our common stock, our failure to meet these estimates or failure of those analysts to initiate or maintain coverage of our common stock;
- •
- downgrades by any securities analysts who follow our common stock;
- •
- future sales of our common stock by our officers, directors and significant stockholders;
- •
- global economic, legal and regulatory factors unrelated to our performance;
- •
- investors' perceptions of our prospects;
- •
- announcements by us or our competitors of significant contracts, acquisitions, joint ventures or capital commitments; and
- •
- investor perceptions of the investment opportunity associated with our common stock relative to other investment alternatives.
In addition, the stock markets, and in particular The NASDAQ Global Select Market, have experienced extreme price and volume fluctuations that have affected and continue to affect the market prices of equity securities of many food service companies. In the past, stockholders have instituted securities class action litigation following periods of market volatility. If we were involved in securities litigation, we could incur substantial costs and our resources and the attention of management could be diverted from our business.
33
Table of Contents
Future sales of our common stock, or the perception in the public markets that these sales may occur, may depress our stock price.
Sales of substantial amounts of our common stock in the public market, or the perception that these sales could occur, could adversely affect the price of our common stock and could impair our ability to raise capital through the sale of additional shares. J.H. Whitney VI has the right, subject to certain conditions, to require us to file registration statements registering additional shares of common stock, and J.H. Whitney VI and members of management have the right to require us to include shares of common stock in registration statements that we may file for ourselves or J.H. Whitney VI. Subject to compliance with restrictions under the registration rights agreement (which may be waived), shares of common stock sold under these registration statements can be freely sold in the public market. In the event such registration rights are exercised and a large number of shares of common stock are sold in the public market, such sales could reduce the trading price of our common stock. These sales also could impede our ability to raise future capital. In addition, we would incur certain expenses in connection with the registration and sale of such shares.
In the future, we may also issue our securities in connection with investments or acquisitions. The amount of shares of our common stock issued in connection with an investment or acquisition could constitute a material portion of our then-outstanding shares of our common stock.
Anti-takeover provisions in our charter documents and Delaware law might discourage or delay acquisition attempts for us that stockholders might consider favorable.
Our amended and restated certificate of incorporation and amended and restated bylaws contain provisions that may make the acquisition of our company more difficult without the approval of our board of directors. These provisions:
- •
- establish a classified board of directors for a period of time after the consummation of the public offering, so that not all members of our board of directors are elected at one time;
- •
- authorize the issuance of undesignated preferred stock, the terms of which may be established and the shares of which may be issued without stockholder approval, and which may include super voting, special approval, dividend, or other rights or preferences superior to the rights of the holders of common stock;
- •
- prohibit stockholder action by written consent, requiring all stockholder actions be taken at a meeting of our stockholders, once J.H. Whitney VI owns less than 50% of our outstanding voting stock;
- •
- provide that the board of directors is expressly authorized to make, alter, or repeal our amended and restated bylaws; and
- •
- establish advance notice requirements for nominations for elections to our board of directors or for proposing matters that can be acted upon by stockholders at stockholder meetings.
These anti-takeover provisions and other provisions under Delaware law could discourage, delay or prevent a transaction involving a change in control of our company, even if doing so would benefit our stockholders. These provisions could also discourage proxy contests and make it more difficult for stockholders to elect directors of their choosing and to cause us to take other corporate actions.
34
Table of Contents
If securities or industry analysts do not publish research or publish inaccurate or unfavorable research about our business, our stock price and trading volume could decline.
The trading market for our common stock depends in part on the research and reports that securities or industry analysts publish about us or our business. If one or more of the analysts who covers us downgrades our common stock or publishes inaccurate or unfavorable research about our business, our stock price would likely decline. If one or more of these analysts ceases coverage of us or fails to publish reports on us regularly, demand for our common stock could decrease, which could cause our stock price and trading volume to decline.
We do not expect to pay any cash dividends for the foreseeable future.
The continued operation and expansion of our business will require substantial funding. Accordingly, we do not anticipate that we will pay any cash dividends on shares of our common stock for the foreseeable future. Any determination to pay dividends in the future will be at the discretion of our board of directors and will depend upon results of operations, financial condition, contractual restrictions, including our senior secured credit facility and other indebtedness we may incur, restrictions imposed by applicable law and other factors our board of directors deems relevant.
We are an "emerging growth company" and reduced disclosure requirements applicable to emerging growth companies could make our common stock less attractive to some investors.
We are an "emerging growth company," as defined in the JOBS Act, and we may take advantage of certain temporary exemptions from various reporting requirements that are applicable to other public companies that are not "emerging growth companies" described above. Some investors may find our common stock less attractive if we continue to rely on these exemptions. If some investors find our common stock less attractive as a result, there may be a less active trading market for our common stock and our stock price may be more volatile.
Item 1B. UNRESOLVED STAFF COMMENTS.
None.
35
Table of Contents
Item 2. PROPERTIES.
As of December 31, 2012, we had 129 Joe's Crab Shack restaurants in 33 states and 15 Brick House Tavern + Tap restaurants in 9 states, as shown in the chart below.
| | | | | | | | | | |
State | | Joe's Crab Shack | | Brick House Tavern + Tap | | Total | |
|---|
Alabama | | | 1 | | | — | | | 1 | |
Arizona | | | 3 | | | — | | | 3 | |
California | | | 13 | | | — | | | 13 | |
Colorado | | | 3 | | | — | | | 3 | |
Delaware | | | 1 | | | — | | | 1 | |
Florida | | | 13 | | | 2 | | | 15 | |
Georgia | | | 5 | | | — | | | 5 | |
Idaho | | | 1 | | | — | | | 1 | |
Illinois | | | 4 | | | 2 | | | 6 | |
Indiana | | | 3 | | | — | | | 3 | |
Iowa | | | 1 | | | — | | | 1 | |
Kansas | | | 1 | | | — | | | 1 | |
Kentucky | | | 2 | | | 1 | | | 3 | |
Louisiana | | | 2 | | | — | | | 2 | |
Maryland | | | 5 | | | — | | | 5 | |
Massachusetts | | | 1 | | | — | | | 1 | |
Michigan | | | 3 | | | — | | | 3 | |
Minnesota | | | 1 | | | — | | | 1 | |
Missouri | | | 3 | | | 1 | | | 4 | |
Nebraska | | | 1 | | | — | | | 1 | |
Nevada | | | 2 | | | — | | | 2 | |
New Jersey | | | 4 | | | 1 | | | 5 | |
New York | | | 4 | | | 1 | | | 5 | |
North Carolina | | | 1 | | | — | | | 1 | |
Ohio | | | 1 | | | 1 | | | 2 | |
Oklahoma | | | 3 | | | — | | | 3 | |
Pennsylvania | | | 4 | | | 1 | | | 5 | |
South Carolina | | | 3 | | | — | | | 3 | |
Tennessee | | | 3 | | | — | | | 3 | |
Texas | | | 29 | | | 5 | | | 34 | |
Utah | | | 2 | | | — | | | 2 | |
Virginia | | | 5 | | | — | | | 5 | |
Washington | | | 1 | | | — | | | 1 | |
| | | | | | | | |
Total | | | 129 | | | 15 | | | 144 | |
36
Table of Contents
A summary of new restaurant openings, converted restaurant openings, restaurants permanently closed and restaurants closed for conversions during the last three fiscal years is provided in the table below.
| | | | | | | | | | |
| | Fiscal Year | |
|---|
| | 2012 | | 2011 | | 2010 | |
|---|
Ignite Restaurant Group | | | | | | | | | | |
Restaurants at beginning of period | | | 135 | | | 126 | | | 119 | |
New restaurants opened during period | | | 10 | | | 10 | | | 10 | |
Converted restaurants opened during period | | | 1 | | | 1 | | | — | |
Restaurants permanently closed during period | | | — | | | (1 | ) | | (2 | ) |
Restaurants closed for conversion during period(a) | | | (2 | ) | | (1 | ) | | (1 | ) |
| | | | | | | | |
Restaurants at end of period | | | 144 | | | 135 | | | 126 | |
Joe's Crab Shack | | | | | | | | | | |
Restaurants at beginning of period | | | 119 | | | 113 | | | 114 | |
New restaurants opened during period | | | 10 | | | 7 | | | 2 | |
Converted restaurants opened during period | | | 1 | | | — | | | — | |
Restaurants permanently closed during period | | | — | | | (1 | ) | | (2 | ) |
Restaurants closed for conversion during period(a) | | | (1 | ) | | — | | | (1 | ) |
| | | | | | | | |
Restaurants at end of period | | | 129 | | | 119 | | | 113 | |
Brick House Tavern + Tap | | | | | | | | | | |
Restaurants at beginning of period | | | 16 | | | 13 | | | 5 | |
New restaurants opened during period | | | — | | | 3 | | | 8 | |
Converted restaurants opened during period | | | — | | | 1 | | | — | |
Restaurants permanently closed during period | | | — | | | — | | | — | |
Restaurants closed for conversion during period(a) | | | (1 | ) | | (1 | ) | | — | |
| | | | | | | | |
Restaurants at end of period | | | 15 | | | 16 | | | 13 | |
| | | | | | | | |
- (a)
- Represents Joe's Crab Shack restaurants converted to Brick House restaurants or vice versa that were closed in the fourth quarter of the fiscal year for conversion to open in the succeeding fiscal year.
Our Restaurant Support Center is located in Houston, Texas. We occupy this facility under a lease for approximately 31,000 square feet that expires on October 31, 2015.
All of our restaurant locations are leased under individual lease agreements. Leases are noncancelable and in general, have 10 to 15 year terms, with three to five-year extensions. Only two of our leases are set to expire without provisions for renewal within the next five years and these properties are not ranked within the top third of our restaurants. Most of our leases contain a minimum base rent, and generally have escalating base rent increases over the term of the lease. Some of our leases provide for contingent rent, which is determined as a percentage of sales in excess of specified minimum sales levels.
Item 3. LEGAL PROCEEDINGS.
On July 18, 2012, we announced our intention to restate our financial statements for the years ended December 28, 2009, January 3, 2011 and January 2, 2012 and the related interim periods. On July 20, 2012, a putative class action complaint was filed in the U.S. District Court for the Southern District of Texas against us, certain of our current directors and officers and the underwriters in the IPO. The plaintiffs allege that all the defendants violated Section 11 of the Securities Act of 1933 (the "Securities Act") and certain of our directors and officers have control person liability under Section 15
37
Table of Contents
of the Securities Act, based on allegations that in light of the July 18, 2012 restatement announcement, our IPO registration statement and prospectus contained untrue statements of material facts, omitted to state other facts necessary to make the statements made not misleading, and omitted to state material facts required to be stated therein. Plaintiffs seek unspecified compensatory damages and attorneys' fees and costs. We believe this lawsuit is without merit, and we are vigorously defending the lawsuit. However, we are unable to predict the outcome of this case and any future related cases.
Item 4. MINE SAFETY DISCLOSURES.
Not applicable.
PART II
Item 5. MARKET FOR REGISTRANT'S COMMON EQUITY, RELATED STOCKHOLDER MATTERS AND ISSUER PURCHASES OF EQUITY SECURITIES.
The shares of our common stock have traded on the NASDAQ Global Select Market under the symbol "IRG" since our initial public offering on May 11, 2012. Prior to that, there was no public market for our common stock. The following table sets forth the quarterly high and low sales prices of our common stock as reported by NASDAQ:
| | | | | | | |
| | High | | Low | |
|---|
Second Quarter | | $ | 19.23 | | $ | 16.50 | |
Third Quarter | | $ | 19.87 | | $ | 12.50 | |
Fourth Quarter | | $ | 15.30 | | $ | 10.80 | |
Dividend Policy
On March 24, 2011, we paid a cash dividend in the aggregate amount of $80.0 million indirectly to J.H. Whitney VI through JCS Holdings, LLC, our former parent company. The cash dividend was paid as a return of capital to J.H. Whitney VI for its 2006 investment in us. At no other time have we paid any dividends on our common stock since our incorporation. We currently intend to retain all available funds and any future earnings to fund the development and growth of our business and to repay indebtedness, and therefore we do not anticipate paying any cash dividends in the foreseeable future. Additionally, our ability to pay dividends on our common stock is limited by restrictions on the ability of our subsidiaries and us to pay dividends or make distributions to us under the terms of the agreements governing our indebtedness. Any future determination to pay dividends will be at the discretion of our board of directors, subject to compliance with covenants in current and future agreements governing our indebtedness, and will depend upon our results of operations, financial condition, capital requirements and other factors that our board of directors deems relevant.
Holders
As of December 31, 2012, there were 23 holders of record of our common stock.
38
Table of Contents
Price Performance Graph
The following graph compares the cumulative total shareholder return on $100.00 invested at the opening of the market on May 11, 2012, the date our common shares first traded on NASDAQ, through and including the market close on December 31, 2012, with the cumulative total return for the same time period of the same amount invested in the NASDAQ Composite Index and the Dow Jones U.S. Restaurants & Bars Index.
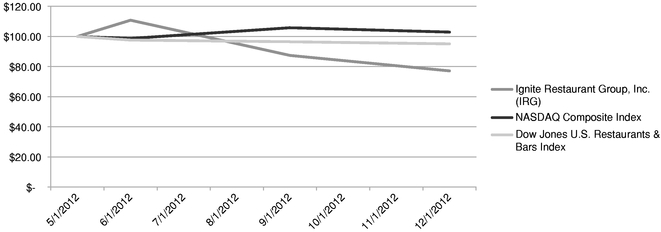
| | | | | | | | | | | | | |
| | 5/11/2012 | | 6/18/2012 | | 9/10/2012 | | 12/31/2012 | |
|---|
Ignite Restaurant Group, Inc. (IRG) | | $ | 100.00 | | $ | 110.80 | | $ | 87.42 | | $ | 77.15 | |
NASDAQ Composite Index | | $ | 100.00 | | $ | 98.69 | | $ | 105.81 | | $ | 102.92 | |
Dow Jones U.S. Restaurants & Bars Index | | $ | 100.00 | | $ | 97.61 | | $ | 96.49 | | $ | 95.10 | |
Unregistered Sales of Equity Securities and Use of Proceeds from Sales of Registered Securities
On May 10, 2012, we completed our initial public offering of 5,769,231 shares of our common stock at an offering price of $14.00 per share. Of the 5,769,231 shares offered, 5,572,703 shares were sold by us, and 196,528 were sold by the selling stockholders. We granted the underwriters an option to purchase up to an additional 865,384 shares of common stock at the IPO price, which the underwriters exercised in full on May 10, 2012. Our common stock began trading on the NASDAQ National Market under the symbol "IRG" on May 11, 2012.
Including the underwriters' exercise of the over-allotment option, we received net proceeds from the offering of approximately $81.1 million, after deducting underwriter discounts and commissions of $6.3 million and other fees and expenses of $2.7 million. We did not receive any proceeds from the shares sold by the selling stockholders. A portion of the net proceeds was used to prepay $42.5 million of our outstanding Term Loan and to pay J.H. Whitney a $1.0 million fee in connection with the termination of our management agreement.
Item 6. SELECTED FINANCIAL DATA.
The following table provides a summary of our historical consolidated financial and operating data for the periods and as of the dates indicated. We derived the statement of operations data presented below for the fiscal years ended December 31, 2012, January 2, 2012 and January 3, 2011 and selected balance sheet data presented below as of December 31, 2012 and January 2, 2012 from our audited consolidated financial statements included elsewhere in this annual report on Form 10-K. The selected statement of operations data for the fiscal years ended December 28, 2009 and December 29, 2008 and the selected balance sheet data as of January 3, 2011, December 28, 2009 and December 29, 2008 have been derived from audited consolidated financial statements not included in this report.
39
Table of Contents
Our fiscal year ends on the Monday nearest to December 31 of each year. Fiscal years 2012, 2011, 2009 and 2008 were 52-week years ended on December 31, 2012, January 2, 2012, December 28, 2009 and December 29, 2008, respectively, while fiscal year 2010 was a 53-week year ended on January 3, 2011. The first three quarters of our fiscal year consist of 12 weeks and our fourth quarter consists of 16 weeks for 52-week fiscal years and 17 weeks for 53-week fiscal years.
The historical results presented below are not necessarily indicative of the results to be expected for any future period. This information should be read in conjunction with "Risk Factors," "Management's Discussion and Analysis of Financial Condition and Results of Operations," and our audited consolidated financial statements.
| | | | | | | | | | | | | | | | |
| | Fiscal Year Ended | |
|---|
| | December 31,
2012 | | January 2,
2012 | | January 3,
2011 | | December 28,
2009 | | December 29,
2008 | |
|---|
Statement of Operations Data: | | | | | | | | | | | | | | | | |
Revenues | | $ | 465,056 | | $ | 405,243 | | $ | 351,327 | | $ | 307,801 | | $ | 273,359 | |
Restaurant operating costs | | | | | | | | | | | | | | | | |
Cost of sales | | | 145,451 | | | 127,607 | | | 103,981 | | | 89,845 | | | 80,573 | |
Labor and benefits | | | 127,331 | | | 111,721 | | | 98,162 | | | 87,920 | | | 80,604 | |
Occupancy expenses | | | 33,846 | | | 30,708 | | | 27,715 | | | 25,425 | | | 21,668 | |
Other operating expenses | | | 81,219 | | | 72,296 | | | 64,382 | | | 58,606 | | | 57,900 | |
General and administrative | | | 31,725 | | | 23,556 | | | 20,719 | | | 18,783 | | | 15,408 | |
Depreciation and amortization | | | 18,572 | | | 16,011 | | | 13,190 | | | 12,268 | | | 13,678 | |
Pre-opening costs | | | 3,871 | | | 4,855 | | | 4,627 | | | 1,474 | | | 805 | |
Restaurant impairments and closures | | | 115 | | | 333 | | | 909 | | | 15 | | | 680 | |
Loss on disposal of property and equipment | | | 2,296 | | | 1,295 | | | 3,242 | | | 1,244 | | | 1,252 | |
| | | | | | | | | | | | |
Total costs and expenses | | | 444,426 | | | 388,382 | | | 336,927 | | | 295,580 | | | 272,568 | |
| | | | | | | | | | | | |
Income from operations. | | | 20,630 | | | 16,861 | | | 14,400 | | | 12,221 | | | 791 | |
Interest expense, net | | | (9,366 | ) | | (9,215 | ) | | (3,831 | ) | | (3,867 | ) | | (5,659 | ) |
Gain (loss) on insurance settlements | | | (799 | ) | | 1,126 | | | 589 | | | 1,192 | | | — | |
| | | | | | | | | | | | |
Income (loss) before income taxes | | | 10,465 | | | 8,772 | | | 11,158 | | | 9,546 | | | (4,868 | ) |
Income tax expense (benefit) | | | 1,751 | | | (3,291 | ) | | 1,456 | | | 507 | | | 90 | |
| | | | | | | | | | | | |
Net income (loss) | | $ | 8,714 | | $ | 12,063 | | $ | 9,702 | | $ | 9,039 | | $ | (4,958 | ) |
| | | | | | | | | | | | |
Per Share Data(2): | | | | | | | | | | | | | | | | |
Net income (loss) per share: | | | | | | | | | | | | | | | | |
Basic and diluted | | $ | 0.37 | | $ | 0.63 | | $ | 0.51 | | $ | 0.47 | | $ | (0.26 | ) |
Weighted average shares outstanding: | | | | | | | | | | | | | | | | |
Basic | | | 23,328 | | | 19,178 | | | 19,178 | | | 19,178 | | | 19,178 | |
Diluted | | | 23,329 | | | 19,178 | | | 19,178 | | | 19,178 | | | 19,178 | |
Selected Other Data: | | | | | | | | | | | | | | | | |
Restaurants open at end of period | | | 144 | | | 135 | | | 126 | | | 119 | | | 116 | |
Change in comparable restaurant sales(1) | | | 2.2 | % | | 6.9 | % | | 4.9 | % | | 9.5 | % | | 1.9 | % |
Average weekly sales | | $ | 63 | | $ | 59 | | $ | 54 | | $ | 51 | | $ | 45 | |
Average unit volumes | | $ | 3,050 | | $ | 2,970 | | $ | 2,810 | | $ | 2,599 | | $ | 2,354 | |
Capital expenditures | | $ | 44,226 | | $ | 39,442 | | $ | 32,420 | | $ | 17,858 | | $ | 6,779 | |
40
Table of Contents
| | | | | | | | | | | | | | | | |
| | December 31,
2012 | | January 2,
2012 | | January 3,
2011 | | December 28,
2009 | | December 29,
2008 | |
|---|
| | (in thousands)
| |
|---|
Selected Balance Sheet Data: | | | | | | | | | | | | | | | | |
Cash and cash equivalents | | $ | 6,929 | | $ | 3,725 | | $ | 12,572 | | $ | 4,976 | | $ | 5,110 | |
Working capital (deficit) | | | (12,856 | ) | | (15,707 | ) | | (1,780 | ) | | 3,727 | | | (2,732 | ) |
Total assets | | | 201,438 | | | 177,835 | | | 152,549 | | | 127,329 | | | 122,933 | |
Total debt | | | 45,000 | | | 117,757 | | | 34,833 | | | 34,988 | | | 35,381 | |
Total stockholder's equity(2) | | $ | 106,217 | | $ | 15,799 | | $ | 83,207 | | $ | 73,238 | | $ | 64,050 | |
- (1)
- Our comparable restaurant base includes restaurants open for at least 104 weeks, or approximately 24 months. Change in comparable restaurant sales represents the change in period-over-period sales for the comparable restaurant base.
- (2)
- Immediately prior to the completion of our IPO, we effected a 19,178.226-to-1 stock split. We also reduced the par value of our common stock from $1.00 per share to $0.01 per share. The share and per share information for 2008 to 2011 included in these consolidated financial statements were retroactively adjusted to reflect the stock split. We issued 6.4 million shares in relation to our IPO in May 2012 and received net proceeds of $81.1 million.
Item 7. MANAGEMENT'S DISCUSSION AND ANALYSIS OF FINANCIAL CONDITION AND RESULTS OF OPERATIONS
You should read the following discussion together with "Selected Historical Consolidated Financial and Operating Data," and the historical financial statements and related notes included in this annual report on Form 10-K. The statements in this discussion regarding industry outlook, our expectations regarding our future performance, liquidity and capital resources and other non-historical statements in this discussion are forward-looking statements. These forward-looking statements are subject to numerous risks and uncertainties, including, but not limited to, the risks and uncertainties described in "Risk Factors" and "Forward-Looking Statements" included in this report. Our actual results may differ materially from those contained in or implied by any forward-looking statements.
Our fiscal year ends on the Monday nearest to December 31 of each year. Fiscal years 2012 and 2011 were 52-week years, while fiscal year 2010 was a 53-week year. References to fiscal years 2012, 2011 and 2010 are references to fiscal years ended December 31, 2012, January 2, 2012 and January 3, 2011, respectively. The first three quarters of our fiscal year consist of 12 weeks and our fourth quarter consists of 16 weeks for 52-week fiscal years and 17 weeks for 53-week fiscal years.
Overview
Ignite Restaurant Group, Inc. operates two restaurant brands, Joe's Crab Shack and Brick House Tavern + Tap. Each of our restaurant brands offers a variety of high-quality food in a distinctive, casual, high-energy atmosphere. Joe's Crab Shack and Brick House Tavern + Tap operate in a diverse set of markets across the United States. As of December 31, 2012, we owned and operated 129 Joe's Crab Shack and 15 Brick House restaurants in 33 states.
Joe's Crab Shack is an established, national chain of casual seafood restaurants. Joe's serves a variety of high-quality seafood items, with an emphasis on crab. Joe's is a high-energy, family-friendly restaurant that encourages guests to "roll up your sleeves and crack into some crab."
Brick House Tavern + Tap is a casual restaurant brand that provides guests an elevated experience appropriate for every day usage.
41
Table of Contents
Since our acquisition from Landry's Restaurants, Inc. in 2006 by JCS Holdings, LLC, we have implemented several initiatives that we believe have favorably impacted our performance at Joe's Crab Shack. These factors include improving our executive leadership team as well as management in our restaurants, expanding our marketing program from spot network to national cable advertising, innovating Joe's menu to increase our sales of crab related items and improving operational execution and efficiency. As a result of these initiatives, we have experienced 18 consecutive fiscal quarters of positive comparable restaurant sales growth and improved our financial results. We believe the initiatives undertaken at Joe's have also repositioned the brand as a market leading casual seafood restaurant.
On February 6, 2013, we entered into a purchase agreement to acquire Mac Grill for $55.0 million in an all-cash transaction. Mac Grill currently owns and operates 186 units and franchises five units across 36 states. Additionally, the brand franchises an additional 19 units throughout nine U.S. territories and foreign countries. For the twelve months ended December 31, 2012, Mac Grill generated $385.0 million in revenues. The acquisition is expected to be completed in the second quarter of fiscal year 2013. See further discussion in Liquidity and Capital Resources below.
While executing these initiatives at Joe's, we also developed and successfully launched a new restaurant brand, Brick House Tavern + Tap. With the addition of the Brick House brand, on July 7, 2009, we officially changed our name to Ignite Restaurant Group, Inc. The first two Brick House locations were opened in 2008 by converting former Joe's locations into Brick House locations. Based on the results of these two locations, we began opening Brick House locations as new restaurants. Brick House has since grown to 15 restaurants operating in 9 states, but remains a relatively small part of our business when compared to our Joe's Crab Shack brand. As of December 31 2012, 13 Brick House restaurants were open for at least 104 weeks, qualifying them for inclusion in our comparable restaurant base. For fiscal year 2012, revenues from our Brick House brand were 10% of our total revenues. Historically, our new restaurant growth was substantially weighted towards new Joe's Crab Shack restaurants but with the impending acquisition of Mac Grill, we are re-evaluating our current restaurant development options.
Outlook
We believe that a significant portion of the casual dining industry, particularly the traditional bar & grill segment, has become undifferentiated and the competitive landscape presents a significant growth opportunity for distinctive casual dining restaurants. Similar to the way the bar & grill segment emerged as an alternative to traditional family dining restaurants in the 1990s, we believe that distinctive casual dining restaurants like ours are now positioned to capture market share from conventional bar & grill restaurants. We intend to continue to position our restaurants to capitalize on that trend by constantly refining our brands, elevating food and service, and offering an aspirational experience to our guests. We expect that the casual dining segment will follow broader macroeconomic trends. However, over the past three fiscal years, we have substantially outperformed the rest of the casual dining segment in same store sales performance. We expect the factors above will continue to position our restaurant businesses favorably against our casual dining competitors.
Our impending acquisition of Mac Grill, with 186 company-owned and 24 franchised units, will more than double our existing restaurant count. Due to the expected timing of the closing in the second quarter of 2013 and the acquisition-related costs, we do not expected Mac Grill to be accretive to earnings until 2014. We expect to incur approximately $8.0 million in acquisition-related costs, of which approximately $7.0 million will be expensed at closing or within the first six months after closing.
We target opening as many as 14 new restaurants in fiscal year 2013, the vast majority of which will be new Joe's Crab Shack restaurants, and converting as many as four existing restaurants to either a Joe's Crab Shack or a Brick House Tavern + Tap.
42
Table of Contents
Key Performance Indicators
In assessing the performance of our business, we consider a variety of performance and financial measures. The key measures for determining how our business is performing are comparable restaurant sales growth, average weekly sales, restaurant operating weeks, average check, average unit volume and number of restaurant openings.
Comparable restaurant sales growth reflects the change in year-over-year sales for the comparable restaurant base. We define the comparable restaurant base to include those restaurants open for at least 104 weeks, or approximately 24 months. As of the fiscal years ended December 31, 2012, January 2, 2012 and January 3, 2011, there were 123, 114 and 111 restaurants, respectively, in our comparable restaurant base. Comparable restaurant sales growth can be generated by an increase in guest counts and/or by increases in the average check amount resulting from a shift in menu mix and/or increase in price. This measure highlights performance of existing restaurants as the impact of new restaurant openings is excluded.
Average weekly sales is a key measure of individual restaurant economic performance of new and existing restaurants. Average weekly sales reflects total sales of all restaurants divided by restaurant operating weeks, which is the aggregate number of weeks that restaurants are in operation over a specified period of time. This measure is subject to seasonality for periods less than one year.
Restaurant operating weeks is the aggregate number of weeks that our restaurants are in operation over a specific period of time.
Average check is calculated for Joe's Crab Shack by dividing net sales by guest counts for a given time period. Management uses this indicator to analyze the dollars spent in our Joe's Crab Shack restaurants per guest. This measure aids management in identifying trends in guest preferences, as well as the effectiveness of menu price increases and other menu changes.
Guest counts represent the estimated number of guests served in our Joe's Crab Shack restaurants. The count is estimated based on the number of entrées sold. Our estimates may vary from actual guest counts due to the variability in the level of sharing of certain entrée items on our menu. Given the significant level of alcohol sales and appetizer sales at Brick House, guest count is more difficult to quantify and therefore, we do not currently calculate average check as a key performance indicator for that brand.
Average unit volume represents the average sales for restaurants included in the comparable restaurant base for a given time period, typically annually. Average unit volume reflects total sales for restaurants in our comparable restaurant base divided by the number of restaurants in our comparable restaurant base. This measure is subject to seasonality for periods less than one year.
Number of restaurant openings reflects the number of restaurants opened or converted during a particular reporting period. Before we open new restaurants or convert existing restaurants, we incur
43
Table of Contents
pre-opening costs, which are defined below. Typically, new restaurants open with an initial start-up period of higher than normalized sales volumes, which subsequently decrease to stabilized levels. While sales volumes are generally higher during the initial opening period, new restaurants typically experience normal inefficiencies in the form of higher cost of sales, labor and other direct operating expenses for several months and as a result, restaurant operating margins are generally lower during the start-up period of operation. The number and timing of restaurant openings has had, and is expected to continue to have, an impact on our results of operations.
Results of Operations
The following table presents the consolidated statement of operations for the past three fiscal years expressed as a percentage of revenues.
| | | | | | | | | | |
| | Fiscal Year* | |
|---|
| | 2012 | | 2011 | | 2010 | |
|---|
Revenues | | | 100.0 | % | | 100.0 | % | | 100.0 | % |
Restaurant operating costs | | | | | | | | | | |
Cost of sales | | | 31.3 | | | 31.5 | | | 29.6 | |
Labor and benefits | | | 27.4 | | | 27.6 | | | 27.9 | |
Occupancy expenses | | | 7.3 | | | 7.6 | | | 7.9 | |
Other operating expenses | | | 17.5 | | | 17.8 | | | 18.3 | |
General and administrative | | | 6.8 | | | 5.8 | | | 5.9 | |
Depreciation and amortization | | | 4.0 | | | 4.0 | | | 3.8 | |
Pre-opening costs | | | 0.8 | | | 1.2 | | | 1.3 | |
Restaurant impairments and closures | | | 0.0 | | | 0.1 | | | 0.3 | |
Loss on disposal of property and equipment | | | 0.5 | | | 0.3 | | | 0.9 | |
| | | | | | | | |
Total costs and expenses | | | 95.6 | % | | 95.8 | % | | 95.9 | % |
| | | | | | | | |
Income from operations | | | 4.4 | | | 4.2 | | | 4.1 | |
Interest expense, net | | | (2.0 | ) | | (2.3 | ) | | (1.1 | ) |
Gain (loss) on insurance settlements | | | (0.2 | ) | | 0.3 | | | 0.2 | |
| | | | | | | | |
Income before income taxes | | | 2.3 | % | | 2.2 | % | | 3.2 | % |
Income tax expense (benefit) | | | 0.4 | | | (0.8 | ) | | 0.4 | |
| | | | | | | | |
Net income | | | 1.9 | % | | 3.0 | % | | 2.8 | % |
| | | | | | | | |
- *
- The percentages reflected have been subject to rounding adjustments. Accordingly, figures expressed as percentages when aggregated may not be the arithmetic aggregation of the percentages that precede them.
44
Table of Contents
The following table sets forth additional operating information that we use in assessing our performance as of the periods indicated:
| | | | | | | | | | |
| | Fiscal Year | |
|---|
| | 2012 | | 2011 | | 2010 | |
|---|
Selected Other Data(1)(2): | | | | | | | | | | |
Number of restaurants open (end of period): | | | | | | | | | | |
Joe's Crab Shack | | | 129 | | | 119 | | | 113 | |
Brick House Tavern + Tap | | | 15 | | | 16 | | | 13 | |
| | | | | | | | |
Total restaurants | | | 144 | | | 135 | | | 126 | |
Average weekly sales (in thousands) | | $ | 63 | | $ | 59 | | $ | 54 | |
Restaurant operating weeks | | | 7,367 | | | 6,871 | | | 6,499 | |
Adjusted net income(3) | | | 14,675 | | | 8,592 | | | | * |
Adjusted EBITDA(3) | | | 51,991 | | | 43,270 | | | 39,352 | |
Restaurant-level profit margin(3) | | | 16.9 | % | | 15.8 | % | | 16.6 | % |
Comparable Restaurant Data(1)(2): | | | | | | | | | | |
Comparable restaurant base (end of period) | | | 123 | | | 114 | | | 111 | |
Average unit volume (in thousands) | | $ | 3,050 | | $ | 2,970 | | $ | 2,810 | |
Change in comparable restaurant sales | | | 2.2 | % | | 6.9 | % | | 4.9 | % |
Average check (Joe's only) | | $ | 23.80 | | $ | 23.07 | | $ | 22.00 | |
- (1)
- Includes both restaurant brands, unless otherwise noted.
- (2)
- See the definitions of key performance indicators beginning on page 43.
- (3)
- A reconciliation and discussion of these non-GAAP financial measures are included below under "Non-GAAP Financial Measures." These measures should be considered in addition to, rather than as a substitute for, U.S. GAAP measures.
- *
- Adjusted net income was not used by management in fiscal year 2010 as a non-GAAP financial measure and, therefore, is not included.
45
Table of Contents
Fiscal Year 2012 (52 Weeks) Compared to Fiscal Year 2011 (52 Weeks)
The following table sets forth information comparing the components of net income for the fiscal year ended December 31, 2012 and January 2, 2012.
| | | | | | | | | | | | | |
| | Fiscal Year | |
| |
| |
|---|
| | Increase
(Decrease) | | Percent
Change | |
|---|
| | 2012 | | 2011 | |
|---|
| | (dollars in thousands)
| |
|---|
Revenues | | $ | 465,056 | | $ | 405,243 | | $ | 59,813 | | | 14.8 | % |
Cost and expenses | | | | | | | | | | | | | |
Restaurant operating costs | | | | | | | | | | | | | |
Cost of sales | | | 145,451 | | | 127,607 | | | 17,844 | | | 14.0 | |
Labor and benefits | | | 127,331 | | | 111,721 | | | 15,610 | | | 14.0 | |
Occupancy expenses | | | 33,846 | | | 30,708 | | | 3,138 | | | 10.2 | |
Other operating expenses | | | 81,219 | | | 72,296 | | | 8,923 | | | 12.3 | |
General and administrative | | | 31,725 | | | 23,556 | | | 8,169 | | | 34.7 | |
Depreciation and amortization | | | 18,572 | | | 16,011 | | | 2,561 | | | 16.0 | |
Pre-opening costs | | | 3,871 | | | 4,855 | | | (984 | ) | | (20.3 | ) |
Restaurant impairments and closures | | | 115 | | | 333 | | | (218 | ) | | (65.5 | ) |
Loss on disposal of property and equipment | | | 2,296 | | | 1,295 | | | 1,001 | | | 77.3 | |
| | | | | | | | | | |
Total costs and expenses | | | 444,426 | | | 388,382 | | | 56,044 | | | 14.4 | % |
| | | | | | | | | | |
Income from operations | | | 20,630 | | | 16,861 | | | 3,769 | | | 22.4 | |
Interest expense, net | | | (9,366 | ) | | (9,215 | ) | | (151 | ) | | 1.6 | |
Gain (loss) on insurance settlements | | | (799 | ) | | 1,126 | | | (1,925 | ) | | (171.0 | ) |
| | | | | | | | | | |
Income before income taxes | | | 10,465 | | | 8,772 | | | 1,693 | | | 19.3 | % |
Income tax expense (benefit) | | | 1,751 | | | (3,291 | ) | | 5,042 | | | (153.2 | ) |
| | | | | | | | | | |
Net income | | $ | 8,714 | | $ | 12,063 | | $ | (3,349 | ) | | (27.8 | )% |
| | | | | | | | | | |
Revenues were $465.1 million for fiscal year 2012, an increase of $59.9 million, or 14.8%, compared to revenues of $405.2 million for fiscal year 2011. Comparable restaurant sales contributed $8.0 million, or 2.0%, of the total revenue increase, while non-comparable restaurants contributed $51.9 million, or 12.8%, of the total revenue increase. Comparable restaurant sales increased 2.2% as a result of 1.8% in pricing and 0.4% in guest count and mix impacts achieved through the execution of five distinct marketing campaigns with signature menu items driving a successful shift in menu mix toward our signature dishes. This has also increased our average weekly sales per restaurant from approximately $59 thousand to $63 thousand. Restaurant operating weeks increased from 6,871 in 2011 to 7,367 in 2012 due to net restaurant development.
Cost of sales increased by $17.9 million, or 14.0%, from $127.6 million for fiscal year 2011 to $145.5 million for fiscal year 2012 primarily due to an increase in revenues. As a percentage of revenues, cost of sales decreased to 31.3% from 31.5% due primarily to favorable costs of crab and seafood items.
We anticipate that cost of sales in our new restaurants will be higher than our mature restaurant base. This occurs as managers learn to optimally predict, order and make the signature menu items that our brands serve to our guests. We also anticipate that our strategy for opening restaurants will
46
Table of Contents
result in higher crab and lobster mix than our mature restaurant base. This increases total cost of goods while providing increased contribution. Additionally, significant number of restaurant openings in any period may have a material impact on cost of sales.
Labor and benefits increased by $15.6 million, or 14.0%, from $111.7 million for fiscal year 2011 to $127.3 million for fiscal year 2012 primarily due to incremental operating weeks. As a percentage of revenues, labor and benefits decreased from 27.6% to 27.4% primarily due to leverage related to pricing and sales growth partially offset by increases in average wage rate and unemployment tax rates.
Occupancy expenses increased by $3.1 million, or 10.2%, from $30.7 million for fiscal year 2011 to $33.8 million for fiscal year 2012 primarily due to new restaurant openings. As a percentage of revenues, occupancy expenses decreased from 7.6% to 7.3% due to leverage from higher unit volumes partially offset by increases in contingent rent.
Other operating expenses increased by $8.9 million, or 12.3%, from $72.3 million for fiscal year 2011 to $81.2 million for fiscal year 2012 mainly due to new restaurant openings and higher national advertising spending. As a percentage of revenues, other operating expenses decreased from 17.8% to 17.5% mainly due to favorable debit card rates caused by recent legislation and favorable utility rates partially offset by increased spending in national televised marketing.
General and administrative expenses increased by $8.1 million, or 34.7%, from $23.6 million for fiscal year 2011 to $31.7 million for fiscal year 2012 due primarily to nonrecurring restatement-related expenses of $1.9 million, and IPO-related expenses of $1.9 million, which includes $1.0 million in fees related to the termination of our management agreement with J.H. Whitney and $0.4 million in IPO-related cash bonuses. In addition, general and administrative expenses increased due to the addition of 11 new restaurants, legal and professional fees associated with being a public company, implementation of a stock-based compensation program, and increased staffing and travel expenses. As a percentage of revenues, general and administrative expenses increased from 5.8% to 6.8% primarily caused by the nonrecurring expenses related to our initial public offering ("IPO") and restatement.
Depreciation and amortization expense increased by $2.6 million, or 16.0%, to $18.6 million for fiscal year 2012 from $16.0 million for fiscal year 2011 primarily due to a higher depreciable base from newly opened restaurants. As a percentage of revenue, depreciation and amortization was flat from last year at 4.0%.
Pre-opening costs decreased by $1.0 million, or 20.3%, to $3.9 million for fiscal year 2012 from $4.9 million for fiscal year 2011 mainly due to the timing of scheduled restaurant openings and the decrease in average spending per restaurant opening due to improved efficiency in travel, hiring and training spending. We opened 11 new restaurants in both 2012 and 2011. We also incurred pre-opening costs in both years for restaurants opened in the subsequent fiscal year.
47
Table of Contents
Loss on disposal of property and equipment increased by $1.0 million to $2.3 million for fiscal year 2012 from $1.3 million for fiscal year 2011. The loss in fiscal year 2012 was primarily due to a $1.0 million write-off of property and equipment for one Joe's Crab Shack restaurant location that was closed in a prior year, $0.6 million in asset retirement losses for converted and remodeled restaurants, and replacement of restaurant equipment and facilities improvements. The loss in fiscal year 2011 was primarily due to a $0.6 million write-off of property and equipment for a Brick House location to be converted to a Joe's in fiscal year 2012, write-offs for abandoned remodel projects and $0.5 million in replacement of restaurant equipment and facilities improvement.
Interest expense, net increased by $151 thousand, or 1.6%, primarily due to write-off of debt issuance costs related to refinancing and debt repayment transactions in fiscal years 2012 and 2011, amounting to approximately $3.3 million in fiscal year 2012 and $1.4 million in fiscal year 2011 and the lower interest capitalized of $0.3 million in fiscal year 2011 to $0.1 million in fiscal year 2012. This is offset by lower average debt balances and lower interest rates in fiscal year 2012 compared to fiscal year 2011 causing a decrease in interest expense of approximately $1.3 million. In addition, we recorded a $0.4 million expense related to the termination of our interest rate swap in fiscal year 2011.
The loss on insurance settlements during fiscal year 2012 was caused by property damage write-off, business interruption losses and clean-up costs from Hurricane Sandy amounting to $1.0 million. These losses were partially offset by a $0.2 million final insurance recovery settlement related to hurricane damage sustained at one of our restaurants in fiscal year 2008. The gain in fiscal year 2011 was due to the receipt of insurance recoveries for property and business interruption losses that were recorded in prior years.
Income tax expense increased by $5.1 million from a $3.3 million income tax benefit in fiscal year 2011 to a $1.8 million income tax expense in fiscal year 2012 mainly caused by the higher pre-tax income and the release of a $4.7 million valuation allowance in fiscal year 2011. Excluding the effect of the release of the valuation allowance, the effective income tax rate increased from 15.6% in fiscal year 2011 to 16.7% in fiscal year 2012.
As a result of the foregoing, net income decreased by $3.4 million, or 27.8%, to $8.7 million for fiscal year 2012 from $12.1 million for fiscal year 2011.
48
Table of Contents
Fiscal Year 2011 (52 Weeks) Compared to Fiscal Year 2010 (53 Weeks)
The following table sets forth information comparing the components of net income for fiscal year 2011 and fiscal year 2010.
| | | | | | | | | | | | | |
| | Fiscal Year | |
| |
| |
|---|
| | Increase
(Decrease) | | Percent
Change | |
|---|
| | 2011 | | 2010 | |
|---|
| | (dollars in thousands)
| |
|---|
Revenues | | $ | 405,243 | | $ | 351,327 | | $ | 53,916 | | | 15.3 | % |
Restaurant operating costs | | | | | | | | | | | | | |
Cost of sales | | | 127,607 | | | 103,981 | | | 23,626 | | | 22.7 | |
Labor and benefits | | | 111,721 | | | 98,162 | | | 13,559 | | | 13.8 | |
Occupancy expenses | | | 30,708 | | | 27,715 | | | 2,993 | | | 10.8 | |
Other operating expenses | | | 72,296 | | | 64,382 | | | 7,914 | | | 12.3 | |
General and administrative | | | 23,556 | | | 20,719 | | | 2,837 | | | 13.7 | |
Depreciation and amortization | | | 16,011 | | | 13,190 | | | 2,821 | | | 21.4 | |
Pre-opening costs | | | 4,855 | | | 4,627 | | | 228 | | | 4.9 | |
Restaurant impairments and closures | | | 333 | | | 909 | | | (576 | ) | | (63.4 | ) |
Loss on disposal of property and equipment | | | 1,295 | | | 3,242 | | | (1,947 | ) | | (60.1 | ) |
| | | | | | | | | | |
Total costs and expenses | | | 388,382 | | | 336,927 | | | 51,455 | | | 15.3 | % |
| | | | | | | | | | |
Income from operations | | | 16,861 | | | 14,400 | | | 2,461 | | | 17.1 | |
Interest expense, net | | | (9,215 | ) | | (3,831 | ) | | (5,384 | ) | | 140.5 | |
Gain on insurance settlements | | | 1,126 | | | 589 | | | 537 | | | 91.2 | |
| | | | | | | | | | |
Income before income taxes | | | 8,772 | | | 11,158 | | | (2,386 | ) | | (21.4 | )% |
Income tax expense (benefit) | | | (3,291 | ) | | 1,456 | | | (4,747 | ) | | (326.0 | ) |
| | | | | | | | | | |
Net income | | $ | 12,063 | | $ | 9,702 | | $ | 2,361 | | | 24.3 | % |
| | | | | | | | | | |
Revenues were $405.2 million for fiscal year 2011, an increase of $53.9 million, or 15.3%, as compared to revenues of $351.3 million for fiscal year 2010. The revenue increase was driven by an increase in comparable restaurant sales and sales from non-comparable restaurants. Comparable restaurant sales and non-comparable restaurant sales contributed 4.9% and 10.4% of the total revenue increase, respectively. Comparable restaurant sales increased 6.9% for fiscal year 2011 compared to an increase of 4.9% for fiscal year 2010.
Cost of sales increased $23.6 million, or 22.7%, to $127.6 million for fiscal year 2011, as compared to $104.0 million for fiscal year 2010 due to the growth in revenues from new restaurants and existing restaurants. As a percentage of revenues, cost of sales increased to 31.5% for fiscal year 2011 from 29.6% for fiscal year 2010. The increase in cost of sales as a percentage of revenues was primarily driven by the higher cost of crab and certain other commodities along with menu mix changes, which were partially offset by pricing and operating efficiency improvements. While the menu mix shift contributed to a higher cost of sales as a percentage of revenues, the shift yielded higher gross profit dollars.
Labor and benefits increased by $13.5 million, or 13.8%, to $111.7 million for fiscal year 2011 from $98.2 million for fiscal year 2010, primarily due to new restaurant openings and higher sales from the
49
Table of Contents
comparable restaurant base. As a percentage of revenues, labor and benefits decreased to 27.6% for fiscal year 2011 from 27.9% for fiscal year 2010. The improvement was primarily due to better leveraging of restaurant management personnel and efficiencies gained from implementing a new labor scheduling software system, partially offset by higher incentive payouts.
Occupancy expenses increased by $3.0 million, or 10.8%, to $30.7 million for fiscal year 2011 from $27.7 million for fiscal year 2010, primarily due to new restaurant openings. As a percentage of revenues, occupancy expenses decreased to 7.6% for fiscal year 2011 from 7.9% for fiscal year 2010 primarily due to improved leverage relative to comparable restaurant sales growth.
Other operating expenses increased by $7.9 million, or 12.3%, to $72.3 million for fiscal year 2011 from $64.4 million for fiscal year 2010 primarily due to new restaurant openings. As a percentage of revenues, other operating expenses decreased to 17.8% for fiscal year 2011 from 18.3% for fiscal year 2010, primarily due to improved leverage relative to comparable restaurant sales growth. As a percentage of revenue, restaurant supplies, repair and maintenance costs, utility costs, and marketing and advertising costs all decreased as a result of the improved leverage and were the main drivers of the decrease in operating costs relative to revenues.
General and administrative expenses increased by $2.9 million, or 13.7%, to $23.6 million for fiscal year 2011 from $20.7 million for fiscal year 2010 primarily driven by higher personnel costs from increased Restaurant Support Center headcount to manage and support the increase in new restaurants, higher incentive expenses due to improved operating performance, and higher travel expenses due to restaurant development activity. As a percentage of revenues, general and administrative expenses decreased slightly to 5.8% for fiscal year 2011 from 5.9% for fiscal year 2010.
Depreciation and amortization expense increased by $2.8 million, or 21.4%, to $16.0 million for fiscal year 2011 from $13.2 million for fiscal year 2010 primarily due to a higher depreciable base from new restaurants opened. As a percentage of revenues, depreciation and amortization increased to 4.0% for fiscal year 2011 from 3.8% for fiscal year 2010.
Pre-opening costs increased by $0.3 million, or 4.9%, to $4.9 million for fiscal year 2011 from $4.6 million for fiscal year 2010. The increase was due to the timing of restaurant openings during 2011 and 2010. Eleven restaurants were opened during 2011 (including one conversion), and eleven restaurants were opened during 2010 (including one rebuild of an existing restaurant).
There were no impairments in fiscal year 2011. Year-over-year impairment expense for fiscal year 2011 decreased by $0.3 million. Fiscal year 2011 restaurant closure expense of $0.3 million is a $0.3 million reduction on a year-over-year basis.
50
Table of Contents
Loss on disposal of property and equipment decreased by $1.9 million to $1.3 million for fiscal year 2011 from $3.2 million for fiscal year 2010. The loss in fiscal year 2011 was primarily due to a $0.6 million writeoff of property and equipment for a Brick House location to be converted to a Joe's in 2012, a closure of one Joe's Crab Shack restaurant, writeoffs for abandoned remodel projects and $0.5 million in replacement of restaurant equipment and facilities improvement. The loss in fiscal year 2010 was primarily due to the writeoff of property and equipment for two Joe's Crab Shack restaurant locations; one was razed and rebuilt due to the condition of the facility, while the other underwent construction to re-brand it as a Brick House restaurant and the replacement of restaurant equipment and facilities improvements.
Interest expense, net increased by $5.4 million to $9.2 million for fiscal year 2011 from $3.8 million for fiscal year 2010 primarily due to the write-off of debt issuance costs related to the refinancing of our debt prior to the end of March 2011, the cost to terminate an interest rate swap agreement associated with that debt and the higher average outstanding debt balance.
Gain on insurance settlements increased by $0.5 million due to an insurance claim for one restaurant that was severely flooded and rebuilt in 2010 and an additional $1.1 million gain recognized in fiscal year 2011 related to a restaurant damaged by a hurricane in late 2008.
Income tax expense decreased by $4.8 million from $1.5 million income tax expense in fiscal year 2010 to $3.3 million income tax benefit in fiscal year 2011. The decrease is primarily due to the release of a $4.7 million deferred tax asset valuation allowance caused by our then current and expected future taxable position. Our assessment of the valuation allowance indicated that it is more likely than not that our deferred tax assets, which are primarily established for FICA credit carryforwards, would be realized, hence, the reversal of the valuation allowance and the consequent reduction in income tax expense.
As a result of the foregoing, net income increased $2.4 million, or 24.3%, in fiscal year 2011 compared to fiscal year 2010.
Seasonality
There is a seasonal component to Joe's Crab Shack's business which typically peaks in the summer months (June, July and August) and slows in the winter months (November, December, January). Because of the seasonality of our business, results for any fiscal quarter are not necessarily indicative of the results that may be achieved for future fiscal quarters or for the full fiscal year.
Liquidity and Capital Resources
Our primary sources of liquidity and capital resources have been cash provided from operating activities, cash and cash equivalents, the senior secured credit facility, and the net proceeds from our IPO. Our primary requirements for liquidity and capital are new restaurant development, working capital and general corporate needs. Our operations have not required significant working capital and,
51
Table of Contents
like many restaurant companies, we have been able to operate, and expect to continue to operate with negative working capital. Our requirement for working capital is not significant since our restaurant guests pay for their food and beverage purchases in cash or payment cards (credit or debit) at the time of sale. Thus, we are able to sell many of our inventory items before we have to pay our suppliers for such items. Our restaurants do not require significant inventories or receivables.
We believe that these sources of liquidity and capital will be sufficient to finance our continued operations and expansion plans for at least the next twelve months.
The following table shows summary cash flows information for fiscal years 2012, 2011 and 2010:
| | | | | | | | | | |
| | Fiscal Years | |
|---|
| | 2012 | | 2011 | | 2010 | |
|---|
| | (in thousands)
| |
|---|
Net cash provided by (used in): | | | | | | | | | | |
Operating activities | | $ | 40,632 | | $ | 32,279 | | $ | 37,679 | |
Investing activities | | | (44,012 | ) | | (39,379 | ) | | (29,928 | ) |
Financing activities | | | 6,584 | | | (1,747 | ) | | (155 | ) |
| | | | | | | | |
Net increase (decrease) in cash and cash equivalents | | $ | 3,204 | | $ | (8,847 | ) | $ | 7,596 | |
| | | | | | | | |
Net cash provided by operating activities increased from $32.3 million for fiscal year 2011 to $40.6 million for fiscal year 2012 primarily due to the increase in sales and restaurant-level profit, partially offset by an increase in costs associated with our initial public offering, restatement costs and expenses, and higher interest and income taxes paid in fiscal year 2012 compared to fiscal year 2011.
Net cash provided by operating activities was $32.3 million for fiscal year 2011 compared to $37.7 million for fiscal year 2010. The decrease was primarily due to an increase in cash paid for interest in fiscal year 2011 related to increased borrowings under our new senior secured credit facility, settlement of the interest rate swap agreement, and an increase in cash paid for taxes due to our increased profitability and prior utilization of historic net operating losses.
Net cash used in investing activities was $44.0 million, $39.4 million, and $29.9 million in 2012, 2011, and 2010, respectively. The net cash used was primarily attributable to capital expenditures for fiscal years 2012, 2011 and 2010 of $44.2 million, $39.4 million and $32.4 million, respectively. In each year, development of new locations accounted for most of the expenditures. Year-over-year variances in capital expenditures are due to the number and timing of new or updated locations under construction. We estimate that total capital expenditures for fiscal year 2013 will be approximately $55.0 to $60.0 million, with as many as 14 new and four converted restaurant openings planned. We also expect to spend approximately $1.0 million to purchase transferable liquor licenses for new restaurants opening in fiscal year 2013.
Net cash provided by financing activities was $6.6 million for fiscal year 2012 compared to the net cash used in financing activities of $1.7 million for fiscal year 2011, which was primarily caused by our IPO and the prepayment of a portion of our term loan as a result of the IPO.
52
Table of Contents
We completed our IPO on May 16, 2012 in which we received $81.1 million in net proceeds, after deducting direct offering costs of $9.0 million. We also prepaid $42.5 million of our term loan from the net proceeds of our IPO. We paid $0.3 million in debt issuance costs related to the amendment of our debt facility and another $1.4 million in debt issuance costs related to the new senior secured credit facility (see below). With the new senior secured credit facility, we paid down the remaining $74.5 million balance of our term loan after the IPO with a revolving credit borrowing of $45.0 million from the new senior secured credit facility and $29.5 million of cash on hand. Prior to the IPO, we had also made a scheduled payment on the term loan amounting to $0.8 million in the first quarter of 2012.
Net cash used in financing activities for fiscal year 2010 was $155 thousand and increased to $1.7 million in fiscal year 2011 primarily due to our dividend payment partially offset by net proceeds from the refinancing of our senior secured credit facility.
On October 29, 2012, we entered into a new $100.0 million five-year senior secured revolving credit facility (the "New Revolving Credit Facility"), which includes a letter of credit sub-facility of up to $10 million and a swing line sub-facility of up to $15.0 million, with a syndicate of commercial banks and other financial institutions. We used borrowings of $45.0 million under the facility along with cash on hand of $29.5 million to repay our Term Loan and expect to use the facility for working capital and other general corporate purposes. We wrote off $2.2 million of debt issuance costs associated with the repayment of the Term Loan and the terminated revolving credit availability of the prior senior secured credit agreement, which is included in interest expense. We also paid $1.4 million in debt issuance costs related to the New Revolving Credit Facility, which are capitalized and recorded as deferred charges. These costs along with $0.2 million of unamortized debt issuance costs related to the prior senior secured credit agreement will be amortized over the term of the New Revolving Credit Facility.
The interest rate for borrowings under the facility is equal to, at our option, either (a) LIBOR plus a margin of 2.00%, or (b) the Base Rate (as defined in the agreement) plus a margin of 1.00%. The applicable margins are subject to adjustment based on our leverage ratio as determined on a quarterly basis. In addition, we are required to pay a commitment fee on the unused portion of the New Revolving Credit Facility. The commitment fee rate is 0.30% per annum, and is subject to adjustment thereafter on a quarterly basis based on our leverage ratio.
The facility is guaranteed by each of our subsidiaries and secured by substantially all of our present and future assets and a lien on the capital stock or other equity interests of our direct and indirect subsidiaries. The New Revolving Credit Facility contains financial covenants including a leverage ratio and a minimum fixed charge coverage ratio, as described in the agreement. The facility also contains other covenants which, among other things limit our ability to incur additional indebtedness, create liens on our assets, make certain investments, guarantees or loans, merge, consolidate or otherwise dispose of assets other than in the ordinary course of business, make acquisitions, and pay dividends or make other restricted payments. We are in compliance with these financial covenants as of December 31, 2012.
The weighted average interest rate on the New Revolving Credit Facility at December 31, 2012 was 2.38%. As of December 31, 2012, we had outstanding letters of credit of approximately $1.8 million and available borrowing capacity of approximately $53.2 million under the New Revolving Credit Facility.
On February 6, 2013, we entered into an agreement to acquire all of the issued and outstanding equity interest of Mac Grill for approximately $55.0 million in an all-cash transaction from private equity firm Golden Gate Capital, management and other investors. The acquisition is expected to be
53
Table of Contents
completed in the second quarter of fiscal year 2013. To fund this acquisition, we received a commitment from our current lenders to upsize our new senior secured credit facility. This commitment adds a $50.0 million term loan to the New Revolving Credit Facility and modifies interest rates, commitment fees and certain covenants.
Off-Balance Sheet Arrangements
Except for restaurant operating leases, we have no material off-balance sheet arrangements.
Contractual Obligations
The following table sets forth our contractual obligations and commercial commitments as of December 31, 2012:
| | | | | | | | | | | | | | | | |
| | Payments Due by Period in Years | |
|---|
| | Total | | Less than
1 year | | 1 - 3 years | | 3 - 5 years | | More than
5 years | |
|---|
| | (in thousands)
| |
|---|
Revolving credit facility(a) | | $ | 45,000 | | $ | — | | $ | — | | $ | 45,000 | | $ | — | |
Operating leases | | | 281,651 | | | 26,157 | | | 51,994 | | | 48,735 | | | 154,765 | |
Interest payments(a) | | | 5,177 | | | 1,071 | | | 2,142 | | | 1,964 | | | — | |
Uncertain tax positions(b) | | | — | | | — | | | — | | | — | | | — | |
| | | | | | | | | | | | |
Total | | $ | 331,828 | | $ | 27,228 | | $ | 54,136 | | $ | 95,699 | | $ | 154,765 | |
| | | | | | | | | | | | |
- (a)
- Our revolving credit facility expires on October 28, 2017. We estimate future interest payments based on interest rates and applicable margin at December 31, 2012.
In connection with the expected closing of our acquisition of Mac Grill in the second quarter of 2013, we will be upsizing our existing credit facility with the addition of a term loan of $50.0 million. Estimated principal payments on the term loan are $1.2 million in 2013, $3.1 million in 2014, $3.8 million in 2015, $4.4 million in 2016, $5.0 million in 2017, and $32.5 million in 2018. Estimated interest payments on the term loan are $0.6 million in 2013, $1.1 million in 2014, $1.0 million in 2015, $1.0 million in 2016, $0.8 million in 2017, and $0.4 million in 2018 based on interest rates and applicable margin at December 31, 2012. Based on the expected terms of the upsized credit facility, the principal balance of the revolving credit facility will be paid in 2018, hence, additional interest payments of $0.2 million and $0.5 million will be paid in 2017 and 2018, respectively, based on the same interest and margin rates. These amounts are not included in the above table.
- (b)
- We have $1.1 million of uncertain tax positions, including interest and penalties, recorded in other long-term liabilities or as a reduction to net operating loss carryforwards. It is not reasonably possible to predict at this time when (or if) any of these assessments will be settled.
We are parties to certain indemnifications to third parties in the ordinary course of business. The probability of incurring an actual liability under such indemnifications is sufficiently remote so that no liability has been recorded.
Segment Reporting
We own and operate the Joe's Crab Shack and Brick House Tavern + Tap restaurant brands in the United States. All of our restaurants compete in the full-service casual dining industry, providing in-restaurant, full service, casual dining, food away from home to our guests. Our brands also possess
54
Table of Contents
similar production methods, distribution methods, and economic characteristics, resulting in similar long-term expected financial performance characteristics. We believe we meet the criteria for aggregating our restaurant operations into a single reporting segment.
Impact of Inflation
Our profitability is dependent, among other things, on our ability to anticipate and react to changes in the costs of key operating resources, including food and beverages, labor, energy and other services. Substantial increases in costs and expenses could impact our operating results to the extent such increases cannot be passed along to our guests. We have been able to substantially offset restaurant and operating cost increases resulting from inflation by altering our menu items, increasing menu prices, making productivity improvements or other adjustments. However, certain areas of costs, notably labor and utilities, can be significantly volatile or subject to significant changes due to changes in laws or regulations, such as the minimum wage laws. There can be no assurance that we will continue to generate increases in comparable restaurant sales in amounts sufficient to offset inflationary or other cost pressures.
Non-GAAP Financial Measures
We occasionally utilize financial measures and terms not calculated in accordance with accounting principles generally accepted in the United States ("GAAP") to evaluate our operating performance. These non-GAAP measures are provided to enhance the reader's overall understanding of our current financial performance. These measurements are used by many investors as a supplemental measure to evaluate the overall operating performance of companies in our industry. Management believes that investors' understanding of our performance is enhanced by including these non-GAAP financial measures as a reasonable basis for comparing our ongoing results of operations. Many investors are interested in understanding the performance of our business by comparing our results from ongoing operations from one period to the next and would ordinarily add back events that are not part of normal day-to-day operations of our business. Management and our principal stockholder also use such measures as measurements of operating performance, for planning purposes, and to evaluate the performance and effectiveness of our operational strategies.
These non-GAAP measures may not be comparable to similarly titled measures used by other companies and should not be considered in isolation or as a substitute for measures of performance prepared in accordance with GAAP. We have provided a definition below for these non-GAAP financial measures, together with an explanation of why management uses these measures and why management believes that these non-GAAP financial measures are useful to investors. In addition, we have provided a reconciliation within the press release to reconcile these non-GAAP financial measures utilized therein to its equivalent GAAP financial measure.
Adjusted net income
We calculate Adjusted net income by eliminating from net income the impact of items we do not consider indicative of our ongoing operations. Specifically, we believe that this non-GAAP measure provides greater comparability and enhanced visibility into our results of operations, excluding the impact of special charges and certain other expenses. Adjusted net income represents net income less (a) IPO-related expenses, (b) write-off of debt issuance costs, (c) non-cash loss on disposal of fixed assets related to conversion, remodels and closures, (d) loss (gain) on insurance settlements, (e) restatement expenses, (f) hedge terminations, (g) certain other expenses, (h) the income tax effect of the above described adjustments, and (i) the release of deferred tax asset valuation allowance. We believe this measure provides additional information to facilitate the comparison of our past and present financial results. We utilize results that both include and exclude the identified items in evaluating business performance. However, our inclusion of these adjusted measure should not be
55
Table of Contents
construed as an indication that our future results will be unaffected by unusual or infrequent items. In the future, we may incur expenses or generate income similar to these adjustments.
A reconciliation of net income to Adjusted net income is as follows:
| | | | | | | |
| | Fiscal Year | |
|---|
| | 2012 | | 2011 | |
|---|
| | (in thousands)
| |
|---|
Net income | | $ | 8,714 | | $ | 12,063 | |
Adjustments: | | | | | | | |
IPO-related expenses | | | 1,864 | | | — | |
Write-off of debt issuance costs | | | 3,281 | | | 1,378 | |
Non-cash loss on disposal of fixed assets related to conversion, remodels and closures | | | 1,549 | | | 628 | |
Loss (gain) on insurance settlements | | | 799 | | | (1,126 | ) |
Restatement expenses | | | 1,873 | | | — | |
Hedge termination | | | — | | | 427 | |
Other expenses | | | 448 | | | 579 | |
Income tax effect of adjustments above | | | (3,853 | ) | | (698 | ) |
Release of deferred tax asset valuation allowance | | | — | | | (4,659 | ) |
| | | | | | |
Adjusted net income | | $ | 14,675 | | $ | 8,592 | |
| | | | | | |
EBITDA and Adjusted EBITDA
EBITDA represents earnings before interest, taxes, depreciation and amortization. Adjusted EBITDA further adjusts EBITDA to reflect the additions and eliminations described in the table below. EBITDA and Adjusted EBITDA are supplemental measures of operating performance that do not represent and should not be considered as alternatives to net income or cash flow from operations, as determined by GAAP, and our calculation thereof may not be comparable to that reported by other companies. EBITDA and Adjusted EBITDA have limitations as analytical tools, and you should not consider them in isolation, or as a substitute for analysis of our results as reported under GAAP. Some of the limitations are:
- •
- EBITDA and Adjusted EBITDA do not reflect our cash expenditures, or future requirements for capital expenditures or contractual commitments;
- •
- EBITDA and Adjusted EBITDA do not reflect changes in, or cash requirements for, our working capital needs;
- •
- EBITDA and Adjusted EBITDA do not reflect the significant interest expense, or the cash requirements necessary to service interest or principal payments on our debt;
- •
- EBITDA and Adjusted EBITDA do not reflect our tax expense or the cash requirements to pay our taxes;
- •
- although depreciation and amortization are non-cash charges, the assets being depreciated and amortized will often have to be replaced in the future, EBITDA and Adjusted EBITDA do not reflect any cash requirements for such replacements; and
- •
- other companies in the restaurant industry may calculate EBITDA and Adjusted EBITDA differently than we do, limiting their usefulness as comparative measures.
Because of these limitations, EBITDA and Adjusted EBITDA should not be considered as measures of discretionary cash available to us to invest in the growth of our business. We compensate for these limitations by relying primarily on our GAAP results and using EBITDA and Adjusted
56
Table of Contents
EBITDA only supplementally. We further believe that our presentation of these GAAP and non-GAAP financial measurements provide information that is useful to analysts and investors because they are important indicators of the strength of our operations and the performance of our core business.
As noted in the table below, Adjusted EBITDA includes adjustments for restaurant impairments and closures, gains and losses on disposal of property and equipment, gains on insurance settlements and pre-opening costs, among other items. It is reasonable to expect that these items will occur in future periods. However, we believe these adjustments are appropriate because the amounts recognized can vary significantly from period to period, do not directly relate to the ongoing operations of our restaurants and complicate comparisons of our internal operating results and operating results of other restaurant companies over time. In addition, Adjusted EBITDA includes adjustments for other items that we do not expect to regularly record following our IPO, such as sponsor management fees. Each of the normal recurring adjustments and other adjustments described in this paragraph and in the reconciliation table below help management with a measure of our core operating performance over time by removing items that are not related to day-to-day restaurant-level operations.
In addition, management and our principal stockholder use EBITDA and Adjusted EBITDA:
- •
- to evaluate our capacity to fund capital expenditures and expand our business; and
- •
- to calculate incentive compensation payments for our employees, including assessing performance under our annual incentive compensation plan.
We also present Adjusted EBITDA because it is a measure which is used in calculating financial ratios in material debt covenants in our senior secured credit facility. Some of the adjustments included in Adjusted EBITDA are subject to certain limitations under our credit facility for purposes of calculating our debt covenants. As of December 31, 2012, we are in compliance with these covenants. We believe that inclusion of supplementary adjustments to EBITDA applied in presenting Adjusted EBITDA is appropriate to provide additional information to investors about how the covenants in those agreements operate. The material covenants in our senior secured credit facility are discussed further in "Management's Discussion and Analysis of Financial Condition and Results of Operations—Liquidity and Capital Resources."
57
Table of Contents
Adjusted EBITDA is calculated as follows:
| | | | | | | | | | |
| | Fiscal Year | |
|---|
| | 2012 | | 2011 | | 2010 | |
|---|
| | (in thousands)
| |
|---|
Net income | | $ | 8,714 | | $ | 12,063 | | $ | 9,702 | |
Income tax expense (benefit) | | | 1,751 | | | (3,291 | ) | | 1,456 | |
Interest expense, net | | | 9,366 | | | 9,215 | | | 3,831 | |
Depreciation and amortization | | | 18,572 | | | 16,011 | | | 13,190 | |
| | | | | | | | |
EBITDA | | $ | 38,403 | | $ | 33,998 | | $ | 28,179 | |
| | | | | | | | |
Adjustments: | | | | | | | | | | |
Deferred rent(a) | | | 1,544 | | | 1,813 | | | 1,675 | |
Restaurant impairments and closures | | | 115 | | | 333 | | | 909 | |
Non-cash loss on disposal of property and equipment | | | 2,245 | | | 1,269 | | | 3,110 | |
Sponsor management fees(b) | | | 388 | | | 1,060 | | | 1,025 | |
Loss (gain) on insurance settlements | | | 799 | | | (1,126 | ) | | (589 | ) |
Restatement expenses | | | 1,873 | | | — | | | — | |
Pre-opening costs | | | 3,871 | | | 4,855 | | | 4,627 | |
Transaction costs(c) | | | 1,714 | | | 579 | | | — | |
Stock-based compensation | | | 628 | | | 36 | | | 44 | |
Other expenses(d) | | | 411 | | | 453 | | | 372 | |
| | | | | | | | |
Adjusted EBITDA | | $ | 51,991 | | $ | 43,270 | | $ | 39,352 | |
| | | | | | | | |
- (a)
- Deferred rent represents the non-cash rent expense calculated as GAAP rent expense in any year less amounts payable in cash under the leases during the year. In measuring our operational performance, we focus on our cash rent payments. See Note 2 to our consolidated financial statements for additional details.
- (b)
- Sponsor management fees consist of fees and expenses paid to J.H. Whitney under the management services agreement. We terminated this agreement in connection with the completion of the IPO during fiscal year 2012.
- (c)
- Transaction costs consist of fees and expenses related to corporate transactions such as debt or equity issuances, including the IPO, amendments to debt agreements or acquisitions.
- (d)
- In the context of our Adjusted EBITDA reconciliation, other expenses consist of costs related to abandoned new restaurant developments, fees payable to the agent under historic credit facilities, and compensation and expenses paid to certain members of our board of directors and prior to the IPO, the management committee of our former parent company, JCS Holdings, LLC.
Restaurant-level profit and Restaurant-level profit margin
As used herein, Restaurant-level profit represents revenues less (i) licensing revenue not attributable to core restaurant operations, (ii) cost of sales, (iii) labor and benefits, (iv) occupancy expenses, and (v) other operating expenses (vi) plus non-cash rent related to restaurant operations. Restaurant-level profit margin is calculated as restaurant-level profit divided by restaurant sales. Restaurant-level profit and restaurant-level profit margin are a supplemental measure of operating performance of our restaurants that do not represent and should not be considered as an alternative to net income or revenues as determined by GAAP, and our calculation thereof may not be comparable to that reported by other companies. Restaurant-level profit and restaurant-level profit margin have
58
Table of Contents
limitations as an analytical tool, and you should not consider them in isolation, or as a substitute for analysis of our results as reported under GAAP. Management believes restaurant-level profit and restaurant-level profit margin are an important component of financial results because they are a widely used metric within the restaurant industry to evaluate restaurant-level productivity, efficiency and performance. Management uses restaurant-level profit and restaurant-level profit margin as key metrics to evaluate our financial performance compared with our competitors, to evaluate the profitability of incremental sales and to evaluate our performance across periods.
| | | | | | | | | | |
| | Fiscal Year | |
|---|
| | 2012 | | 2011 | | 2010 | |
|---|
| | (in thousands, except percentages)
| |
|---|
Revenues | | $ | 465,056 | | $ | 405,243 | | $ | 351,327 | |
Less: Licensing and other revenues | | | (340 | ) | | (584 | ) | | (373 | ) |
| | | | | | | | |
Restaurant sales(A) | | $ | 464,716 | | $ | 404,659 | | $ | 350,954 | |
| | | | | | | | |
Restaurant operating costs | | | | | | | | | | |
Cost of sales | | | 145,451 | | | 127,607 | | | 103,981 | |
Labor and benefits | | | 127,331 | | | 111,721 | | | 98,162 | |
Occupancy expenses | | | 33,846 | | | 30,708 | | | 27,715 | |
Other operating expenses | | | 81,219 | | | 72,296 | | | 64,382 | |
Deferred rent | | | (1,536 | ) | | (1,806 | ) | | (1,597 | ) |
| | | | | | | | |
Restaurant-level profit(B) | | $ | 78,405 | | $ | 64,133 | | $ | 58,311 | |
| | | | | | | | |
Restaurant-level profit margin (B÷A) | | | 16.9 | % | | 15.8 | % | | 16.6 | % |
Recent Accounting Pronouncements
Disclosure regarding recent accounting pronouncements can be found in Note 2 of our consolidated financial statements contained in this Form 10-K.
Critical Accounting Policies
We prepare our consolidated financial statements in conformity with GAAP. The preparation of these financial statements requires us to make estimates and assumptions that affect the reported amounts of assets and liabilities and disclosure of contingent assets and liabilities at the date of the financial statements, and the reported amounts of revenues and expenses during the reporting period. Actual results could differ from those estimates. Critical accounting policies are those that management believes are both most important to the portrayal of our financial condition and operating results, and require management's most difficult, subjective or complex judgments, often as a result of the need to make estimates about the effect of matters that are inherently uncertain. We base our estimates on historical experience, outside advice from parties believed to be experts in such matters, and on various other assumptions that are believed to be reasonable under the circumstances, the results of which form the basis for making judgments about the carrying value of assets and liabilities that are not readily apparent from other sources. Judgments and uncertainties affecting the application of those policies may result in materially different amounts being reported under different conditions or using different assumptions. Our significant accounting policies can be found in Note 2 to our consolidated financial statements. We consider the following policies to be the most critical in understanding the judgments that are involved in preparing our consolidated financial statements.
We evaluate the recoverability of the carrying amount of long-lived assets, which include property and equipment and intangible assets with definite useful lives, whenever events or changes in circumstances indicate that the carrying value may not be fully recoverable. Our review for impairment
59
Table of Contents
of these long-lived assets takes into account estimates of future undiscounted cash flows. Factors considered include, but are not limited to, significant underperformance relative to historical or projected future operating results, significant changes in the manner of use of the acquired assets or the strategy for the overall business, and significant negative industry or economic trends. Our asset group for impairment testing is comprised of the assets and liabilities of each of our individual restaurants, since this is the lowest level of identifiable cash flows. An impairment loss is recognized if the future undiscounted cash flows associated with the assets are less than their carrying value. Impairment losses are measured as the amount by which the carrying values of the assets exceed their fair values. For assets held for sale or disposal, we measure fair value using quoted market prices or an estimation of net realizable value.
From time to time, we have decided to close or dispose of restaurants. Typically, such decisions are made based on operating performance or strategic considerations and must be made before the actual costs or proceeds of disposition are known, and management must make estimates of these outcomes. Such outcomes could include the sale of a leasehold, mitigating costs through a tenant or subtenant, or negotiating a buyout of a remaining lease term. In these instances, management evaluates possible outcomes, frequently using outside real estate and legal advice, and records provisions for the effect of such outcomes. The accuracy of such provisions can vary materially from original estimates, and management regularly monitors the adequacy of the provisions until final disposition occurs.
We currently lease all of our restaurant locations under leases classified as operating leases. Minimum base rent for our operating leases, which generally have escalating rentals over the term of the lease, is recorded on a straight-line basis over the lease term. As such, an equal amount of rent expense is attributed to each period during the term of the lease regardless of when actual payments occur. Lease terms begin on the date we take possession under the lease and include cancelable option periods where failure to exercise such options would result in an economic penalty. The difference between rent expense and actual cash payments is classified as deferred rent in our consolidated balance sheets.
Some of our leases provide for contingent rent, which is determined as a percentage of sales in excess of specified minimum sales levels. We recognize contingent rent expense prior to the achievement of the specified sales target that triggers the contingent rent, provided achievement of the sales target is considered probable.
We maintain large deductibles on workers' compensation, general liability, property, and business interruption insurance coverage. These policies have been structured to limit our per-occurrence exposure. We record a liability for workers' compensation and general liability for all unresolved claims based on actuarial information provided by our insurance brokers and insurers, combined with management judgments regarding economic conditions, including future medical and indemnity costs, the frequency and severity of claims and claim development history, case jurisdiction, applicable legislation and settlement practices. Changes in any of these factors in the future may produce materially different amounts of expense than otherwise would be reported under these insurance programs.
We are subject to U.S. federal income tax and income taxes imposed in the state and local jurisdictions where we operate our restaurants. Deferred income taxes are provided on temporary differences between financial statement and income tax reporting. Temporary differences are differences between the amounts of assets and liabilities reported for financial statement purposes and
60
Table of Contents
their tax bases. Deferred tax assets are recognized for temporary differences that will be deductible in future years' tax returns and for operating loss and tax credit carryforwards. Deferred tax assets are reduced by a valuation allowance if it is deemed more likely than not that some or all of the deferred tax assets will not be realized. In assessing the realizability of deferred tax assets, we consider whether it is more likely than not that some portion or all of the deferred tax assets will not be realized. The ultimate realization of deferred tax assets is dependent upon the generation of future taxable income during the periods in which those temporary differences become deductible. We consider the scheduled reversal of deferred tax liabilities, projected future taxable income, and tax planning strategies in making this assessment. Deferred tax liabilities are recognized for temporary differences that will be taxable in future years' tax returns.
We account for uncertain tax using a minimum probability threshold that a tax position must meet before a financial statement benefit is recognized. The minimum threshold is defined as a tax position that is more likely than not to be sustained upon examination by tax authorities, based on the technical merits of the position. The tax benefit to be recognized is measured as the largest amount of benefit that is greater than fifty percent likely of being realized upon ultimate settlement. See Note 8 for information regarding changes in our unrecognized tax benefits.
We recognize expense for stock-based compensation awards, which is equal to the fair value of the awards at grant date, ratably in general and administrative expenses in our consolidated statements of operations over the requisite service period.
Calculating stock-based compensation expense requires the input of subjective assumptions. We determine the fair value of each stock appreciation right grant using the Black-Scholes option-pricing model with assumptions based primarily on historical data. Specific inputs to the model include the expected life of the stock-based awards, stock price volatility, dividend yield and risk-free interest rate. Restricted stock is valued using the closing stock price of the business day prior to the grant date.
Since we do not have historical exercise experience on stock appreciation rights, we used the simplified method of estimating expected term. As a newly public company, we estimated expected volatility using the volatility of a peer group over a recent historical period equal to the same expected term of the award. The expected dividend yield is based on our history of not paying regular dividends in the past and our current intention to not pay regular dividends in the foreseeable future. Risk-free rate is based on the U.S. Treasury yield curve in effect at the time of the grant using the term equal to our expected term.
We recognize legal claims and other loss contingencies when information becomes available indicating that a liability has been incurred and the loss amount can be reasonably estimated. Predicting the outcome of claims and litigation involves substantial uncertainties that could cause actual results to vary materially from estimates. We recognize legal expenses, including those related to loss contingencies, as incurred.
Generally, we do not recognize gain contingencies until all contingencies have been resolved, but we recognize gain contingencies that are recoveries of previously recognized contingent losses when realization of the recovery is deemed probable and reasonably estimable.
Forward-Looking Statements
This annual report on Form 10-K includes and incorporates by reference "forward-looking statements" within the meaning of the Securities Act of 1933 and the Securities Exchange Act of 1934. Forward-looking statements are subject to known and unknown risks and uncertainties, many of which
61
Table of Contents
may be beyond our control. We caution you that the forward looking information presented in this annual report is not a guarantee of future events, and that actual events and results may differ materially from those made in or suggested by the forward looking information contained in this annual report. In addition, forward-looking statements generally can be identified by the use of forward-looking terminology such as "may," "plan," "seek," "comfortable with," "will," "expect," "intend," "estimate," "anticipate," "believe" or "continue" or the negative thereof or variations thereon or similar terminology. Examples of forward-looking statements in this annual report include, but not limited to, our expected new restaurant development plans, our anticipated acquisition of Mac Grill, our fiscal year 2013 capital expenditure expectations and the effectiveness of investments and new measures in our accounting and finance function to improve our internal controls over financial reporting. A number of important factors could cause actual events and results to differ materially from those contained in or implied by the forward-looking statements, including the risk factors discussed in this annual report. Any forward-looking information presented herein is made only as of the date of this report, and we do not undertake any obligation to update or revise any forward-looking information to reflect changes in assumptions, the occurrence of unanticipated events, or otherwise.
Item 7A. QUANTITATIVE AND QUALITATIVE DISCLOSURES ABOUT MARKET RISK
Commodity Price Risk
Many of the food products we purchase are affected by commodity pricing that is subject to price volatility caused by weather, production problems, delivery difficulties and other factors that are outside our control and are generally unpredictable. For fiscal year 2012, crab, lobster and shrimp accounted for approximately 49% of total food purchases. Crab and lobster are wild caught and sourced from government regulated and sustainable fisheries. We have experienced increases in crab costs, but in certain species, we have seen prices begin to moderate. Other categories affected by the commodities markets, such as seafood, beef and fish, may each account for approximately 5% to 10% of our food purchases. While we have some of our food items prepared to our specifications, our food items are based on generally available products, and if any existing suppliers fail, or are unable to deliver in quantities we require, we believe that there are sufficient other quality suppliers in the marketplace that our sources of supply can be replaced as necessary. We also recognize, however, that commodity pricing is extremely volatile and can change unpredictably and over short periods. Our purchasing department negotiates prices and quantities for all of our ingredients through either cancellable contracts (with varying length terms), spot market purchases or commodity pricing formulas. Changes in commodity prices would generally affect us and our competitors similarly, depending on the terms and duration of supply contracts. We also enter into fixed price supply contracts for certain products in an effort to minimize volatility of supply and pricing. In many cases, or over the longer term, we believe we will be able to pass through some or all of the increased commodity costs by adjusting menu pricing. From time to time, competitive circumstances, or judgments about consumer acceptance of price increases, may limit menu price flexibility, and in those circumstances, increases in commodity prices can have an adverse effect on margins.
Interest Rate Risk
We are subject to interest rate risk in connection with borrowings under our senior secured credit facility, which bear interest at variable rates. As of December 31, 2012, we had $45.0 million outstanding under our senior secured credit facility. Derivative financial instruments, such as interest rate swap agreements and interest rate cap agreements, may be used for the purpose of managing fluctuating interest rate exposures that exist from our variable rate debt obligations that are expected to remain outstanding. We do not have any outstanding interest rate swap or interest rate cap agreements. Interest rate changes do not affect the market value of such debt, but could impact the amount of our interest payments, and accordingly, our future earnings and cash flows, assuming other factors are held constant. A 1% -point change in the interest rate on the outstanding balance of our variable rate debt would result in a $0.5 million change in our annual results of operations.
62
Table of Contents
Item 8. FINANCIAL STATEMENTS AND SUPPLEMENTARY DATA.
INDEX TO CONSOLIDATED FINANCIAL STATEMENTS
| | | | |
Report of Independent Registered Public Accounting Firm | | | 64 | |
Consolidated Balance Sheets as of December 31, 2012 and January 2, 2012 | | | 65 | |
Consolidated Statements of Operations for the years ended December 31, 2012, January 2, 2012 and January 3, 2011 | | | 66 | |
Consolidated Statements of Comprehensive Income for the years ended December 31, 2012, January 2, 2012 and January 3, 2011 | | | 67 | |
Consolidated Statements of Changes in Stockholders' Equity for the years ended December 31, 2012, January 2, 2012 and January 3, 2011 | | | 68 | |
Consolidated Statements of Cash Flows for the years ended December 31, 2012, January 2, 2012 and January 3, 2011 | | | 69 | |
Notes to Consolidated Financial Statements | | | 70 | |
63
Table of Contents
Report of Independent Registered Public Accounting Firm
To the Board of Directors and Shareholders of
Ignite Restaurant Group, Inc.
In our opinion, the accompanying consolidated balance sheets and the related consolidated statements of operations, comprehensive income, changes in stockholders' equity and of cash flows present fairly, in all material respects, the financial position of Ignite Restaurant Group, Inc. and its subsidiaries (the "Company") at December 31, 2012 and January 2, 2012, and the results of their operations and their cash flows for the fiscal years ended December 31, 2012, January 2, 2012, and January 3, 2011, in conformity with accounting principles generally accepted in the United States of America. These financial statements are the responsibility of the Company's management. Our responsibility is to express an opinion on these financial statements based on our audits. We conducted our audits of these statements in accordance with the standards of the Public Company Accounting Oversight Board (United States). Those standards require that we plan and perform the audit to obtain reasonable assurance about whether the financial statements are free of material misstatement. An audit includes examining, on a test basis, evidence supporting the amounts and disclosures in the financial statements, assessing the accounting principles used and significant estimates made by management, and evaluating the overall financial statement presentation. We believe that our audits provide a reasonable basis for our opinion.
/s/ PricewaterhouseCoopers LLP
Houston, Texas
March 20, 2013
64
Table of Contents
IGNITE RESTAURANT GROUP, INC.
CONSOLIDATED BALANCE SHEETS
(in thousands, except par value)
| | | | | | | |
| | December 31,
2012 | | January 2,
2012 | |
|---|
ASSETS | | | | | | | |
Current assets | | | | | | | |
Cash and cash equivalents | | $ | 6,929 | | $ | 3,725 | |
Accounts receivable | | | 6,285 | | | 7,848 | |
Inventories | | | 4,841 | | | 4,179 | |
Deferred tax assets | | | 1,615 | | | 905 | |
Other current assets | | | 4,625 | | | 5,190 | |
| | | | | | |
Total current assets | | | 24,295 | | | 21,847 | |
Property and equipment, net | | | 165,746 | | | 143,021 | |
Trademarks, net | | | 1,755 | | | 2,198 | |
Deferred charges, net | | | 1,702 | | | 4,035 | |
Deferred tax assets | | | 5,043 | | | 3,741 | |
Other assets | | | 2,897 | | | 2,993 | |
| | | | | | |
Total assets | | $ | 201,438 | | $ | 177,835 | |
| | | | | | |
LIABILITIES AND STOCKHOLDERS' EQUITY | | | | | | | |
Current liabilities | | | | | | | |
Accounts payable | | $ | 14,083 | | $ | 14,157 | |
Accrued liabilities | | | 23,068 | | | 20,390 | |
Current portion of debt obligations | | | — | | | 3,007 | |
| | | | | | |
Total current liabilities | | | 37,151 | | | 37,554 | |
Long-term debt obligations | | | 45,000 | | | 114,750 | |
Deferred rent | | | 11,744 | | | 8,554 | |
Other long-term liabilities | | | 1,326 | | | 1,178 | |
| | | | | | |
Total liabilities | | | 95,221 | | | 162,036 | |
| | | | | | |
Commitments and contingencies | | | | | | | |
Stockholders' equity | | | | | | | |
Preferred stock, $0.01 par value per share, 100,000 shares authorized; zero shares issued and outstanding | | | — | | | — | |
Common stock, $0.01 par value per share, 500,000 shares authorized; 25,633 and 19,178 shares issued and outstanding, respectively | | | 256 | | | 192 | |
Additional paid-in capital | | | 85,728 | | | 4,088 | |
Accumulated earnings | | | 20,233 | | | 11,519 | |
| | | | | | |
Total stockholders' equity | | | 106,217 | | | 15,799 | |
| | | | | | |
Total liabilities and stockholders' equity | | $ | 201,438 | | $ | 177,835 | |
| | | | | | |
See accompanying notes to consolidated financial statements.
65
Table of Contents
IGNITE RESTAURANT GROUP, INC.
CONSOLIDATED STATEMENTS OF OPERATIONS
(in thousands, except earnings per share)
| | | | | | | | | | |
| | Fiscal Year | |
|---|
| | 2012 | | 2011 | | 2010 | |
|---|
Revenues | | $ | 465,056 | | $ | 405,243 | | $ | 351,327 | |
Costs and expenses | | | | | | | | | | |
Restaurant operating costs | | | | | | | | | | |
Cost of sales | | | 145,451 | | | 127,607 | | | 103,981 | |
Labor and benefits | | | 127,331 | | | 111,721 | | | 98,162 | |
Occupancy expenses | | | 33,846 | | | 30,708 | | | 27,715 | |
Other operating expenses | | | 81,219 | | | 72,296 | | | 64,382 | |
General and administrative | | | 31,725 | | | 23,556 | | | 20,719 | |
Depreciation and amortization | | | 18,572 | | | 16,011 | | | 13,190 | |
Pre-opening costs | | | 3,871 | | | 4,855 | | | 4,627 | |
Restaurant impairments and closures | | | 115 | | | 333 | | | 909 | |
Loss on disposal of property and equipment | | | 2,296 | | | 1,295 | | | 3,242 | |
| | | | | | | | |
Total costs and expenses | | | 444,426 | | | 388,382 | | | 336,927 | |
| | | | | | | | |
Income from operations | | | 20,630 | | | 16,861 | | | 14,400 | |
Interest expense, net | | | (9,366 | ) | | (9,215 | ) | | (3,831 | ) |
Gain (loss) on insurance settlements | | | (799 | ) | | 1,126 | | | 589 | |
| | | | | | | | |
Income before income taxes | | | 10,465 | | | 8,772 | | | 11,158 | |
Income tax expense (benefit) | | | 1,751 | | | (3,291 | ) | | 1,456 | |
| | | | | | | | |
Net income | | $ | 8,714 | | $ | 12,063 | | $ | 9,702 | |
| | | | | | | | |
Basic and diluted net income per share data: | | | | | | | | | | |
Net income per share | | | | | | | | | | |
Basic and diluted | | $ | 0.37 | | $ | 0.63 | | $ | 0.51 | |
Weighted average shares outstanding | | | | | | | | | | |
Basic | | | 23,328 | | | 19,178 | | | 19,178 | |
Diluted | | | 23,329 | | | 19,178 | | | 19,178 | |
See accompanying notes to consolidated financial statements.
66
Table of Contents
IGNITE RESTAURANT GROUP, INC.
CONSOLIDATED STATEMENTS OF COMPREHENSIVE INCOME
(in thousands)
| | | | | | | | | | |
| | Fiscal Year | |
|---|
| | 2012 | | 2011 | | 2010 | |
|---|
Net income | | $ | 8,714 | | $ | 12,063 | | $ | 9,702 | |
| | | | | | | | |
Other comprehensive income: | | | | | | | | | | |
Change in fair value of cash flow hedge | | | — | | | 66 | | | 222 | |
Reclassification adjustment for loss on termination of cash flow hedge included in interest expense, net | | | — | | | 427 | | | — | |
| | | | | | | | |
Other comprehensive income before tax | | | — | | | 493 | | | 222 | |
Income tax expense related to other comprehensive income | | | — | | | — | | �� | — | |
| | | | | | | | |
Other comprehensive income, net of tax | | | — | | | 493 | | | 222 | |
| | | | | | | | |
Comprehensive income | | $ | 8,714 | | $ | 12,556 | | $ | 9,924 | |
| | | | | | | | |
See accompanying notes to condensed consolidated financial statements.
67
Table of Contents
IGNITE RESTAURANT GROUP, INC.
CONSOLIDATED STATEMENTS OF CHANGES IN STOCKHOLDERS' EQUITY
(in thousands)
| | | | | | | | | | | | | | | | | | | |
| | Common Stock | |
| |
| | Accumulated
Other
Comprehensive
Loss | |
| |
|---|
| | Additional
Paid-in
Capital | | Accumulated
(Deficit)/
Earnings | |
| |
|---|
| | Shares | | Amount | | Total | |
|---|
Balance at December 28, 2009 | | | 19,178 | | $ | 192 | | $ | 77,387 | | $ | (3,626 | ) | $ | (715 | ) | $ | 73,238 | |
Net income | | | — | | | — | | | — | | | 9,702 | | | — | | | 9,702 | |
Change in fair value of cash flow hedge | | | — | | | — | | | — | | | — | | | 222 | | | 222 | |
Stock-based compensation | | | — | | | — | | | 45 | | | — | | | — | | | 45 | |
| | | | | | | | | | | | | | |
Balance at January 3, 2011 | | | 19,178 | | $ | 192 | | $ | 77,432 | | $ | 6,076 | | $ | (493 | ) | $ | 83,207 | |
Net income | | | — | | | — | | | — | | | 12,063 | | | — | | | 12,063 | |
Change in fair value of cash flow hedge | | | — | | | — | | | — | | | — | | | 66 | | | 66 | |
Termination of interest rate swap | | | — | | | — | | | — | | | — | | | 427 | | | 427 | |
Dividends paid | | | — | | | — | | | (73,380 | ) | | (6,620 | ) | | — | | | (80,000 | ) |
Stock-based compensation | | | — | | | — | | | 36 | | | — | | | — | | | 36 | |
| | | | | | | | | | | | | | |
Balance at January 2, 2012 | | | 19,178 | | $ | 192 | | $ | 4,088 | | $ | 11,519 | | $ | — | | $ | 15,799 | |
Net income | | | — | | | — | | | — | | | 8,714 | | | — | | | 8,714 | |
Issuance of common stock for initial public offering, net of fees and issuance costs | | | 6,439 | | | 64 | | | 81,060 | | | — | | | — | | | 81,124 | |
Issuance of equity awards, net | | | 16 | | | — | | | 102 | | | | | | | | | 102 | |
Stock-based compensation | | | — | | | — | | | 478 | | | — | | | — | | | 478 | |
| | | | | | | | | | | | | | |
Balance at December 31, 2012 | | | 25,633 | | $ | 256 | | $ | 85,728 | | $ | 20,233 | | $ | — | | $ | 106,217 | |
| | | | | | | | | | | | | | |
See accompanying notes to consolidated financial statements.
68
Table of Contents
IGNITE RESTAURANT GROUP, INC.
CONSOLIDATED STATEMENTS OF CASH FLOWS
(in thousands)
| | | | | | | | | | |
| | 2012 | | 2011 | | 2010 | |
|---|
Cash flows from operating activities | | | | | | | | | | |
Net income | | $ | 8,714 | | $ | 12,063 | | $ | 9,702 | |
Adjustments to reconcile net income to net cash provided by operating activities: | | | | | | | | | | |
Depreciation and amortization | | | 18,572 | | | 16,011 | | | 13,190 | |
Amortization of debt issuance costs | | | 4,058 | | | 2,270 | | | 754 | |
Stock-based compensation | | | 628 | | | 36 | | | 45 | |
Restaurant impairments | | | 47 | | | — | | | 276 | |
Deferred income tax | | | (2,012 | ) | | (4,646 | ) | | — | |
Loss (gain) on insurance related to property and equipment | | | 397 | | | (1,126 | ) | | (589 | ) |
Non-cash loss on disposal of property and equipment | | | 2,245 | | | 1,269 | | | 3,110 | |
Decrease (increase) in operating assets: | | | | | | | | | | |
Accounts receivable | | | 439 | | | (2,389 | ) | | (1,131 | ) |
Inventory | | | (662 | ) | | (212 | ) | | (155 | ) |
Other operating assets | | | 1,768 | | | (2,532 | ) | | 888 | |
Increase (decrease) in operating liabilities: | | | | | | | | | | |
Accounts payable and accrued liabilities | | | 3,099 | | | 8,296 | | | 9,421 | |
Other operating liabilities | | | 3,339 | | | 3,239 | | | 2,168 | |
| | | | | | | | |
Net cash provided by operating activities | | | 40,632 | | | 32,279 | | | 37,679 | |
| | | | | | | | |
Cash flows from investing activities | | | | | | | | | | |
Purchases of property and equipment | | | (44,226 | ) | | (39,442 | ) | | (32,420 | ) |
Proceeds from property insurance claims | | | 1,341 | | | 281 | | | 2,383 | |
Proceeds from disposal of property and equipment | | | 28 | | | 4 | | | 109 | |
Purchases of liquor licenses | | | (1,155 | ) | | (222 | ) | | — | |
| | | | | | | | |
Net cash used in investing activities | | | (44,012 | ) | | (39,379 | ) | | (29,928 | ) |
| | | | | | | | |
Cash flows from financing activities | | | | | | | | | | |
Initial public offering | | | 81,124 | | | — | | | — | |
Borrowings on revolving credit facility | | | 50,500 | | | — | | | — | |
Payments on revolving credit facility | | | (5,500 | ) | | — | | | — | |
Proceeds from long-term debt | | | — | | | 120,000 | | | — | |
Payments on long-term debt | | | (117,750 | ) | | (37,046 | ) | | (102 | ) |
Payments on capital leases | | | (7 | ) | | (30 | ) | | (53 | ) |
Debt issuance costs paid | | | (1,735 | ) | | (4,671 | ) | | — | |
Dividends paid | | | — | | | (80,000 | ) | | — | |
Taxes paid related to net share settlement of equity awards | | | (48 | ) | | — | | | — | |
| | | | | | | | |
Net cash provided by (used in) financing activities | | | 6,584 | | | (1,747 | ) | | (155 | ) |
| | | | | | | | |
Net increase (decrease) in cash and cash equivalents | | | 3,204 | | | (8,847 | ) | | 7,596 | |
Cash and cash equivalents at beginning of period | | | 3,725 | | | 12,572 | | | 4,976 | |
| | | | | | | | |
Cash and cash equivalents at end of period | | $ | 6,929 | | $ | 3,725 | | $ | 12,572 | |
| | | | | | | | |
See accompanying notes to consolidated financial statements.
69
Table of Contents
IGNITE RESTAURANT GROUP, INC.
Notes to Consolidated Financial Statements
Note 1—Description of Business
Ignite Restaurant Group, Inc. (referred to herein as the "Company," "Ignite," "we," "us" or "our") owns and operates two full service, casual dining restaurant brands under the names Joe's Crab Shack and Brick House Tavern + Tap. As of December 31, 2012, we owned and operated 129 Joe's Crab Shack restaurants and 15 Brick House Tavern + Tap restaurants in 33 states within the United States.
Prior to our initial public offering ("IPO"), as further discussed in Note 3, J.H. Whitney VI, L.P. ("J.H. Whitney VI"), an affiliate of J.H. Whitney Capital Partners, LLC, owned 100% of the Series A preferred units of JCS Holdings, LLC, our former parent. Immediately after completion of the IPO, JCS Holdings, LLC distributed substantially all of the shares of our common stock then held by it to J.H. Whitney VI and to the holders of its common units. As of December 31, 2012, J.H. Whitney VI owns approximately 68% of our total outstanding common stock.
Note 2—Significant Accounting Policies
Principles of Consolidation
The accompanying consolidated financial statements include the accounts of Ignite and its wholly-owned subsidiaries. All significant intercompany balances and transactions have been eliminated in consolidation.
Fiscal Year
Our fiscal year ends on the Monday nearest to December 31 of each year. Fiscal year 2010 was a 53-week year, while fiscal years 2012 and 2011 were 52-week years. References to 2012, 2011 and 2010 are references to fiscal years ended December 31, 2012, January 2, 2012, and January 3, 2011, respectively. The first three quarters of our fiscal year consist of 12 weeks and our fourth quarter consists of 16 weeks for 52-week fiscal years and 17 weeks for 53-week fiscal years.
Segment Reporting
We own and operate the Joe's Crab Shack and Brick House Tavern + Tap restaurant brands in the United States. All of our restaurants compete in the full-service casual dining industry, providing in-restaurant, full service, casual dining, food away from home to our guests. Our brands also possess similar production methods, distribution methods, and economic characteristics, resulting in similar long-term expected financial performance characteristics. Therefore, we believe we meet the criteria for aggregating our restaurant operations into a single reporting segment.
Use of Estimates
The preparation of financial statements in conformity with generally accepted accounting principles requires management to make estimates and assumptions that affect the reported amounts of assets and liabilities and disclosure of contingent assets and liabilities at the date of the financial statements and the reported amounts of revenues and expenses during the reporting period. Actual results could differ from those estimates.
70
Table of Contents
Fair Value Measurements
We apply fair value accounting for all financial assets and liabilities and nonfinancial assets and liabilities that are recognized or disclosed at fair value in the financial statements. We define fair value as the price that would be received from selling an asset or paid to transfer a liability in an orderly transaction between market participants at the measurement date. When determining the fair value measurements for assets and liabilities that are required to be recorded at fair value, we assume the highest and best use of the asset by market participants in which we would transact and the market-based risk measurements or assumptions that market participants would use in pricing the asset or liability, such as inherent risk, transfer restrictions, and credit risk.
We apply the following fair value hierarchy, which prioritizes the inputs used to measure fair value into three levels, and base the categorization within the hierarchy upon the lowest level of input that is available and significant to the fair value measurement:
| | |
Level 1—Quoted prices in active markets for identical assets or liabilities. | | |
Level 2—Observable inputs other than quoted prices in active markets for identical assets or liabilities, quoted prices for identical or similar assets or liabilities in inactive markets, or other inputs that are observable or can be corroborated by observable market data for substantially the full term of the assets or liabilities. | | |
Level 3—Inputs that are both unobservable and significant to the overall fair value measurement reflect an entity's estimates of assumptions that market participants would use in pricing the asset or liability. | | |
Financial Instruments
We record all financial instruments at cost, which is the fair value at the date of transaction. The amounts reported in the consolidated balance sheets for cash and cash equivalents, accounts receivable, and accounts payable and accrued liabilities approximate their fair value because of the short-term maturities of these instruments.
Revenue Recognition
Revenues from food and beverage sales are recognized when payment is tendered at the point-of-sale and are presented net of promotional allowances, discounts, and employee meals. Sales taxes collected from customers and remitted to governmental authorities are presented on a net basis within revenues in our consolidated statements of operations.
Revenues from the sale of gift cards are deferred and recognized upon redemption. Deferred gift card revenue is included in accrued liabilities in our consolidated balance sheets. Our gift cards do not have an expiration date and we do not deduct non-usage fees from outstanding gift card balances. We recognize gift card breakage income exclusive of amounts subject to state escheatment laws when the likelihood of redemption of the cards becomes remote. We recorded breakage income of $0.2 million and $0.3 million during 2012 and 2011, respectively, and is included in revenues in our consolidated statements of operations. Fiscal year 2011 was the first year in which we had accumulated enough redemption historical data to make such an estimate. The amount recognized in 2011 includes breakage income related to gift cards sold since the inception of the program in 2007.
We also benefit from certain vendor rebates which are recorded as a reduction to cost of sales. Additionally, we may enter into certain contracts that provide marketing allowances, which are amortized over the life of the contract.
71
Table of Contents
Cash and Cash Equivalents
We consider cash on hand in restaurants, deposits in banks, and short-term marketable securities with original maturities of 90 days or less as cash and cash equivalents.
Accounts Receivable
Accounts receivable consist primarily of receivables from major credit card processors. We do not provide an allowance for doubtful accounts due to the relative certainty of collection of these receivables and based on our prior loss history with these credit card companies.
Inventories
Inventories are stated at the lower of cost or market, and consist of food, beverage, and retail merchandise. Inventory cost is determined using the average cost method.
Property and Equipment
Property and equipment acquired is stated at cost less accumulated depreciation. Depreciation is calculated using the straight-line method, based on the following estimated useful lives:
| | |
Leasehold improvements | | Shorter of effective lease term or estimated useful life |
Restaurant equipment | | 10 years |
Furniture and fixtures | | 5 - 10 years |
Computer equipment and software | | 3 - 5 years |
We capitalize major replacements and improvements that increase the useful life of the asset, whereas we expense repairs and maintenance as incurred. The cost and accumulated depreciation of assets sold or otherwise disposed of are removed from the balance sheet and any gain or loss is included in the statement of operations.
We capitalize direct costs associated with the site acquisition and construction of restaurant units, including direct internal payroll and payroll-related costs, incremental travel expenses, and interest cost as leasehold improvements. If we subsequently determine that we will not continue acquiring or developing a project for which we have been capitalizing costs, any previously capitalized internal development and third-party costs will be written off as dead deals and included in general and administrative expenses.
Impairment of Long-Lived Assets
We evaluate the recoverability of the carrying amount of long-lived assets, which include property and equipment and intangible assets with definite useful lives, whenever events and circumstances indicate that the carrying value of an asset may not be fully recoverable. Our review for impairment of these long-lived assets takes into account estimates of future undiscounted cash flows (level 3 in the fair value hierarchy). Factors considered include, but are not limited to, significant underperformance relative to historical or projected future operating results, significant changes in the manner of use of the acquired assets or the strategy for the overall business, and significant negative industry or economic trends. Our asset group for impairment testing is comprised of the assets and liabilities of each of our individual restaurants, since this is the lowest level of identifiable cash flows. An impairment loss is recognized if the future undiscounted cash flows associated with the assets are less than their carrying value. Impairment losses are measured as the amount by which the carrying values of the assets exceed their fair values. For assets held for sale or disposal, we measure fair value using quoted market prices or an estimation of net realizable value.
72
Table of Contents
Restaurant Closure
Costs associated with restaurant closures are recorded when the decision is made to close the restaurant. Expenses and losses related to closed restaurants are recorded in restaurant impairments and closures and loss on disposal of property and equipment in our consolidated statements of operations. The corresponding liability, which is approximately $168 thousand and $149 thousand as of December 31, 2012 and January 2, 2012, respectively, is reflected in accrued liabilities in our consolidated balance sheet. We also wrote off $1.0 million in 2012 to loss on disposal of property and equipment related to a restaurant that was temporarily closed in a prior year due to foundational issues. During the fourth quarter of 2012, we determined not to resume operations at the restaurant and are pursuing recovery for our losses.
Trademarks
Trademarks consist of intangible assets we acquired during the purchase of Joe's Crab Shack. At the time of purchase, the trademarks were determined to be approximately $4.4 million, and as of December 31, 2012 and January 2, 2012 had accumulated amortization of approximately $2.7 million and $2.2 million, respectively. Trademarks are amortized on a straight-line basis over their estimated useful life of 10 years. Amortization expense was approximately $0.4 million for 2012, 2011 and 2010, respectively.
Scheduled amortization of trademarks is as follows (in thousands):
| | | | |
Fiscal Year | | Amount | |
|---|
2013 | | $ | 443 | |
2014 | | | 443 | |
2015 | | | 443 | |
2016 | | | 426 | |
| | | | |
| | $ | 1,755 | |
| | | | |
Deferred Charges
Debt issuance costs representing costs to obtain long-term financing are accounted for as a deferred charge and amortized using the interest method for the term loan and straight-line method for the revolving credit facility over the term of the related financing. Amortization of debt issuance costs, which was approximately $4.1 million, $2.3 million, and $0.7 million for 2012, 2011 and 2010, respectively, are included in interest expense in our consolidated statements of operations. See Note 6 regarding write-off of debt issuance costs related to debt refinancing transactions and the IPO.
Liquor Licenses
The costs of purchasing transferable liquor licenses through open markets in jurisdictions with a limited number of authorized liquor licenses are capitalized as indefinite-lived intangibles and included in other assets. The costs of obtaining non-transferable liquor licenses that are directly issued by local government agencies are expensed as incurred. Annual liquor license renewal fees are expensed over the renewal term. Liquor licenses are reviewed for impairment annually or whenever events or changes in circumstances indicate that the carrying amount may not be recoverable. We recorded a $47 thousand impairment charge related to liquor licenses in 2012 to write down carrying value to their fair value and is included in restaurant impairments and closures in our consolidated statements of operations. We determined fair value based on prices in the open market for licenses in similar jurisdictions (level 2 in the fair value hierarchy). No impairment charge was recorded in 2011 and 2010.
73
Table of Contents
As of December 31, 2012 and January 2, 2012, liquor licenses had a balance of $2.5 million and $1.4 million, respectively.
Leases
We currently lease all of our restaurant locations under leases classified as operating leases. Minimum base rent for our operating leases, which generally have escalating rentals over the term of the lease, is recorded on a straight-line basis over the lease term. As such, an equal amount of rent expense is attributed to each period during the term of the lease regardless of when actual payments occur. Lease terms begin on the date we take effective control of the property and include cancelable option periods where failure to exercise such options would result in an economic penalty. The difference between rent expense and actual cash payments is classified as deferred rent in the consolidated balance sheets.
Certain leases contain provisions that require additional rental payments based upon restaurant sales volume ("contingent rentals"). Contingent rentals are accrued each period as the liabilities are incurred, in addition to the straight-line rent expense noted above.
Insurance Liabilities
We maintain large deductibles on workers' compensation, general liability, property, and business interruption insurance coverage. These policies have been structured to limit our per-occurrence exposure. Our estimated liabilities for workers' compensation and general liability are based on our judgment regarding a number of assumptions and factors, including the frequency and severity of claims, claims development history, case jurisdiction, applicable legislation, and our claims settlement practices.
Advertising Expenses
Advertising production costs are expensed at the time the advertising is first aired. All other advertising costs are expensed as incurred. Advertising expenses were approximately $20.7 million, $17.9 million, and $17.2 million for 2012, 2011 and 2010, respectively, and are included in other operating expenses in our consolidated statements of operations.
Pre-opening Costs
Non-capital expenditures associated with the opening of new or converted restaurants are expensed as incurred. Pre-opening costs consist of costs incurred prior to opening a new or converted restaurant and are made up primarily of manager salaries, employee payroll, and other costs related to training and preparing new or converted restaurants for opening. Pre-opening costs also include an accrual for straight-line rent recorded during the period between the date we take effective control of the property and the restaurant opening date for our leased locations.
Stock-based Compensation
We recognize expense for stock-based compensation awards, which is equal to the fair value of the awards at grant date, ratably in general and administrative expenses in our consolidated statements of operations over the requisite service period.
74
Table of Contents
The following table provides the significant weighted average assumptions used to determine the fair value of stock appreciation rights on the grant date using the Black-Scholes option-pricing model for awards granted during the fiscal year ended December 31, 2012:
| | |
Expected term | | 6.3 years |
Expected volatility | | 48.2% |
Dividend yield | | 0.0% |
Risk-free rate | | 0.8% - 1.1% |
Since we do not have historical exercise experience on stock appreciation rights, we used the simplified method of estimating expected term. As a newly public company, we estimated expected volatility using the volatility of a peer group over a recent historical period equal to the same expected term of the award. The expected dividend yield is based on our history of not paying regular dividends in the past and our current intention to not pay regular dividends in the foreseeable future. Risk-free rate is based on the U.S. Treasury yield curve in effect at the time of the grant using the term equal to our expected term. Restricted stock is valued using the closing stock price of the business day prior to the grant date.
Income Taxes
We are subject to U.S. federal income tax and income taxes imposed in the state and local jurisdictions where we operate our restaurants. Deferred income taxes are provided on temporary differences between financial statement and income tax reporting. Temporary differences are differences between the amounts of assets and liabilities reported for financial statement purposes and their tax bases. Deferred tax assets are recognized for temporary differences that will be deductible in future years' tax returns and for operating loss and tax credit carryforwards. Deferred tax assets are reduced by a valuation allowance if it is deemed more likely than not that some or all of the deferred tax assets will not be realized. In assessing the realizability of deferred tax assets, we consider whether it is more likely than not that some portion or all of the deferred tax assets will not be realized. The ultimate realization of deferred tax assets is dependent upon the generation of future taxable income during the periods in which those temporary differences become deductible. We consider the scheduled reversal of deferred tax liabilities, projected future taxable income, and tax planning strategies in making this assessment. Deferred tax liabilities are recognized for temporary differences that will be taxable in future years' tax returns.
We account for uncertain tax using a minimum probability threshold that a tax position must meet before a financial statement benefit is recognized. The minimum threshold is defined as a tax position that is more likely than not to be sustained upon examination by tax authorities, based on the technical merits of the position. The tax benefit to be recognized is measured as the largest amount of benefit that is greater than fifty percent likely of being realized upon ultimate settlement. See Note 8 for information regarding changes in our unrecognized tax benefits.
75
Table of Contents
Net Income per Share
Basic net income per share is computed using the weighted average number of common shares outstanding during the period, while diluted net income per share is computed using the weighted average number of common shares outstanding plus all potentially dilutive common share equivalents outstanding during the period. The following table summarizes the components to determine the numerator and denominators of basic and diluted net income per share (in thousands):
| | | | | | | | | | |
| | Fiscal Year | |
|---|
| | 2012 | | 2011 | | 2010 | |
|---|
Numerator: | | | | | | | | | | |
Net income | | $ | 8,714 | | $ | 12,063 | | $ | 9,702 | |
| | | | | | | | |
Denominator: | | | | | | | | | | |
Basic weighted average shares outstanding | | | 23,328 | | | 19,178 | | | 19,178 | |
Effect of dilutive securities | | | 1 | | | — | | | — | |
| | | | | | | | |
Diluted weighted average shares outstanding | | | 23,329 | | | 19,178 | | | 19,178 | |
| | | | | | | | |
The effect of dilutive securities above relates to 9,000 shares of restricted stock outstanding as of December 31, 2012. For the fiscal year ended December 31, 2012, we excluded 509,000 SARs from the computation of diluted net income per share because their effect was anti-dilutive.
Claims and Other Contingencies
We recognize legal claims and other loss contingencies when information becomes available indicating that a liability has been incurred and the loss amount can be reasonably estimated. Predicting the outcome of claims and litigation involves substantial uncertainties that could cause actual results to vary materially from estimates. We recognize legal expenses, including those related to loss contingencies, as incurred.
Generally, we do not recognize gain contingencies until all contingencies have been resolved, but we recognize gain contingencies that are recoveries of previously recognized contingent losses when realization of the recovery is deemed probable and reasonably estimable.
Recent Accounting Pronouncement
In July 2012, the FASB issued ASU No. 2012-02,Intangibles—Goodwill and Other (Topic 350): Testing Indefinite-Lived Intangible Assets for Impairment, which allows an entity the option to first assess qualitatively whether it is more likely than not that the indefinite-lived intangible asset is impaired, thus necessitating a quantitative impairment test. An entity is not required to calculate the fair value of an indefinite-lived intangible asset and perform the quantitative test unless it determines that it is more likely than not that the asset is impaired. The update is effective for annual and interim impairment tests performed for fiscal years beginning after September 15, 2012. We do not believe that adoption of this update will have a significant impact on our consolidated financial statements.
Note 3—Stockholders' Equity
Initial Public Offering
On May 10, 2012, we completed our initial public offering of 5,769,231 shares of our common stock at an offering price of $14.00 per share. Of the 5,769,231 shares offered, 5,572,703 shares were sold by us, and 196,528 were sold by the selling stockholders. We granted the underwriters an option to purchase up to an additional 865,384 shares of common stock at the IPO price, which the underwriters
76
Table of Contents
exercised in full on May 10, 2012. Our common stock began trading on the NASDAQ National Market under the symbol "IRG" on May 11, 2012.
Including the underwriters' exercise of the over-allotment option, we received net proceeds from the offering of approximately $81.1 million, after deducting underwriter discounts and commissions of $6.3 million and other fees and expenses of $2.7 million. We did not receive any proceeds from the shares sold by the selling stockholders. A portion of the net proceeds was used to prepay $42.5 million of our outstanding Term Loan and to pay J.H. Whitney a $1.0 million fee in connection with the termination of our management agreement.
Stock Split
Immediately prior to the completion of the offering, we effected a 19,178.226-to-1 stock split. We also reduced the par value of our common stock from $1.00 per share to $0.01 per share. Since the increase in the number of shares is not proportionate to the decrease in par value, we increased common stock in the consolidated balance sheet and statement of changes in stockholders' equity by $0.2 million with a corresponding decrease to additional paid-in capital.
The share and per share information included in these consolidated financial statements have been retroactively adjusted to reflect the stock split for all periods presented.
Authorized Capital Stock
In connection with our initial public offering, we amended and restated our Certificate of Incorporation. The amended and restated Certificate of Incorporation provides that we are authorized to issue 500,000,000 shares of common stock, par value $0.01 per share, and 100,000,000 shares of preferred stock, par value $0.01 per share.
Note 4—Property and Equipment, net
Property and equipment consists of the following (in thousands):
| | | | | | | |
| | December 31,
2012 | | January 2,
2012 | |
|---|
Leasehold improvements | | $ | 200,120 | | $ | 164,127 | |
Equipment | | | 24,787 | | | 21,160 | |
Furniture and fixtures | | | 13,491 | | | 10,318 | |
Construction in progress | | | 5,694 | | | 10,594 | |
| | | | | | |
| | | 244,092 | | | 206,199 | |
Less accumulated depreciation | | | 78,346 | | | 63,178 | |
| | | | | | |
| | $ | 165,746 | | $ | 143,021 | |
| | | | | | |
Depreciation expense was approximately $18.1 million, $15.6 million, and $12.7 million for fiscal years 2012, 2011, and 2010, respectively.
Based on a regular review of our restaurant units for impairment, we identified certain restaurants with carrying values on property and equipment that may not be fully recoverable. Restaurant impairments for these units amounting to approximately $0.3 million were recorded in 2010. No impairment charge was recorded in 2012 and 2011. The impairment charges reflect the difference between the impaired assets' carrying value and their fair value, and are recorded as part of restaurant impairments and closures in the consolidated statements of operations.
77
Table of Contents
Note 5—Accrued Liabilities
The components of accrued liabilities were as follows (in thousands):
| | | | | | | |
| | December 31,
2012 | | January 2,
2012 | |
|---|
Payroll and related costs | | $ | 7,910 | | $ | 6,652 | |
Property taxes | | | 2,444 | | | 2,663 | |
Sales and alcohol taxes | | | 1,901 | | | 2,008 | |
Deferred gift card revenue | | | 2,691 | | | 1,990 | |
Workers' compensation | | | 2,732 | | | 1,891 | |
Insurance premiums financing | | | — | | | 1,359 | |
Interest | | | 185 | | | 1,076 | |
Occupancy | | | 1,617 | | | 873 | |
Professional fees | | | 2,079 | | | 1,132 | |
Other | | | 1,509 | | | 746 | |
| | | | | | |
| | $ | 23,068 | | $ | 20,390 | |
| | | | | | |
Note 6—Debt Obligations
Debt obligations consisted of the following as of the dates presented below (in thousands):
| | | | | | | |
| | December 31,
2012 | | January 2,
2012 | |
|---|
Revolving credit facility, expiring October 2017 | | $ | 45,000 | | $ | — | |
$120.0 million term loan, due March 2016 | | | — | | | 117,750 | |
Capital leases | | | — | | | 7 | |
| | | | | | |
Total debt | | | 45,000 | | | 117,757 | |
Less current portion | | | — | | | 3,007 | |
| | | | | | |
Long-term debt obligations | | $ | 45,000 | | $ | 114,750 | |
| | | | | | |
In March 2011, we entered into a $145.0 million senior secured credit facility with General Electric Capital Corporation and a syndicate of financial institutions. The credit facility consisted of (a) a $120.0 million term loan ("Term Loan") and (b) a revolving credit facility of up to $25.0 million ("Revolving Credit Facility") which included a letter of credit subfacility for up to $6.0 million and a swing line subfacility of up to $5.0 million. Borrowings under the senior secured credit facility bore interest at a fluctuating rate equal to, at our option, either (a) a base rate plus three and one-half percent (3.50%) per annum, or (b) LIBOR (subject to a floor of 1.5%) plus four and three-quarter percent (4.75%) per annum. The base rate was the higher of (1) the federal funds rate plus 0.50%, (2) the U.S. prime rate last quoted byThe Wall Street Journal, and (3) the sum of the three-month LIBOR (subject to a floor of 1.5%) plus the excess of the LIBOR applicable margin over the base rate applicable margin. The Revolving Credit Facility provided for a commitment fee of 0.5% per year on the unused portion.
The weighted annual average interest rate (including margin) on the Term Loan during 2011 was 6.25%. As of January 2, 2012, we had outstanding letters of credit of approximately $1.4 million and available borrowing capacity of approximately $23.6 million under the Revolving Credit Facility.
We used the proceeds from the Term Loan to repay prior indebtedness, make an $80.0 million distribution to our stockholder, pay certain fees and expenses associated with the closing of the credit facility, and terminate our interest rate swap contract. Deferred financing fees of $4.6 million relating to the Term Loan were capitalized as deferred charges in the consolidated balance sheets. The
78
Table of Contents
termination of the interest rate swap was paid in March 2011 and was recorded as a $0.4 million increase to interest expense, net. The $1.4 million balance of deferred financing costs related to our prior indebtedness was written off to interest expense in our consolidated statements of operations.
On April 23, 2012, we entered into an amendment to our senior secured credit agreement that became effective on the date we received proceeds from our IPO. As required by the amendment, we used $42.5 million of our net proceeds to prepay a portion of our Term Loan. The prepayment was applied to the next six regularly scheduled quarterly term loan principal payments and reduced the remaining principal payments on a pro rata basis. We paid $0.3 million in debt issuance costs related to this amendment. We also wrote off $1.1 million of debt issuance costs associated with the repayment, which has been included as a component of interest expense, net in the accompanying consolidated statement of operations for the fiscal year ended December 31, 2012.
On October 29, 2012, we entered into a new $100.0 million five-year senior secured revolving credit facility (the "New Revolving Credit Facility"), which includes a letter of credit sub-facility of up to $10 million and a swing line sub-facility of up to $15.0 million, with a syndicate of commercial banks and other financial institutions. We used borrowings of $45.0 million under the facility along with cash on hand of $29.5 million to repay our Term Loan and expect to use the facility for working capital and other general corporate purposes. We wrote off $2.2 million of debt issuance costs associated with the repayment of the Term Loan and the terminated revolving credit availability of the prior senior secured credit agreement, which is included in interest expense. We also paid $1.4 million in debt issuance costs related to the New Revolving Credit Facility, which are capitalized and recorded as deferred charges. These costs along with $0.2 million of unamortized debt issuance costs related to the prior senior secured credit agreement will be amortized over the term of the New Revolving Credit Facility.
The interest rate for borrowings under the facility is equal to, at our option, either (a) LIBOR plus a margin of 2.00%, or (b) the Base Rate (as defined in the agreement) plus a margin of 1.00%. The applicable margins are subject to adjustment based on our leverage ratio as determined on a quarterly basis. In addition, we are required to pay a commitment fee on the unused portion of the New Revolving Credit Facility. The commitment fee rate is 0.30% per annum, and is subject to adjustment thereafter on a quarterly basis based on our leverage ratio.
The facility is guaranteed by each of our subsidiaries and secured by substantially all of our present and future assets and a lien on the capital stock or other equity interests of our direct and indirect subsidiaries. The New Revolving Credit Facility contains financial covenants including a leverage ratio and a minimum fixed charge coverage ratio, as described in the agreement. The facility also contains other covenants which, among other things limit our ability to incur additional indebtedness, create liens on our assets, make certain investments, guarantees or loans, merge, consolidate or otherwise dispose of assets other than in the ordinary course of business, make acquisitions, and pay dividends or make other restricted payments. We are in compliance with these financial covenants as of December 31, 2012.
The weighted average interest rate on the New Revolving Credit Facility at December 31, 2012 was 2.38%. As of December 31, 2012, we had outstanding letters of credit of approximately $1.8 million and available borrowing capacity of approximately $53.2 million under the New Revolving Credit Facility.
On February 6, 2013, we entered into a commitment to amend our New Revolving Credit Facility in connection with our pending acquisition of Mac Grill. See Note 13.
The carrying value of our long-term debt approximates fair value. The estimate of the fair value of our debt is based on observable market information from a third party pricing source, which is classified as a level 2 input within the fair value hierarchy.
79
Table of Contents
Note 7—Insurance and Other Recoveries
Our restaurant in Oceanside, New York was temporarily closed in the fourth quarter of 2012 due to damage sustained from Hurricane Sandy. The restaurant reopened prior to the end of 2012. We recognized a loss of $1.0 million in the fourth quarter of 2012, which was comprised of a $0.6 million loss on disposal of property and equipment and $0.4 million of expenses and other clean-up costs incurred while the restaurant was closed. The insurance claim is still in process and no insurance proceeds have been received or recorded as of December 31, 2012. During 2012, we received $0.2 million of insurance proceeds related to hurricane damage sustained to a restaurant in 2010. We also had a restaurant in the Nashville, Tennessee area that was closed in April 2010 due to flooding and reopened in May 2010.
In relation to each of these casualty events, the following amounts were recorded in our consolidated financial statements (in thousands):
| | | | | | | | | | |
| | 2012 | | 2011 | | 2010 | |
|---|
Proceeds from property insurance claims | | $ | 1,341 | | $ | 281 | | $ | 2,383 | |
Business interruption recoveries | | $ | — | | $ | — | | $ | 276 | |
Gain (loss) on insurance settlements related to property and equipment | | $ | (397 | ) | $ | 1,126 | | $ | 589 | |
In April 2010, certain of our restaurants in the Gulf Coast area were affected by British Petroleum's Deepwater Horizon oil spill ("BP Oil Spill") due to reduced tourism levels in some of our markets. British Petroleum set up a fund, which is administered by a third party administrator, to indemnify entities affected by the BP Oil Spill. During 2010, we received $0.2 million in emergency payment claims for lost profits, which was recorded as a reduction of other operating expenses in our consolidated statements of operations.
Note 8—Income Taxes
All of our operations are domestic. Income tax expense (benefit) consisted of the following (in thousands):
| | | | | | | | | | |
| | 2012 | | 2011 | | 2010 | |
|---|
Current income tax | | | | | | | | | | |
Federal | | $ | 1,973 | | $ | 286 | | $ | 620 | |
State | | | 1,790 | | | 1,069 | | | 836 | |
| | | | | | | | |
| | | 3,763 | | | 1,355 | | | 1,456 | |
| | | | | | | | |
Deferred income tax | | | | | | | | | | |
Federal | | | (1,542 | ) | | (4,793 | ) | | — | |
State | | | (470 | ) | | 147 | | | — | |
| | | | | | | | |
| | | (2,012 | ) | | (4,646 | ) | | — | |
| | | | | | | | |
Total income tax expense (benefit) | | $ | 1,751 | | $ | (3,291 | ) | $ | 1,456 | |
| | | | | | | | |
At December 31, 2012, we had federal income tax credit carryforwards of approximately $8.1 million, comprised primarily of the credit for FICA and Medicare taxes paid on reported employee tip income. We also have Alternative Minimum Tax ("AMT") credits of approximately $0.3 million and a Texas margin tax credit of approximately $0.1 million. The FICA credit will begin to expire in 2029 if unused prior to that time, while the AMT credit may be carried forward indefinitely. The Texas margin tax credit will expire in 2028 if unused prior to that time.
80
Table of Contents
A reconciliation between the amount of income tax expense (benefit) determined by applying the applicable U.S. statutory income tax rate to income before income taxes (loss) is as follows (in thousands):
| | | | | | | | | | |
| | 2012 | | 2011 | | 2010 | |
|---|
Tax expense at the federal statutory income tax rate | | $ | 3,663 | | $ | 2,982 | | $ | 3,905 | |
Permanent differences | | | 17 | | | 28 | | | 6 | |
State income taxes, net of federal impact | | | 546 | | | 698 | | | 630 | |
Tax credit carryforwards | | | (2,633 | ) | | (2,384 | ) | | (1,922 | ) |
Change in valuation allowance | | | — | | | (4,659 | ) | | (1,237 | ) |
Other | | | 158 | | | 44 | | | 74 | |
| | | | | | | | |
Total income tax expense (benefit) | | $ | 1,751 | | $ | (3,291 | ) | $ | 1,456 | |
| | | | | | | | |
Effective income tax rate | | | 16.7 | % | | (37.5 | )% | | 13.0 | % |
| | | | | | | | |
In December 2011, we released the valuation allowance based on consistent historical earnings and our projections of future performance, which support the conclusion that we will fully utilize the credit carryforwards.
The components of our deferred tax assets and liabilities are as follows (in thousands):
| | | | | | | |
| | December 31,
2012 | | January 2,
2012 | |
|---|
Deferred tax assets—current | | | | | | | |
Accrued insurance | | $ | 1,073 | | $ | 1,277 | |
Accrued expenses | | | 709 | | | 330 | |
| | | | | | |
| | | 1,782 | | | 1,607 | |
Deferred tax liability—current | | | | | | | |
Prepaid expenses | | | (167 | ) | | (702 | ) |
| | | | | | |
Net deferred tax asset—current | | $ | 1,615 | | $ | 905 | |
| | | | | | |
Deferred tax assets—non-current | | | | | | | |
Credit carryforwards | | $ | 8,493 | | $ | 10,274 | |
Deferred rent | | | 2,092 | | | — | |
Intangibles | | | 1,155 | | | 978 | |
Stock-based compensation | | | 225 | | | — | |
State net operating loss carryforwards | | | 186 | | | 145 | |
Inventories | | | 112 | | | 92 | |
Other | | | 428 | | | 365 | |
| | | | | | |
| | | 12,691 | | | 11,854 | |
Deferred tax liabilities—non-current | | | | | | | |
Property and equipment | | | (7,648 | ) | | (8,113 | ) |
| | | | | | |
Net deferred tax asset—non-current | | $ | 5,043 | | $ | 3,741 | |
| | | | | | |
We file income tax returns in the U.S. federal jurisdiction and various state and local jurisdictions. We are subject to U.S. federal income tax examinations by tax authorities for the fiscal year ended January 3, 2011 and forward. We are also subject to various state income tax examinations by state tax authorities for the fiscal year ended December 31, 2007 and forward. We did not have any tax examinations during fiscal year 2012, and we have no other income tax audits either open or scheduled at this time.
81
Table of Contents
The following table shows the changes in the amount of our uncertain tax positions (exclusive of the effect of interest and penalties) (in thousands):
| | | | | | | | | | |
| | 2012 | | 2011 | | 2010 | |
|---|
Balance at beginning of year | | $ | 744 | | $ | 630 | | $ | 535 | |
Additions for tax positions of the current year | | | 152 | | | 116 | | | 100 | |
Reductions for tax positions of prior years | | | (10 | ) | | (2 | ) | | (5 | ) |
| | | | | | | | |
Balance at end of year | | $ | 886 | | $ | 744 | | $ | 630 | |
The full balance of approximately $886 thousand, if challenged by taxing authorities and not sustained, would affect the annual effective rate, net of any federal tax benefits. We do not expect any changes that will significantly impact our uncertain tax positions within the next twelve months.
We accrue interest and penalties related to our uncertain tax positions as a component of income tax expense. During the years ended December 31, 2012, January 2, 2012, and January 3, 2011, we recognized approximately $85 thousand, $63 thousand and $41 thousand of interest and penalties, respectively. We had approximately $212 thousand and $128 thousand accrued for interest and penalties as of December 31, 2012 and January 2, 2012, respectively.
Note 9—Commitments and Contingencies
In the course of business affairs and operations, we are subject to possible loss contingencies arising from third-party litigation and federal, state, and local environmental, health, and safety laws and regulations.
Minimum Lease Commitments
We lease our restaurants, office facilities, and certain equipment under operating lease agreements with remaining terms ranging from 1 to 25 years. The future minimum rental commitments under these noncancelable operating leases are as follows (in thousands):
| | | | |
Fiscal Year | | Amount | |
|---|
2013 | | $ | 26,157 | |
2014 | | | 26,385 | |
2015 | | | 25,609 | |
2016 | | | 24,496 | |
2017 | | | 24,239 | |
Thereafter | | | 154,765 | |
| | | | |
| | $ | 281,651 | |
| | | | |
The above amounts do not include property taxes, insurance, and normal maintenance that we are required to pay. Rental expense relating to operating leases amounted to approximately $30.8 million, $27.1 million, and $24.5 million for 2012, 2011 and 2010, respectively. A number of our leases also provide for contingent rentals based on a percentage of sales above a specified minimum. Total contingent rentals, included in rent expense, amounted to approximately $2.3 million, $1.7 million, and $1.2 million for 2012, 2011 and 2010, respectively.
Litigation
We are a defendant or otherwise involved in a number of lawsuits in the ordinary course of business. When the potential liability can be estimated and the loss is considered probable, we record the estimated loss. Due to uncertainties related to the resolution of lawsuits and claims, the ultimate
82
Table of Contents
outcome may differ from our estimates. We believe that the ultimate exposure with respect to these pending lawsuits and claims is not expected to have a material adverse effect on our consolidated financial position, results of operations, or cash flows.
On July 18, 2012, we announced our intention to restate our financial statements for the years ended December 28, 2009, January 3, 2011 and January 2, 2012 and the related interim periods. On July 20, 2012, a putative class action complaint was filed in the U.S. District Court for the Southern District of Texas against us, certain of our current directors and officers and the underwriters in the IPO. The plaintiffs allege that all the defendants violated Section 11 of the Securities Act of 1933 (the "Securities Act") and certain of our directors and officers have control person liability under Section 15 of the Securities Act, based on allegations that in light of the July 18, 2012 restatement announcement, our IPO registration statement and prospectus contained untrue statements of material facts, omitted to state other facts necessary to make the statements made not misleading, and omitted to state material facts required to be stated therein. Plaintiffs seek unspecified compensatory damages and attorneys' fees and costs.
We believe this lawsuit is without merit, and we are vigorously defending the lawsuit. However, we are unable to predict the outcome of this case and any future related cases.
We are also subject to a variety of other claims arising in the ordinary course of our business, including personal injury claims, contract claims and claims alleging violations of federal and state law regarding workplace and employment matters, discrimination and similar matters.
Note 10—Stock-Based Compensation
In May 2012, our stockholders approved the adoption of our 2012 Omnibus Incentive Plan ("2012 Plan"). Under the 2012 Plan, we are authorized to grant stock-based awards in the form of stock options, restricted stock, restricted stock units, stock appreciation rights ("SARs"), and other stock-based awards. The maximum number of common shares reserved for the grant of awards under the 2012 Plan is 1,980,074, subject to adjustment as provided by the 2012 Plan. Other specific terms for awards granted under the 2012 Plan shall be determined by our board of directors (or a committee of its members). As of December 31, 2012, 1,454,785 shares were available for future grants under the 2012 Plan.
The following table summarizes the stock-based compensation expense recorded in the last three fiscal years (in thousands):
| | | | | | | | | | |
| | 2012 | | 2011 | | 2010 | |
|---|
Stock-based compensation expense | | $ | 628 | | $ | 36 | | $ | 45 | |
Related tax benefit | | | (220 | ) | | — | | | — | |
| | | | | | | | |
| | $ | 408 | | $ | 36 | | $ | 45 | |
| | | | | | | | |
As of December 31, 2012, we had unrecognized stock-based compensation expense of approximately $2.3 million related to stock-based compensation awards granted. That cost is expected to be recognized over a weighted average period of 3.4 years.
Stock Appreciation Rights
Stock appreciation rights granted under the 2012 Plan generally vest over four years from the date of grant with 25% vesting each year following the date of grant. SARs may not have a term exceeding ten years from the date of grant. The weighted average grant date fair value of SARs granted during the fiscal year ended December 31, 2012 was $6.62.
83
Table of Contents
Below is a summary of SARs activity during the fiscal year ended December 31, 2012:
| | | | | | | | | | | | | |
| | Number of
Shares | | Weighted
Average
Exercise Price | | Weighted
Average
Remaining
Contractual
Term (in years) | | Aggregate
Intrinsic Value
(in thousands) | |
|---|
Outstanding at January 2, 2012 | | | — | | | | | | | | | | |
Granted | | | 529,000 | | $ | 14.00 | | | | | | | |
Forfeited | | | (20,000 | ) | $ | 14.39 | | | | | | | |
| | | | | | | | | | | | | |
Outstanding at December 31, 2012 | | | 509,000 | | $ | 13.98 | | | 9.4 | | $ | — | |
| | | | | | | | | | |
No SARs have been exercised or vested during the fiscal year ended December 31, 2012, and no awards are exercisable at December 31, 2012.
Restricted Stock
Restricted stock, which converts one for one at the end of the vesting period, has been granted to certain employees and independent directors. Restricted stock generally vests after one year from the date of grant.
The following table summarizes restricted stock activity for the fiscal year ended December 31, 2012:
| | | | | | | |
| | Number of
Shares | | Weighted
Average
Grant Date
Fair Value | |
|---|
Nonvested at January 2, 2012 | | | — | | | | |
Granted | | | 23,714 | | $ | 13.92 | |
Vested | | | (10,714 | ) | $ | 14.00 | |
Forfeited | | | (4,000 | ) | $ | 14.00 | |
| | | | | | | |
Nonvested at December 31, 2012 | | | 9,000 | | $ | 13.78 | |
| | | | | | | |
The aggregate fair value of restricted stock that vested during the fiscal year ended December 31, 2012 was $0.15 million. The payment of the employees' income tax liability for the restricted stock that vested during the fiscal year ended December 31, 2012 was satisfied by withholding shares with a fair value equal to the tax liability, which amounted to approximately $48 thousand, or 3,425 shares.
Unit Grants
Prior to the IPO, certain key members of the executive management team and certain members of the Board of Directors were granted common units of equity in JCS Holdings, LLC, Ignite's former parent company, in conjunction with the Third Amended and Restated Limited Liability Company Operating Agreement (the "LLC Agreement") under a Unit Grant Agreement. One-half of each recipient's non-vested common unit award generally step vests for a period of five years, while the other half vests based on time and our performance, except for a certain executive grant that cliff vests after five years, and converts one common unit to one common share upon vesting. Performance conditions include pre-established annual and/or cumulative EBITDA thresholds, as defined in each employee's unit agreement. No further grants will be issued under the Unit Grant Agreement.
84
Table of Contents
The following table summarizes the activity of the common unit grants for the year ended December 31, 2012:
| | | | | | | |
Management Share Units | | Number
of Units | | Weighted
Average
Grant
Date Fair
Value | |
|---|
Unvested at January 2, 2012 | | | 216,745 | | $ | 0.69 | |
Vested | | | (74,730 | ) | $ | 0.16 | |
Forfeited | | | (15,811 | ) | $ | 1.59 | |
| | | | | | | |
Unvested at December 31, 2012 | | | 126,204 | | $ | 0.89 | |
| | | | | | | |
Since the former parent company's membership interest had no active market, we estimated the fair value of each common unit for units granted on the date of grant based on a variety of considerations and assumptions, including but not limited to a third-party valuation, which utilized the market and income approaches with an appropriate discount factor for the common unit's lack of marketability. No units were granted in fiscal years 2012, 2011 or 2010. The aggregate intrinsic value of common units that vested was approximately $1.0 million, $0.5 million and $0.5 million during fiscal years 2012, 2011 and 2010, respectively. The intrinsic value amounts for fiscal year 2011 and 2010 were based on the estimated fair value per unit from the last time units were granted in 2009, while the intrinsic value amount for 2012 is based on the stock price of our common shares at the time of vesting.
Note 11—Related Parties
In the ordinary course of business, we transact with certain related parties. During 2012, 2011 and 2010, we were billed approximately $0.4 million, $1.1 million and $1.1 million in management fees and out-of-pocket expenses by our ultimate parent. These expenses are included in general and administrative expenses in our consolidated statements of operations. After the completion of our IPO, we terminated our management agreement with our ultimate parent and paid a $1.0 million fee in connection with the termination.
Note 12—Supplemental Disclosure of Cash Flow Information
The following table sets forth certain cash and non-cash activities as follows (in thousands):
| | | | | | | | | | |
| | 2012 | | 2011 | | 2010 | |
|---|
Cash paid for interest (net of capitalized interest) | | $ | 6,198 | | $ | 5,491 | | $ | 3,077 | |
Cash paid for income tax | | $ | 3,828 | | $ | 2,877 | | $ | 307 | |
Supplemental noncash investing and financing activities | | | | | | | | | | |
Increase (decrease) in unpaid liabilities for property and equipment | | $ | (495 | ) | $ | (1,140 | ) | $ | 3,898 | |
Decrease in value of interest rate swap | | $ | — | | $ | (493 | ) | $ | (222 | ) |
Note 13—Subsequent Event
On February 6, 2013, we entered into an agreement to acquire all of the issued and outstanding equity interest of Mac Parent LLC, which, with its subsidiaries, operates and franchises the right to operate Romano's Macaroni Grill restaurants, for approximately $55.0 million in an all-cash transaction from private equity firm Golden Gate Capital, management and other investors. The acquisition will be funded through a $50.0 million term loan addition to our existing credit facility. We plan to close the acquisition late in the second quarter of fiscal year 2013.
85
Table of Contents
Note 14—Quarterly Financial Information (Unaudited)
The following table summarizes unaudited quarterly data for 2012 and 2011 (in thousands, except per share data):
| | | | | | | | | | | | | |
| | Fiscal Year 2012 | |
|---|
| | First
Quarter | | Second
Quarter | | Third
Quarter | | Fourth
Quarter | |
|---|
Revenues | | $ | 103,430 | | $ | 119,886 | | $ | 129,137 | | $ | 112,603 | |
Net income (loss)(1) | | $ | 1,885 | | $ | 5,486 | | $ | 8,925 | | $ | (7,582 | ) |
Net income (loss) per share | | | | | | | | | | | | | |
Basic and diluted | | $ | 0.10 | | $ | 0.25 | | $ | 0.35 | | $ | (0.30 | ) |
| | | | | | | | | | | | | |
| | Fiscal Year 2011 | |
|---|
| | First
Quarter | | Second
Quarter | | Third
Quarter | | Fourth
Quarter | |
|---|
Revenues | | $ | 87,431 | | $ | 103,188 | | $ | 113,233 | | $ | 101,391 | |
Net income (loss)(2) | | $ | 544 | | $ | 4,294 | | $ | 8,232 | | $ | (1,007 | ) |
Net income (loss) per share | | | | | | | | | | | | | |
Basic and diluted | | $ | 0.03 | | $ | 0.22 | | $ | 0.43 | | $ | (0.05 | ) |
- (1)
- Full year 2012 net income includes $3.3 million in debt issuance cost write-offs ($1.1 million in the second quarter and $2.2 million in the fourth quarter); $1.9 million of IPO-related costs in the second quarter; and $1.9 million of restatement costs and expenses ($1.1 million in the third quarter and $0.8 million in the fourth quarter).
- (2)
- Full year 2011 net income includes $1.4 million of debt issuance cost write-off in the first quarter, $4.7 million in reversal of deferred tax asset valuation allowance ($0.1 million in the first quarter, $1.0 million in the second quarter, $1.4 million in the third quarter and $2.2 million in the fourth quarter) and $0.4 million in hedge termination cost in the first quarter.
86
Table of Contents
Item 9. CHANGES IN AND DISAGREEMENTS WITH ACCOUNTANTS ON ACCOUNTING AND FINANCIAL DISCLOSURE.
None.
Item 9A. CONTROLS AND PROCEDURES.
Disclosure Controls and Procedures
The Company maintains disclosure controls and procedures defined in Rule 13a-15(e) under the Exchange Act, that are designed to ensure that the information required to be filed or submitted with the SEC under the Exchange Act is recorded, processed, summarized and reported, within the time periods specified in the SEC's rules and forms, and that such information is accumulated and communicated to management of the company with the participation of its principal executive officer and principal financial officer, as appropriate to allow timely decisions regarding required disclosures.
In connection with the preparation of this Annual Report on Form 10-K for the year ended December 31, 2012, an evaluation was performed under the supervision and with the participation of management, including the chief executive officer and chief financial officer, of the effectiveness of the design and operation of the Company's disclosure controls and procedures. In the evaluation, the Company considered the restatement of its previously issued financial statements. Based on that evaluation and the material weaknesses described below, the chief executive officer and chief financial officer have concluded that the Company's disclosure controls and procedures were ineffective as of December 31, 2012.
Material Weaknesses in Internal Control over Financial Reporting
Management previously concluded that there was a material misstatement that occurred and determined it appropriate to restate its previously issued financial statements as of January 3, 2011 and January 2, 2012 and for the years ended December 28, 2009, January 3, 2011 and January 2, 2012 and as of March 26, 2012 and for the twelve week periods ended March 28, 2011 and March 26, 2012. In management's evaluation of the misstatement, the following deficiencies were identified as material weaknesses:
- •
- Lack of sufficient qualified accounting and tax personnel;
- •
- Lack of adequate supervision;
- •
- Lack of effective controls over the accounting for leases; and
- •
- Lack of effective controls over the existence, completeness and accuracy of fixed assets and related depreciation and amortization expense.
Remediation Efforts to Address Material Weaknesses
As of December 31, 2012, the Company had completed a number of remediation steps to address the material weaknesses in internal control described above. Specifically, the following were implemented:
- •
- Efforts to strengthen the accounting and finance department through additional professional staff.
- •
- The Company hired a new Vice President of Accounting who has assumed a supervision and oversight role over substantially all accounting functions, including the accounting for income taxes. The Vice President of Accounting has extensive experience in accounting leadership including many years in public accounting and working for a publicly traded company.
87
Table of Contents
- •
- The Company hired a Director of Internal Audit. The Director of Internal Audit has extensive experience in accounting leadership and establishing control environments in public companies.
- •
- Establishment of an internal audit function.
- •
- The Company hired a Director of Internal Audit to create a new internal audit function and lead the continued development of the Company's Sarbanes-Oxley compliance program. The new Director of Internal Audit reports to the Audit Committee and has been charged with the responsibility of improving the overall effectiveness of the control environment and creating a new internal audit function. In addition, the Director of Internal Audit is responsible for overseeing the Company's ongoing evaluation of internal control over financial reporting, which includes documenting the existing business processes, determining the gaps in the existing system of internal control, recommending improvements to the business processes, including the fixed assets, leasing and other accounting areas impacted by the restatement. The Director of Internal Audit is also responsible for establishing a mechanism to monitor the effectiveness of internal controls on an ongoing basis. Although internal audit's primary responsibility is to continue to develop the company wide control environment, a significant portion of its initial focus is on the elimination of the material weaknesses in both lease accounting and fixed asset controls.
- •
- Lease accounting enhancements.
- •
- The Company reviewed all of its leases to verify it is recording rent expense in accordance with U.S. GAAP. This process included the testing of its leases for compliance with ASC Topic 840 which includes the calculation of deferred rent, capital versus operating treatment, and determination of the effective lease term.
- •
- The Company reviewed its internal procedures and implemented additional measures for the accounting treatment of leases to ensure that future leases and lease modifications are recorded in accordance with U.S. GAAP. Some of these additional measures include the identification and communication of the date that effective control is established over a property, controls over the identification of triggering events to change the effective lease term and increased review and supervision over the lease accounting process, including review by accounting personnel of all new leases, amendments, and renewals.
- •
- Fixed assets improvements.
- •
- The Company reviewed fixed asset additions since the Company's inception, performed an inventory at all of its restaurants and created a detailed rollforward of its fixed assets since the Company's inception to identify disposals and validate depreciation calculations.
- •
- The Company established a comprehensive asset inventory and classification process that established the foundation for it to improve its capabilities to more effectively record asset additions, transfers, retirements and disposals and their related depreciation expense.
- •
- The Company established a fixed asset tagging process to assist with the identification and tracking of certain equipment, including identification of disposal when assets are replaced, and to simplify future fixed asset counts.
- •
- The Company reviewed its internal procedures and implemented additional measures to ensure adequate communication between departments and proper capitalization or expensing of assets.
- •
- The Company hired a dedicated fixed asset accountant.
88
Table of Contents
Since the end of the fiscal year but before the filing of the 10-K the Company has completed a number of additional remediation steps to address the material weaknesses in internal control described above. Specifically, the following have been implemented:
- •
- Efforts to strengthen our accounting and finance department through additional professional staff.
- •
- The Company hired a new Chief Financial Officer, who has extensive experience leading accounting and finance organizations, most of which were publicly traded corporations. He also has a significant amount of restaurant industry experience and experience leading a corporation through a Sarbanes-Oxley implementation.
- •
- The Company hired a new Director of Tax who has extensive experience in accounting for income taxes and establishing controls in public companies.
- •
- The Company hired a Senior Accountant who is responsible for lease accounting and review of fixed asset accounting. The Senior Accountant has significant experience in public accounting which provides for additional review and supervision of the lease and fixed asset processes.
- •
- Establishment of an internal audit function.
- •
- The Director of Internal Audit hired a consulting firm to assist in the implementation of the Company's Sarbanes-Oxley compliance program, and began documenting the existing business processes, determining the gaps in the existing system of internal control, and recommending improvements to the business processes.
- •
- Lease accounting enhancements.
- •
- The Company licensed a new lease management software tool to help the Company ensure that leases are properly recorded, including incorporating changes to U.S. GAAP, and began adding the data for existing leases into the lease management software tool.
Although the Company has designed and implemented certain new internal controls in an effort to remediate the material weaknesses, management continues to conclude that the material weaknesses in internal control were not remediated as of December 31, 2012. Management believes that significant improvements to the processes and controls have been achieved during 2012, but these processes were not sufficiently mature to remediate the material weaknesses at the end of fiscal year 2012.
In an effort to remediate the material weaknesses, the Company plans to continue the implementation of its remediation plan by undertaking the following during fiscal year 2013:
- •
- Efforts to strengthen our accounting and finance department through additional professional staff.
- •
- The Company will continue to evaluate the accounting and finance personnel and hire additional or replace existing personnel as deemed necessary.
- •
- Establishment of an internal audit function.
- •
- The Company is actively searching for a Senior Internal Auditor to assist the Director of Internal Audit with ensuring the Company has a robust control environment and internal controls over financial reporting.
- •
- Lease accounting enhancements.
- •
- The Company plans to have all data entered and employees trained to begin using the new lease management software by the end of the first quarter.
89
Table of Contents
- •
- Fixed assets improvements.
- •
- The Company will implement a standardized process for conducting annual fixed asset counts.
- •
- The Company plans to implement a facilities management software tool which will help the Company track all store detail including equipment, leases, documents, schedules, budgets and links to all related contracts, construction and capital projects.
Until fully remediated, these control deficiencies could result in a material misstatement to our future interim or annual financial statements that would not be prevented or detected.
Notwithstanding the above material weaknesses, management has concluded that our financial statements were prepared in accordance with U.S. GAAP. Accordingly, the audited financial statements for the year ended December 31, 2012 fairly present in all material respects our financial condition, results of operations and cash flows for the periods presented in accordance with U.S. GAAP.
Because of their inherent limitations, disclosure controls and procedures and internal control over financial reporting may not prevent or detect all misstatements. Also, projections of any evaluation of effectiveness of internal controls to future periods are subject to the risk that controls may become inadequate because of changes in conditions, or that the degree of compliance with the policies or procedures may deteriorate. Furthermore, the Company has not completed the formal evaluation of its internal controls over financial reporting pursuant to Section 404 of the Sarbanes-Oxley Act of 2002. The Company's first Section 404 report will be prepared in connection with the Company's Annual Report on Form 10-K for the fiscal year ending December 30, 2013. We cannot assure you that we will not uncover additional material weaknesses as of December 30, 2013 following this review. Also, until fully remediated, the control deficiencies outlined above could result in a material misstatement to our future annual or interim financial statements that would not be prevented or detected. In addition, our independent registered public accounting firm will not be required to formally attest to the effectiveness of our internal control over financial reporting pursuant to Section 404 until the later of the fiscal year ending December 30, 2013, or the date we are no longer an "emerging growth company" as defined in the JOBS Act, if we continue to take advantage of the exemptions contained in the JOBS Act. We expect that we will remain an "emerging growth company" until the earliest of (i) the last day of our fiscal year following the fifth anniversary of our IPO; (ii) the last day of our fiscal year in which we have annual gross revenue of $1.0 billion or more; (iii) the date on which we have, during the previous three-year period, issued more than $1.0 billion in non-convertible debt; and (iv) the date on which we are deemed to be a "large accelerated filer," which will occur at such time as we have (1) an aggregate worldwide market value of common equity securities held by non-affiliates of $700 million or more as of the last business day of our most recently completed second fiscal quarter, (2) been required to file annual, quarterly and current reports under the Exchange Act for a period of at least 12 calendar months, and (3) filed at least one annual report pursuant to the Exchange Act. As a result, we may qualify as an "emerging growth company" until as late as May 10, 2017. At such time, our independent registered public accounting firm may issue a report that is adverse in the event it is not satisfied with the level at which our controls are documented, designed or operating.
Changes in Internal Control over Financial Reporting
Other than as described above, no changes in our internal control over financial reporting occurred during the fiscal quarter to which this report relates that have materially affected, or are reasonably likely to materially affect, our internal control over financial reporting.
Item 9B. OTHER INFORMATION.
None.
90
Table of Contents
PART III
Item 10. DIRECTORS, EXECUTIVE OFFICERS AND CORPORATE GOVERNANCE.
The information required by this item will appear in and is incorporated herein by reference from our Proxy Statement for the Annual Meeting of Shareholders to be held on June 4, 2013.
We have adopted a code of business conduct and ethics applicable to our principal executive, financial and accounting officers and all persons performing similar functions. A copy of that code is available on our corporate website at www.igniterestaurants.com, which does not form a part of this Annual Report on Form 10-K. Any waivers to the code, or any waivers of its requirements, will be posted on our website.
Item 11. EXECUTIVE COMPENSATION.
The information required by this item will appear in and is incorporated herein by reference from our Proxy Statement for the Annual Meeting of Shareholders.
Item 12. SECURITY OWNERSHIP OF CERTAIN BENEFICIAL OWNERS AND MANAGEMENT AND RELATED STOCKHOLDER MATTERS.
The information required by this item will appear in and is incorporated herein by reference from our Proxy Statement for the Annual Meeting of Shareholders.
Item 13. CERTAIN RELATIONSHIPS AND RELATED TRANSACTIONS, AND DIRECTOR INDEPENDENCE.
The information required by this item will appear in and is incorporated herein by reference from our Proxy Statement for the Annual Meeting of Shareholders.
Item 14. PRINCIPAL ACCOUNTING FEES AND SERVICES.
The information required by this item will appear in and is incorporated herein by reference from our Proxy Statement for the Annual Meeting of Shareholders.
91
Table of Contents
Item 15. EXHIBITS, FINANCIAL STATEMENT SCHEDULES.
| | | | | |
| Exhibit No. | | Description | |
|
|---|
| | 2.1 | | Purchase Agreement, dated as of February 6, 2013, by and among Ignite Restaurant Group, Inc., Mac Parent LLC, Restaurant Holdings LLC—Series A, Brinker Services Corporation and Mac Management Investors LLC | | Filed as Exhibit 2.1 of registrant's Current Report on Form 8-K as filed with the Commission on February 7, 2013 and incorporated herein by reference. |
| | | | | | |
| | 3.1 | | Amended and Restated Certificate of Incorporation of Ignite Restaurant Group, Inc. | | Filed as Exhibit 3.1 of registrant's Quarterly Report on Form 10-Q for the quarter ended June 18, 2012 as filed with the Commission on October 30, 2012 and incorporated herein by reference. |
| | | | | | |
| | 3.2 | | Amended and Restated Bylaws of Ignite Restaurant Group, Inc. | | Filed as Exhibit 3.2 of registrant's Quarterly Report on Form 10-Q for the quarter ended June 18, 2012 as filed with the Commission on October 30, 2012 and incorporated herein by reference. |
| | | | | | |
| | 4.1 | | Specimen Common Stock Certificate. | | Filed as Exhibit 4.1 of registrant's Amendment No. 4 to Form S-1 (No. 333-175878) as filed with the Commission on April 24, 2012 and incorporated herein by reference. |
| | | | | | |
| | 10.1 | | Credit Agreement, dated as of March 24, 2011, by and between Ignite Restaurant Group, Inc., as borrower, the guarantors named therein, General Electric Capital Corporation and the lenders named therein. | | Filed as Exhibit 10.1 of registrant's Amendment No. 4 to Form S-1 (No. 333-175878) as filed with the Commission on April 24, 2012 and incorporated herein by reference. |
| | | | | | |
| | 10.2 | | Amendment No. 1, dated as of May 31, 2011, to the Credit Agreement, dated as of March 24, 2011, by and between Ignite Restaurant Group, Inc., as borrower, the guarantors named therein, General Electric Capital Corporation and the lenders named therein. | | Filed as Exhibit 10.2 of registrant's Amendment No. 5 to Form S-1 (No. 333-175878) as filed with the Commission on April 27, 2012 and incorporated herein by reference. |
| | | | | | |
| | 10.3 | | Amendment No. 2, dated as of July 22, 2011, to the Credit Agreement, dated as of March 24, 2011, by and between Ignite Restaurant Group, Inc., as borrower, the guarantors named therein, General Electric Capital Corporation and the lenders named therein. | | Filed as Exhibit 10.3 of registrant's Amendment No. 5 to Form S-1 (No. 333-175878) as filed with the Commission on April 27, 2012 and incorporated herein by reference. |
| | | | | | |
92
Table of Contents
| | | | | |
| Exhibit No. | | Description | |
|
|---|
| | 10.4 | | Amendment No. 3, dated as of November 18, 2011, to the Credit Agreement, dated as of March 24, 2011, by and between Ignite Restaurant Group, Inc., as borrower, the guarantors named therein, General Electric Capital Corporation and the lenders named therein. | | Filed as Exhibit 10.4 of registrant's Amendment No. 5 to Form S-1 (No. 333-175878) as filed with the Commission on April 27, 2012 and incorporated herein by reference. |
| | | | | | |
| | 10.5 | | Amendment No. 4, dated as of April 23, 2012, to the Credit Agreement, dated as of March 24, 2011, by and between Ignite Restaurant Group, Inc., as borrower, the guarantors named therein, General Electric Capital Corporation and the lenders named therein. | | Filed as Exhibit 10.5 of registrant's Amendment No. 5 to Form S-1 (No. 333-175878) as filed with the Commission on April 27, 2012 and incorporated herein by reference. |
| | | | | | |
| | 10.6 | * | Form of Ignite Restaurant Group, Inc. 2012 Omnibus Incentive Plan. | | Filed as Exhibit 10.2 of registrant's Amendment No. 4 to Form S-1 (No. 333-175878) as filed with the Commission on April 24, 2012 and incorporated herein by reference. |
| | | | | | |
| | 10.7 | * | Offer Term Sheet, effective as of May 21, 2007, between Joe's Crab Shack Holdings, Inc. and Raymond A. Blanchette, III. | | Filed as Exhibit 10.3 of registrant's Amendment No. 4 to Form S-1 (No. 333-175878) as filed with the Commission on April 24, 2012 and incorporated herein by reference. |
| | | | | | |
| | 10.8 | * | Form of JCS Holdings, LLC Unit Grant Agreement. | | Filed as Exhibit 10.4 of registrant's Amendment No. 4 to Form S-1 (No. 333-175878) as filed with the Commission on April 24, 2012 and incorporated herein by reference. |
| | | | | | |
| | 10.9 | | Third Amended and Restated Limited Liability Company Operating Agreement of JCS Holdings, LLC. | | Filed as Exhibit 10.5 of registrant's Amendment No. 4 to Form S-1 (No. 333-175878) as filed with the Commission on April 24, 2012 and incorporated herein by reference. |
| | | | | | |
| | 10.10 | | First Amendment to the Third Amended and Restated Limited Liability Company Operating Agreement of JCS Holdings, LLC. | | Filed as Exhibit 10.10 of registrant's Amendment No. 7 to Form S-1 (No. 333-175878) as filed with the Commission on May 8, 2012 and incorporated herein by reference. |
| | | | | | |
| | 10.11 | | Management Agreement, by and between J.H. Whitney Capital Partners, LLC, JCS Holdings, LLC, Ignite Restaurant Group, Inc. and certain of its subsidiaries party thereto. | | Filed as Exhibit 10.6 of registrant's Amendment No. 4 to Form S-1 (No. 333-175878) as filed with the Commission on April 24, 2012 and incorporated herein by reference. |
| | | | | | |
93
Table of Contents
| | | | | |
| Exhibit No. | | Description | |
|
|---|
| | 10.12 | * | Form of Directors and Officers Indemnification Agreement. | | Filed as Exhibit 10.12 of registrant's Amendment No. 7 to Form S-1 (No. 333-175878) as filed with the Commission on May 8, 2012 and incorporated herein by reference. |
| | | | | | |
| | 10.13 | | Registration Rights Agreement, dated as of May 16, 2012, by and among Ignite Restaurant Group, Inc. and J.H. Whitney VI, L.P. and the stockholders set forth in Schedule I attached thereto. | | Filed as Exhibit 10.1 of registrant's Quarterly Report on Form 10-Q for the quarter ended June 18, 2012 as filed with the Commission on October 30, 2012 and incorporated herein by reference. |
| | | | | | |
| | 10.14 | | Credit Agreement, dated as of October 29, 2012, by and among Ignite Restaurant Group, Inc., the financial institutions party thereto, as lenders, KeyBank National Association, as joint lead arranger, joint book runner and administrative agent, Merrill Lynch, Pierce, Fenner & Smith Incorporated, as joint lead arranger and joint book runner and Bank of America, N.A., as syndication agent. | | Filed herewith. |
| | | | | | |
| | 10.15 | * | Offer Letter, effective as of November 26, 2012, between Ignite Restaurant Group, Inc. and Michael J. Dixon. | | Filed herewith. |
| | | | | | |
| | 10.16 | * | Separation and Release Agreement, dated as of December 10, 2012, between Ignite Restaurant Group, and Jeffrey L. Rager. | | Filed herewith. |
| | | | | | |
| | 21.1 | | List of Subsidiaries of Ignite Restaurant Group, Inc. | | Filed herewith. |
| | | | | | |
| | 23.1 | | Consent of PricewaterhouseCoopers LLP. | | Filed herewith. |
| | | | | | |
| | 31.1 | | Certification of the Chief Executive Officer Pursuant to Rule 13a-14(a) or 15d-14(a) of the Securities Exchange Act of 1934, as amended, as Adopted Pursuant to Section 302 of the Sarbanes-Oxley Act of 2002. | | Filed herewith. |
| | | | | | |
| | 31.2 | | Certification of the Chief Financial Officer Pursuant to Rule 13a-14(a) or 15d-14(a) of the Securities Exchange Act of 1934, as amended, as Adopted Pursuant to Section 302 of the Sarbanes-Oxley Act of 2002. | | Filed herewith. |
| | | | | | |
| | 32.1 | | Certificate of the Chief Executive Officer Pursuant to 18 U.S.C. Section 1350, as Adopted Pursuant to Section 906 of the Sarbanes-Oxley Act of 2002. | | Filed herewith. |
| | | | | | |
94
Table of Contents
| | | | | |
| Exhibit No. | | Description | |
|
|---|
| | 32.2 | | Certificate of the Chief Financial Officer Pursuant to 18 U.S.C. Section 1350, as Adopted Pursuant to Section 906 of the Sarbanes-Oxley Act of 2002. | | Filed herewith. |
| | | | | | |
| | 101 | | The following financial information for the Company, formatted in XBRL (Extensible Business Reporting Language): (i) the Consolidated Balance Sheets, (ii) the Consolidated Statements of Operations, (iii) the Consolidated Statements of Comprehensive Income, (iv) the Consolidated Statements of Changes in Stockholders' Equity, (v) the Consolidated Statements of Cash Flows, and (vi) the Notes to the Consolidated Financial Statements. | | |
- *
- Indicates a management contract or compensatory plan or arrangement.
95
Table of Contents
SIGNATURES
Pursuant to the requirements of Section 13 or 15(d) of the Securities Exchange Act of 1934, the registrant has duly caused this report to be signed on its behalf by the undersigned thereunto duly authorized.
| | | | | | |
| | | IGNITE RESTAURANT GROUP, INC. |
March 20, 2013 |
|
By: |
|
/s/ RAYMOND A. BLANCHETTE, III
|
| | | | | Name: | | Raymond A. Blanchette, III |
| | | | | Title: | | Chief Executive Officer
(Principal Executive Officer) |
March 20, 2013 |
|
By: |
|
/s/ MICHAEL J. DIXON
|
| | | | | Name: | | Michael J. Dixon |
| | | | | Title: | | President and Chief Financial Officer
(Principal Financial Officer) |
Pursuant to the requirements of the Securities Exchange Act of 1934, this report has been signed by the following persons on behalf of the registrant and in the capacities indicated on March 20, 2013.
| | |
/s/ PAUL R. VIGANO
Paul R. Vigano | | Chairman of the Board |
/s/ RAYMOND A. BLANCHETTE, III
Raymond A. Blanchette, III |
|
Chief Executive Officer and Director |
/s/ BRAD A. LEIST
Brad A. Leist |
|
Principal Accounting Officer |
/s/ BRIAN N. CHERRY
Brian N. Cherry |
|
Director |
/s/ JOHN F. GILBERT III
John F. Gilbert III |
|
Director |
/s/ ANN IVERSON
Ann Iverson |
|
Director |
/s/ ZANE LESHNER
Zane Leshner |
|
Director |
96