Exhibit 99.1
$10 M ILLION S UBORDINATED N OTES O FFERING D ECEMBER 2015 T ICKER : WEBK WWW . WELLESLEYBANK . COM
This presentation contains certain “forward - looking statements” within the meaning of the U . S . Private Securities Litigation Reform Act of 1995 about the Company and the Bank . Forward - looking statements include statements regarding anticipated future events and can be identified by the fact that they do not relate strictly to historical or current facts . They often include words such as “believe,” “expect,” “anticipate,” “estimate,” and “intend” or future or conditional verbs such as “will ,” “ would,” “should,” “could,” or “may . ” Forward - looking statements, by their nature, are subject to significant assumptions, risks and uncertainties . Certain factors that could cause actual results to differ materially from expected results include increased competitive pressures, changes in the interest rate environment, general economic conditions or conditions within the securities markets, and legislative and regulatory changes that could adversely affect the business in which the Company and the Bank are engaged . More detailed information regarding these factors is included in our filings with the U . S . Securities and Exchange Commission, including in the “Risk Factors” section of our Annual Report on Form 10 - K for the year ended December 31 , 2014 . In addition, it should be noted that our forward - looking statements speak only as of the date of this presentation . We do not undertake to update our forward - looking statements to reflect the impact of events or circumstances that may arise after the date on which such statements are made . Forward Looking Statements and Associated Risk Factors
Page 3 T ERMS OF P ROPOSED O FFERING ▪ Issuer : Wellesley Bancorp , Inc . (“Wellesley”, or the “Company ”) ▪ Security : Subordinated Notes due 2025 (at Company level) ▪ Structure : Regulation D Private Placement ▪ Term : 10 Year NC 5 Year Fixed/Floating Rate ▪ Principal Amount : $ 10 million ▪ Denominations : $ 1 , 000 and integral multiples thereof ▪ Optional Redemption : At the Company’s option, ( i ) in whole or in part, beginning in Year 5 , or (ii) in whole or in part, upon occurrence of Tier 2 Capital Event, Tax Event or Investment Company Event, in each case at 100 % of par ▪ Covenants : Consistent with regulatory requirements for Tier 2 capital treatment ▪ Use of Proceeds : Company shall use the net proceeds from the sale of Subordinated Notes for general corporate purposes, including for the provision of additional liquidity and working capital ▪ Placement Agent : Sandler O’Neill + Partners, L . P .
Page 4 C OMPANY O VERVIEW
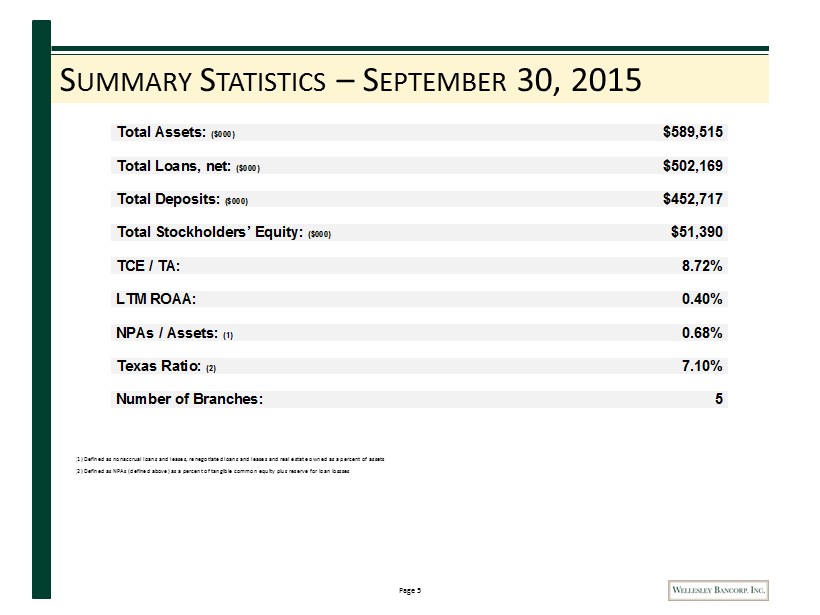
Page 5 S UMMARY S TATISTICS – S EPTEMBER 30, 2015 Total Assets: ($000) $589,515 Total Loans, net: ($000) $502,169 Total Deposits: ($000) $452,717 Total Stockholders’ Equity: ($000) $51,390 TCE / TA: 8.72% LTM ROAA: 0.40% NPAs / Assets: (1) 0.68% Texas Ratio: (2) 7.10% Number of Branches: 5 (1) Defined as nonaccrual loans and leases, renegotiated loans and leases and real estate owned as a percent of assets (2) Defined as NPAs (defined above) as a percent of tangible common equity plus reserve for loan lossses
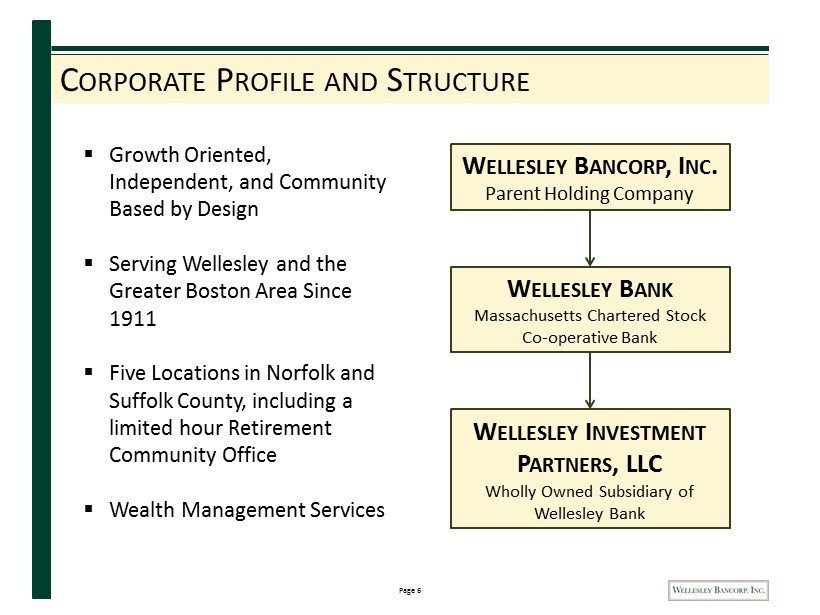
Page 6 C ORPORATE P ROFILE AND S TRUCTURE ▪ Growth Oriented, Independent, and Community Based by Design ▪ Serving Wellesley and t he Greater Boston Area Since 1911 ▪ Five Locations in Norfolk and Suffolk County, including a limited hour Retirement Community Office ▪ Wealth Management Services W ELLESLEY B ANCORP , I NC . Parent Holding Company W ELLESLEY B ANK Massachusetts Chartered Stock Co - operative Bank W ELLESLEY I NVESTMENT P ARTNERS , LLC Wholly Owned Subsidiary of Wellesley Bank
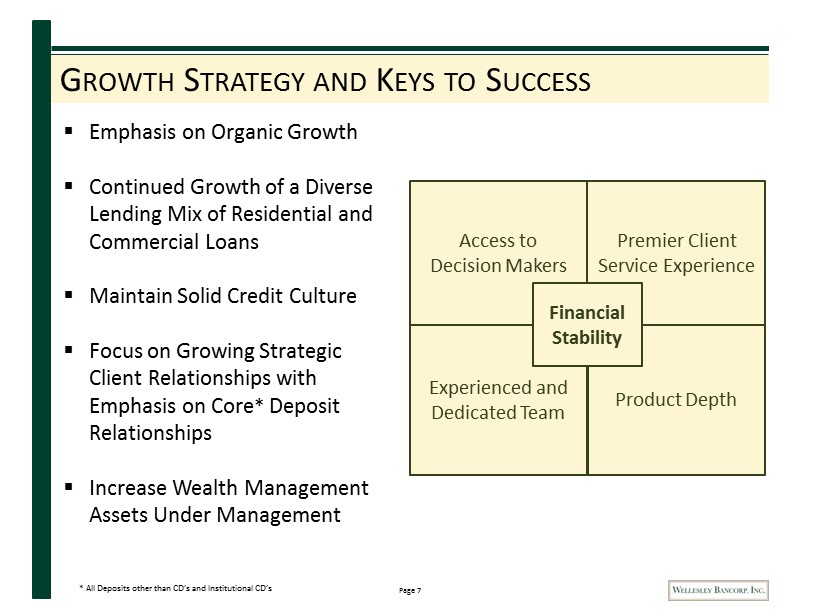
Page 7 G ROWTH S TRATEGY AND K EYS TO S UCCESS ▪ Emphasis on Organic Growth ▪ Continued Growth of a Diverse Lending Mix of Residential and Commercial Loans ▪ Maintain Solid Credit Culture ▪ Focus on Growing Strategic Client Relationships with Emphasis on Core * Deposit Relationships ▪ Increase Wealth Management Assets Under Management Premier Client Service Experience Financial Stability Access to Decision Makers Premier Client Service Experience Experienced and Dedicated Team Product Depth Financial Stability * All Deposits other than CD’s and Institutional CD’s

Page 8 E XPERIENCED AND D EDICATED M ANAGEMENT T EAM Name Title/Function Years in Industry Years with Wellesley Bank Thomas J. Fontaine President and Chief Executive Officer 29 16 Gary P. Culyer SVP and Chief Financial Officer 32 4 Ralph L. Letner SVP and Chief Lending Officer 29 1 Eloise C. Thibault SVP and Treasurer 27 25 Henry M. Connors SVP and Director of Deposit Operations 30 14 Alice E. Lee SVP of Retail Banking 18 10 Maureen E. Sullivan SVP of Marketing and Human Resources 2 2 John W. Wescott SVP of Information Technology 35 7 Ann Marie DeCoff VP of Loan Operations 33 10 Angela H. Yee VP and Compliance Officer 13 5 Louis P. Crosier President of Wellesley Investment Partners, LLC 15 1
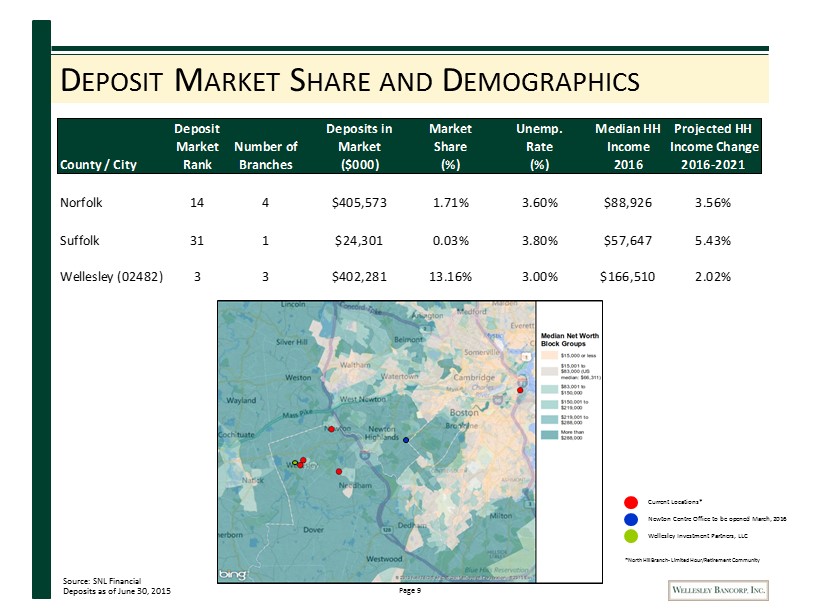
Page 9 D EPOSIT M ARKET S HARE AND D EMOGRAPHICS Source: SNL Financial Deposits as of June 30, 2015 Newton Centre Office to be opened March, 2016 *North Hill Branch - Limited Hour/Retirement Community Current Locations* Wellesley Investment Partners, LLC Deposit Deposits in Market Unemp. Median HH Projected HH Market Number of Market Share Rate Income Income Change County / City Rank Branches ($000) (%) (%) 2016 2016-2021 Norfolk 14 4 $405,573 1.71% 3.60% $88,926 3.56% Suffolk 31 1 $24,301 0.03% 3.80% $57,647 5.43% Wellesley (02482) 3 3 $402,281 13.16% 3.00% $166,510 2.02%
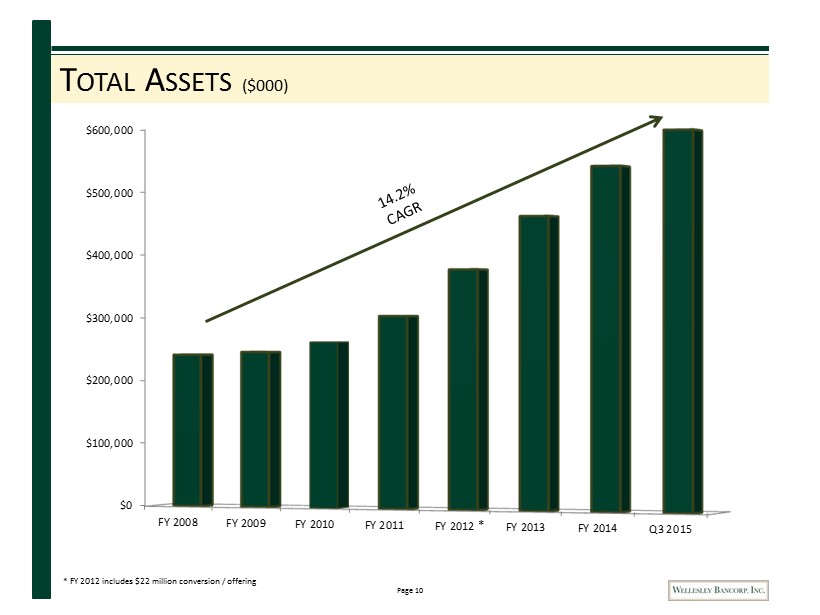
Page 10 $0 $100,000 $200,000 $300,000 $400,000 $500,000 $600,000 FY 2008 FY 2009 FY 2010 FY 2011 FY 2012 FY 2013 FY 2014 Q3 2015 T OTAL A SSETS ($000) * * FY 2012 includes $22 million conversion / offering
Page 11 E ARNING A SSETS AND A SSET Q UALITY

Page 12 G ROSS L OANS ($000) 52% 21% 16% 6% 4% Percent of Portfolio $0 $100,000 $200,000 $300,000 $400,000 $500,000 $600,000 FY 2008 FY 2009 FY 2010 FY 2011 FY 2012 FY 2013 FY 2014 Q3 2015 1-4 Family CRE & Multifamily Const. & Development Consumer Commercial & Industrial
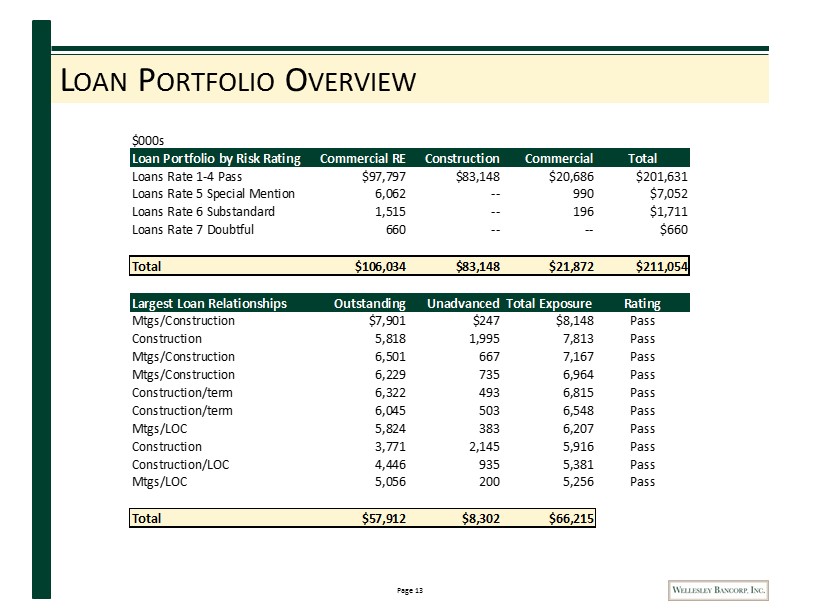
Page 13 L OAN P ORTFOLIO O VERVIEW $000s Loan Portfolio by Risk Rating Commercial RE Construction Commercial Total Loans Rate 1-4 Pass $97,797 $83,148 $20,686 $201,631 Loans Rate 5 Special Mention 6,062 -- 990 $7,052 Loans Rate 6 Substandard 1,515 -- 196 $1,711 Loans Rate 7 Doubtful 660 -- -- $660 Total $106,034 $83,148 $21,872 $211,054 Largest Loan Relationships Outstanding Unadvanced Total Exposure Rating Mtgs/Construction $7,901 $247 $8,148 Pass Construction 5,818 1,995 7,813 Pass Mtgs/Construction 6,501 667 7,167 Pass Mtgs/Construction 6,229 735 6,964 Pass Construction/term 6,322 493 6,815 Pass Construction/term 6,045 503 6,548 Pass Mtgs/LOC 5,824 383 6,207 Pass Construction 3,771 2,145 5,916 Pass Construction/LOC 4,446 935 5,381 Pass Mtgs/LOC 5,056 200 5,256 Pass Total $57,912 $8,302 $66,215
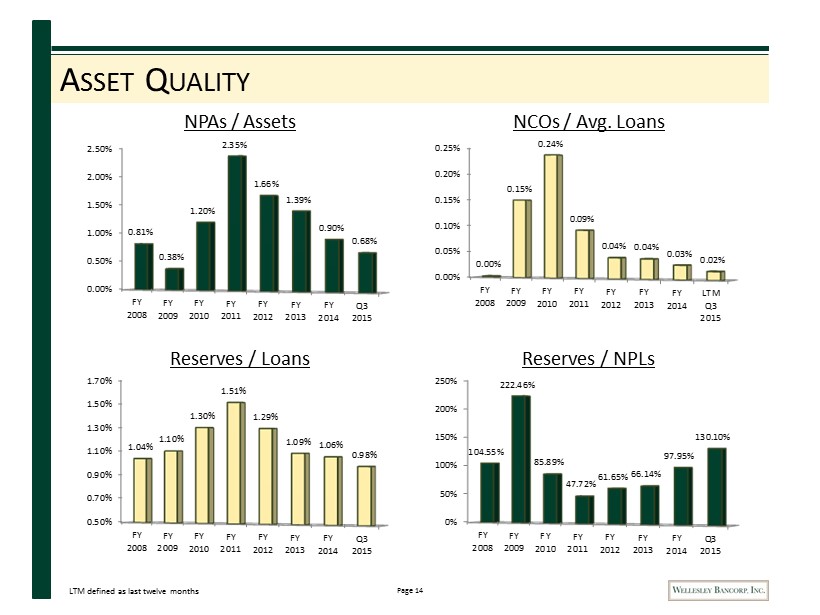
Page 14 A SSET Q UALITY 0.00% 0.50% 1.00% 1.50% 2.00% 2.50% FY 2008 FY 2009 FY 2010 FY 2011 FY 2012 FY 2013 FY 2014 Q3 2015 0.81% 0.38% 1.20% 2.35% 1.66% 1.39% 0.90% 0.68% 0.00% 0.05% 0.10% 0.15% 0.20% 0.25% FY 2008 FY 2009 FY 2010 FY 2011 FY 2012 FY 2013 FY 2014 LTM Q3 2015 0.00% 0.15% 0.24% 0.09% 0.04% 0.04% 0.03% 0.02% 0.50% 0.70% 0.90% 1.10% 1.30% 1.50% 1.70% FY 2008 FY 2009 FY 2010 FY 2011 FY 2012 FY 2013 FY 2014 Q3 2015 1.04% 1.10% 1.30% 1.51% 1.29% 1.09% 1.06% 0.98% 0% 50% 100% 150% 200% 250% FY 2008 FY 2009 FY 2010 FY 2011 FY 2012 FY 2013 FY 2014 Q3 2015 104.55% 222.46% 85.89% 47.72% 61.65% 66.14% 97.95% 130.10% NPAs / Assets NCOs / Avg. Loans Reserves / Loans Reserves / NPLs LTM defined as last twelve months
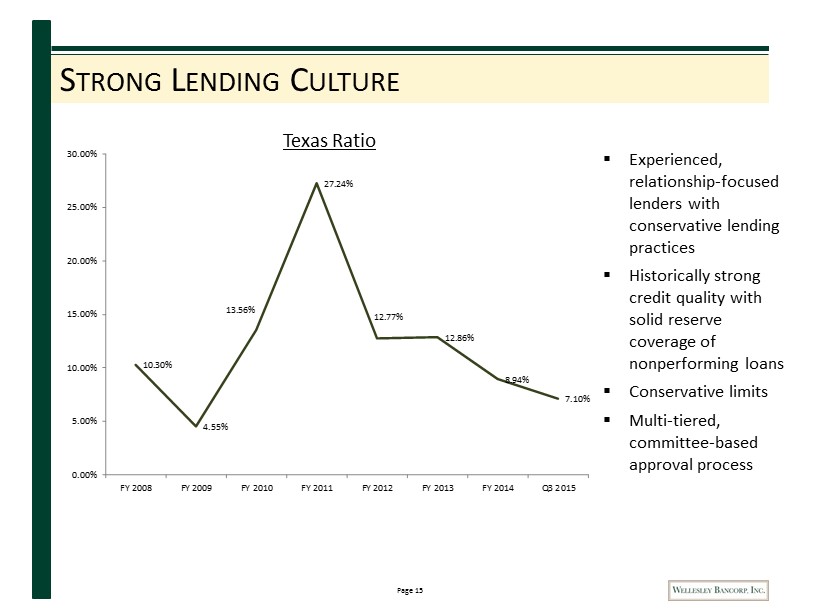
Page 15 S TRONG L ENDING C ULTURE 10.30% 4.55% 13.56% 27.24% 12.77% 12.86% 8.94% 7.10% 0.00% 5.00% 10.00% 15.00% 20.00% 25.00% 30.00% FY 2008 FY 2009 FY 2010 FY 2011 FY 2012 FY 2013 FY 2014 Q3 2015 ▪ Experienced, relationship - focused lenders with conservative lending practices ▪ Historically strong credit quality with solid reserve coverage of nonperforming loans ▪ Conservative limits ▪ Multi - tiered, committee - based approval process Texas Ratio
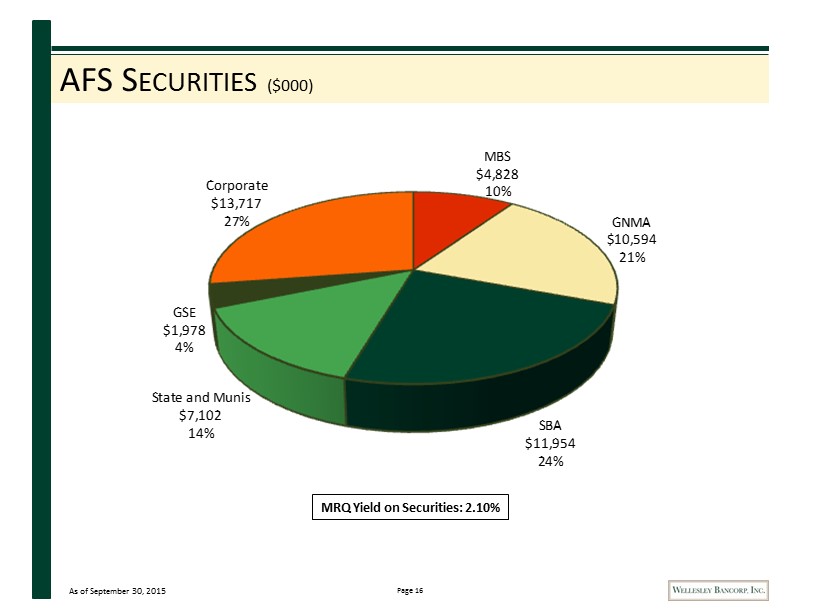
Page 16 AFS S ECURITIES ($000) MBS $4,828 10% GNMA $10,594 21% SBA $11,954 24% State and Munis $7,102 14% GSE $1,978 4% Corporate $13,717 27% MRQ Yield on Securities: 2.10% As of September 30, 2015

Page 17 F UNDING
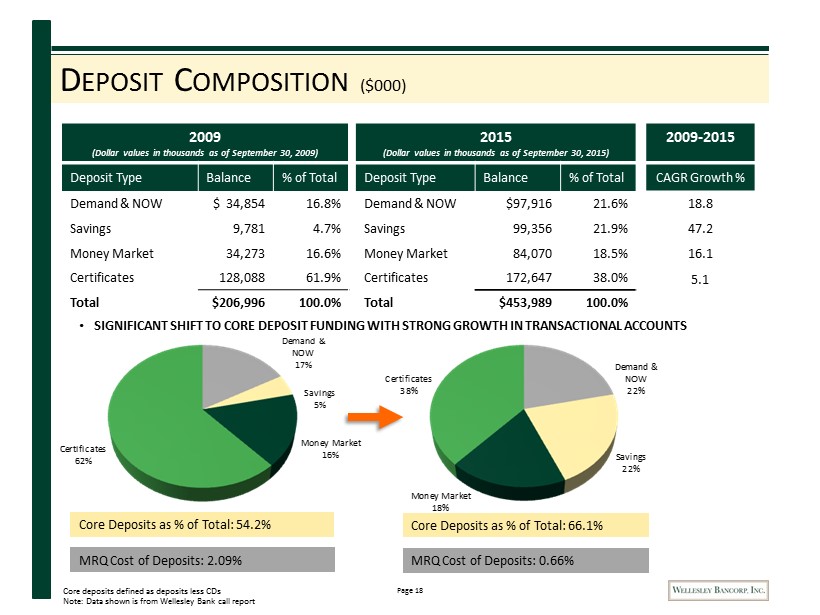
Page 18 Demand & NOW 17% Savings 5% Money Market 16% Certificates 62% Demand & NOW 22% Savings 22% Money Market 18% Certificates 38% Core Deposits as % of Total: 54.2% D EPOSIT C OMPOSITION ($000 ) 2009 (Dollar values in thousands as of September 30, 2009) Deposit Type Balance % of Total Demand & NOW $ 34,854 16.8% Savings 9,781 4.7% Money Market 34,273 16.6% Certificates 128,088 61.9% Total $206,996 100.0% 2015 (Dollar values in thousands as of September 30, 2015) Deposit Type Balance % of Total Demand & NOW $97,916 21.6% Savings 99,356 21.9% Money Market 84,070 18.5% Certificates 172,647 38.0% Total $453,989 100.0% 2009 - 2015 CAGR Growth % 18.8 47.2 16.1 5.1 Core Deposits as % of Total: 66.1% MRQ Cost of Deposits: 2.09% MRQ Cost of Deposits: 0.66% • SIGNIFICANT SHIFT TO CORE DEPOSIT FUNDING WITH STRONG GROWTH IN TRANSACTIONAL ACCOUNTS Core deposits defined as deposits less CDs Note: Data shown is from Wellesley Bank call report
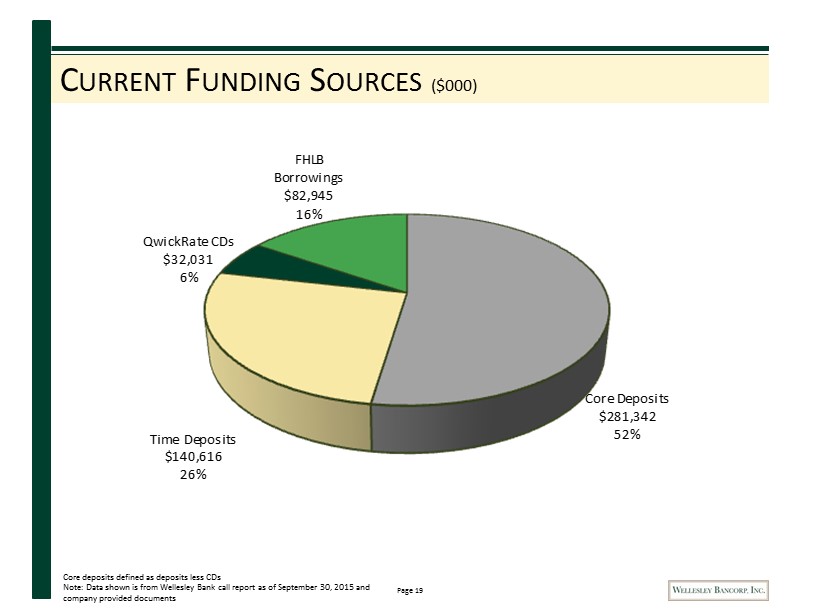
Page 19 C URRENT F UNDING S OURCES ($000 ) Core Deposits $281,342 52% Time Deposits $140,616 26% QwickRate CDs $32,031 6% FHLB Borrowings $82,945 16% Core deposits defined as deposits less CDs Note: Data shown is from Wellesley Bank call report as of September 30, 2015 and company provided documents
Page 20 C APITAL
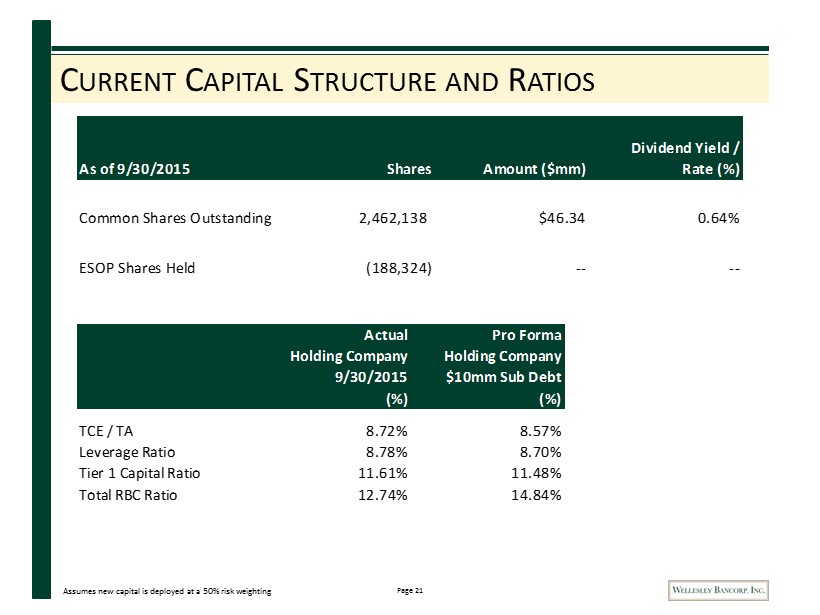
Page 21 C URRENT C APITAL S TRUCTURE AND R ATIOS As of 9/30/2015 Shares Amount ($mm) Dividend Yield / Rate (%) Common Shares Outstanding 2,462,138 $46.34 0.64% ESOP Shares Held (188,324) -- -- Actual Holding Company 9/30/2015 (%) Pro Forma Holding Company $10mm Sub Debt (%) TCE / TA 8.72% 8.57% Leverage Ratio 8.78% 8.70% Tier 1 Capital Ratio 11.61% 11.48% Total RBC Ratio 12.74% 14.84% Assumes new capital is deployed at a 50% risk weighting
Page 22 P ROFITABILITY
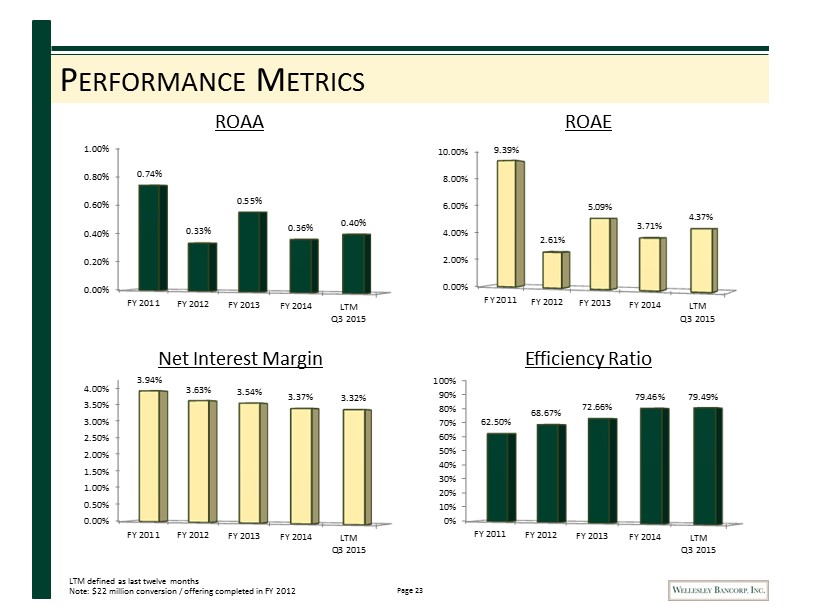
Page 23 P ERFORMANCE M ETRICS ROAA ROAE Net Interest Margin Efficiency Ratio 0.00% 0.20% 0.40% 0.60% 0.80% 1.00% FY 2011 FY 2012 FY 2013 FY 2014 LTM Q3 2015 0.74% 0.33% 0.55% 0.36% 0.40% 0% 10% 20% 30% 40% 50% 60% 70% 80% 90% 100% FY 2011 FY 2012 FY 2013 FY 2014 LTM Q3 2015 62.50% 68.67% 72.66% 79.46% 79.49% 0.00% 0.50% 1.00% 1.50% 2.00% 2.50% 3.00% 3.50% 4.00% FY 2011 FY 2012 FY 2013 FY 2014 LTM Q3 2015 3.94% 3.63% 3.54% 3.37% 3.32% 0.00% 2.00% 4.00% 6.00% 8.00% 10.00% FY 2011 FY 2012 FY 2013 FY 2014 LTM Q3 2015 9.39% 2.61% 5.09% 3.71% 4.37% LTM defined as last twelve months Note: $22 million conversion / offering completed in FY 2012
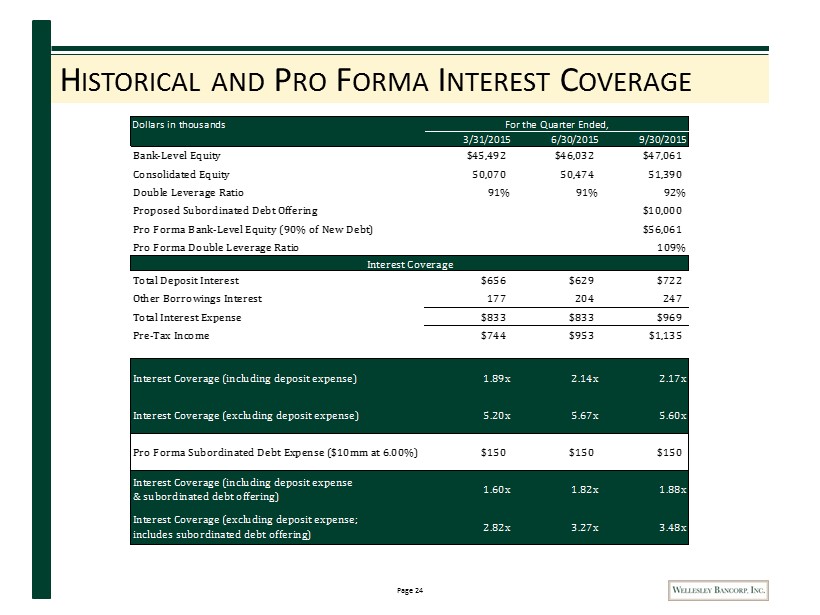
Page 24 H ISTORICAL AND P RO F ORMA I NTEREST C OVERAGE Dollars in thousands For the Quarter Ended, 3/31/2015 6/30/2015 9/30/2015 Bank-Level Equity $45,492 $46,032 $47,061 Consolidated Equity 50,070 50,474 51,390 Double Leverage Ratio 91% 91% 92% Proposed Subordinated Debt Offering $10,000 Pro Forma Bank-Level Equity (90% of New Debt) $56,061 Pro Forma Double Leverage Ratio 109% Interest Coverage Total Deposit Interest $656 $629 $722 Other Borrowings Interest 177 204 247 Total Interest Expense $833 $833 $969 Pre-Tax Income $744 $953 $1,135 Interest Coverage (including deposit expense) 1.89x 2.14x 2.17x Interest Coverage (excluding deposit expense) 5.20x 5.67x 5.60x Pro Forma Subordinated Debt Expense ($10mm at 6.00%) $150 $150 $150 Interest Coverage (including deposit expense & subordinated debt offering) 1.60x 1.82x 1.88x Interest Coverage (excluding deposit expense; includes subordinated debt offering) 2.82x 3.27x 3.48x
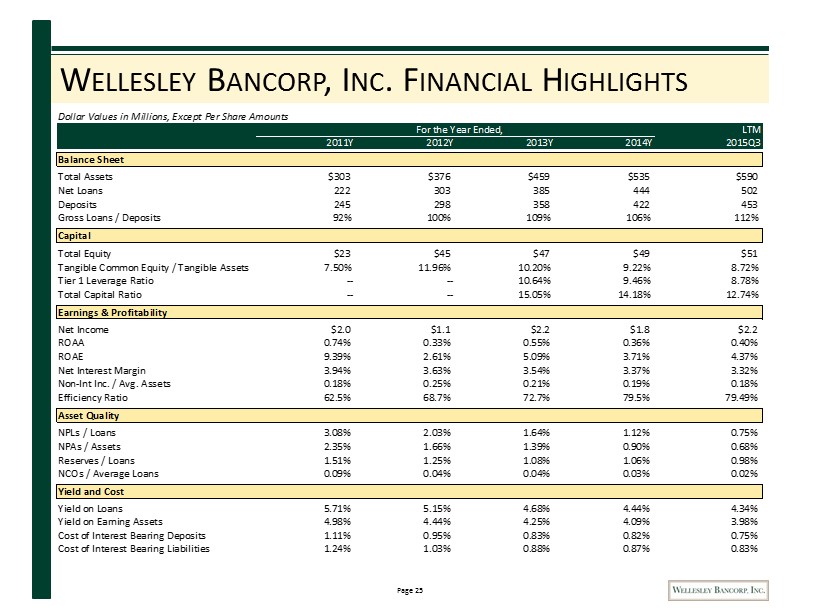
Page 25 W ELLESLEY B ANCORP , I NC . F INANCIAL H IGHLIGHTS Dollar Values in Millions, Except Per Share Amounts For the Year Ended, LTM 2011Y 2012Y 2013Y 2014Y 2015Q3 Balance Sheet Total Assets $303 $376 $459 $535 $590 Net Loans 222 303 385 444 502 Deposits 245 298 358 422 453 Gross Loans / Deposits 92% 100% 109% 106% 112% Capital Total Equity $23 $45 $47 $49 $51 Tangible Common Equity / Tangible Assets 7.50% 11.96% 10.20% 9.22% 8.72% Tier 1 Leverage Ratio -- -- 10.64% 9.46% 8.78% Total Capital Ratio -- -- 15.05% 14.18% 12.74% Earnings & Profitability Net Income $2.0 $1.1 $2.2 $1.8 $2.2 ROAA 0.74% 0.33% 0.55% 0.36% 0.40% ROAE 9.39% 2.61% 5.09% 3.71% 4.37% Net Interest Margin 3.94% 3.63% 3.54% 3.37% 3.32% Non-Int Inc. / Avg. Assets 0.18% 0.25% 0.21% 0.19% 0.18% Efficiency Ratio 62.5% 68.7% 72.7% 79.5% 79.49% Asset Quality NPLs / Loans 3.08% 2.03% 1.64% 1.12% 0.75% NPAs / Assets 2.35% 1.66% 1.39% 0.90% 0.68% Reserves / Loans 1.51% 1.25% 1.08% 1.06% 0.98% NCOs / Average Loans 0.09% 0.04% 0.04% 0.03% 0.02% Yield and Cost Yield on Loans 5.71% 5.15% 4.68% 4.44% 4.34% Yield on Earning Assets 4.98% 4.44% 4.25% 4.09% 3.98% Cost of Interest Bearing Deposits 1.11% 0.95% 0.83% 0.82% 0.75% Cost of Interest Bearing Liabilities 1.24% 1.03% 0.88% 0.87% 0.83%