Exhibit 99.2
For Immediate Release
October 31, 2018
The Carlyle Group Announces Third Quarter 2018 Financial Results
| |
| • | U.S. GAAP results included net income attributable to The Carlyle Group L.P. common unitholders of $12 million, or $0.10 per common unit on a diluted basis, for Q3 2018 |
| |
| • | Economic Income of $111 million on a pre-tax basis and Economic Net Income of $0.25 per Adjusted Unit on a post-tax basis in Q3 2018, driven by 3% carry fund portfolio appreciation |
| |
| • | Distributable Earnings of $210 million on a pre-tax basis for Q3 2018 and $0.56 per common unit on a post-tax basis in Q3 2018 |
| |
| • | Declared a quarterly distribution of $0.42 per common unit for Q3 2018 |
| |
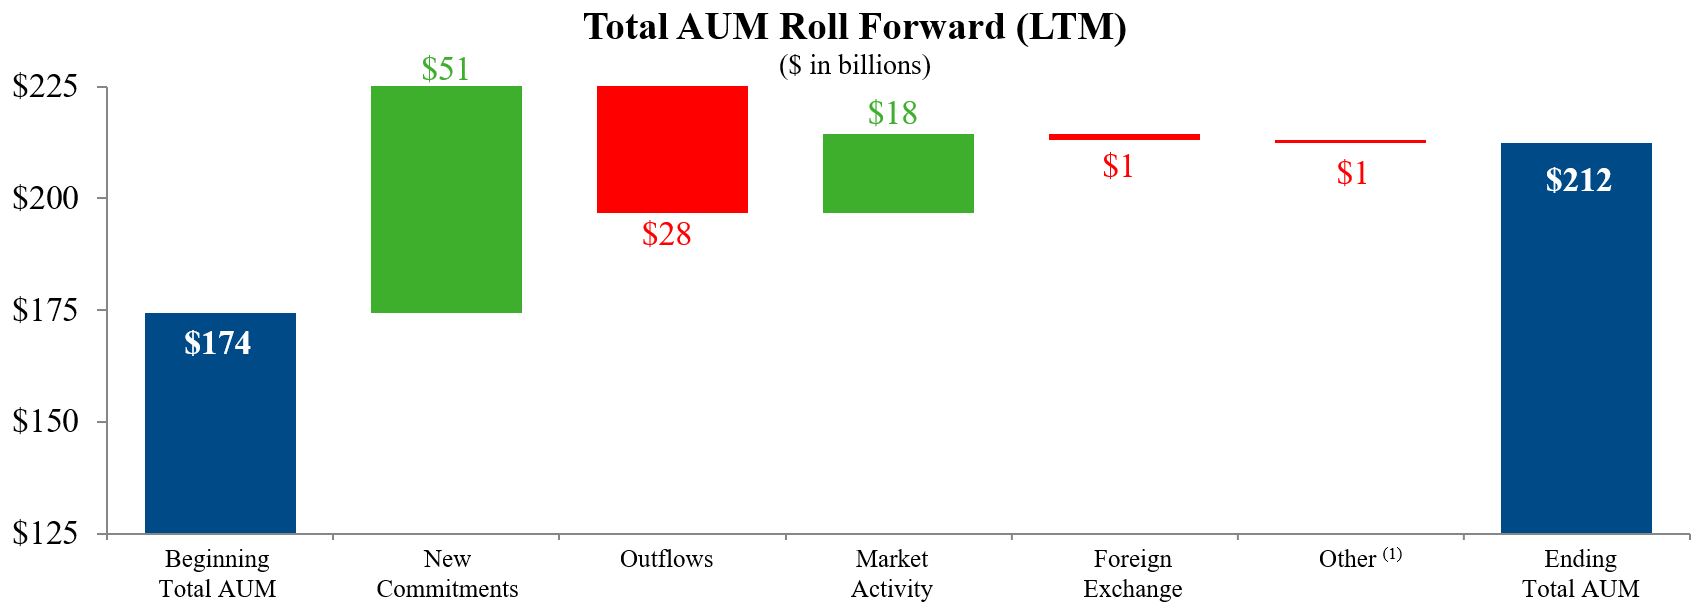
| • | Assets Under Management of $212.3 billion as of Q3 2018, up 22% over the last twelve months |
| |
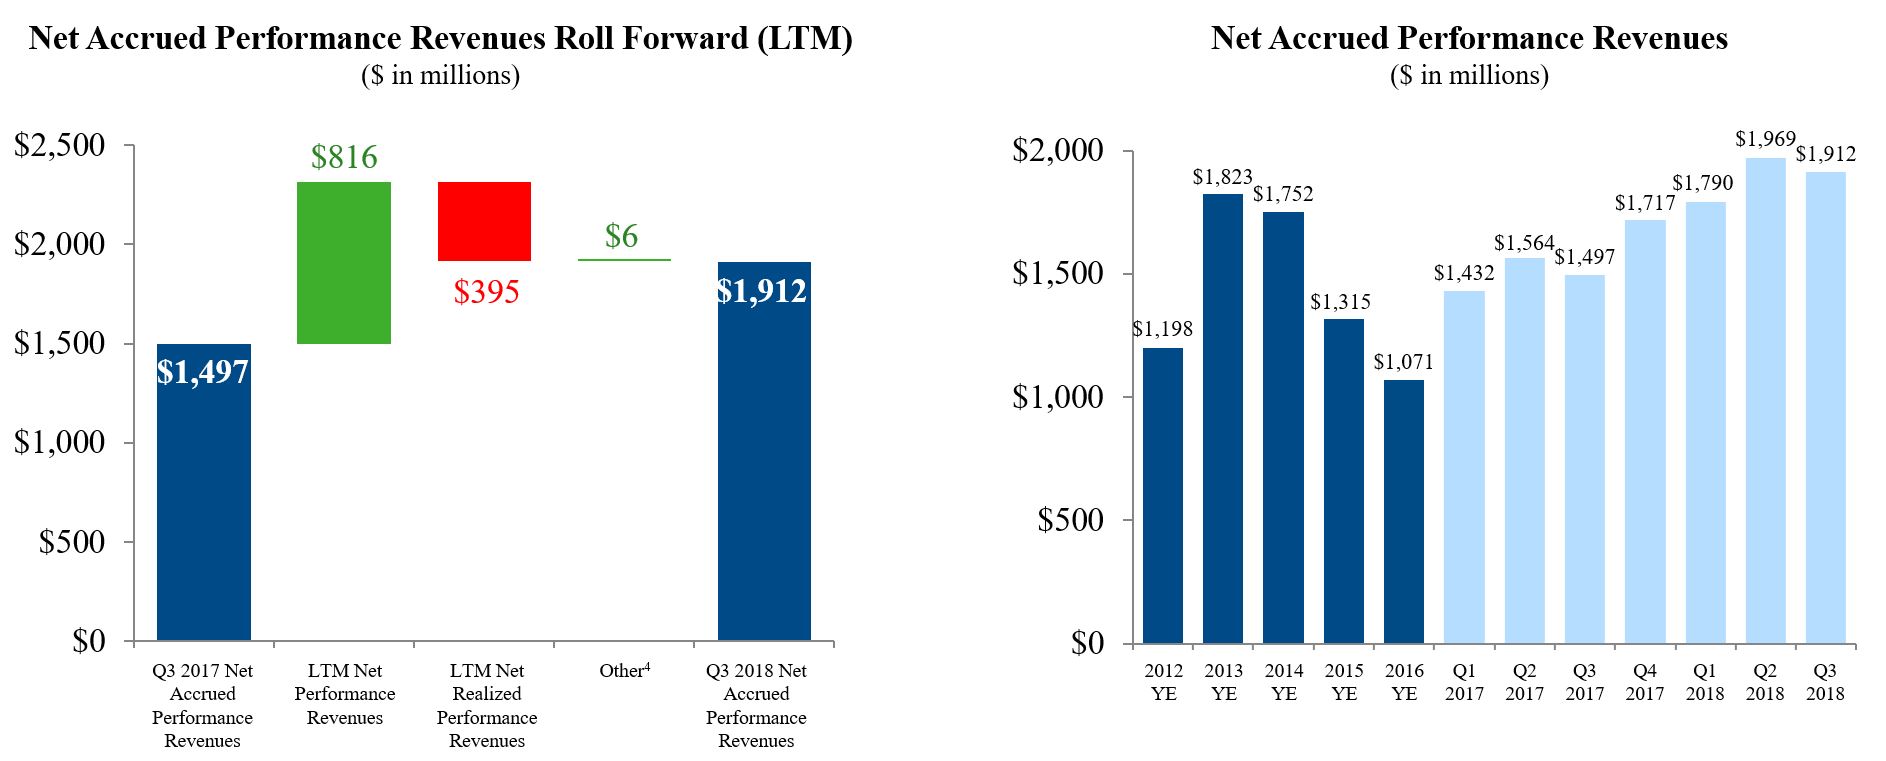
| • | Net accrued performance revenues of $1.9 billion as of Q3 2018, up 28% over the last twelve months |
| |
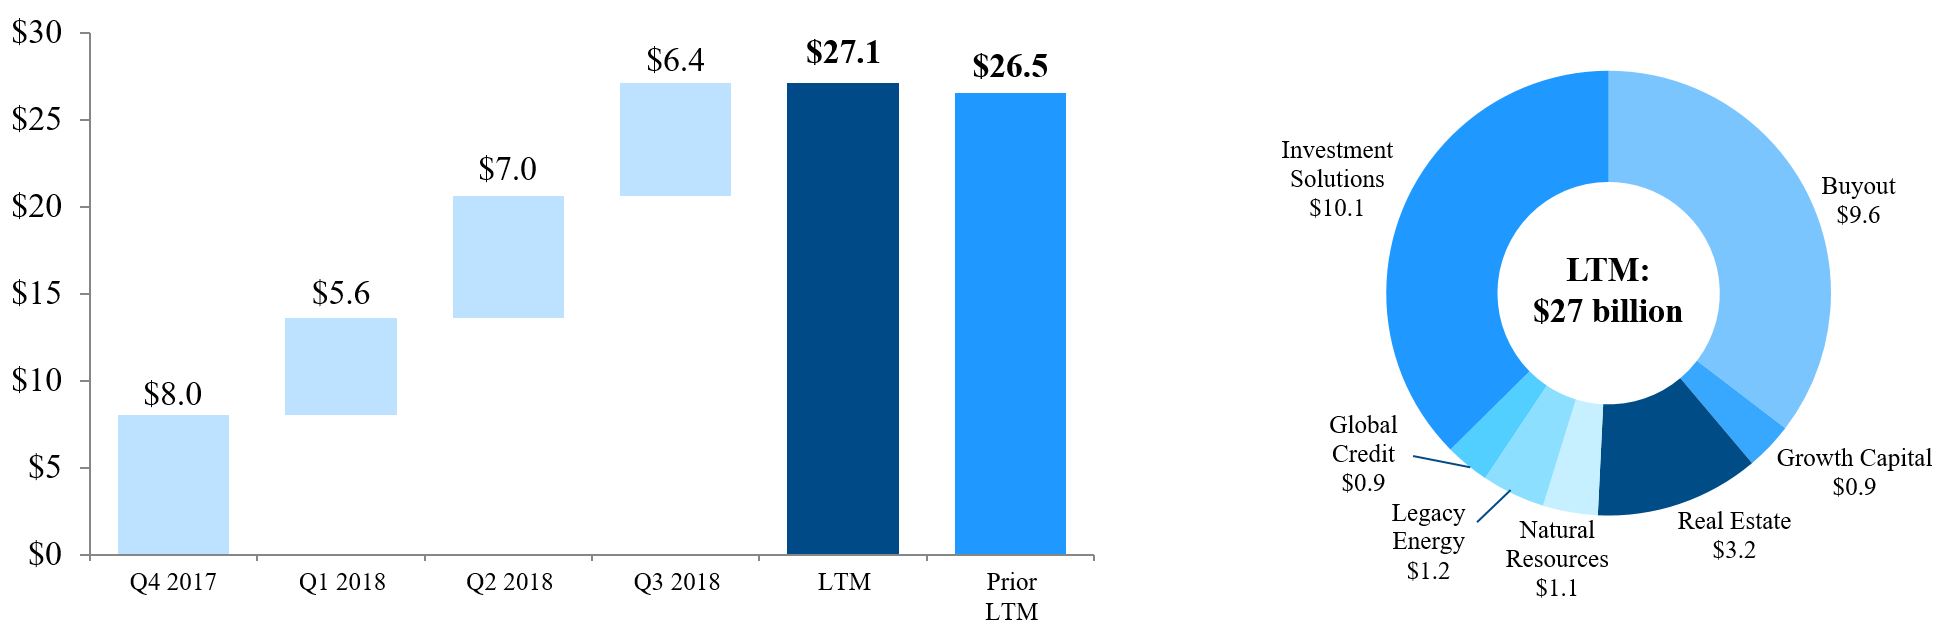
| • | $6.4 billion in realized proceeds in Q3 2018 and $27.1 billion realized over the last twelve months |
| |
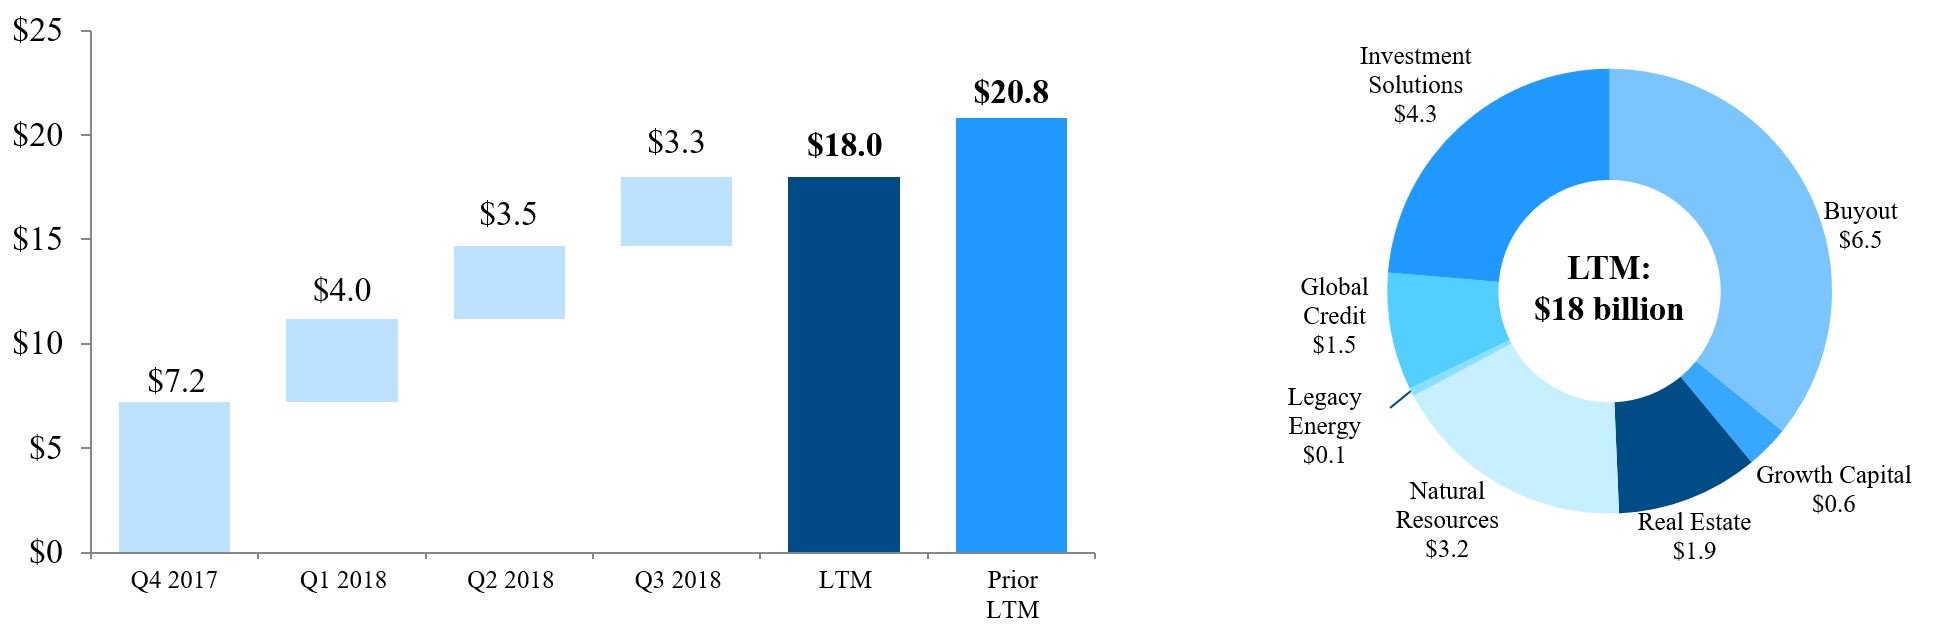
| • | $3.3 billion of invested capital in Q3 2018 and $18.0 billion invested over the last twelve months |
| |
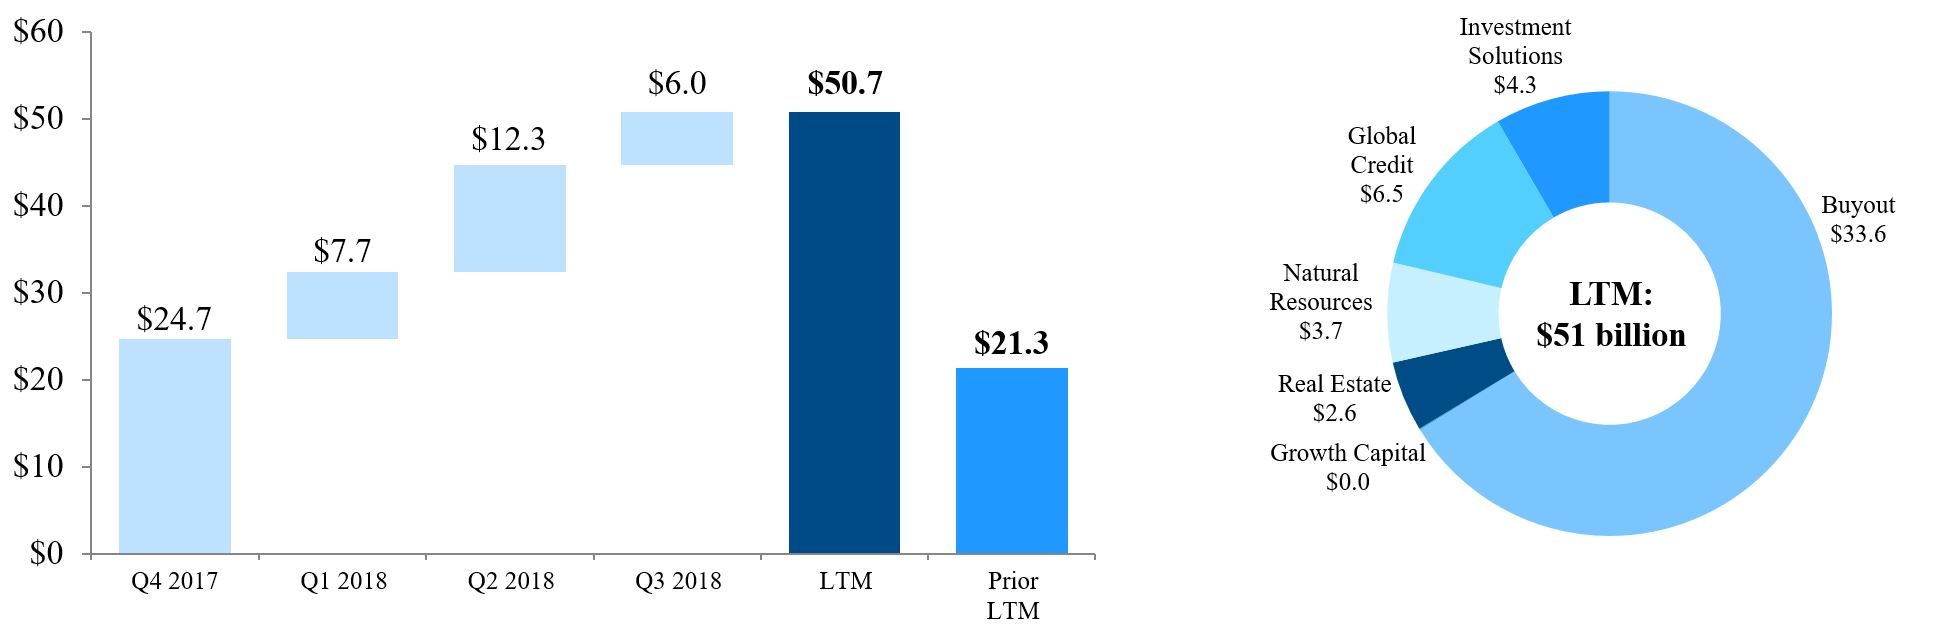
| • | $6.0 billion in capital raised in Q3 2018 and $50.7 billion raised over the last twelve months |
Washington, DC – Global alternative asset manager The Carlyle Group L.P. (NASDAQ: CG) today reported its unaudited results for the third quarter ended September 30, 2018.
Carlyle Co-CEOs Kewsong Lee and Glenn Youngkin said, “During the third quarter, we remained on track or ahead of schedule for many of the goals we laid out for the year and we have good momentum for future growth. Global markets are growing increasingly volatile, but we believe Carlyle is well positioned to take advantage of market dislocations and opportunities.”
U.S. GAAP results for Q3 2018 included income before provision for income taxes of $61 million, and net income attributable to The Carlyle Group L.P. common unitholders of $12 million, or net income per common unit of $0.10, on a diluted basis. U.S. GAAP results for the twelve months ended September 30, 2018 included income before provision for income taxes of $834 million and net income attributable to The Carlyle Group L.P. common unitholders of $162 million. Total balance sheet assets were $13 billion as of September 30, 2018.
|
|
| Carlyle Consolidated GAAP Results |
The Carlyle Group L.P.
Summary U.S. GAAP Condensed Consolidated Statements of Operations (Unaudited)
|
| | | | | | | | | | | | | | | | | | | | |
| | | Three Months Ended | | LTM |
| | | Sep 30, 2017 | Dec 31, 2017 | Mar 31, 2018 | Jun 30, 2018 | Sep 30, 2018 | | Sep 30, 2018 |
| | | (Dollars in millions, except per unit data) | | | |
| Revenues | | | | | | | | |
| Fund management fees | | $ | 262.5 |
| $ | 279.3 |
| $ | 264.5 |
| $ | 301.3 |
| $ | 328.8 |
| | $ | 1,173.9 |
|
| Incentive fees | | 10.4 |
| 8.2 |
| 6.3 |
| 7.4 |
| 6.8 |
| | 28.7 |
|
| Investment income, including performance allocations | | 312.4 |
| 664.4 |
| 362.2 |
| 503.3 |
| 258.6 |
| | 1,788.5 |
|
| Revenue from consolidated entities | | 44.7 |
| 45.1 |
| 47.3 |
| 53.6 |
| 60.5 |
| | 206.5 |
|
| All other revenues | | 9.9 |
| 10.8 |
| 22.5 |
| 28.0 |
| 24.4 |
| | 85.7 |
|
| Total revenues | | 639.9 |
| 1,007.8 |
| 702.8 |
| 893.6 |
| 679.1 |
| | 3,283.3 |
|
| | | | | | | | | |
| Expenses | | | | | | | | |
| Cash-based compensation and benefits | | 174.1 |
| 181.6 |
| 187.3 |
| 176.0 |
| 186.6 |
| | 731.5 |
|
| Equity-based compensation | | 81.0 |
| 78.5 |
| 84.9 |
| 64.9 |
| 49.7 |
| | 278.0 |
|
| Performance allocations and incentive fee related compensation | | 137.6 |
| 276.5 |
| 158.0 |
| 222.0 |
| 146.0 |
| | 802.5 |
|
| General, administrative and other expenses | | (18.7 | ) | 105.9 |
| 95.0 |
| 126.8 |
| 166.2 |
| | 493.9 |
|
| Expenses from consolidated entities and loss on deconsolidation of Urbplan | | 101.7 |
| 36.7 |
| 35.9 |
| 45.3 |
| 40.5 |
| | 158.4 |
|
| Interest and other non-operating expenses (income) | | 16.9 |
| (54.4 | ) | 18.2 |
| 18.7 |
| 26.6 |
| | 9.1 |
|
| Total expenses | | 492.6 |
| 624.8 |
| 579.3 |
| 653.7 |
| 615.6 |
| | 2,473.4 |
|
| | | | | | | | | |
| Net investment gains (losses) of consolidated funds | | 18.6 |
| 12.0 |
| 2.0 |
| 12.9 |
| (2.9 | ) | | 24.0 |
|
| Income before provision for income taxes | | 165.9 |
| 395.0 |
| 125.5 |
| 252.8 |
| 60.6 |
| | 833.9 |
|
| Provision (benefit) for income taxes | | (1.3 | ) | 107.2 |
| 7.8 |
| 11.6 |
| 17.4 |
| | 144.0 |
|
| Net income | | 167.2 |
| 287.8 |
| 117.7 |
| 241.2 |
| 43.2 |
| | 689.9 |
|
| Net income attributable to non-controlling interests in consolidated entities | | 27.6 |
| 25.1 |
| 11.0 |
| 16.7 |
| 14.5 |
| | 67.3 |
|
| Net income attributable to Carlyle Holdings | | 139.6 |
| 262.7 |
| 106.7 |
| 224.5 |
| 28.7 |
| | 622.6 |
|
| Net income attributable to non-controlling interests in Carlyle Holdings | | 95.0 |
| 203.8 |
| 67.0 |
| 155.1 |
| 11.2 |
| | 437.1 |
|
| Net income attributable to The Carlyle Group L.P. | | 44.6 |
| 58.9 |
| 39.7 |
| 69.4 |
| 17.5 |
| | 185.5 |
|
| Net income attributable to Series A Preferred Unitholders | | — |
| 6.0 |
| 5.9 |
| 5.9 |
| 5.9 |
| | 23.7 |
|
| Net income attributable to The Carlyle Group L.P. Common Unitholders | | $ | 44.6 |
| $ | 52.9 |
| $ | 33.8 |
| $ | 63.5 |
| $ | 11.6 |
| | $ | 161.8 |
|
| | | | | | | | | |
| Net income attributable to The Carlyle Group L.P. per common unit | | | | | | | | |
| Basic | | $ | 0.47 |
| $ | 0.53 |
| $ | 0.34 |
| $ | 0.62 |
| $ | 0.11 |
| | $ | 1.59 |
|
| Diluted | | $ | 0.43 |
| $ | 0.49 |
| $ | 0.30 |
| $ | 0.56 |
| $ | 0.10 |
| | $ | 1.45 |
|
| | | | | | | | | |
Income before provision for income taxes(1) was $61 million for Q3 2018, compared to $166 million for Q3 2017. The decrease in income before provision for income taxes in Q3 2018 compared to Q3 2017 was primarily due to, among other factors:
| |
| • | $66 million increase in fund management fees primarily due to activation of CP VII and CAP V management fees in Q2 2018; |
| |
| • | $62 million decrease in investment income, including performance allocations, net of the related compensation primarily due to lower net performance allocations; |
| |
| • | $31 million decrease in equity-based compensation due to the final vesting of the IPO awards in May 2018, partially offset by the increase in awards granted, including performance awards, in 2018 compared to 2017; |
| |
| • | $185 million increase in general, administrative and other expenses primarily due to a $64 million charge in Q3 2018 related to the assignment of an existing office lease in New York, $74 million of net insurance recoveries in Q3 2017 and the $25 million reversal of a litigation reserve in Q3 2017; |
| |
| • | $61 million decrease in expenses from consolidated entities and loss on deconsolidation of Urbplan due to a $65 million charge in Q3 2017 from the Urbplan transaction; and |
| |
| • | $10 million increase in interest and other non-operating expenses primarily due to $8 million of debt extinguishment costs in Q3 2018 |
Net income attributable to The Carlyle Group L.P. Common Unitholders was $12 million, or $0.10 per common unit on a diluted basis for Q3 2018, compared to $45 million, or $0.43 per common unit on a diluted basis for Q3 2017.
See Notes at end of document.
|
|
| Non-GAAP Operating Results |
|
| | | | | | | | | | | | | | | | | | | | | | | | | | | | | | | | | | |
Carlyle Group Summary ($ in millions, except unit and per unit amounts) |
| | | | | | | | | | | | | | | | | | | | | |
| | | | | | | | | | | | | YTD | | LTM | | % Change |
| $ in millions, except per unit data and where noted | | | | | | | | | | | | | | | | | | | | |
| | Q3 2017 | | Q4 2017 | | Q1 2018 | | Q2 2018 | | Q3 2018 | | Q3 2018 | | Q4 17 - Q3 18 | | QoQ | | YoY | | LTM |
| | | | | | | | | | | | | | | | | | | | | |
| Economic Income | | $ | 202.7 |
| | $ | 366.4 |
| | $ | 169.0 |
| | $ | 272.1 |
| | $ | 110.6 |
| | $ | 551.7 |
| | $918.1 | | (59)% | | (45)% | | 1% |
| | | | | | | | | | | | | | | | | | | | | |
| Fee Related Earnings | | 108.0 |
| | 26.7 |
| | 28.2 |
| | 57.8 |
| | 89.0 |
| | 175.0 |
| | 201.7 | | 54% | | (18)% | | 513% |
| | | | | | | | | | | | | | | | | | | | | |
| Distributable Earnings | | 259.9 |
| | 155.8 |
| | 138.9 |
| | 114.5 |
| | 210.0 |
| | 463.4 |
| | 619.2 | | 83% | | (19)% | | 19% |
| | | | | | | | | | | | | | | | | | | | | |
| Economic Income, Tax and Per Unit Information | | | | | | | | | | | | | | | | | | |
| | | | | | | | | | | | | | | | | | | | | |
| Economic Income | | $ | 202.7 |
| | $ | 366.4 |
| | $ | 169.0 |
| | $ | 272.1 |
| | $ | 110.6 |
| | $ | 551.7 |
| | $ | 918.1 |
| | | | | | |
| | | | | | | | | | | | | | | | | | | | | |
Less (Add): Provision (Benefit) for income taxes (1) | | 10.4 |
| | 13.2 |
| | 2.1 |
| | 28.5 |
| | 18.8 |
| | 49.4 |
| | 62.6 |
| | | | | | |
| Less: Preferred unit distributions | | — |
| | 6.0 |
| | 5.9 |
| | 5.9 |
| | 5.9 |
| | 17.7 |
| | 23.7 |
| | | | | | |
| | | | | | | | | | | |
| | | | | | | | | | |
| Economic Net Income (after taxes) | | $ | 192.3 |
| | $ | 347.2 |
| | $ | 161.0 |
| | $ | 237.7 |
| | $ | 85.9 |
| | $ | 484.6 |
| | $ | 831.8 |
| | | | | | |
| | | | | | | | | | | |
| | | | | | | | | | |
| Adjusted Units* (in millions) | | 342.8 |
| | 343.5 |
| | 345.9 |
| | 345.4 |
| | 346.5 |
| | 348.6 |
| | 343.7 |
| | | | | | |
| | | | | | | | | | | | | | | | | | | | | |
Economic Net Income (after taxes and preferred unit distributions) per Adjusted Unit | | $ | 0.56 |
| | $ | 1.01 |
| | $ | 0.47 |
| | $ | 0.69 |
| | $ | 0.25 |
| | $ | 1.41 |
| | $ | 2.42 |
| | | | | | |
| | | | | | | | | | | | | | | | | | | | | |
| Distributable Earnings, Tax and Per Unit Information | | | | | | | | | | | | | | | | |
| | | | | | | | | | | | | | | | | | | | | |
| Distributable Earnings | | $ | 259.9 |
| | $ | 155.8 |
| | $ | 138.9 |
| | $ | 114.5 |
| | $ | 210.0 |
| | $ | 463.4 |
| | $ | 619.2 |
| | | | | | |
| | | | | | | | | | | | | | | | | | | | | |
Less: Estimated foreign, state, and local taxes(2) | | 5.4 |
| | 5.0 |
| | 7.7 |
| | 6.9 |
| | 9.4 |
| | 24.0 |
| | 29.0 |
| | | | | | |
| Less: Preferred unit distributions | | — |
| | 6.0 |
| | 5.9 |
| | 5.9 |
| | 5.9 |
| | 17.7 |
| | 23.7 |
| | | | | | |
| | | | | | | | | | | |
| | | | | | | | | | |
Distributable Earnings (after taxes and preferred unit distributions) | | $ | 254.5 |
| | $ | 144.8 |
| | $ | 125.3 |
| | $ | 101.7 |
| | $ | 194.7 |
| | $ | 421.7 |
| | $ | 566.5 |
| | | | | | |
| | | | | | | | | | | | | | | | | | | | | |
| Allocating Distributable Earnings for only public unitholders of The Carlyle Group L.P. | | | | | | | | | | | | |
| | | | | | | | | | | | | | | | | | | | | |
| Distributable Earnings to The Carlyle Group L.P. | | $ | 74.7 |
| | $ | 43.3 |
| | $ | 38.5 |
| | $ | 31.8 |
| | $ | 62.0 |
| | $ | 132.3 |
| | $ | 175.6 |
| | | | | | |
| | | | | | | | | | | | | | | | | | | | | |
Less: Estimated current corporate income taxes(3) | | 1.4 |
| | (0.5 | ) | | 1.1 |
| | 1.1 |
| | 1.2 |
| | 3.4 |
| | 2.9 |
| | | | | | |
| | | | | | | | | | | | | | | | | | | | | |
| Distributable Earnings Attributable to Common Unitholders | | $ | 73.3 |
| | $ | 43.8 |
| | $ | 37.4 |
| | $ | 30.7 |
| | $ | 60.8 |
| | $ | 128.9 |
| | $ | 172.7 |
| | | | | | |
| | | | | | | | | | | | | | | | | | | | | |
| Units in public float (in millions) ** | | 98.3 |
| | 100.5 |
| | 103.7 |
| | 106.2 |
| | 108.3 |
| | 108.3 |
| | 104.7 |
| | | | | | |
| | | | | | | | | | | | | | | | | | | | | |
Distributable Earnings, net, per The Carlyle Group L.P. common unit outstanding | | $ | 0.75 |
| | $ | 0.44 |
| | $ | 0.36 |
| | $ | 0.29 |
| | $ | 0.56 |
| | $ | 1.21 |
| | $ | 1.65 |
| | | | | | |
| | | | | | | | | | | | | | | | | | | | | |
| Distribution per common unit | | $ | 0.56 |
| | $ | 0.33 |
| | $ | 0.27 |
| | $ | 0.22 |
| | $ | 0.42 |
| | $ | 0.91 |
| | $ | 1.24 |
| | | | | | |
| | | | | | | | | | | | | | | | | | | | | |
| * Adjusted Units were determined as follows (in millions): | | | | | | | | | | | | | | | | |
The Carlyle Group L.P. common units outstanding | | 97.8 |
| | 100.1 |
| | 101.4 |
| | 102.1 |
| | 107.8 |
| | 107.8 |
| | | | | | | | |
Carlyle Holdings partnership units not held by The Carlyle Group L.P. | | 236.6 |
| | 234.8 |
| | 233.9 |
| | 233.2 |
| | 231.5 |
| | 231.5 |
| | | | | | | | |
Dilutive effect of unvested deferred restricted common units | | 7.8 |
| | 8.0 |
| | 10.2 |
| | 9.7 |
| | 6.4 |
| | 8.8 |
| | | | | | | | |
| Issuable Carlyle Group L.P. common units | | — |
| | — |
| | 0.4 |
| | 0.4 |
| | 0.8 |
| | 0.5 |
| | | | | | | | |
| Issuable Carlyle Holdings partnership units | | 0.6 |
| | 0.6 |
| | — |
| | — |
| | — |
| | — |
| | | | | | | | |
| Total Adjusted Units | | 342.8 |
| | 343.5 |
| | 345.9 |
| | 345.4 |
| | 346.5 |
| | 348.6 |
| |
| | | | | | |
| | | | | | | | | | | | | | | | | | | | | |
| ** Includes approximately 0.5 million common units that will be issued in November 2018 in connection with the vesting of deferred restricted common units. For purposes of this calculation, these common units have been added to the common units outstanding as of September 30, 2018 because they will participate in the unitholder distribution that will be paid on the common units in November 2018. |
Totals may not sum due to rounding. See Notes at end of document.
|
|
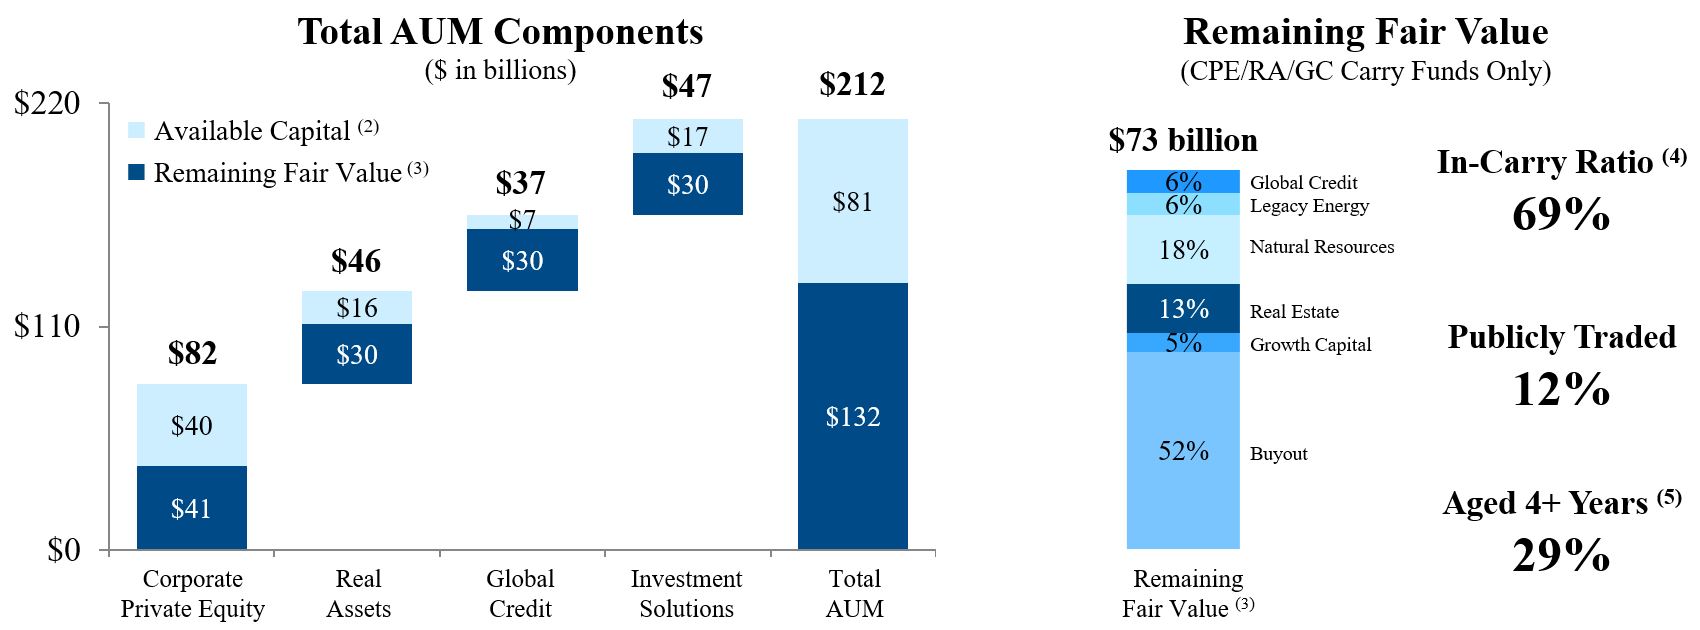
| Carry Fund Appreciation and Net Accrued Performance Revenues |
Carlyle's carry fund portfolio appreciated 3% during Q3 2018 and 17% over the past twelve months. Carlyle's private carry fund portfolio appreciated 3% and the public carry fund portfolio depreciated (3)% during Q3 2018, in both cases excluding Investment Solutions. As of September 30, 2018, public positions accounted for 12% of remaining fair value across our Corporate Private Equity, Real Assets and Global Credit carry funds. Carry fund valuations for Q3 2018 were most positively impacted by our fifth and sixth U.S. Buyout funds (CP V and VI), seventh U.S. Realty fund (CRP VII) and the eleventh NGP Energy fund (NGP XI), partially offset by depreciation in our fourth Asia Buyout fund (CAP IV), among others. The Net Accrued Performance Revenues balance decreased 3% during the quarter to $1.9 billion, but increased 28% over the LTM.
|
| | | | | | | | | | | | | | |
| | | Carry Fund Appreciation/(Depreciation)(1) | | LTM | | Net Accrued Performance Revenues(2) ($ in millions) |
| | | Q3 2017 | | Q4 2017 | | Q1 2018 | | Q2 2018 | | Q3 2018 | | Q4 2017 - Q3 2018 | | Q3 2018 |
| Overall Carry Fund Appreciation/(Depreciation) | | 3% | | 5% | | 3% | | 5% | | 3% | | 17% | | |
| | | | | | | | | | | | | | | |
| Corporate Private Equity | | 4% | | 8% | | 4% | | 3% | | 1% | | 16% | | $1,215 |
| Buyout | | 3% | | 8% | | 4% | | 3% | | 1% | | 16% | | $1,160 |
| Growth Capital | | 6% | | 6% | | 2% | | 3% | | 1% | | 13% | | $55 |
| | | | | | | | | | | | | | | |
| Real Assets | | 2% | | 4% | | 2% | | 7% | | 3% | | 17% | | $570 |
| Real Estate | | 3% | | 3% | | 1% | | 5% | | 3% | | 12% | | $314 |
Natural Resources (3) | | 5% | | 8% | | 2% | | 9% | | 3% | | 26% | | $275 |
| Legacy Energy | | (3)% | | 2% | | 2% | | 4% | | 4% | | 11% | | $(19) |
| | | | | | | | | | | | | | | |
| Global Credit Carry Funds | | 0% | | 1% | | 2% | | 3% | | 1% | | 10% | | $34 |
| | | | | | | | | | | | | | | |
| Investment Solutions Carry Funds | | 3% | | 3% | | 4% | | 8% | | 5% | | 20% | | $93 |
| | | | | | | | | | | | | | | |
| Net Accrued Performance Revenues | | | | | | | | | | | | | | $1,912 |
| | | | | | | | | | | | | | | |
The sum of quarters may not equal LTM due to rounding. See Notes at end of document.
|
|
| Carlyle All Segment Results |
| |
| • | Fee Related Earnings were $89 million in Q3 2018 compared to $108 million in Q3 2017, which included $74 million in net insurance recoveries. Fund Management Fees of $355 million for Q3 2018 increased 28% versus Q3 2017, slightly higher than the 21% increase in Fee-Earning AUM over the same period. Catch-up management fees were $8 million in Q3 2018 compared to $1 million in Q3 2017. |
| |
| • | Distributable Earnings of $210 million in Q3 2018 include $89 million in Fee Related Earnings and $124 million in Realized Net Performance Revenues. During Q3 2018, Realized Net Performance Revenues benefited from public equity sales in Focus Media (CAP III) and Coresite (CRP III), and private company sale of Expereo (CETP III), among others. We continue to expect full year 2018 Realized Net Performance Revenues to be lower than full year 2017. |
| |
| • | Economic Income was $111 million in Q3 2018, driven by 3% carry fund appreciation in the quarter, consistent with the overall appreciation in Q3 2017, although appreciation in Corporate Private Equity and Natural Resources were below the year-ago levels. Economic Income of $918 million over the LTM was generally in line with the prior LTM. |
| |
| • | Total Assets Under Management (“AUM”) of $212.3 billion as of Q3 2018 increased 22% compared to Q3 2017 due to a combination of $50.7 billion in fundraising and $17.7 billion in market appreciation, partially offset by $27.1 billion in realized proceeds to fund investors. |
| |
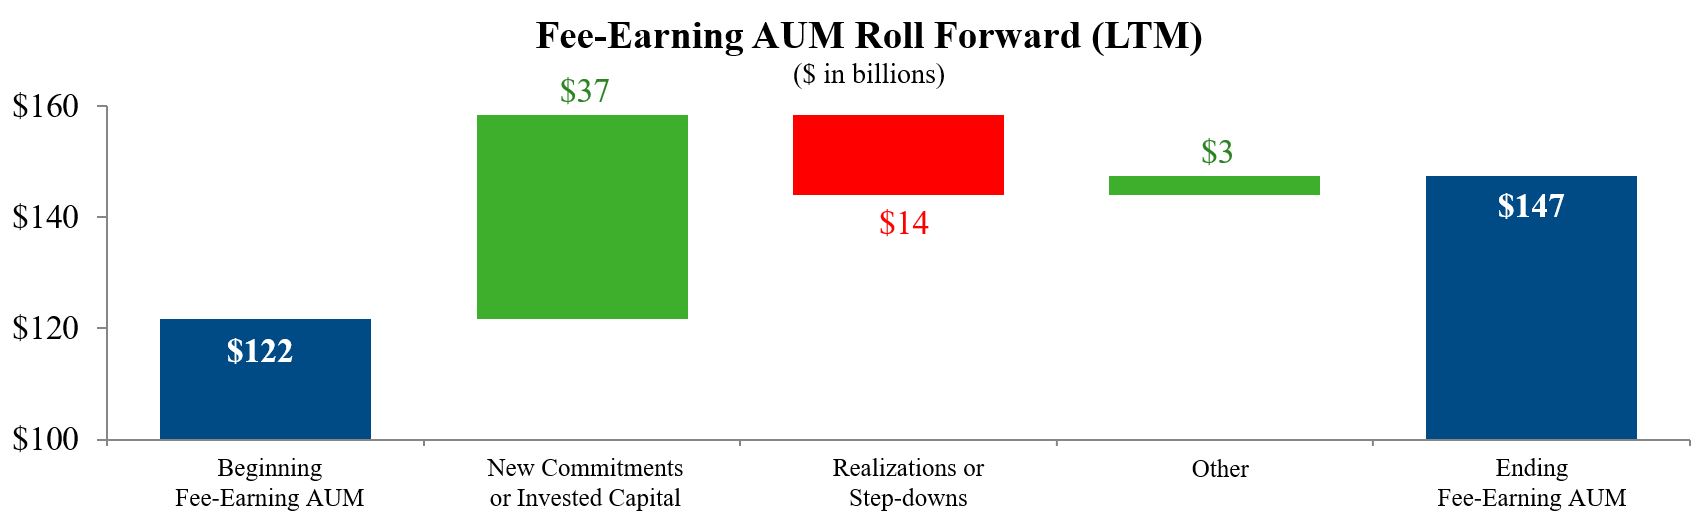
| • | Fee-Earning AUM of $147.4 billion increased 21% compared to Q3 2017. As of Q3 2018, there was $11.4 billion in pending Fee-Earning AUM that will turn on fees either through activation of the underlying fund or additional capital deployment. |
|
| | | | | | | | | | | | | |
| Business Drivers |
| | | | | | | | | | | | | | |
| $ in billions, unless noted | | Q3 2017 | | Q3 2018 | | Prior
YTD | | YTD | | Prior LTM | | LTM |
| | | | | | | | | | | | | | |
| Fundraising | | $7.1 | | $6.0 | | $18.6 | | $26.0 | | $21.3 | | $50.7 |
| | | | | | | | | | | | | | |
Invested Capital (carry funds) | | 6.9 | | 3.3 | | 14.8 | | 10.8 | | 20.8 | | 18.0 |
| | | | | | | | | | | | | | |
| Realized Proceeds (carry funds) | | 8.4 | | 6.4 | | 18.0 | | 19.1 | | 26.5 | | 27.1 |
| | | | | | | | | | | | | | |
| Carry Fund Appreciation | | 3% | | 3% | | 14% | | 12% | | 19% | | 17% |
| | | | | | | | | | | | | | |
| Financial Metrics |
| | | | | | | | | | | | | | |
| $ in millions | | Q3 2017 | | Q3 2018 | | Prior
YTD | | YTD | | Prior LTM | | LTM |
| | | | | | | | | | | | | | |
| | Fee Related Earnings (FRE) | | $108 | | $89 | | $165 | | $175 | | $33 | | $202 |
| | | | | | | | | | | | | | |
| + | Realized Net Performance Revenues | | 217 | | 124 | | 434 | | 277 | | 570 | | 395 |
| | | | | | | | | | | | | | |
| + | Realized Principal Investment Income | | (53) | | 7 | | (48) | | 43 | | (31) | | 66 |
| | | | | | | | | | | | | | |
| + | Net Interest | | (12) | | (10) | | (37) | | (32) | | (50) | | (43) |
| | | | | | | | | | | | | | |
| = | Distributable Earnings (DE) | | $260 | | $210 | | $514 | | $463 | | $522 | | $619 |
| | | | | | | | | | | | | | |
| | Fee Related Earnings (FRE) | | $108 | | $89 | | $165 | | $175 | | $33 | | $202 |
| | | | | | | | | | | | | | |
| + | Net Performance Revenues | | 147 | | 69 | | 841 | | 479 | | 901 | | 816 |
| | | | | | | | | | | | | | |
| + | Principal Investment Income | | (35) | | 14 | | 7 | | 69 | | 21 | | 110 |
| | | | | | | | | | | | | | |
| – | Equity-based Compensation | | 30 | | 52 | | 97 | | 139 | | 122 | | 166 |
| | | | | | | | | | | | | | |
| – | Net Interest | | 12 | | 10 | | 37 | | 32 | | 50 | | 43 |
| | | | | | | | | | | | | | |
| – | Other1 | | (25) | | — | | (25) | | — | | (125) | | — |
| | | | | | | | | | | | | | |
| = | Economic Income | | $203 | | $111 | | $903 | | $552 | | $909 | | $918 |
| | | | | | | | | | | | | | |

LTM, or last twelve months, refers to the period Q4 2017 through Q3 2018. Prior LTM, or the prior rolling 12-month period, refers to the period Q4 2016 through Q3 2017. Totals may not sum due to rounding. See Notes at end of document.
|
|
| Corporate Private Equity (CPE) |
| |
| • | Fee Related Earnings were $44 million in Q3 2018, compared to $8 million in Q3 2017. Fund Management Fees increased 49% in Q3 2018 versus Q3 2017 due to strong fundraising activity in our latest vintage U.S. and Asia buyout funds, and was partially offset by a 12% increase in cash-based compensation expense and higher general and administrative expenses. Catch up management fees were $3 million in Q3 2018 compared with $0 in Q3 2017. |
| |
| • | Distributable Earnings were $121 million in Q3 2018 compared to $207 million in Q3 2017, and includes $78 million in Realized Net Performance Revenues, $4 million in Realized Investment Income and $44 million in Fee Related Earnings. Realized proceeds of $1.5 billion in Q3 2018 were lower than Q3 2017, driving lower Realized Net Performance Revenues. |
| |
| • | CPE carry funds appreciated 1% in the quarter, driving Net Performance Revenues of $28 million, as compared to 4% appreciation in Q3 2017 resulting in Net Performance Revenues of $81 million. |
| |
| • | Economic Income was $47 million in Q3 2018 and $509 million for the LTM, a decrease of 29% from the prior LTM, generally due to lower carry fund appreciation of 16% in the LTM compared to 27% for the prior LTM. |
| |
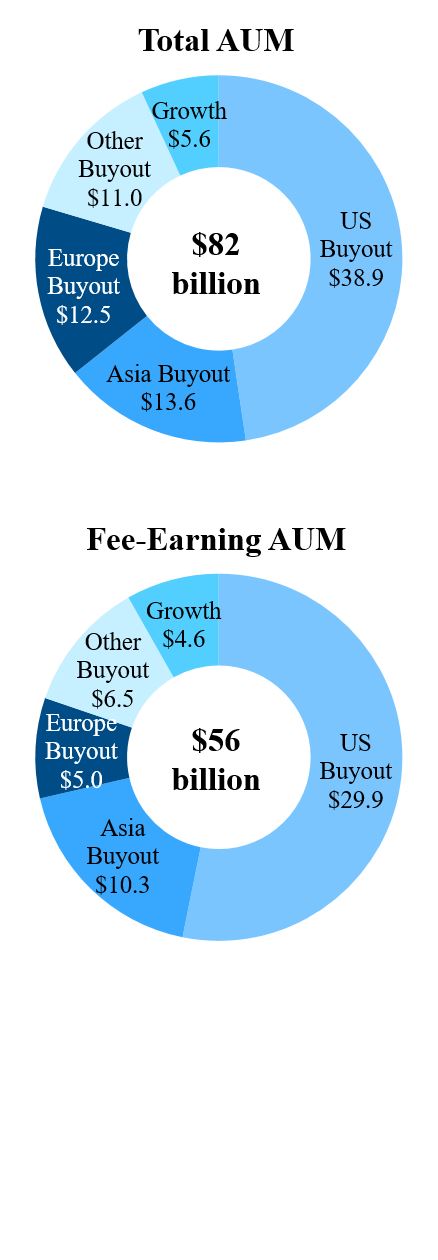
| • | Invested $1.1 billion in Q3 2018 into new and follow-on investments, including Du Xiaoman Financial (CAP V), One Medical (CP VII), and LPG Systems and HGH Infared Systems (CETP III). As of the end of Q3 2018, CPE had also announced transactions with over $7.0 billion of additional equity commitments, including Nouryon (formerly AkzoNobel Specialty Chemicals) which closed in October, and Sedgwick which is expected to close over the next few quarters. |
| |
| • | Assets Under Management reached a record $81.6 billion in Q3 2018, an increase of 46% compared to Q3 2017, positively impacted by $33.6 billion in fundraising and $5.8 billion in market appreciation, partially offset by $10.5 billion in realized proceeds. |
|
| | | | | | | | | | | | |
| Business Drivers |
| | | | | | | | | | | | | |
| $ in billions, unless noted | | Q3 2017 | | Q3 2018 | | Prior
YTD | | YTD | | Prior LTM | | LTM |
| | | | | | | | | | | | | |
| Fundraising | | $0.9 | | $1.8 | | $1.4 | | $14.5 | | $1.4 | | $33.6 |
| | | | | | | | | | | | | |
| Invested Capital (carry funds) | | 3.6 | | 1.1 | | 7.5 | | 3.4 | | 10.1 | | 7.0 |
| | | | | | | | | | | | | |
| Realized Proceeds (carry funds) | | 4.0 | | 1.5 | | 7.7 | | 7.1 | | 11.4 | | 10.5 |
| | | | | | | | | | | | | |
| Carry Fund Appreciation | | 4% | | 1% | | 23% | | 8% | | 27% | | 16% |
| | | | | | | | | | | | | |
| Financial Metrics |
| | | | | | | | | | | | | |
| $ in millions | | Q3 2017 | | Q3 2018 | | Prior
YTD | | YTD | | Prior LTM | | LTM |
| | | | | | | | | | | | | |
| Fund Management Fees | | $118 | | $176 | | $352 | | $438 | | $474 | | $557 |
| | | | | | | | | | | | | |
| Realized Net Performance Revenues | | 198 | | 78 | | 373 | | 203 | | 532 | | 288 |
| Net Performance Revenues | | 81 | | 28 | | 617 | | 281 | | 617 | | 541 |
| | | | | | | | | | | | | |
| Realized Principal Investment Income | | 7 | | 4 | | 16 | | 24 | | 29 | | 34 |
| Principal Investment Income | | 11 | | 4 | | 39 | | 27 | | 54 | | 51 |
| | | | | | | | | | | | | |
| Fee Related Earnings (FRE) | | $8 | | $44 | | $44 | | $35 | | $69 | | $17 |
| | | | | | | | | | | | | |
| Distributable Earnings (DE) | | $207 | | $121 | | $415 | | $248 | | $607 | | $320 |
| | | | | | | | | | | | | |
| Economic Income | | $92 | | $47 | | $647 | | $261 | | $718 | | $509 |
| | | | | | | | | | | | | |
Totals may not sum due to rounding.
| |
| • | Fee Related Earnings were $26 million in Q3 2018, compared to $16 million in Q3 2017, with Fund Management Fees increasing 7% and cash-based compensation declining 14%. Over the LTM, Fee Related Earnings of $118 million increased 293% relative to the prior LTM. Catch-up management fees were $3 million in Q3 2018, up from $1 million in Q3 2017. |
| |
| • | Distributable Earnings were $66 million in Q3 2018 and $202 million over the LTM, higher relative to a loss of $(45) million in the prior LTM which included a realized investment loss in Q3 2017 related to Urbplan Desenvolvimento Urbano. Realized Net Performance Revenues were a quarterly record $42 million in Q3 2018 driven by realized proceeds of $1.7 billion. |
| |
| • | Real Assets carry funds appreciated 3% in the quarter with strong appreciation in the seventh U.S. real estate fund, eleventh NGP energy fund and our international energy fund, driving Net Performance Revenues of $35 million, compared with appreciation of 2% and Net Performance Revenue of $50 million in Q3 2017 due to higher appreciation in Natural Resources. |
| |
| • | Economic Income was $51 million in Q3 2018 and $324 million for the LTM, an increase of 70% from the prior LTM, driven by significant growth in Fee Related Earnings over the same period. |
| |
| • | Invested $0.8 billion in the quarter and $5.2 billion over the LTM. |
| |
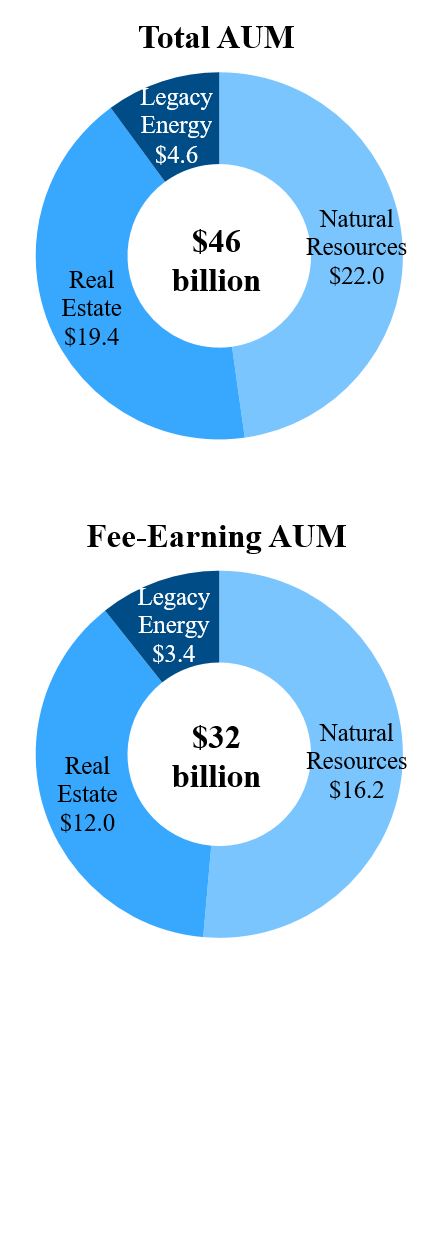
| • | Assets Under Management of $46.0 billion increased 16% compared to Q3 2017, largely driven by $6.3 billion in fundraising and $4.2 billion in market appreciation, partially offset by $5.6 billion in realized proceeds. Fundraising of $1.1 billion in Q3 2018 included the final close of our eighth U.S. Realty fund, and additional closes in our Europe real estate, core plus real estate (CPI) funds and the latest vintage NGP energy fund, along with several coinvestment vehicles. |
|
| | | | | | | | | | | | |
| Business Drivers |
| | | | | | | | | | | | | |
| $ in billions, unless noted | | Q3 2017 | | Q3 2018 | | Prior
YTD | | YTD | | Prior LTM | | LTM |
| | | | | | | | | | | | | |
| Fundraising | | $2.4 | | $1.1 | | $7.0 | | $3.1 | | $7.3 | | $6.3 |
| | | | | | | | | | | | | |
| Invested Capital (carry funds) | | 1.3 | | 0.8 | | 2.8 | | 3.6 | | 4.9 | | 5.2 |
| | | | | | | | | | | | | |
| Realized Proceeds (carry funds) | | 1.7 | | 1.7 | | 3.2 | | 4.2 | | 5.2 | | 5.6 |
| | | | | | | | | | | | | |
| Carry Fund Appreciation | | 2% | | 3% | | 14% | | 12% | | 18% | | 17% |
| | | | | | | | | | | | | |
| Financial Metrics |
| | | | | | | | | | | | | |
| $ in millions | | Q3 2017 | | Q3 2018 | | Prior
YTD | | YTD | | Prior LTM | | LTM |
| | | | | | | | | | | | | |
| Fund Management Fees | | $71 | | $76 | | $186 | | $229 | | $245 | | $307 |
| | | | | | | | | | | | | |
| Realized Net Performance Revenues | | 11 | | 42 | | 40 | | 64 | | 11 | | 75 |
| Net Performance Revenues | | 50 | | 35 | | 180 | | 161 | | 232 | | 224 |
| | | | | | | | | | | | | |
| Realized Principal Investment Income/(Loss) | | (65) | | 1 | | (72) | | 12 | | (72) | | 21 |
| Principal Investment Income/(Loss) | | (52) | | 5 | | (48) | | 29 | | (52) | | 40 |
| | | | | | | | | | | | | |
| Fee Related Earnings (FRE) | | $16 | | $26 | | $17 | | $84 | | $30 | | $118 |
| | | | | | | | | | | | | |
| Distributable Earnings (DE) | | $(41) | | $66 | | $(26) | | $151 | | $(45) | | $202 |
| | | | | | | | | | | | | |
| Economic Income | | $8 | | $51 | | $118 | | $227 | | $190 | | $324 |
| | | | | | | | | | | | | |
Totals may not sum due to rounding.
| |
| • | Fee Related Earnings were $9 million in Q3 2018 compared to $77 million in Q3 2017, which included $74 million in net insurance recoveries. Fund Management Fees increased 27% year over year, partially offset by higher compensation expense related to the continuing build out of our credit platform. |
| |
| • | Distributable Earnings were $10 million in Q3 2018 and $58 million over the LTM, higher relative to a loss of $(64) million over the prior LTM, which included losses related to our former commodities and hedge fund businesses. |
| |
| • | Economic Income was $1 million in Q3 2018 and $22 million for the LTM, higher relative to a $(51) million Economic loss in the prior LTM. Global Credit carry funds appreciated 1% in the quarter and 10% over the LTM. |
| |
| • | Invested $0.1 billion in Global Credit carry funds in the quarter and $1.5 billion for the LTM. Direct Lending originated gross new loans of approximately $508 million in the quarter and approximately $2.1 billion for the LTM. We raised $1.2 billion of CLO par value of in the quarter and $4.8 billion for the LTM. |
| |
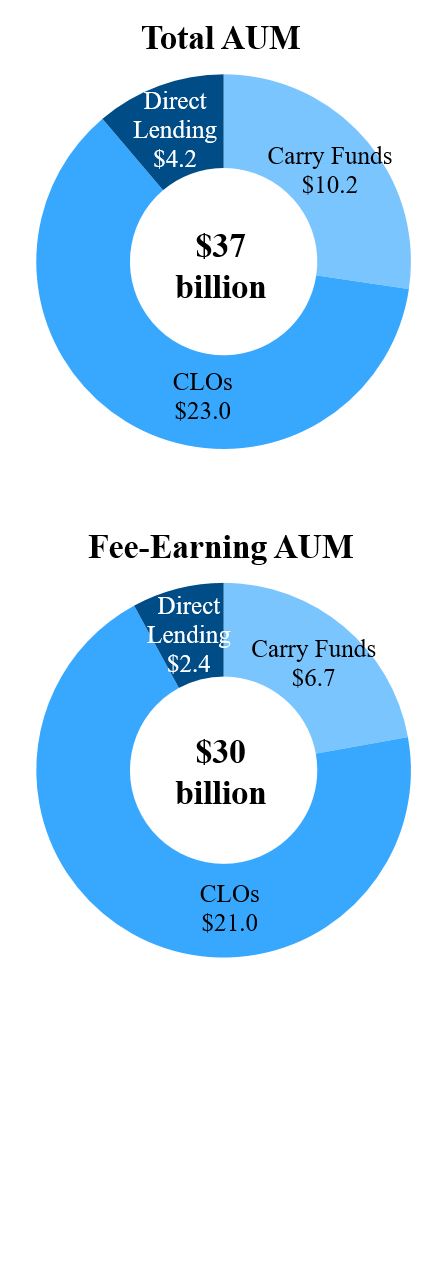
| • | Assets Under Management of $37.4 billion increased 17% compared to Q3 2017, largely driven by $6.5 billion of fundraising, partially offset by $0.9 billion in realized proceeds. Fundraising of $2.0 billion for Q3 2018 included two new CLOs and several CLO resets, as well as additional capital raised for our opportunistic fund, and several managed accounts. Fee Earning AUM of $30.1 billion increased 16% compared to Q3 2017. |
| |
| • | On October 15, 2018, Carlyle announced an agreement to acquire Apollo Aviation Group, a global commercial aviation investment and servicing firm with $5.6 billion in Assets Under Management. Apollo Aviation will operate as a new business line within Global Credit upon its closing, which is expected no later than January 31, 2019. |
|
| | | | | | | | | | | | |
| Business Drivers |
| | | | | | | | | | | | | |
| $ in billions, unless noted | | Q3 2017 | | Q3 2018 | | Prior
YTD | | YTD | | Prior LTM | | LTM |
| | | | | | | | | | | | | |
| Fundraising | | $1.8 | | $2.0 | | $4.9 | | $4.8 | | $6.2 | | $6.5 |
| | | | | | | | | | | | | |
| Invested Capital (carry funds) | | 0.7 | | 0.1 | | 1.3 | | 0.7 | | 1.6 | | 1.5 |
| | | | | | | | | | | | | |
| Realized Proceeds (carry funds) | | 0.2 | | 0.1 | | 0.4 | | 0.6 | | 0.4 | | 0.9 |
| | | | | | | | | | | | | |
| Carry Fund Appreciation | | 0% | | 1% | | 9% | | 7% | | 11% | | 10% |
| | | | | | | | | | | | | |
| Financial Metrics |
| | | | | | | | | | | | | |
| $ in millions | | Q3 2017 | | Q3 2018 | | Prior
YTD | | YTD | | Prior LTM | | LTM |
| | | | | | | | | | | | | |
| Fund Management Fees | | $48 | | $60 | | $141 | | $179 | | $189 | | $230 |
| | | | | | | | | | | | | |
| Realized Net Performance Revenues | | 8 | | — | | 20 | | 3 | | 25 | | 24 |
| Net Performance Revenues | | 10 | | — | | 28 | | 9 | | 32 | | 12 |
| | | | | | | | | | | | | |
| Realized Principal Investment Income | | 5 | | 2 | | 9 | | 7 | | 11 | | 10 |
| Principal Investment Income | | 5 | | 4 | | 13 | | 9 | | 16 | | 13 |
| | | | | | | | | | | | | |
| Fee Related Earnings (FRE) | | $77 | | $9 | | $81 | | $30 | | $(93) | | $31 |
| | | | | | | | | | | | | |
| Distributable Earnings (DE) | | $88 | | $10 | | $104 | | $35 | | $(64) | | $58 |
| | | | | | | | | | | | | |
| Economic Income | | $88 | | $1 | | $104 | | $20 | | $(51) | | $22 |
| | | | | | | | | | | | | |
Totals may not sum due to rounding.
| |
| • | Fee Related Earnings were $9 million in Q3 2018 and $36 million over the LTM, an increase of 33% over the prior LTM. |
| |
| • | Distributable Earnings were $13 million in Q3 2018 and $40 million for the LTM, an increase of 63% over the prior LTM generally attributable to higher Fee Related Earnings and Realized Net Performance Revenues. |
| |
| • | Investment Solutions carry funds appreciated 5% in the quarter and 20% over the LTM, both including the impact of foreign exchange translation. |
| |
| • | Economic Income was $11 million in Q3 2018 and $63 million for the LTM, 24% higher than the prior LTM. Net Performance Revenues were $7 million in Q3 2018, and $39 million over the LTM, nearly double the prior LTM. Net Accrued Performance Revenue of $93 million increased 48% compared to Q3 2017 due to strong underlying fund performance, as well as an increasing share of AlpInvest performance revenues that are now accruing to our benefit. |
| |
| • | Invested $1.3 billion in Investment Solutions carry funds during Q3 2018, and $4.3 billion over the LTM, roughly in line with the $4.2 billion invested over the prior LTM period. |
| |
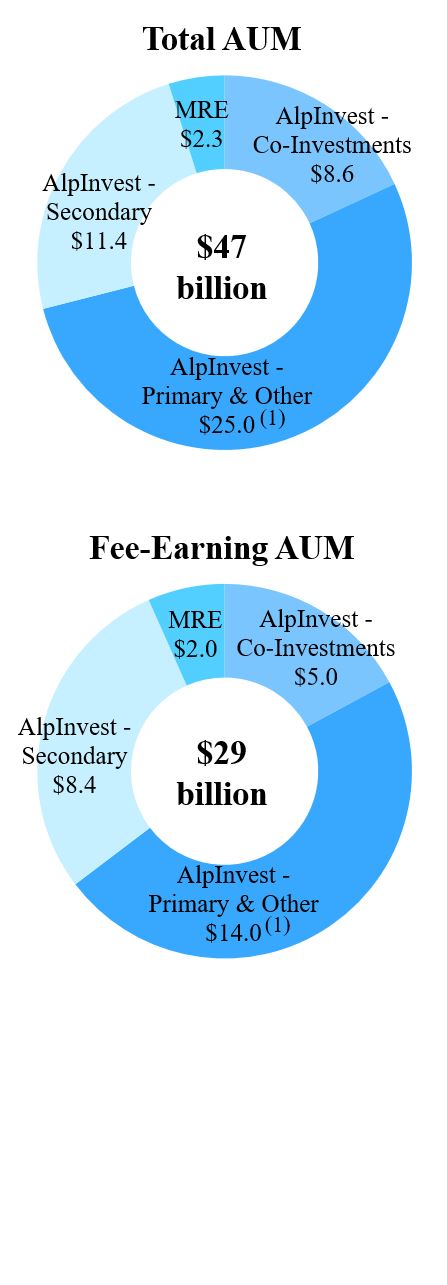
| • | Assets Under Management of $47.3 billion increased 1% compared to Q3 2017, attributable to $4.3 billion in fundraising and $7.4 billion in market appreciation, and generally offset by $10.1 billion in realized proceeds. Fundraising of $1.2 billion for Q3 2018 included closings in managed accounts and new commitments to Metropolitan Real Estate's secondary fund and co-investment vehicles. Fee-Earning AUM of $29.5 billion declined (3)% compared to Q3 2017. |
|
| | | | | | | | | | | | |
| Business Drivers |
| | | | | | | | | | | | | |
| $ in billions, unless noted | | Q3 2017 | | Q3 2018 | | Prior
YTD | | YTD | | Prior LTM | | LTM |
| | | | | | | | | | | | | |
| Fundraising (excluding acquisitions) | | $2.1 | | $1.2 | | $5.2 | | $3.5 | | $6.3 | | $4.3 |
| | | | | | | | | | | | | |
| Invested Capital (carry funds) | | 1.3 | | 1.3 | | 3.2 | | 3.1 | | 4.2 | | 4.3 |
| | | | | | | | | | | | | |
| Realized Proceeds (carry funds) | | 2.5 | | 3.1 | | 6.7 | | 7.2 | | 9.5 | | 10.1 |
| | | | | | | | | | | | | |
| Carry Fund Appreciation | | 3% | | 5% | | 6% | | 17% | | 14% | | 20% |
| | | | | | | | | | | | | |
| Financial Metrics |
| | | | | | | | | | | | | |
| $ in millions | | Q3 2017 | | Q3 2018 | | Prior
YTD | | YTD | | Prior LTM | | LTM |
| | | | | | | | | | | | | |
| Fund Management Fees | | $41 | | $43 | | $113 | | $125 | | $150 | | $166 |
| | | | | | | | | | | | | |
| Realized Net Performance Revenues | | — | | 4 | | 1 | | 6 | | 2 | | 8 |
| Net Performance Revenues | | 7 | | 7 | | 15 | | 29 | | 20 | | 39 |
| | | | | | | | | | | | | |
| Realized Principal Investment Income/(Loss) | | — | | — | | — | | — | | — | | — |
| Principal Investment Income | | 2 | | 1 | | 3 | | 4 | | 4 | | 5 |
| | | | | | | | | | | | | |
| Fee Related Earnings (FRE) | | $7 | | $9 | | $23 | | $27 | | $27 | | $36 |
| | | | | | | | | | | | | |
| Distributable Earnings (DE) | | $6 | | $13 | | $20 | | $30 | | $25 | | $40 |
| | | | | | | | | | | | | |
| Economic Income | | $15 | | $11 | | $33 | | $45 | | $51 | | $63 |
| | | | | | | | | | | | | |
Totals may not sum due to rounding. See Notes at end of document.
|
|
Fund Activity Metrics ($ billions) |
|
| | |
| By Quarter | | By Sub-segment |
|
|
Invested Capital (Carry Funds only) |
|
|
| Realized Proceeds (Carry Funds only) |
Totals may not sum due to rounding.
|
|
| Total Assets Under Management |
Assets Under Management of $212.3 billion in Q3 2018 increased 22% compared to $174.4 billion in Q3 2017. Remaining fair value was $73.3 billion as of Q3 2018 in our Corporate Private Equity, Real Assets and Global Credit carry funds, an increase of 11% compared to Q3 2017.
|
| | | | | | | | | |
| | | | vs. Last Quarter | | vs. One Year Ago |
| $ in billions, unless noted | Q3 2018 | | Q2 2018 | | % Change | | Q3 2017 | | % Change |
| | | | | | | | | | |
| Corporate Private Equity | 81.6 | | 81.2 | | 0% | | 55.7 | | 46% |
| Real Assets | 46.0 | | 45.4 | | 1% | | 39.8 | | 16% |
| Global Credit | 37.4 | | 35.5 | | 5% | | 31.9 | | 17% |
| Investment Solutions | 47.3 | | 47.6 | | (1)% | | 47.0 | | 1% |
| Total | 212.3 | | 209.7 | | 1% | | 174.4 | | 22% |
| | | | | | | | | | |
Data as of September 30, 2018. Totals may not sum due to rounding. See Notes and definitions of AUM roll forward components at end of document.
|
|
| Fee-Earning Assets Under Management |
Fee-Earning Assets Under Management of $147.4 billion increased 21% from Q3 2017, primarily driven by the activation of management fees in our latest generation U.S. and Asia Buyout funds. Pending Fee-Earning AUM was $11.4 billion as of Q3 2018, up from $10.1 billion as of Q2 2018.
|
| | | | | | | | | |
| | | | vs. Last Quarter | | vs. One Year Ago |
| $ in billions, unless noted | Q3 2018 | | Q2 2018 | | % Change | | Q3 2017 | | % Change |
| | | | | | | | | | |
| Corporate Private Equity | 56.3 | | 56.3 | | 0% | | 35.6 | | 58% |
| Real Assets | 31.6 | | 31.5 | | 0% | | 29.8 | | 6% |
| Global Credit | 30.1 | | 28.8 | | 4% | | 26.0 | | 16% |
| Investment Solutions | 29.5 | | 29.8 | | (1)% | | 30.3 | | (3)% |
| Total | 147.4 | | 146.5 | | 1% | | 121.8 | | 21% |
| | | | | | | | | | |
Note: As of September 30, 2018. Totals may not sum due to rounding.
The amounts presented below exclude the effect of U.S. GAAP consolidation eliminations on investments and accrued performance revenues, as well as cash and debt associated with Carlyle’s consolidated funds. All data is as of September 30, 2018.
| |
| • | Cash and Cash Equivalents and Corporate Treasury Investments(1) of $1.5 billion. |
| |
| • | On-balance sheet investments attributable to unitholders of $1.1 billion(2), excluding the equity investment by Carlyle in NGP Energy Capital Management. |
| |
| • | Net accrued performance revenues attributable to unitholders of $1.9 billion. These performance revenues are comprised of $4.2 billion of gross accrued performance revenues, less $0.1 billion in accrued giveback obligation and $2.2 billion in accrued performance allocations and incentive fee compensation and non-controlling interests. |
| |
| • | Debt obligations, consisting of loans, senior notes, and promissory notes totaling $1.2 billion, exclusive of $0.3 billion of loans used to finance our investments in CLOs. In September 2018, Carlyle issued $350 million of 5.650% senior notes due in September 2048 and used the net proceeds from that issuance to repurchase $250 million of the $500 million outstanding 3.875% senior notes due in February 2023 and prepay a $109 million promissory note due in January 2022. |
| |
| • | 5.875% Series A Preferred Units totaling $387.5 million. |
During Q3 2018, Carlyle repurchased and retired approximately 1.5 million units for an aggregate purchase price of $36 million as part of its unit repurchase program. Year-to-date through September 30, 2018, Carlyle has repurchased and retired 3.9 million units for an aggregate purchase price of $87 million. As of September 30, 2018, we had $53 million remaining in our current $200 million repurchase authorization.
See Notes at end of document.
The Board of Directors has declared a quarterly distribution of $0.42 per common unit to holders of record at the close of business on November 13, 2018, payable on November 20, 2018.
The Board of Directors has declared a quarterly distribution of $0.367188 per preferred unit to preferred unitholders of record at the close of business on December 1, 2018, payable on December 17, 2018.
Conference Call
Carlyle will host a conference call at 8:30 a.m. EDT on Wednesday, October 31, 2018, to announce its third quarter 2018 financial results. The call may be accessed by dialing +1 (800) 850-2903 (U.S.) or +1 (253) 237-1169 (international) and referencing “The Carlyle Group Financial Results Call.” The conference call will be webcast simultaneously via a link on Carlyle’s investor relations website at ir.carlyle.com and an archived replay of the webcast also will be available on the website soon after the live call.
About The Carlyle Group
The Carlyle Group (NASDAQ: CG) is a global alternative asset manager with $212 billion of assets under management across 339 investment vehicles as of September 30, 2018. Carlyle’s purpose is to invest wisely and create value on behalf of its investors, many of whom are public pensions. Carlyle invests across four segments – Corporate Private Equity, Real Assets, Global Credit and Investment Solutions – in Africa, Asia, Australia, Europe, the Middle East, North America and South America. Carlyle has expertise in various industries, including: aerospace, defense & government services, consumer & retail, energy, financial services, healthcare, industrial, real estate, technology & business services, telecommunications & media and transportation. The Carlyle Group employs more than 1,625 people in 31 offices across six continents.
Web: www.carlyle.com
Videos: www.youtube.com/onecarlyle
Tweets: www.twitter.com/onecarlyle
Podcasts: www.carlyle.com/about-carlyle/market-commentary
Contacts:
Public Market Investor Relations Media
Daniel Harris Christopher Ullman
Phone: +1 (212) 813-4527 Phone: +1 (202) 729-5450
daniel.harris@carlyle.com christopher.ullman@carlyle.com
Forward Looking Statements
This press release may contain forward-looking statements within the meaning of Section 27A of the Securities Act of 1933 and Section 21E of the Securities Exchange Act of 1934. These statements include, but are not limited to, statements related to our expectations regarding the performance of our business, our financial results, our liquidity and capital resources, contingencies, our distribution policy, and other non-historical statements. You can identify these forward-looking statements by the use of words such as “outlook,” “believes,” “expects,” “potential,” “continues,” “may,” “will,” “should,” “seeks,” “approximately,” “predicts,” “intends,” “plans,” “estimates,” “anticipates” or the negative version of these words or other comparable words. Such forward-looking statements are subject to various risks, uncertainties and assumptions. Accordingly, there are or will be important factors that could cause actual outcomes or results to differ materially from those indicated in these statements including, but not limited to, those described under the section entitled “Risk Factors” in our Annual Report on Form 10-K for the year ended December 31, 2017 filed with the SEC on February 15, 2018, as such factors may be updated from time to time in our periodic filings with the SEC, which are accessible on the SEC’s website at www.sec.gov. These factors should not be construed as exhaustive and should be read in conjunction with the other cautionary statements that are included in this release and in our filings with the SEC. We undertake no obligation to publicly update or review any forward-looking statements, whether as a result of new information, future developments or otherwise, except as required by applicable law.
This release does not constitute an offer for any Carlyle fund.
APPENDIX
The Carlyle Group L.P.
GAAP Statement of Operations (Unaudited)
|
| | | | | | | | | | | | | | | | |
| | | Three Months Ended | | Nine Months Ended |
| | | Sep 30,
2017 | | Sep 30,
2018 | | Sep 30,
2017 | | Sep 30,
2018 |
| | | (As Adjusted) | | | (As Adjusted) | |
| | | (Dollars in millions, except unit and per unit data) |
| Revenues | | | | | | | | |
| Fund management fees | | $ | 262.5 |
| | $ | 328.8 |
| | $ | 747.6 |
| | $ | 894.6 |
|
| Incentive fees | | 10.4 |
| | 6.8 |
| | 27.1 |
| | 20.5 |
|
| Investment income | | | | | | | | |
| Performance allocations | | | | | | | | |
| Realized | | 401.4 |
| | 266.6 |
| | 825.6 |
| | 584.6 |
|
| Unrealized | | (126.2 | ) | | (52.4 | ) | | 658.1 |
| | 362.8 |
|
| Principal investment income (loss) | | | | | | | | |
| Realized | | 15.5 |
| | 30.7 |
| | 42.0 |
| | 94.5 |
|
| Unrealized | | 21.7 |
| | 13.7 |
| | 100.5 |
| | 82.2 |
|
| Total investment income | | 312.4 |
| | 258.6 |
| | 1,626.2 |
| | 1,124.1 |
|
| Interest and other income | | 9.9 |
| | 24.4 |
| | 25.9 |
| | 74.9 |
|
| Interest and other income of Consolidated Funds | | 44.7 |
| | 60.5 |
| | 132.6 |
| | 161.4 |
|
| Revenue of a real estate VIE | | — |
| | — |
| | 109.0 |
| | — |
|
| Total revenues | | 639.9 |
| | 679.1 |
| | 2,668.4 |
| | 2,275.5 |
|
| | | | | | | | | |
| Expenses | | | | | | | | |
| Compensation and benefits | | | | | | | | |
| Cash-based compensation and benefits | | 174.1 |
| | 186.6 |
| | 471.1 |
| | 549.9 |
|
| Equity-based compensation | | 81.0 |
| | 49.7 |
| | 241.8 |
| | 199.5 |
|
| Performance allocations and incentive fee related compensation | | | | | | | | |
| Realized | | 189.4 |
| | 134.5 |
| | 401.9 |
| | 294.6 |
|
| Unrealized | | (51.8 | ) | | 11.5 |
| | 309.9 |
| | 231.4 |
|
| Total compensation and benefits | | 392.7 |
| | 382.3 |
| | 1,424.7 |
| | 1,275.4 |
|
| General, administrative and other expenses | | (18.7 | ) | | 166.2 |
| | 170.9 |
| | 388.0 |
|
| Interest | | 16.9 |
| | 26.3 |
| | 48.4 |
| | 62.6 |
|
| Interest and other expenses of Consolidated Funds | | 37.2 |
| | 40.5 |
| | 160.9 |
| | 121.7 |
|
| Interest and other expenses of a real estate VIE | | 64.5 |
| | — |
| | 202.5 |
| | — |
|
| Other non-operating expense | | — |
| | 0.3 |
| | 0.1 |
| | 0.9 |
|
| Total expenses | | 492.6 |
| | 615.6 |
| | 2,007.5 |
| | 1,848.6 |
|
| | | | | | | | | |
| Other income | | | | | | | | |
| Net investment gains (losses) of Consolidated Funds | | 18.6 |
| | (2.9 | ) | | 76.4 |
| | 12.0 |
|
| | | | | | | | | |
| Income before provision for income taxes | | 165.9 |
| | 60.6 |
| | 737.3 |
| | 438.9 |
|
| Provision for income taxes | | (1.3 | ) | | 17.4 |
| | 17.7 |
| | 36.8 |
|
| Net income | | 167.2 |
| | 43.2 |
| | 719.6 |
| | 402.1 |
|
| Net income attributable to non-controlling interests in consolidated entities | | 27.6 |
| | 14.5 |
| | 47.4 |
| | 42.2 |
|
| Net income attributable to Carlyle Holdings | | 139.6 |
| | 28.7 |
| | 672.2 |
| | 359.9 |
|
| Net income attributable to non-controlling interests in Carlyle Holdings | | 95.0 |
| | 11.2 |
| | 487.0 |
| | 233.3 |
|
| Net income attributable to The Carlyle Group L.P. | | 44.6 |
| | 17.5 |
| | 185.2 |
| | 126.6 |
|
| Net income attributable to Series A Preferred Unitholders | | — |
| | 5.9 |
| | — |
| | 17.7 |
|
| Net income attributable to The Carlyle Group L.P. Common Unitholders | | $ | 44.6 |
| | $ | 11.6 |
| | $ | 185.2 |
| | $ | 108.9 |
|
| | | | | | | | | |
| Net income attributable to The Carlyle Group L.P. per common unit | | | | | | | | |
| Basic | | $ | 0.47 |
| | $ | 0.11 |
| | $ | 2.06 |
| | $ | 1.06 |
|
| Diluted | | $ | 0.43 |
| | $ | 0.10 |
| | $ | 1.90 |
| | $ | 0.96 |
|
| | | | | | | | | |
| Weighted-average common units | | | | | | | | |
| Basic | | 95,198,102 |
| | 105,560,193 |
| | 89,815,112 |
| | 102,936,949 |
|
| Diluted | | 334,392,424 |
| | 346,930,017 |
| | 97,538,190 |
| | 112,851,327 |
|
Total Segment Information (Unaudited)
The following table sets forth information in the format used by management when making resource deployment decisions and in assessing the performance of our segments. The information below is the aggregate results of our four segments.
|
| | | | | | | | | | | | | | | | | | | | |
| | | Three Months Ended | | Twelve Months Ended |
| Total Segment Revenues | | Sep 30, 2017 | | Jun 30, 2018 | | Sep 30, 2018 | | Sep 30, 2017 | | Sep 30, 2018 |
| | | (Dollars in millions) |
| Segment fee revenues | | | | | | | | | | |
| Fund management fees | | $ | 278.4 |
| | $ | 328.1 |
| | $ | 355.2 |
| | $ | 1,057.0 |
| | $ | 1,260.6 |
|
| Portfolio advisory fees, net | | 4.1 |
| | 3.2 |
| | 7.7 |
| | 16.8 |
| | 18.2 |
|
| Transaction fees, net | | 6.1 |
| | 3.8 |
| | — |
| | 21.9 |
| | 18.7 |
|
| Total segment fee revenues | | 288.6 |
| | 335.1 |
| | 362.9 |
| | 1,095.7 |
| | 1,297.5 |
|
| Performance revenues | | | | | | | | | | |
| Realized | | 411.0 |
| | 99.5 |
| | 260.2 |
| | 1,143.3 |
| | 809.3 |
|
| Unrealized | | (125.6 | ) | | 370.0 |
| | (35.3 | ) | | 554.5 |
| | 818.0 |
|
| Total performance revenues | | 285.4 |
| | 469.5 |
| | 224.9 |
| | 1,697.8 |
| | 1,627.3 |
|
| Principal investment income | | | | | | | | | | |
| Realized | | (53.4 | ) | | 17.7 |
| | 7.0 |
| | (31.2 | ) | | 65.8 |
|
| Unrealized | | 18.1 |
| | 7.6 |
| | 6.9 |
| | 52.2 |
| | 43.7 |
|
| Total principal investment income | | (35.3 | ) | | 25.3 |
| | 13.9 |
| | 21.0 |
| | 109.5 |
|
| Interest income | | 5.4 |
| | 7.9 |
| | 9.1 |
| | 13.4 |
| | 29.2 |
|
| Other income | | 3.4 |
| | 2.4 |
| | 2.1 |
| | 15.3 |
| | 14.6 |
|
| Total Segment Revenues | | $ | 547.5 |
| | $ | 840.2 |
| | $ | 612.9 |
| | $ | 2,843.2 |
| | $ | 3,078.1 |
|
| | | | | | | | | | | |
| | | Three Months Ended | | Twelve Months Ended |
| Total Segment Expenses | | Sep 30, 2017 | | Jun 30, 2018 | | Sep 30, 2018 | | Sep 30, 2017 | | Sep 30, 2018 |
| | | (Dollars in millions) |
| Compensation and benefits | | | | | | | | | | |
| Cash-based compensation and benefits | | $ | 177.3 |
| | $ | 172.3 |
| | $ | 186.4 |
| | $ | 626.4 |
| | $ | 728.2 |
|
| Equity-based compensation | | 30.4 |
| | 50.0 |
| | 51.7 |
| | 121.6 |
| | 166.1 |
|
| Performance revenues related compensation | | | | | | | | | | |
| Realized | | 194.1 |
| | 49.9 |
| | 136.3 |
| | 573.4 |
| | 414.4 |
|
| Unrealized | | (55.7 | ) | | 170.0 |
| | 19.3 |
| | 223.2 |
| | 396.7 |
|
| Total compensation and benefits | | 346.1 |
| | 442.2 |
| | 393.7 |
| | 1,544.6 |
| | 1,705.4 |
|
| General, administrative and other indirect expenses | | (26.5 | ) | | 98.9 |
| | 80.9 |
| | 296.3 |
| | 349.0 |
|
| Depreciation and amortization expense | | 8.2 |
| | 8.5 |
| | 8.7 |
| | 30.4 |
| | 33.2 |
|
| Interest expense | | 17.0 |
| | 18.5 |
| | 19.0 |
| | 63.4 |
| | 72.4 |
|
| Total Segment Expenses | | $ | 344.8 |
| | $ | 568.1 |
| | $ | 502.3 |
| | $ | 1,934.7 |
| | $ | 2,160.0 |
|
| | | | | | | | | | | |
| | | Three Months Ended | | Twelve Months Ended |
| Total Segments | | Sep 30, 2017 | | Jun 30, 2018 | | Sep 30, 2018 | | Sep 30, 2017 | | Sep 30, 2018 |
| | | (Dollars in millions) |
| Total Segment Revenues | | $ | 547.5 |
| | $ | 840.2 |
| | $ | 612.9 |
| | $ | 2,843.2 |
| | $ | 3,078.1 |
|
| Total Segment Expenses | | 344.8 |
| | 568.1 |
| | 502.3 |
| | 1,934.7 |
| | 2,160.0 |
|
| Economic Income | | $ | 202.7 |
| | $ | 272.1 |
| | $ | 110.6 |
| | $ | 908.5 |
| | $ | 918.1 |
|
| (-) Net Performance Revenues | | 147.0 |
| | 249.6 |
| | 69.3 |
| | 901.2 |
| | 816.2 |
|
| (-) Principal Investment Income | | (35.3 | ) | | 25.3 |
| | 13.9 |
| | 21.0 |
| | 109.5 |
|
| (+) Equity-based compensation | | 30.4 |
| | 50.0 |
| | 51.7 |
| | 121.6 |
| | 166.1 |
|
| (+) Net interest | | 11.6 |
| | 10.6 |
| | 9.9 |
| | 50.0 |
| | 43.2 |
|
| (+) Reserve for Litigation and Contingencies | | (25.0 | ) | | — |
| | — |
| | (125.0 | ) | | — |
|
| (=) Fee Related Earnings | | $ | 108.0 |
| | $ | 57.8 |
| | $ | 89.0 |
| | $ | 32.9 |
| | $ | 201.7 |
|
| (+) Realized Net Performance Revenues | | 216.9 |
| | 49.6 |
| | 123.9 |
| | 569.9 |
| | 394.9 |
|
| (+) Realized Principal Investment Income | | (53.4 | ) | | 17.7 |
| | 7.0 |
| | (31.2 | ) | | 65.8 |
|
| (+) Net interest | | (11.6 | ) | | (10.6 | ) | | (9.9 | ) | | (50.0 | ) | | (43.2 | ) |
| (=) Distributable Earnings | | $ | 259.9 |
| | $ | 114.5 |
| | $ | 210.0 |
| | $ | 521.6 |
| | $ | 619.2 |
|
Total Segment Information (Unaudited), cont.
|
| | | | | | | | | | | | | | | | | | | | |
| | | Three Months Ended |
| | | | | | | | | | | |
| Total Segment Revenues | | Sep 30,
2017 | | Dec 31,
2017 | | Mar 31,
2018 | | Jun 30,
2018 | | Sep 30,
2018 |
| | | (Dollars in millions) |
| Segment fee revenues | | | | | | | | | | |
| Fund management fees | | $ | 278.4 |
| | $ | 289.8 |
| | $ | 287.5 |
| | $ | 328.1 |
| | $ | 355.2 |
|
| Portfolio advisory fees, net | | 4.1 |
| | 3.7 |
| | 3.6 |
| | 3.2 |
| | 7.7 |
|
| Transaction fees, net | | 6.1 |
| | 11.9 |
| | 3.0 |
| | 3.8 |
| | — |
|
| Total segment fee revenues | | 288.6 |
| | 305.4 |
| | 294.1 |
| | 335.1 |
| | 362.9 |
|
| Performance revenues | | | | | | | | | | |
| Realized | | 411.0 |
| | 238.6 |
| | 211.0 |
| | 99.5 |
| | 260.2 |
|
| Unrealized | | (125.6 | ) | | 376.9 |
| | 106.4 |
| | 370.0 |
| | (35.3 | ) |
| Total performance revenues | | 285.4 |
| | 615.5 |
| | 317.4 |
| | 469.5 |
| | 224.9 |
|
| Principal investment income/(loss) | | | | | | | | | | |
| Realized | | (53.4 | ) | | 22.4 |
| | 18.7 |
| | 17.7 |
| | 7.0 |
|
| Unrealized | | 18.1 |
| | 18.3 |
| | 10.9 |
| | 7.6 |
| | 6.9 |
|
| Total principal investment income/(loss) | | (35.3 | ) | | 40.7 |
| | 29.6 |
| | 25.3 |
| | 13.9 |
|
| Interest income | | 5.4 |
| | 5.5 |
| | 6.7 |
| | 7.9 |
| | 9.1 |
|
| Other income | | 3.4 |
| | 4.0 |
| | 6.1 |
| | 2.4 |
| | 2.1 |
|
| Total Segment Revenues | | $ | 547.5 |
| | $ | 971.1 |
| | $ | 653.9 |
| | $ | 840.2 |
| | $ | 612.9 |
|
| | | | | | | | | | | |
| | | Three Months Ended |
| Total Segment Expenses | | Sep 30,
2017 | | Dec 31,
2017 | | Mar 31,
2018 | | Jun 30,
2018 | | Sep 30,
2018 |
| | | (Dollars in millions) |
| Compensation and benefits | | | | | | | | | | |
| Cash-based compensation and benefits | | $ | 177.3 |
| | $ | 180.4 |
| | $ | 189.1 |
| | $ | 172.3 |
| | $ | 186.4 |
|
| Equity-based compensation | | 30.4 |
| | 26.7 |
| | 37.7 |
| | 50.0 |
| | 51.7 |
|
| Performance revenues related compensation | | | | | | | | | | |
| Realized | | 194.1 |
| | 120.3 |
| | 107.9 |
| | 49.9 |
| | 136.3 |
|
| Unrealized | | (55.7 | ) | | 157.9 |
| | 49.5 |
| | 170.0 |
| | 19.3 |
|
| Total compensation and benefits | | 346.1 |
| | 485.3 |
| | 384.2 |
| | 442.2 |
| | 393.7 |
|
| General, administrative and other indirect expenses | | (26.5 | ) | | 94.4 |
| | 74.8 |
| | 98.9 |
| | 80.9 |
|
| Depreciation and amortization expense | | 8.2 |
| | 7.9 |
| | 8.1 |
| | 8.5 |
| | 8.7 |
|
| Interest expense | | 17.0 |
| | 17.1 |
| | 17.8 |
| | 18.5 |
| | 19.0 |
|
| Total Segment Expenses | | $ | 344.8 |
| | $ | 604.7 |
| | $ | 484.9 |
| | $ | 568.1 |
| | $ | 502.3 |
|
| | | | | | | | | | | |
| | | Three Months Ended |
| | | | | | | | | | | |
| Total Segments | | Sep 30,
2017 | | Dec 31,
2017 | | Mar 31,
2018 | | Jun 30,
2018 | | Sep 30,
2018 |
| | | (Dollars in millions) |
| Total Segment Revenues | | $ | 547.5 |
| | $ | 971.1 |
| | $ | 653.9 |
| | $ | 840.2 |
| | $ | 612.9 |
|
| Total Segment Expenses | | 344.8 |
| | 604.7 |
| | 484.9 |
| | 568.1 |
| | 502.3 |
|
| Economic Income | | $ | 202.7 |
| | $ | 366.4 |
| | $ | 169.0 |
| | $ | 272.1 |
| | $ | 110.6 |
|
| (-) Net Performance Revenues | | 147.0 |
| | 337.3 |
| | 160.0 |
| | 249.6 |
| | 69.3 |
|
| (-) Principal Investment Income/(Loss) | | (35.3 | ) | | 40.7 |
| | 29.6 |
| | 25.3 |
| | 13.9 |
|
| (+) Equity-based compensation | | 30.4 |
| | 26.7 |
| | 37.7 |
| | 50.0 |
| | 51.7 |
|
| (+) Net interest | | 11.6 |
| | 11.6 |
| | 11.1 |
| | 10.6 |
| | 9.9 |
|
| (+) Reserve for Litigation and Contingencies | | (25.0 | ) | | — |
| | — |
| | — |
| | — |
|
| (=) Fee Related Earnings | | $ | 108.0 |
| | $ | 26.7 |
| | $ | 28.2 |
| | $ | 57.8 |
| | $ | 89.0 |
|
| (+) Realized Net Performance Revenues | | 216.9 |
| | 118.3 |
| | 103.1 |
| | 49.6 |
| | 123.9 |
|
| (+) Realized Principal Investment Income/(Loss) | | (53.4 | ) | | 22.4 |
| | 18.7 |
| | 17.7 |
| | 7.0 |
|
| (+) Net interest | | (11.6 | ) | | (11.6 | ) | | (11.1 | ) | | (10.6 | ) | | (9.9 | ) |
| (=) Distributable Earnings | | $ | 259.9 |
| | $ | 155.8 |
| | $ | 138.9 |
| | $ | 114.5 |
| | $ | 210.0 |
|
Corporate Private Equity Segment Results (Unaudited)
|
| | | | | | | | | | | | | | | | | | | | | | | | | | | | |
| | | Three Months Ended | | Twelve Months Ended |
| | | | | | | | | | | | | |
| Corporate Private Equity | | Sep 30, 2017 | | Dec 31, 2017 | | Mar 31, 2018 | | Jun 30, 2018 | | Sep 30, 2018 | | Sep 30,
2017 | | Sep 30,
2018 |
| | | (Dollars in millions) | | |
| | | | | | | | | | | | | | | |
| Revenues | | | | | | | | | | | | | | |
| Segment fee revenues | | | | | | | | | | | | | | |
| Fund management fees | | $ | 118.3 |
| | $ | 119.3 |
| | $ | 114.1 |
| | $ | 148.0 |
| | $ | 175.8 |
| | $ | 473.7 |
| | $ | 557.2 |
|
| Portfolio advisory fees, net | | 3.6 |
| | 3.3 |
| | 3.2 |
| | 2.8 |
| | 7.0 |
| | 15.2 |
| | 16.3 |
|
| Transaction fees, net | | 5.3 |
| | 8.2 |
| | 0.3 |
| | 3.6 |
| | — |
| | 21.1 |
| | 12.1 |
|
| Total segment fee revenues | | 127.2 |
| | 130.8 |
| | 117.6 |
| | 154.4 |
| | 182.8 |
| | 510.0 |
| | 585.6 |
|
| Performance revenues | | | | | | | | | | | | | | |
| Realized | | 345.4 |
| | 162.7 |
| | 188.0 |
| | 52.0 |
| | 143.6 |
| | 954.1 |
| | 546.3 |
|
| Unrealized | | (193.2 | ) | | 316.6 |
| | 64.6 |
| | 163.8 |
| | (91.7 | ) | | 183.7 |
| | 453.3 |
|
| Total performance revenues | | 152.2 |
| | 479.3 |
| | 252.6 |
| | 215.8 |
| | 51.9 |
| | 1,137.8 |
| | 999.6 |
|
| Principal investment income/(loss) | | | | | | | | | | | | | | |
| Realized | | 6.5 |
| | 9.8 |
| | 7.9 |
| | 12.3 |
| | 4.2 |
| | 29.3 |
| | 34.2 |
|
| Unrealized | | 4.1 |
| | 14.1 |
| | 7.0 |
| | (4.9 | ) | | 0.2 |
| | 24.6 |
| | 16.4 |
|
| Total principal investment income | | 10.6 |
| | 23.9 |
| | 14.9 |
| | 7.4 |
| | 4.4 |
| | 53.9 |
| | 50.6 |
|
| Interest income | | 1.8 |
| | 1.8 |
| | 2.0 |
| | 2.5 |
| | 3.0 |
| | 4.4 |
| | 9.3 |
|
| Other income | | 1.6 |
| | 1.8 |
| | 3.1 |
| | 0.6 |
| | 0.6 |
| | 6.2 |
| | 6.1 |
|
| Total revenues | | 293.4 |
| | 637.6 |
| | 390.2 |
| | 380.7 |
| | 242.7 |
| | 1,712.3 |
| | 1,651.2 |
|
| | | | | | | | | | | | | | | |
| Expenses | | | | | | | | | | | | | | |
| Compensation and benefits | | | | | | | | | | | | | | |
| Cash-based compensation and benefits | | 83.6 |
| | 110.3 |
| | 97.2 |
| | 90.5 |
| | 93.9 |
| | 298.6 |
| | 391.9 |
|
| Equity-based compensation | | 14.5 |
| | 13.2 |
| | 18.7 |
| | 23.0 |
| | 25.2 |
| | 60.6 |
| | 80.1 |
|
| Performance revenues related compensation | | | | | | | | | | | | | | |
| Realized | | 147.7 |
| | 77.5 |
| | 90.7 |
| | 24.0 |
| | 66.1 |
| | 422.1 |
| | 258.3 |
|
| Unrealized | | (76.1 | ) | | 141.5 |
| | 26.1 |
| | 75.0 |
| | (42.1 | ) | | 98.4 |
| | 200.5 |
|
| Total compensation and benefits | | 169.7 |
| | 342.5 |
| | 232.7 |
| | 212.5 |
| | 143.1 |
| | 879.7 |
| | 930.8 |
|
| General, administrative and other indirect expenses | | 20.5 |
| | 35.9 |
| | 32.9 |
| | 56.5 |
| | 41.1 |
| | 71.5 |
| | 166.4 |
|
| Depreciation and amortization expense | | 4.1 |
| | 3.8 |
| | 4.0 |
| | 4.2 |
| | 4.3 |
| | 14.9 |
| | 16.3 |
|
| Interest expense | | 7.0 |
| | 6.8 |
| | 7.0 |
| | 7.1 |
| | 7.5 |
| | 28.1 |
| | 28.4 |
|
| Total expenses | | 201.3 |
| | 389.0 |
| | 276.6 |
| | 280.3 |
| | 196.0 |
| | 994.2 |
| | 1,141.9 |
|
| | | | | | | | | | | | | | | |
| Economic Income | | $ | 92.1 |
| | $ | 248.6 |
| | $ | 113.6 |
| | $ | 100.4 |
| | $ | 46.7 |
| | $ | 718.1 |
| | $ | 509.3 |
|
| (-) Net Performance Revenues | | 80.6 |
| | 260.3 |
| | 135.8 |
| | 116.8 |
| | 27.9 |
| | 617.3 |
| | 540.8 |
|
| (-) Principal Investment Income | | 10.6 |
| | 23.9 |
| | 14.9 |
| | 7.4 |
| | 4.4 |
| | 53.9 |
| | 50.6 |
|
| (+) Equity-based compensation | | 14.5 |
| | 13.2 |
| | 18.7 |
| | 23.0 |
| | 25.2 |
| | 60.6 |
| | 80.1 |
|
| (+) Net interest | | 5.2 |
| | 5.0 |
| | 5.0 |
| | 4.6 |
| | 4.5 |
| | 23.7 |
| | 19.1 |
|
| (+) Reserve for Litigation and Contingencies | | (12.5 | ) | | — |
| | — |
| | — |
| | — |
| | (62.3 | ) | | — |
|
| (=) Fee Related Earnings | | $ | 8.1 |
| | $ | (17.4 | ) | | $ | (13.4 | ) | | $ | 3.8 |
| | $ | 44.1 |
| | $ | 68.9 |
| | $ | 17.1 |
|
| (+) Realized Net Performance Revenues | | 197.7 |
| | 85.2 |
| | 97.3 |
| | 28.0 |
| | 77.5 |
| | 532.0 |
| | 288.0 |
|
| (+) Realized Principal Investment Income | | 6.5 |
| | 9.8 |
| | 7.9 |
| | 12.3 |
| | 4.2 |
| | 29.3 |
| | 34.2 |
|
| (+) Net interest | | (5.2 | ) | | (5.0 | ) | | (5.0 | ) | | (4.6 | ) | | (4.5 | ) | | (23.7 | ) | | (19.1 | ) |
| (=) Distributable Earnings | | $ | 207.1 |
| | $ | 72.6 |
| | $ | 86.8 |
| | $ | 39.5 |
| | $ | 121.3 |
| | $ | 606.5 |
| | $ | 320.2 |
|
Real Assets Segment Results (Unaudited)
|
| | | | | | | | | | | | | | | | | | | | | | | | | | | | |
| | | Three Months Ended | | Twelve Months Ended |
| | | | | | | | | | | | | |
| Real Assets | | Sep 30, 2017 | | Dec 31, 2017 | | Mar 31, 2018 | | Jun 30, 2018 | | Sep 30, 2018 | | Sep 30,
2017 | | Sep 30,
2018 |
| | | (Dollars in millions) |
| | | | | | | | | | | | | | | |
| Revenues | | | | | | | | | | | | | | |
| Segment fee revenues | | | | | | | | | | | | | | |
| Fund management fees | | $ | 71.4 |
| | $ | 78.0 |
| | $ | 74.4 |
| | $ | 78.7 |
| | $ | 76.3 |
| | $ | 244.7 |
| | $ | 307.4 |
|
| Portfolio advisory fees, net | | 0.4 |
| | 0.2 |
| | 0.3 |
| | 0.4 |
| | 0.6 |
| | 0.7 |
| | 1.5 |
|
| Transaction fees, net | | 0.8 |
| | 3.7 |
| | 2.7 |
| | 0.1 |
| | — |
| | 0.8 |
| | 6.5 |
|
| Total segment fee revenues | | 72.6 |
| | 81.9 |
| | 77.4 |
| | 79.2 |
| | 76.9 |
| | 246.2 |
| | 315.4 |
|
| Performance revenues | | | | | | | | | | | | | | |
| Realized | | 20.4 |
| | 18.4 |
| | 7.8 |
| | 33.6 |
| | 73.7 |
| | 46.9 |
| | 133.5 |
|
| Unrealized | | 60.8 |
| | 68.2 |
| | 2.4 |
| | 143.0 |
| | (4.6 | ) | | 308.3 |
| | 209.0 |
|
| Total performance revenues | | 81.2 |
| | 86.6 |
| | 10.2 |
| | 176.6 |
| | 69.1 |
| | 355.2 |
| | 342.5 |
|
| Principal investment income/(loss) | | | | | | | | | | | | | | |
| Realized | | (64.6 | ) | | 9.2 |
| | 8.2 |
| | 3.1 |
| | 0.6 |
| | (71.6 | ) | | 21.1 |
|
| Unrealized | | 12.4 |
| | 2.3 |
| | 0.9 |
| | 11.9 |
| | 4.2 |
| | 19.3 |
| | 19.3 |
|
| Total principal investment income/(loss) | | (52.2 | ) | | 11.5 |
| | 9.1 |
| | 15.0 |
| | 4.8 |
| | (52.3 | ) | | 40.4 |
|
| Interest income | | 1.0 |
| | 1.0 |
| | 0.9 |
| | 1.2 |
| | 1.5 |
| | 2.4 |
| | 4.6 |
|
| Other income | | 0.6 |
| | 0.9 |
| | 1.2 |
| | 0.7 |
| | 0.3 |
| | 1.9 |
| | 3.1 |
|
| Total revenues | | 103.2 |
| | 181.9 |
| | 98.8 |
| | 272.7 |
| | 152.6 |
| | 553.4 |
| | 706.0 |
|
| | | | | | | | | | | | | | | |
| Expenses | | | | | | | | | | | | | | |
| Compensation and benefits | | | | | | | | | | | | | | |
| Cash-based compensation and benefits | | 39.3 |
| | 20.9 |
| | 34.7 |
| | 29.3 |
| | 33.7 |
| | 134.8 |
| | 118.6 |
|
| Equity-based compensation | | 8.7 |
| | 8.1 |
| | 10.1 |
| | 15.9 |
| | 12.0 |
| | 32.8 |
| | 46.1 |
|
| Performance revenues related compensation | | | | | | | | | | | | | | |
| Realized | | 9.2 |
| | 8.2 |
| | 4.0 |
| | 15.0 |
| | 31.8 |
| | 36.2 |
| | 59.0 |
|
| Unrealized | | 21.6 |
| | 15.2 |
| | (4.9 | ) | | 46.8 |
| | 2.7 |
| | 86.8 |
| | 59.8 |
|
| Total compensation and benefits | | 78.8 |
| | 52.4 |
| | 43.9 |
| | 107.0 |
| | 80.2 |
| | 290.6 |
| | 283.5 |
|
| General, administrative and other indirect expenses | | 10.5 |
| | 25.9 |
| | 18.1 |
| | 15.9 |
| | 15.5 |
| | 49.0 |
| | 75.4 |
|
| Depreciation and amortization expense | | 1.9 |
| | 1.8 |
| | 1.6 |
| | 1.6 |
| | 1.7 |
| | 6.8 |
| | 6.7 |
|
| Interest expense | | 4.2 |
| | 4.3 |
| | 3.9 |
| | 4.1 |
| | 4.1 |
| | 16.6 |
| | 16.4 |
|
| Total expenses | | 95.4 |
| | 84.4 |
| | 67.5 |
| | 128.6 |
| | 101.5 |
| | 363.0 |
| | 382.0 |
|
| | | | | | | | | | | | | | | |
| Economic Income | | $ | 7.8 |
| | $ | 97.5 |
| | $ | 31.3 |
| | $ | 144.1 |
| | $ | 51.1 |
| | $ | 190.4 |
| | $ | 324.0 |
|
| (-) Net Performance Revenues | | 50.4 |
| | 63.2 |
| | 11.1 |
| | 114.8 |
| | 34.6 |
| | 232.2 |
| | 223.7 |
|
| (-) Principal Investment Income/(Loss) | | (52.2 | ) | | 11.5 |
| | 9.1 |
| | 15.0 |
| | 4.8 |
| | (52.3 | ) | | 40.4 |
|
| (+) Equity-based compensation | | 8.7 |
| | 8.1 |
| | 10.1 |
| | 15.9 |
| | 12.0 |
| | 32.8 |
| | 46.1 |
|
| (+) Net interest | | 3.2 |
| | 3.3 |
| | 3.0 |
| | 2.9 |
| | 2.6 |
| | 14.2 |
| | 11.8 |
|
| (+) Reserve for Litigation and Contingencies | | (5.8 | ) | | — |
| | — |
| | — |
| | — |
| | (27.4 | ) | | — |
|
| (=) Fee Related Earnings | | $ | 15.7 |
| | $ | 34.2 |
| | $ | 24.2 |
| | $ | 33.1 |
| | $ | 26.3 |
| | $ | 30.1 |
| | $ | 117.8 |
|
| (+) Realized Net Performance Revenues | | 11.2 |
| | 10.2 |
| | 3.8 |
| | 18.6 |
| | 41.9 |
| | 10.7 |
| | 74.5 |
|
| (+) Realized Principal Investment Income/(Loss) | | (64.6 | ) | | 9.2 |
| | 8.2 |
| | 3.1 |
| | 0.6 |
| | (71.6 | ) | | 21.1 |
|
| (+) Net interest | | (3.2 | ) | | (3.3 | ) | | (3.0 | ) | | (2.9 | ) | | (2.6 | ) | | (14.2 | ) | | (11.8 | ) |
| (=) Distributable Earnings | | $ | (40.9 | ) | | $ | 50.3 |
| | $ | 33.2 |
| | $ | 51.9 |
| | $ | 66.2 |
| | $ | (45.0 | ) | | $ | 201.6 |
|
Global Credit Segment Results (Unaudited)
|
| | | | | | | | | | | | | | | | | | | | | | | | | | | | |
| | | Three Months Ended | | Twelve Months Ended |
| | | | | | | | | | | | | |
| Global Credit | | Sep 30, 2017 | | Dec 31, 2017 | | Mar 31, 2018 | | Jun 30, 2018 | | Sep 30, 2018 | | Sep 30,
2017 | | Sep 30,
2018 |
| | | (Dollars in millions) |
| | | | | | | | | | | | | | | |
| Revenues | | | | | | | | | | | | | | |
| Segment fee revenues | | | | | | | | | | | | | | |
| Fund management fees | | $ | 47.6 |
| | $ | 50.7 |
| | $ | 58.7 |
| | $ | 59.8 |
| | $ | 60.4 |
| | $ | 188.9 |
| | $ | 229.6 |
|
| Portfolio advisory fees, net | | 0.1 |
| | 0.2 |
| | 0.1 |
| | — |
| | 0.1 |
| | 0.9 |
| | 0.4 |
|
| Transaction fees, net | | — |
| | — |
| | — |
| | 0.1 |
| | — |
| | — |
| | 0.1 |
|
| Total segment fee revenues | | 47.7 |
| | 50.9 |
| | 58.8 |
| | 59.9 |
| | 60.5 |
| | 189.8 |
| | 230.1 |
|
| Performance revenues | | | | | | | | | | | | | | |
| Realized | | 15.0 |
| | 37.6 |
| | 1.1 |
| | 4.7 |
| | 0.1 |
| | 52.9 |
| | 43.5 |
|
| Unrealized | | 2.6 |
| | (31.8 | ) | | 2.6 |
| | 8.8 |
| | (0.6 | ) | | 12.1 |
| | (21.0 | ) |
| Total performance revenues | | 17.6 |
| | 5.8 |
| | 3.7 |
| | 13.5 |
| | (0.5 | ) | | 65.0 |
| | 22.5 |
|
| Principal investment income/(loss) | | | | | | | | | | | | | | |
| Realized | | 4.7 |
| | 3.3 |
| | 2.5 |
| | 2.4 |
| | 2.2 |
| | 11.0 |
| | 10.4 |
|
| Unrealized | | — |
| | 1.1 |
| | 2.0 |
| | (1.7 | ) | | 1.6 |
| | 4.7 |
| | 3.0 |
|
| Total principal investment income | | 4.7 |
| | 4.4 |
| | 4.5 |
| | 0.7 |
| | 3.8 |
| | 15.7 |
| | 13.4 |
|
| Interest income | | 2.0 |
| | 2.5 |
| | 3.3 |
| | 3.9 |
| | 4.2 |
| | 5.6 |
| | 13.9 |
|
| Other income | | 1.1 |
| | 1.2 |
| | 1.6 |
| | 1.0 |
| | 1.1 |
| | 6.8 |
| | 4.9 |
|
| Total revenues | | 73.1 |
| | 64.8 |
| | 71.9 |
| | 79.0 |
| | 69.1 |
| | 282.9 |
| | 284.8 |
|
| | | | | | | | | | | | | | | |
| Expenses | | | | | | | | | | | | | | |
| Compensation and benefits | | | | | | | | | | | | | | |
| Cash-based compensation and benefits | | 29.7 |
| | 28.3 |
| | 34.0 |
| | 30.5 |
| | 36.6 |
| | 107.2 |
| | 129.4 |
|
| Equity-based compensation | | 5.1 |
| | 3.8 |
| | 5.9 |
| | 7.1 |
| | 9.8 |
| | 20.7 |
| | 26.6 |
|
| Performance revenues related compensation | | | | | | | | | | | | | | |
| Realized | | 7.3 |
| | 16.8 |
| | 0.6 |
| | 2.1 |
| | — |
| | 27.7 |
| | 19.5 |
|
| Unrealized | | 0.8 |
| | (14.2 | ) | | 1.2 |
| | 3.9 |
| | (0.2 | ) | | 5.3 |
| | (9.3 | ) |
| Total compensation and benefits | | 42.9 |
| | 34.7 |
| | 41.7 |
| | 43.6 |
| | 46.2 |
| | 160.9 |
| | 166.2 |
|
| General, administrative and other indirect expenses | | (63.6 | ) | | 21.9 |
| | 15.8 |
| | 17.3 |
| | 14.2 |
| | 154.3 |
| | 69.2 |
|
| Depreciation and amortization expense | | 1.3 |
| | 1.3 |
| | 1.4 |
| | 1.6 |
| | 1.5 |
| | 5.4 |
| | 5.8 |
|
| Interest expense | | 4.2 |
| | 4.5 |
| | 5.3 |
| | 5.8 |
| | 5.8 |
| | 12.8 |
| | 21.4 |
|
| Total expenses | | (15.2 | ) | | 62.4 |
| | 64.2 |
| | 68.3 |
| | 67.7 |
| | 333.4 |
| | 262.6 |
|
| | | | | | | | | | | | | | | |
| Economic Income | | $ | 88.3 |
| | $ | 2.4 |
| | $ | 7.7 |
| | $ | 10.7 |
| | $ | 1.4 |
| | $ | (50.5 | ) | | $ | 22.2 |
|
| (-) Net Performance Revenues | | 9.5 |
| | 3.2 |
| | 1.9 |
| | 7.5 |
| | (0.3 | ) | | 32.0 |
| | 12.3 |
|
| (-) Principal Investment Income | | 4.7 |
| | 4.4 |
| | 4.5 |
| | 0.7 |
| | 3.8 |
| | 15.7 |
| | 13.4 |
|
| (+) Equity-based compensation | | 5.1 |
| | 3.8 |
| | 5.9 |
| | 7.1 |
| | 9.8 |
| | 20.7 |
| | 26.6 |
|
| (+) Net interest | | 2.2 |
| | 2.0 |
| | 2.0 |
| | 1.9 |
| | 1.6 |
| | 7.2 |
| | 7.5 |
|
| (+) Reserve for Litigation and Contingencies | | (4.1 | ) | | — |
| | — |
| | — |
| | — |
| | (23.1 | ) | | — |
|
| (=) Fee Related Earnings | | $ | 77.3 |
| | $ | 0.6 |
| | $ | 9.2 |
| | $ | 11.5 |
| | $ | 9.3 |
| | $ | (93.4 | ) | | $ | 30.6 |
|
| (+) Realized Net Performance Revenues | | 7.7 |
| | 20.8 |
| | 0.5 |
| | 2.6 |
| | 0.1 |
| | 25.2 |
| | 24.0 |
|
| (+) Realized Principal Investment Income | | 4.7 |
| | 3.3 |
| | 2.5 |
| | 2.4 |
| | 2.2 |
| | 11.0 |
| | 10.4 |
|
| (+) Net interest | | (2.2 | ) | | (2.0 | ) | | (2.0 | ) | | (1.9 | ) | | (1.6 | ) | | (7.2 | ) | | (7.5 | ) |
| (=) Distributable Earnings | | $ | 87.5 |
| | $ | 22.7 |
| | $ | 10.2 |
| | $ | 14.6 |
| | $ | 10.0 |
| | $ | (64.4 | ) | | $ | 57.5 |
|
Investment Solutions Segment Results (Unaudited)
|
| | | | | | | | | | | | | | | | | | | | | | | | | | | | |
| | | Three Months Ended | | Twelve Months Ended |
| | | | | | | | | | | | | |
| Investment Solutions | | Sep 30, 2017 | | Dec 31, 2017 | | Mar 31, 2018 | | Jun 30, 2018 | | Sep 30, 2018 | | Sep 30,
2017 | | Sep 30,
2018 |
| | | (Dollars in millions) |
| | | | | | | | | | | | | | | |
| Revenues | | | | | | | | | | | | | | |
| Segment fee revenues | | | | | | | | | | | | | | |
| Fund management fees | | $ | 41.1 |
| | $ | 41.8 |
| | $ | 40.3 |
| | $ | 41.6 |
| | $ | 42.7 |
| | $ | 149.7 |
| | $ | 166.4 |
|
| Portfolio advisory fees, net | | — |
| | — |
| | — |
| | — |
| | — |
| | — |
| | — |
|
| Transaction fees, net | | — |
| | — |
| | — |
| | — |
| | — |
| | — |
| | — |
|
| Total segment fee revenues | | 41.1 |
| | 41.8 |
| | 40.3 |
| | 41.6 |
| | 42.7 |
| | 149.7 |
| | 166.4 |
|
| Performance revenues | | | | | | | | | | | | | | |
| Realized | | 30.2 |
| | 19.9 |
| | 14.1 |
| | 9.2 |
| | 42.8 |
| | 89.4 |
| | 86.0 |
|
| Unrealized | | 4.2 |
| | 23.9 |
| | 36.8 |
| | 54.4 |
| | 61.6 |
| | 50.4 |
| | 176.7 |
|
| Total performance revenues | | 34.4 |
| | 43.8 |
| | 50.9 |
| | 63.6 |
| | 104.4 |
| | 139.8 |
| | 262.7 |
|
| Principal investment income/(loss) | | | | | | | | | | | | | | |
| Realized | | — |
| | 0.1 |
| | 0.1 |
| | (0.1 | ) | | — |
| | 0.1 |
| | 0.1 |
|
| Unrealized | | 1.6 |
| | 0.8 |
| | 1.0 |
| | 2.3 |
| | 0.9 |
| | 3.6 |
| | 5.0 |
|
| Total principal investment income | | 1.6 |
| | 0.9 |
| | 1.1 |
| | 2.2 |
| | 0.9 |
| | 3.7 |
| | 5.1 |
|
| Interest income | | 0.6 |
| | 0.2 |
| | 0.5 |
| | 0.3 |
| | 0.4 |
| | 1.0 |
| | 1.4 |
|
| Other income | | 0.1 |
| | 0.1 |
| | 0.2 |
| | 0.1 |
| | 0.1 |
| | 0.4 |
| | 0.5 |
|
| Total revenues | | 77.8 |
| | 86.8 |
| | 93.0 |
| | 107.8 |
| | 148.5 |
| | 294.6 |
| | 436.1 |
|
| | | | | | | | | | | | | | | |
| Expenses | | | | | | | | | | | | | | |
| Compensation and benefits | | | | | | | | | | | | | | |
| Cash-based compensation and benefits | | 24.7 |
| | 20.9 |
| | 23.2 |
| | 22.0 |
| | 22.2 |
| | 85.8 |
| | 88.3 |
|
| Equity-based compensation | | 2.1 |
| | 1.6 |
| | 3.0 |
| | 4.0 |
| | 4.7 |
| | 7.5 |
| | 13.3 |
|
| Performance revenues related compensation | | | | | | | | | | | | | | |
| Realized | | 29.9 |
| | 17.8 |
| | 12.6 |
| | 8.8 |
| | 38.4 |
| | 87.4 |
| | 77.6 |
|
| Unrealized | | (2.0 | ) | | 15.4 |
| | 27.1 |
| | 44.3 |
| | 58.9 |
| | 32.7 |
| | 145.7 |
|
| Total compensation and benefits | | 54.7 |
| | 55.7 |
| | 65.9 |
| | 79.1 |
| | 124.2 |
| | 213.4 |
| | 324.9 |
|
| General, administrative and other indirect expenses | | 6.1 |
| | 10.7 |
| | 8.0 |
| | 9.2 |
| | 10.1 |
| | 21.5 |
| | 38.0 |
|
| Depreciation and amortization expense | | 0.9 |
| | 1.0 |
| | 1.1 |
| | 1.1 |
| | 1.2 |
| | 3.3 |
| | 4.4 |
|
| Interest expense | | 1.6 |
| | 1.5 |
| | 1.6 |
| | 1.5 |
| | 1.6 |
| | 5.9 |
| | 6.2 |
|
| Total expenses | | 63.3 |
| | 68.9 |
| | 76.6 |
| | 90.9 |
| | 137.1 |
| | 244.1 |
| | 373.5 |
|
| | | | | | | | | | | | | | | |
| Economic Income | | $ | 14.5 |
| | $ | 17.9 |
| | $ | 16.4 |
| | $ | 16.9 |
| | $ | 11.4 |
| | $ | 50.5 |
| | $ | 62.6 |
|
| (-) Net Performance Revenues | | 6.5 |
| | 10.6 |
| | 11.2 |
| | 10.5 |
| | 7.1 |
| | 19.7 |
| | 39.4 |
|
| (-) Principal Investment Income | | 1.6 |
| | 0.9 |
| | 1.1 |
| | 2.2 |
| | 0.9 |
| | 3.7 |
| | 5.1 |
|
| (+) Equity-based compensation | | 2.1 |
| | 1.6 |
| | 3.0 |
| | 4.0 |
| | 4.7 |
| | 7.5 |
| | 13.3 |
|
| (+) Net interest | | 1.0 |
| | 1.3 |
| | 1.1 |
| | 1.2 |
| | 1.2 |
| | 4.9 |
| | 4.8 |
|
| (+) Reserve for Litigation and Contingencies | | (2.6 | ) | | — |
| | — |
| | — |
| | — |
| | (12.2 | ) | | — |
|
| (=) Fee Related Earnings | | $ | 6.9 |
| | $ | 9.3 |
| | $ | 8.2 |
| | $ | 9.4 |
| | $ | 9.3 |
| | $ | 27.3 |
| | $ | 36.2 |
|
| (+) Realized Net Performance Revenues | | 0.3 |
| | 2.1 |
| | 1.5 |
| | 0.4 |
| | 4.4 |
| | 2.0 |
| | 8.4 |
|
| (+) Realized Principal Investment Income/(Loss) | | — |
| | 0.1 |
| | 0.1 |
| | (0.1 | ) | | — |
| | 0.1 |
| | 0.1 |
|
| (+) Net interest | | (1.0 | ) | | (1.3 | ) | | (1.1 | ) | | (1.2 | ) | | (1.2 | ) | | (4.9 | ) | | (4.8 | ) |
| (=) Distributable Earnings | | $ | 6.2 |
| | $ | 10.2 |
| | $ | 8.7 |
| | $ | 8.5 |
| | $ | 12.5 |
| | $ | 24.5 |
| | $ | 39.9 |
|
Total AUM Roll Forward (Unaudited)
|
| | | | | | | | | | | | | | | | | | | | |
| | | Three Months Ended September 30, 2018 |
| (USD in millions) | | Corporate Private Equity | | Real Assets* | | Global Credit | | Investment Solutions (6) | | Total |
| Total AUM | | | | | | | | | | |
| Balance, Beginning of Period | | $ | 81,168 |
| | $ | 45,418 |
| | $ | 35,531 |
| | $ | 47,625 |
| | $ | 209,742 |
|
| New Commitments (1) | | 1,763 |
| | 1,114 |
| | 1,964 |
| | 1,138 |
| | 5,979 |
|
| Outflows (2) | | (1,214 | ) | | (1,359 | ) | | (261 | ) | | (3,298 | ) | | (6,132 | ) |
| Market Appreciation/(Depreciation) (3) | | 475 |
| | 878 |
| | 46 |
| | 2,054 |
| | 3,453 |
|
| Foreign Exchange Gain/(Loss) (4) | | (146 | ) | | (23 | ) | | (36 | ) | | (186 | ) | | (391 | ) |
| Other (5) | | (408 | ) | | (41 | ) | | 161 |
| | (59 | ) | | (347 | ) |
| Balance, End of Period | | $ | 81,638 |
| | $ | 45,987 |
| | $ | 37,405 |
| | $ | 47,274 |
| | $ | 212,304 |
|
| | | | | | | | | | | |
| | | For the Twelve Months Ended September 30, 2018 |
| (USD in millions) | | Corporate
Private Equity | | Real
Assets* | | Global
Credit | | Investment
Solutions (6) | | Total |
| Total AUM | | | | | | | | | | |
| Balance, Beginning of Period | | $ | 55,743 |
| | $ | 39,768 |
| | $ | 31,875 |
| | $ | 47,042 |
| | $ | 174,428 |
|
| New Commitments (1) | | 33,558 |
| | 6,259 |
| | 6,729 |
| | 4,057 |
| | 50,603 |
|
| Outflows (2) | | (11,900 | ) | | (4,465 | ) | | (1,503 | ) | | (10,431 | ) | | (28,299 | ) |
| Market Appreciation/(Depreciation) (3) | | 5,788 |
| | 4,222 |
| | 289 |
| | 7,375 |
| | 17,674 |
|
| Foreign Exchange Gain/(Loss) (4) | | (402 | ) | | (102 | ) | | (106 | ) | | (724 | ) | | (1,334 | ) |
| Other (5) | | (1,149 | ) | | 305 |
| | 121 |
| | (45 | ) | | (768 | ) |
| Balance, End of Period | | $ | 81,638 |
| | $ | 45,987 |
| | $ | 37,405 |
| | $ | 47,274 |
| | $ | 212,304 |
|
Fee-Earning AUM Roll Forward (Unaudited)
|
| | | | | | | | | | | | | | | | | | | | |
| | | Three Months Ended September 30, 2018 |
| (USD in millions) | | Corporate Private Equity | | Real Assets (12)* | | Global Credit | | Investment Solutions | | Total |
| Fee-Earning AUM | | | | | | | | | | |
| Balance, Beginning of Period | | $ | 56,310 |
| | $ | 31,541 |
| | $ | 28,795 |
| | $ | 29,831 |
| | $ | 146,477 |
|
| Inflows, including Fee-paying Commitments (7) | | 399 |
| | 775 |
| | 218 |
| | 1,028 |
| | 2,420 |
|
| Outflows, including Distributions (8) | | (321 | ) | | (702 | ) | | (84 | ) | | (1,391 | ) | | (2,498 | ) |
| Changes in CLO collateral balances (9) | | — |
| | — |
| | 1,001 |
| | — |
| | 1,001 |
|
| Market Appreciation/(Depreciation) (10) | | (11 | ) | | (9 | ) | | 6 |
| | 121 |
| | 107 |
|
| Foreign Exchange and other (11) | | (77 | ) | | (18 | ) | | 114 |
| | (125 | ) | | (106 | ) |
| Balance, End of Period | | $ | 56,300 |
| | $ | 31,587 |
| | $ | 30,050 |
| | $ | 29,464 |
| | $ | 147,401 |
|
| | | | | | | | | | | |
| | | For the Twelve Months Ended September 30, 2018 |
| (USD in millions) | | Corporate
Private Equity | | Real
Assets (12)* | | Global
Credit | | Investment
Solutions | | Total |
| Fee-Earning AUM | | | | | | | | | | |
| Balance, Beginning of Period | | $ | 35,603 |
| | $ | 29,820 |
| | $ | 26,012 |
| | $ | 30,346 |
| | $ | 121,781 |
|
| Inflows, including Fee-paying Commitments (7) | | 25,491 |
| | 5,728 |
| | 773 |
| | 4,717 |
| | 36,709 |
|
| Outflows, including Distributions (8) | | (4,627 | ) | | (4,079 | ) | | (413 | ) | | (5,355 | ) | | (14,474 | ) |
| Changes in CLO collateral balances (9) | | — |
| | — |
| | 3,461 |
| | — |
| | 3,461 |
|
| Market Appreciation/(Depreciation) (10) | | 30 |
| | 66 |
| | 15 |
| | 104 |
| | 215 |
|
| Foreign Exchange and other (11) | | (197 | ) | | 52 |
| | 202 |
| | (348 | ) | | (291 | ) |
| Balance, End of Period | | $ | 56,300 |
| | $ | 31,587 |
| | $ | 30,050 |
| | $ | 29,464 |
| | $ | 147,401 |
|
*As of September 30, 2018, the Legacy Energy Funds had, in the aggregate, approximately $4.6 billion in AUM and $3.4 billion in Fee-Earning AUM. NGP VIII, NGP IX, or in the case of NGP M&R and NGP ETP II, certain affiliated entities (collectively, the “NGP management fee funds”) and NGP X, NGP GAP, NGP XI, and NGP XII (referred to herein as, "carry funds"), are managed by NGP Energy Capital Management. As of September 30, 2018, the NGP management fee funds and carry funds had, in the aggregate, approximately $14.6 billion in AUM and $11.2 billion in Fee-Earning AUM.
See Notes at end of document.
Corporate Private Equity Fund Performance (Unaudited)
The fund return information reflected in this discussion and analysis is not indicative of the performance of The Carlyle Group L.P. and is also not necessarily indicative of the future performance of any particular fund. An investment in The Carlyle Group L.P. is not an investment in any of our funds. There can be no assurance that any of our existing or future funds will achieve similar returns.
|
| | | | | | | | | | | | | | | | | | | | | | | | | | |
| | | | | TOTAL INVESTMENTS | | REALIZED/PARTIALLY REALIZED INVESTMENTS (5) |
| | | | | As of September 30, 2018 | | As of September 30, 2018 |
| Corporate Private Equity | | Fund
Inception
Date (1) | Committed
Capital | Cumulative
Invested
Capital (2) | Total Fair
Value (3) | MOIC(4) | Gross
IRR (7)(12) | Net
IRR (8)(12) | | Cumulative
Invested
Capital (2) | Total Fair
Value (3) | MOIC(4) | Gross
IRR (7) |
| | | (Reported in Local Currency, in Millions) | | (Reported in Local Currency, in Millions) |
| Fully Invested/Committed Funds (6) | | | | | | | | | | | |
| CP II | | 10/1994 | $ | 1,331.1 |
| $ | 1,362.4 |
| $ | 4,072.2 |
| 3.0x | 34 | % | 25 | % |
| $ | 1,362.4 |
| $ | 4,072.2 |
| 3.0x | 34 | % |
| CP III | | 2/2000 | $ | 3,912.7 |
| $ | 4,031.6 |
| $ | 10,146.9 |
| 2.5x | 27 | % | 21 | % |
| $ | 4,031.6 |
| $ | 10,146.9 |
| 2.5x | 27 | % |
| CP IV | | 12/2004 | $ | 7,850.0 |
| $ | 7,612.6 |
| $ | 18,024.3 |
| 2.4x | 16 | % | 13 | % |
| $ | 7,612.6 |
| $ | 18,024.3 |
| 2.4x | 16 | % |
| CP V | | 5/2007 | $ | 13,719.7 |
| $ | 13,190.9 |
| $ | 27,919.2 |
| 2.1x | 18 | % | 14 | % |
| $ | 9,836.1 |
| $ | 25,329.1 |
| 2.6x | 25 | % |
| CP VI | | 5/2012 | $ | 13,000.0 |
| $ | 12,671.3 |
| $ | 18,389.8 |
| 1.5x | 18 | % | 12 | % |
| $ | 1,689.2 |
| $ | 4,382.3 |
| 2.6x | 40 | % |
| CEP I | | 12/1997 | € | 1,003.6 |
| € | 981.6 |
| € | 2,126.5 |
| 2.2x | 18 | % | 11 | % |
| € | 981.6 |
| € | 2,126.5 |
| 2.2x | 18 | % |
| CEP II | | 9/2003 | € | 1,805.4 |
| € | 2,048.4 |
| € | 4,125.8 |
| 2.0x | 36 | % | 20 | % |
| € | 1,883.8 |
| € | 4,106.8 |
| 2.2x | 43 | % |
| CEP III | | 12/2006 | € | 5,294.9 |
| € | 5,127.5 |
| € | 11,736.9 |
| 2.3x | 19 | % | 14 | % |
| € | 4,389.9 |
| € | 11,248.8 |
| 2.6x | 21 | % |
| CAP I | | 12/1998 | $ | 750.0 |
| $ | 627.7 |
| $ | 2,521.8 |
| 4.0x | 25 | % | 18 | % |
| $ | 627.7 |
| $ | 2,521.8 |
| 4.0x | 25 | % |
| CAP II | | 2/2006 | $ | 1,810.0 |
| $ | 1,628.2 |
| $ | 3,081.4 |
| 1.9x | 11 | % | 8 | % |
| $ | 1,628.2 |
| $ | 3,081.4 |
| 1.9x | 11 | % |
| CAP III | | 5/2008 | $ | 2,551.6 |
| $ | 2,543.2 |
| $ | 4,641.1 |
| 1.8x | 17 | % | 11 | % |
| $ | 2,071.8 |
| $ | 4,285.5 |
| 2.1x | 19 | % |
| CAP IV | | 11/2012 | $ | 3,880.4 |
| $ | 3,855.0 |
| $ | 5,215.5 |
| 1.4x | 16 | % | 9 | % |
| $ | 185.1 |
| $ | 386.1 |
| 2.1x | 43 | % |
| CJP I | | 10/2001 | ¥ | 50,000.0 |
| ¥ | 47,291.4 |
| ¥ | 138,902.1 |
| 2.9x | 61 | % | 37 | % |
| ¥ | 47,291.4 |
| ¥ | 138,902.1 |
| 2.9x | 61 | % |
| CJP II | | 7/2006 | ¥ | 165,600.0 |
| ¥ | 141,866.7 |
| ¥ | 210,602.1 |
| 1.5x | 7 | % | 4 | % |
| ¥ | 126,166.7 |
| ¥ | 191,642.2 |
| 1.5x | 7 | % |
| CGFSP I | | 9/2008 | $ | 1,100.2 |
| $ | 1,080.7 |
| $ | 2,471.8 |
| 2.3x | 20 | % | 14 | % |
| $ | 1,080.7 |
| $ | 2,471.8 |
| 2.3x | 20 | % |
| CGFSP II | | 4/2013 | $ | 1,000.0 |
| $ | 942.7 |
| $ | 1,452.8 |
| 1.5x | 23 | % | 14 | % |
| $ | 283.1 |
| $ | 580.5 |
| 2.1x | 33 | % |
| CEOF I | | 5/2011 | $ | 1,119.1 |
| $ | 1,168.2 |
| $ | 1,664.5 |
| 1.4x | 13 | % | 8 | % |
| $ | 346.9 |
| $ | 840.2 |
| 2.4x | 38 | % |
| CETP II | | 2/2007 | € | 521.6 |
| € | 437.4 |
| € | 1,265.3 |
| 2.9x | 27 | % | 19 | % |
| € | 359.7 |
| € | 1,180.5 |
| 3.3x | 30 | % |
| CAGP IV | | 6/2008 | $ | 1,041.4 |
| $ | 954.1 |
| $ | 1,326.3 |
| 1.4x | 9 | % | 4 | % |
| $ | 532.1 |
| $ | 983.2 |
| 1.8x | 15 | % |
| All Other Funds (9) | | Various |
|
| $ | 4,854.6 |
| $ | 7,580.8 |
| 1.6x | 16 | % | 7 | % |
| $ | 3,916.6 |
| $ | 6,158.4 |
| 1.6x | 17 | % |
| Coinvestments and Other (10) | | Various |
|
| $ | 11,683.7 |
| $ | 25,525.6 |
| 2.2x | 36 | % | 33 | % |
| $ | 6,960.4 |
| $ | 20,704.6 |
| 3.0x | 36 | % |
| Total Fully Invested Funds | $ | 79,857.1 |
| $ | 159,478.8 |
| 2.0x | 26 | % | 18 | % |
| $ | 52,538.2 |
| $ | 128,558.7 |
| 2.4x | 27 | % |
| Funds in the Investment Period (6) | | | | | | | | | | | |
| CP VII | | 11/2017 | $ | 18,510.0 |
| $ | 246.2 |
| $ | 246.2 |
| 1.0x | NM |
| NM |
| | | | | |
| CEP IV | | 8/2013 | € | 3,669.5 |
| € | 3,082.6 |
| € | 4,250.6 |
| 1.4x | 21 | % | 11 | % | | | | | |
| CAP V | | 10/2017 | $ | 6,554.2 |
| $ | 488.2 |
| $ | 480.2 |
| 1.0x | NM |
| NM |
| | | | | |
| CGP | | 12/2014 | $ | 3,588.0 |
| $ | 2,551.5 |
| $ | 2,950.4 |
| 1.2x | 9 | % | 7% |
| | | | | |
| CJP III | | 8/2013 | ¥ | 119,505.1 |
| ¥ | 60,094.5 |
| ¥ | 141,827.2 |
| 2.4x | 31 | % | 21 | % | | | | | |
| CEOF II | | 3/2015 | $ | 2,400.0 |
| $ | 1,167.6 |
| $ | 1,435.3 |
| 1.2x | NM |
| NM |
| | | | | |
| All Other Funds (11) | | Various |
|
| $ | 1,539.7 |
| $ | 2,114.6 |
| 1.4x | NM |
| NM |
| | | | | |
| Total Funds in the Investment Period | $ | 10,103.3 |
| $ | 13,413.5 |
| 1.3x | 18 | % | 9 | % |
| $ | 702.5 |
| $ | 1,984.9 |
| 2.8x | 50 | % |
| TOTAL CORPORATE PRIVATE EQUITY (13) | $ | 89,960.5 |
| $ | 172,892.3 |
| 1.9x | 26 | % | 18 | % |
| $ | 53,240.7 |
| $ | 130,543.5 |
| 2.5x | 27 | % |
Real Assets Carry Funds Fund Performance (Unaudited)
|
| | | | | | | | | | | | | | | | | | | | | | | | | | |
| | | | | TOTAL INVESTMENTS | | REALIZED/PARTIALLY REALIZED
INVESTMENTS (5) |
| | | | | As of September 30, 2018 | | As of September 30, 2018 |
| Real Assets | | Fund
Inception
Date (1) | Committed
Capital | Cumulative
Invested
Capital (2) | Total Fair
Value (3) | MOIC(4) | Gross
IRR (7)(12) | Net
IRR (8)(12) | | Cumulative
Invested
Capital (2) | Total Fair
Value (3) | MOIC(4) | Gross
IRR (7)(12) |
| | | | | (Reported in Local Currency, in Millions) | | (Reported in Local Currency, in Millions) |
| Fully Invested/Committed Funds (6) | | | | | | | | | | |
| CRP III | | 11/2000 | $ | 564.1 |
| $ | 522.5 |
| $ | 1,851.1 |
| 3.5x | 44 | % | 30 | % |
| $ | 522.5 |
| $ | 1,851.1 |
| 3.5x | 44 | % |
| CRP IV | | 12/2004 | $ | 950.0 |
| $ | 1,270.0 |
| $ | 2,005.0 |
| 1.6x | 7 | % | 4 | % |
| $ | 1,213.7 |
| $ | 1,966.1 |
| 1.6x | 7 | % |
| CRP V | | 11/2006 | $ | 3,000.0 |
| $ | 3,385.4 |
| $ | 5,654.1 |
| 1.7x | 12 | % | 9 | % |
| $ | 3,029.1 |
| $ | 5,043.4 |
| 1.7x | 13 | % |
| CRP VI | | 9/2010 | $ | 2,340.0 |
| $ | 2,199.6 |
| $ | 4,021.7 |
| 1.8x | 28 | % | 19 | % |
| $ | 1,659.5 |
| $ | 3,334.5 |
| 2.0x | 33 | % |
| CRP VII | | 3/2014 | $ | 4,161.6 |
| $ | 3,529.5 |
| $ | 5,177.7 |
| 1.5x | 22 | % | 14 | % |
| $ | 742.9 |
| $ | 1,475.7 |
| 2.0x | 33 | % |
| CEREP I | | 3/2002 | € | 426.6 |
| € | 517.0 |
| € | 698.6 |
| 1.4x | 14 | % | 7 | % |
| € | 517.0 |
| € | 698.6 |
| 1.4x | 14 | % |
| CEREP II | | 4/2005 | € | 762.7 |
| € | 833.8 |
| € | 128.1 |
| 0.2x | Neg |
| Neg |
|
| € | 826.7 |
| € | 132.3 |
| 0.2x | Neg |
|
| CEREP III | | 5/2007 | € | 2,229.5 |
| € | 2,052.4 |
| € | 2,463.7 |
| 1.2x | 4 | % | 1 | % |
| € | 1,911.5 |
| € | 2,368.3 |
| 1.2x | 5 | % |
| CIP | | 9/2006 | $ | 1,143.7 |
| $ | 1,069.8 |
| $ | 1,434.4 |
| 1.3x | 6 | % | 3 | % |
| $ | 1,013.4 |
| $ | 1,386.3 |
| 1.4x | 6 | % |
| NGP X | | 1/2012 | $ | 3,586.0 |
| $ | 3,278.6 |
| $ | 4,346.5 |
| 1.3x | 9 | % | 6 | % |
| $ | 1,382.9 |
| $ | 2,520.3 |
| 1.8x | 25 | % |
| NGP XI | | 6/2014 | $ | 5,325.0 |
| $ | 4,485.9 |
| $ | 6,871.5 |
| 1.5x | 31 | % | 22 | % |
| $ | 385.3 |
| $ | 576.3 |
| 1.5x | 41 | % |
| Energy II | | 7/2002 | $ | 1,100.0 |
| $ | 1,334.8 |
| $ | 3,130.0 |
| 2.3x | 81 | % | 55 | % |
| $ | 1,334.8 |
| $ | 3,130.0 |
| 2.3x | 81 | % |
| Energy III | | 10/2005 | $ | 3,800.0 |
| $ | 3,569.7 |
| $ | 5,573.5 |
| 1.6x | 10 | % | 6 | % |
| $ | 3,096.4 |
| $ | 5,044.8 |
| 1.6x | 12 | % |
| Energy IV | | 12/2007 | $ | 5,979.1 |
| $ | 6,314.8 |
| $ | 8,604.4 |
| 1.4x | 9 | % | 5 | % |
| $ | 4,880.3 |
| $ | 6,946.9 |
| 1.4x | 11 | % |
| Renew II | | 3/2008 | $ | 3,417.5 |
| $ | 2,833.5 |
| $ | 4,257.8 |
| 1.5x | 8 | % | 5 | % |
| $ | 1,479.3 |
| $ | 2,353.0 |
| 1.6x | 12 | % |
| All Other Funds (14) | | Various |
| $ | 2,941.1 |
| $ | 3,309.8 |
| 1.1x | 4 | % | Neg |
|
| $ | 2,662.1 |
| $ | 3,022.6 |
| 1.1x | 5 | % |
| Coinvestments and Other (10) | | Various |
| $ | 6,390.2 |
| $ | 10,701.3 |
| 1.7x | 17 | % | 13 | % |
| $ | 4,368.5 |
| $ | 7,559.4 |
| 1.7x | 19 | % |
| Total Fully Invested Funds | $ | 47,078.4 |
| $ | 70,761.0 |
| 1.5x | 13 | % | 8 | % |
| $ | 31,552.1 |
| $ | 49,926.6 |
| 1.6x | 14 | % |
| Funds in the Investment Period (6) | | | | | | | | | | |
| CRP VIII | | 5/2017 | $ | 5,505.1 |
| $ | 709.6 |
| $ | 722.7 |
| 1.0x | NM |
| NM |
| | | | | |
| CIEP I | | 9/2013 | $ | 2,500.0 |
| $ | 1,410.5 |
| $ | 2,369.4 |
| 1.7x | 32 | % | 17 | % | | | | | |
| NGP XII | | 7/2017 | $ | 3,213.3 |
| $ | 769.5 |
| $ | 853.1 |
| 1.1x | NM |
| NM |
| | | | | |
| CPP II | | 6/2014 | $ | 1,526.9 |
| $ | 676.0 |
| $ | 843.1 |
| 1.2x | 12% |
| 4% |
| | | | | |
| CPI | | 5/2016 | $ | 1,787.2 |
| $ | 1,260.7 |
| $ | 1,451.7 |
| 1.2x | NM |
| NM |
| | | | | |
| All Other Funds (15) | | Various |
|
| $ | 460.3 |
| $ | 393.4 |
| 0.9x | NM |
| NM |
| | | | | |
| Total Funds in the Investment Period | $ | 5,286.6 |
| $ | 6,633.3 |
| 1.3x | 19 | % | 8 | % |
| $ | — |
| $ | — |
| n/a | n/a |
|
| TOTAL Real Assets (13) | $ | 52,365.0 |
| $ | 77,394.3 |
| 1.5x | 13 | % | 8 | % |
| $ | 31,552.1 |
| $ | 49,926.6 |
| 1.6x | 14 | % |
Global Credit Carry Funds Fund Performance (Unaudited)
|
| | | | | | | | | | | | | | | | |
| | | | | TOTAL INVESTMENTS |
| | | | | As of September 30, 2018 |
Global Credit (Carry Funds Only) | | Fund
Inception
Date (1) | Committed
Capital | Cumulative
Invested Capital (17) | Total Fair
Value (3) | MOIC (4) | Gross IRR (7)(12) | Net IRR (8)(12) |
| | | (Reported in Local Currency, in Millions) | | |
| Fully Invested/Committed Funds (6) | | | | | |
| CSP II | | 6/2007 | $ | 1,352.3 |
| $ | 1,352.3 |
| $ | 2,474.6 |
| 1.8x | 17 | % | 11 | % |
| CSP III | | 8/2011 | $ | 702.8 |
| $ | 702.8 |
| $ | 1,197.3 |
| 1.7x | 30 | % | 20 | % |
| CEMOF I | | 12/2010 | $ | 1,382.5 |
| $ | 1,600.9 |
| $ | 1,423.7 |
| 0.9x | Neg |
| Neg |
|
| All Other Funds (16) | |
|
|
| $ | 1,446.5 |
| $ | 1,991.3 |
| 1.4x | 12 | % | 7 | % |
| Coinvestments and Other (10) | |
|
|
| $ | 1,029.6 |
| $ | 1,027.7 |
| 1.0x | NM |
| NM |
|
| Total Fully Invested Funds | $ | 6,132.1 |
| $ | 8,114.6 |
| 1.3x | 12 | % | 6 | % |
| Funds in the Investment Period (6) | | | | | |
| CSP IV | | 3/2016 | $ | 2,500.0 |
| $ | 913.0 |
| $ | 1,083.4 |
| 1.2x | NM |
| NM |
|
| CEMOF II | | 2/2015 | $ | 2,819.2 |
| $ | 966.7 |
| $ | 1,104.2 |
| 1.1x | NM |
| NM |
|
| All Other Funds | |
|
|
| $ | 544.6 |
| $ | 584.3 |
| 1.1x | NM |
| NM |
|
| Total Funds in the Investment Period | |
|
|
| $ | 2,424.3 |
| $ | 2,771.9 |
| 1.1x | NM |
| NM |
|
| TOTAL Global Credit | | | | $ | 8,556.4 |
| $ | 10,886.5 |
| 1.3x | 12 | % | 6 | % |
| | | | | | | | | |
Investment Solutions Fund Performance (Unaudited)
|
| | | | | | | | | | | | | | | | |
| | | | | TOTAL INVESTMENTS |
| | | | | As of September 30, 2018 |
| Investment Solutions (19) | | Vintage
Year | Fund Size | Cumulative
Invested
Capital
(2)(20) | Total Fair
Value (3)(20) | MOIC (4) | Gross IRR (12) (21) | Net IRR (8) (12) |
| | | (Reported in Local Currency, in Millions) |
| AlpInvest | | | | | | | | |
| Fully Committed Funds (18) | | | | | | | | |
| Main Fund I - Fund Investments | | 2000 | € | 5,174.6 |
| € | 4,247.3 |
| € | 6,999.0 |
| 1.6x | 12 | % | 11 | % |
| Main Fund II - Fund Investments | | 2003 | € | 4,545.0 |
| € | 4,823.1 |
| € | 7,712.9 |
| 1.6x | 10 | % | 9 | % |
| Main Fund III - Fund Investments | | 2005 | € | 11,500.0 |
| € | 12,804.4 |
| € | 21,049.5 |
| 1.6x | 10 | % | 10 | % |
| Main Fund IV - Fund Investments | | 2009 | € | 4,877.3 |
| € | 5,171.9 |
| € | 8,871.9 |
| 1.7x | 17 | % | 16 | % |
| Main Fund V - Fund Investments | | 2012 | € | 5,080.0 |
| € | 4,459.8 |
| € | 6,203.4 |
| 1.4x | 15 | % | 14 | % |
| Main Fund VI - Fund Investments | | 2015 | € | 1,106.4 |
| € | 596.6 |
| € | 705.6 |
| 1.2x | 16 | % | 14 | % |
| Main Fund I - Secondary Investments | | 2002 | € | 519.4 |
| € | 476.1 |
| € | 899.4 |
| 1.9x | 58 | % | 54 | % |
| Main Fund II - Secondary Investments | | 2003 | € | 998.4 |
| € | 1,006.2 |
| € | 1,841.5 |
| 1.8x | 27 | % | 26 | % |
| Main Fund III - Secondary Investments | | 2006 | € | 2,250.0 |
| € | 2,348.7 |
| € | 3,601.3 |
| 1.5x | 11 | % | 10 | % |
| Main Fund IV - Secondary Investments | | 2010 | € | 1,859.1 |
| € | 1,933.1 |
| € | 3,329.1 |
| 1.7x | 20 | % | 19 | % |
| Main Fund V - Secondary Investments | | 2011 | € | 4,272.8 |
| € | 3,957.5 |
| € | 6,608.2 |
| 1.7x | 23 | % | 21 | % |
| Main Fund II - Co-Investments | | 2003 | € | 1,090.0 |
| € | 903.2 |
| € | 2,514.4 |
| 2.8x | 44 | % | 42 | % |
| Main Fund III - Co-Investments | | 2006 | € | 2,760.0 |
| € | 2,770.5 |
| € | 3,914.0 |
| 1.4x | 6 | % | 5 | % |
| Main Fund IV - Co-Investments | | 2010 | € | 1,475.0 |
| € | 1,335.4 |
| € | 3,556.0 |
| 2.7x | 24 | % | 22 | % |
| Main Fund V - Co-Investments | | 2012 | € | 1,122.2 |
| € | 1,023.0 |
| € | 2,452.1 |
| 2.4x | 31 | % | 28 | % |
| Main Fund VI - Co-Investments | | 2014 | € | 1,114.6 |
| € | 924.9 |
| € | 1,821.2 |
| 2.0x | 31 | % | 28 | % |
| Main Fund II - Mezzanine Investments | | 2004 | € | 700.0 |
| € | 755.8 |
| € | 1,043.3 |
| 1.4x | 8 | % | 7 | % |
| Main Fund III - Mezzanine Investments | | 2006 | € | 2,000.0 |
| € | 1,958.5 |
| € | 2,658.0 |
| 1.4x | 10 | % | 9 | % |
| All Other Funds (22) | | Various |
| € | 2,335.1 |
| € | 3,198.5 |
| 1.4x | 14 | % | 11 | % |
| Total Fully Committed Funds | |
|
| € | 53,831.2 |
| € | 88,979.4 |
| 1.7x | 13 | % | 12 | % |
| Funds in the Commitment Period (18) | |
|
|
|
|
|
|
|
| Main Fund VI - Secondary Investments | | 2017 | € | 5,007.6 |
| € | 1,435.8 |
| € | 1,581.1 |
| 1.1x | NM |
| NM |
|
| Main Fund VII - Co-Investments | | 2017 | € | 2,484.7 |
| € | 550.3 |
| € | 623.0 |
| 1.1x | NM |
| NM |
|
| All Other Funds (22) | | Various |
|
| € | 799.1 |
| € | 1,027.1 |
| 1.3x | 21 | % | 18 | % |
| Total Funds in the Commitment Period | |
|
| € | 2,785.2 |
| € | 3,231.2 |
| 1.2x | 16 | % | 12 | % |
| TOTAL ALPINVEST | |
|
| € | 56,616.4 |
| € | 92,210.6 |
| 1.6x | 13 | % | 12 | % |
| TOTAL ALPINVEST (USD) (23) | |
|
| $ | 65,764.2 |
| $ | 107,109.5 |
| 1.6x |
|
|
| | |
|
|
|
|
|
|
|
|
|
| | |
|
|
|
|
|
|
|
|
|
| Metropolitan Real Estate | |
|
|
|
|
|
|
|
|
|
| Fully Committed Funds (18) | | Various |
| $ | 3,018.3 |
| $ | 3,948.8 |
| 1.3x | 7 | % | 4 | % |
| Funds in the Commitment Period (18) | | Various |
| $ | 174.7 |
| $ | 202.6 |
| 1.2x | NM |
| NM |
|
| TOTAL METROPOLITAN REAL ESTATE | |
|
| $ | 3,193.0 |
| $ | 4,151.4 |
| 1.3x | 7 | % | 4 | % |
See Notes at end of document.
Remaining Fair Value Analysis (Unaudited)
|
| | | | | | | | | | | | |
| | Remaining Fair Value (1) | Unrealized MOIC (2) | Total MOIC (3) | % Invested (4) | In Accrued Carry/ (Clawback) (5) | LTM Realized Carry/ (Clawback) (6) | Catch-up Rate | Fee Initiation Date (7) | Quarters Since Fee Initiation | Original Investment Period End Date |
| | As of September 30, 2018 | | | | |
| Corporate Private Equity | (Reported in Local Currency, in Millions) | | | | |
| CP VI | $ | 13,470.1 |
| 1.3x | 1.5x | 97% | X |
| 100% | Jun-13 | 22 | May-18 |
| CAP IV | $ | 4,446.1 |
| 1.3x | 1.4x | 99% | X |
| 100% | Jul-13 | 21 | Nov-18 |
| CEP IV | € | 3,481.0 |
| 1.5x | 1.4x | 84% | X |
| 100% | Sep-14 | 17 | Aug-19 |
| CGP | $ | 2,903.6 |
| 1.1x | 1.2x | 71% | X |
| 100% | Jan-15 | 15 | Dec-20 |
| CP V | $ | 2,639.0 |
| 0.8x | 2.1x | 96% | X | X | 100% | Jun-07 | 46 | May-13 |
| CEOF II | $ | 1,298.8 |
| 1.2x | 1.2x | 49% |
|
| 80% | Nov-15 | 12 | Mar-21 |
| CJP III | ¥ | 102,649.0 |
| 2.2x | 2.4x | 50% | X |
| 100% | Sep-13 | 21 | Feb-20 |
| CEOF I | $ | 787.8 |
| 1.0x | 1.4x | 104% | X |
| 80% | Sep-11 | 29 | May-17 |
| CGFSP II | $ | 773.5 |
| 1.3x | 1.5x | 94% | X | X | 100% | Jun-13 | 22 | Dec-17 |
| CEP III | € | 490.0 |
| 0.7x | 2.3x | 97% | X | X | 100% | Jul-07 | 45 | Dec-12 |
| CAP V | $ | 490.9 |
| 1.0x | 1.0x | 7% |
|
| 100% | Jun-18 | 2 | Jun-24 |
| CAP III | $ | 447.9 |
| 1.0x | 1.8x | 100% | X | X | 100% | Jun-08 | 42 | May-14 |
| CAGP IV | $ | 277.2 |
| 0.7x | 1.4x | 92% |
|
| 100% | Aug-08 | 41 | Jun-14 |
| CP IV | $ | 276.1 |
| 2.9x | 2.4x | 97% | X |
| 80% | Apr-05 | 54 | Dec-10 |
| CP VII | $ | 247.0 |
| 1.0x | 1.0x | 1% |
|
| 200% | May-18 | 2 | May-24 |
| CJP II | ¥ | 15,535.0 |
| 1.0x | 1.5x | 86% |
|
| 80% | Oct-06 | 48 | Jul-12 |
| All Other Funds (8) | $ | 2,956.3 |
| 1.2x | 2.2x |
| NM | NM |
|
|
|
|
| Coinvestment and Other (9) | $ | 4,602.9 |
| 1.1x | 2.2x |
| NM | NM |
|
|
|
|
| Total Corporate Private Equity (12) | $ | 41,271.0 |
| 1.2x | 1.9x | | | | | | | |
| | | | | | | | | | | | |
| Real Assets | | | | | | | | | | | |
| NGP XI | $ | 6,052.8 |
| 1.5x | 1.5x | 84% | X |
| 80% | Feb-15 | 15 | Oct-19 |
| CRP VII | $ | 3,603.2 |
| 1.3x | 1.5x | 85% | X | X | 80% | Jun-14 | 18 | Mar-19 |
| Energy IV | $ | 2,578.6 |
| 1.2x | 1.4x | 106% | (X) |
| 80% | Feb-08 | 43 | Dec-13 |
| CIEP I | $ | 2,152.8 |
| 1.5x | 1.7x | 56% | X |
| 80% | Oct-13 | 20 | Sep-19 |
| NGP X | $ | 1,878.3 |
| 1.1x | 1.3x | 91% |
|
| 80% | Jan-12 | 27 | May-17 |
| Renew II | $ | 1,514.5 |
| 0.7x | 1.5x | 83% | (X) |
| 80% | Mar-08 | 43 | May-14 |
| CPI | $ | 1,355.1 |
| 1.1x | 1.2x | n/a | X |
| 50% | May-16 | 10 | Apr-21 |
| CRP V | $ | 1,188.1 |
| 2.5x | 1.7x | 113% | X |
| 50% | Nov-06 | 48 | Nov-11 |
| NGP XII | $ | 853.1 |
| 1.1x | 1.1x | 24% |
|
| 80% | Nov-17 | 4 | Oct-19 |
| CRP VIII | $ | 722.6 |
| 1.0x | 1.0x | 13% |
|
| 80% | Aug-17 | 5 | May-22 |
| CPP II | $ | 642.0 |
| 1.3x | 1.2x | 44% |
|
| 80% | Sep-14 | 17 | Apr-21 |
| CRP VI | $ | 596.0 |
| 1.3x | 1.8x | 94% | X | X | 50% | Mar-11 | 31 | Mar-16 |
| CRP IV | $ | 340.0 |
| 4.5x | 1.6x | 134% |
|
| 50% | Jan-05 | 55 | Dec-09 |
| Energy III | $ | 325.0 |
| 0.7x | 1.6x | 94% | (X) |
| 80% | Nov-05 | 52 | Oct-11 |
| CRP III | $ | 324.2 |
| 97.9x | 3.5x | 93% | X | X | 50% | Mar-01 | 71 | May-05 |
| CEREP III | € | 127.7 |
| 0.9x | 1.2x | 92% |
|
| 67% | Jun-07 | 46 | May-11 |
| All Other Funds (10) | $ | 683.0 |
| 0.9x | 1.3x |
| NM | NM |
|
|
|
|
| Coinvestment and Other (9) | $ | 2,742.0 |
| 1.2x | 1.7x |
| NM | NM |
|
|
|
|
| Total Real Assets (12) | $ | 27,699.6 |
| 1.3x | 1.5x |
|
|
|
|
|
|
|
| | | | | | | | | | | | |
| Global Credit | | | | | | | | | | | |
| CEMOF II | $ | 991.0 |
| 1.0x | 1.1x | 34% |
|
| 100% | Dec-15 | 12 | Feb-20 |
| CSP IV | $ | 808.6 |
| 1.1x | 1.2x | 37% | X |
| 100% | Feb-17 | 7 | Dec-20 |
| CEMOF I | $ | 707.6 |
| 0.5x | 0.9x | 116% |
|
| 100% | Dec-10 | 32 | Dec-15 |
| CSP III | $ | 349.8 |
| 1.2x | 1.7x | 100% | X | X | 80% | Dec-11 | 28 | Aug-15 |
| All Other Funds (11) | $ | 619.0 |
| 1.0x | 1.5x |
| NM | NM |
|
|
|
|
| Coinvestment and Other (9) | $ | 845.9 |
| 0.8x | 1.0x |
| NM | NM |
|
|
|
|
| Total Global Credit | $ | 4,322.0 |
| 0.8x | 1.3x |
|
|
|
|
|
|
|
See Notes at end of document.
Reconciliation for Total Segment Information (Unaudited)
|
| | | | | | | | | | | | | | | | | | |
| | Three Months Ended September 30, 2017 | |
| | Total Reportable Segments | | Consolidated Funds | | Reconciling Items | | | | Carlyle Consolidated | |
| | (Dollars in millions) | |
| Revenues | $ | 547.5 |
| | $ | 44.7 |
| | $ | 47.7 |
| | (a) | | $ | 639.9 |
| |
| Expenses | $ | 344.8 |
| | $ | 52.3 |
| | $ | 95.5 |
| | (b) | | $ | 492.6 |
| |
| Other income | $ | — |
| | $ | 18.6 |
| | $ | — |
| | (c) | | $ | 18.6 |
| |
| Economic income (loss) | $ | 202.7 |
| | $ | 11.0 |
| | $ | (47.8 | ) | | (d) | | $ | 165.9 |
| (1) |
| | | | | | | | | | | |
| | Three Months Ended December 31, 2017 | |
| | Total Reportable Segments | | Consolidated Funds | | Reconciling Items | | | | Carlyle Consolidated | |
| | (Dollars in millions) | |
| Revenues | $ | 971.1 |
| | $ | 45.1 |
| | $ | (8.4 | ) | | (a) | | $ | 1,007.8 |
| |
| Expenses | $ | 604.7 |
| | $ | 43.2 |
| | $ | (23.1 | ) | | (b) | | $ | 624.8 |
| |
| Other income | $ | — |
| | $ | 47.1 |
| | $ | (35.1 | ) | | (c) | | $ | 12.0 |
| |
| Economic income (loss) | $ | 366.4 |
| | $ | 49.0 |
| | $ | (20.4 | ) | | (d) | | $ | 395.0 |
| (1) |
| | | | | | | | | | | |
| | Three Months Ended March 31, 2018 | |
| | Total Reportable Segments | | Consolidated Funds | | Reconciling Items | | | | Carlyle Consolidated | |
| | (Dollars in millions) | |
| Revenues | $ | 653.9 |
| | $ | 47.3 |
| | $ | 1.6 |
| | (a) | | $ | 702.8 |
| |
| Expenses | $ | 484.9 |
| | $ | 44.3 |
| | $ | 50.1 |
| | (b) | | $ | 579.3 |
| |
| Other income | $ | — |
| | $ | 2.0 |
| | $ | — |
| | (c) | | $ | 2.0 |
| |
| Economic income (loss) | $ | 169.0 |
| | $ | 5.0 |
| | $ | (48.5 | ) | | (d) | | $ | 125.5 |
| (1) |
| | | | | | | | | | | |
| | Three Months Ended June 30, 2018 | |
| | Total Reportable Segments | | Consolidated Funds | | Reconciling Items | | | | Carlyle Consolidated | |
| | (Dollars in millions) | |
| Revenues | $ | 840.2 |
| | $ | 53.6 |
| | $ | (0.2 | ) | | (a) | | $ | 893.6 |
| |
| Expenses | $ | 568.1 |
| | $ | 62.0 |
| | $ | 23.6 |
| | (b) | | $ | 653.7 |
| |
| Other income | $ | — |
| | $ | 12.9 |
| | $ | — |
| | (c) | | $ | 12.9 |
| |
| Economic income (loss) | $ | 272.1 |
| | $ | 4.5 |
| | $ | (23.8 | ) | | (d) | | $ | 252.8 |
| (1) |
| | | | | | | | | | | |
| | Three Months Ended September 30, 2018 | |
| | Total Reportable Segments | | Consolidated Funds | | Reconciling Items | | | | Carlyle Consolidated | |
| | (Dollars in millions) | |
| Revenues | $ | 612.9 |
| | $ | 60.5 |
| | $ | 5.7 |
| | (a) | | $ | 679.1 |
| |
| Expenses | $ | 502.3 |
| | $ | 51.0 |
| | $ | 62.3 |
| | (b) | | $ | 615.6 |
| |
| Other loss | $ | — |
| | $ | (2.9 | ) | | $ | — |
| | (c) | | $ | (2.9 | ) | |
| Economic income (loss) | $ | 110.6 |
| | $ | 6.6 |
| | $ | (56.6 | ) | | (d) | | $ | 60.6 |
| (1) |
| | | | | | | | | | | |
| |
| 1) | The amount in the "Carlyle Consolidated" column is income before provision for income taxes, which is the GAAP measure that is most directly comparable to Economic Income. |
Reconciliation for Total Segment Information, cont. (Unaudited)
| |
| (a) | The Revenues adjustment principally represents fund management fees and performance revenues earned from the Consolidated Funds that were eliminated in consolidation to arrive at Carlyle’s total revenues, adjustments for amounts attributable to non-controlling interests in consolidated entities, adjustments related to expenses associated with the investments in NGP Management and its affiliates that are included in operating captions or are excluded from the segment results, adjustments to reflect the reimbursement of certain costs incurred on behalf of Carlyle funds on a net basis, adjustments to reflect Carlyle’s share of Urbplan’s net losses as a component of principal investment income until Urbplan was deconsolidated during 2017, the inclusion of tax expenses associated with certain performance revenues, and adjustments to reflect Carlyle’s ownership interests in Claren Road (until January 2017) that were included in Revenues in the Partnership's segment reporting. |
| |
| (b) | The Expense adjustment represents the elimination of intercompany expenses of the Consolidated Funds payable to Carlyle, the inclusion of certain tax expenses associated with performance revenue compensation, adjustments related to expenses associated with the investments in NGP Management and its affiliates that are included in operating captions, adjustments to reflect the reimbursement of certain costs incurred on behalf of Carlyle funds on a net basis, adjustments to reflect Carlyle’s share of Urbplan’s net losses as a component of principal investment income until Urbplan was deconsolidated in Q3 2017, changes in the tax receivable agreement liability, charges and credits associated with Carlyle corporate actions and non-recurring items and adjustments to reflect Carlyle’s economic interests in Claren Road (until January 2017), as detailed below: |
|
| | | | | | | | | | | | | | | | | | | | |
| | | Three Months Ended |
| | | Sep 30, 2017 | | Dec 31, 2017 | | Mar 31, 2018 | | Jun 30, 2018 | | Sep 30, 2018 |
| | | (Dollars in millions) |
| Equity-based compensation issued in conjunction with the initial public offering, acquisitions and strategic investments | | $ | 58.3 |
| | $ | 57.4 |
| | $ | 50.1 |
| | $ | 18.4 |
| | $ | 0.3 |
|
| Acquisition related charges, including amortization of intangibles and impairment | | 7.2 |
| | 10.5 |
| | 4.6 |
| | 9.2 |
| | 2.4 |
|
| Other non-operating expense (income) | | — |
| | (71.5 | ) | | 0.3 |
| | 0.3 |
| | 0.3 |
|
| Tax (expense) benefit associated with performance revenues | | (1.7 | ) | | (2.2 | ) | | (2.1 | ) | | 3.8 |
| | (12.7 | ) |
| Non-Carlyle economic interests in acquired businesses and other adjustments to present certain costs on a net basis | | 46.2 |
| | (13.1 | ) | | 4.0 |
| | 4.3 |
| | 8.3 |
|
| Lease assignment and termination costs | | — |
| | — |
| | — |
| | 3.4 |
| | 63.5 |
|
| Debt extinguishment costs | | — |
| | — |
| | — |
| | — |
| | 7.8 |
|
| Severance and other adjustments | | 0.6 |
| | 2.3 |
| | 1.6 |
| | 0.9 |
| | 2.9 |
|
| Elimination of expenses of Consolidated Funds | | (15.1 | ) | | (6.5 | ) | | (8.4 | ) | | (16.7 | ) | | (10.5 | ) |
| | | $ | 95.5 |
| | $ | (23.1 | ) | | $ | 50.1 |
| | $ | 23.6 |
| | $ | 62.3 |
|
| | | | | | | | | | | |
| |
| (c) | The Other Income (Loss) adjustment results from the Consolidated Funds which were eliminated in consolidation to arrive at Carlyle’s total Other Income (Loss). |
| |
| (d) | Reconciliation for Economic Income and Distributable Earnings (Unaudited) |
|
| | | | | | | | | | | | | | | | | | | | | | | | |
| | | Three Months Ended | | Twelve Months Ended |
| | | Sep 30,
2017 | | Dec 31,
2017 | | Mar 31,
2018 | | Jun 30,
2018 | | Sep 30,
2018 | | Sep 30, 2018 |
| | | (Dollars in millions) |
| Income before provision for income taxes | | $ | 165.9 |
| | $ | 395.0 |
| | $ | 125.5 |
| | $ | 252.8 |
| | $ | 60.6 |
| | $ | 833.9 |
|
| Adjustments: | | | | | | | | | | | | |
| Equity-based compensation issued in conjunction with the initial public offering, acquisitions and strategic investments | | 58.3 |
| | 57.4 |
| | 50.1 |
| | 18.4 |
| | 0.3 |
| | 126.2 |
|
| Acquisition related charges, including amortization of intangibles and impairment | | 7.2 |
| | 10.5 |
| | 4.6 |
| | 9.2 |
| | 2.4 |
| | 26.7 |
|
Other non-operating expense (income)1 | | — |
| | (71.5 | ) | | 0.3 |
| | 0.3 |
| | 0.3 |
| | (70.6 | ) |
| Tax (expense) benefit associated with performance revenues | | (1.7 | ) | | (2.2 | ) | | (2.1 | ) | | 3.8 |
| | (12.7 | ) | | (13.2 | ) |
| Net income attributable to non-controlling interests in consolidated entities | | (27.6 | ) | | (25.1 | ) | | (11.0 | ) | | (16.7 | ) | | (14.5 | ) | | (67.3 | ) |
| Lease assignment and termination costs | | — |
| | — |
| | — |
| | 3.4 |
| | 63.5 |
| | 66.9 |
|
| Debt extinguishment costs | | — |
| | — |
| | — |
| | — |
| | 7.8 |
| | 7.8 |
|
| Severance and other adjustments | | 0.6 |
| | 2.3 |
| | 1.6 |
| | 0.9 |
| | 2.9 |
| | 7.7 |
|
| Economic Income | | $ | 202.7 |
| | $ | 366.4 |
| | $ | 169.0 |
| | $ | 272.1 |
| | $ | 110.6 |
| | $ | 918.1 |
|
| Net performance revenues | | 147.0 |
| | 337.3 |
| | 160.0 |
| | 249.6 |
| | 69.3 |
| | 816.2 |
|
| Principal investment income (loss) | | (35.3 | ) | | 40.7 |
| | 29.6 |
| | 25.3 |
| | 13.9 |
| | 109.5 |
|
| Equity-based compensation | | 30.4 |
| | 26.7 |
| | 37.7 |
| | 50.0 |
| | 51.7 |
| | 166.1 |
|
| Net interest | | 11.6 |
| | 11.6 |
| | 11.1 |
| | 10.6 |
| | 9.9 |
| | 43.2 |
|
| Reserve for Litigation and Contingencies | | (25.0 | ) | | — |
| | — |
| | — |
| | — |
| | — |
|
| Fee Related Earnings | | $ | 108.0 |
| | $ | 26.7 |
| | $ | 28.2 |
| | $ | 57.8 |
| | $ | 89.0 |
| | $ | 201.7 |
|
| Realized net performance revenues | | 216.9 |
| | 118.3 |
| | 103.1 |
| | 49.6 |
| | 123.9 |
| | 394.9 |
|
| Realized principal investment income (loss) | | (53.4 | ) | | 22.4 |
| | 18.7 |
| | 17.7 |
| | 7.0 |
| | 65.8 |
|
| Net interest | | (11.6 | ) | | (11.6 | ) | | (11.1 | ) | | (10.6 | ) | | (9.9 | ) | | (43.2 | ) |
| Distributable Earnings | | $ | 259.9 |
| | $ | 155.8 |
| | $ | 138.9 |
| | $ | 114.5 |
| | $ | 210.0 |
| | $ | 619.2 |
|
| |
| 1) | Included in other non-operating expense (income) for the three months ended December 31, 2017 is a $71.5 million adjustment for the revaluation of the tax receivable agreement liability as a result of the passage of the Tax Cuts and Jobs Act of 2017. |
The Carlyle Group L.P.
GAAP Balance Sheet (Unaudited)
|
| | | | | | | | | | | | | | | | |
| | | As of September 30, 2018 |
| | | Consolidated Operating Entities | | Consolidated Funds | | Eliminations | | Consolidated |
| | | (Dollars in millions) |
| Assets | | | | | | | | |
| Cash and cash equivalents | | $ | 1,238.2 |
| | $ | — |
| | $ | — |
| | $ | 1,238.2 |
|
| Cash and cash equivalents held at Consolidated Funds | | — |
| | 241.8 |
| | — |
| | 241.8 |
|
| Restricted cash | | 1.4 |
| | — |
| | — |
| | 1.4 |
|
| Corporate treasury investments | | 224.0 |
| | — |
| | — |
| | 224.0 |
|
| Investments, including performance allocations of $3,952.7 million | | 6,051.1 |
| | — |
| | (242.8 | ) | | 5,808.3 |
|
| Investments of Consolidated Funds | | — |
| | 5,095.4 |
| | — |
| | 5,095.4 |
|
| Due from affiliates and other receivables, net | | 328.1 |
| | — |
| | (6.3 | ) | | 321.8 |
|
| Due from affiliates and other receivables of Consolidated Funds, net | | — |
| | 132.6 |
| | — |
| | 132.6 |
|
| Fixed assets, net | | 93.4 |
| | — |
| | — |
| | 93.4 |
|
| Deposits and other | | 62.8 |
| | — |
| | — |
| | 62.8 |
|
| Intangible assets, net | | 27.2 |
| | — |
| | — |
| | 27.2 |
|
| Deferred tax assets | | 186.8 |
| | — |
| | — |
| | 186.8 |
|
| Total assets | | $ | 8,213.0 |
| | $ | 5,469.8 |
| | $ | (249.1 | ) | | $ | 13,433.7 |
|
| Liabilities and partners’ capital | | | | | | | | |
| Debt obligations | | $ | 1,558.4 |
| | $ | — |
| | $ | — |
| | $ | 1,558.4 |
|
| Loans payable of Consolidated Funds | | — |
| | 4,774.6 |
| | — |
| | 4,774.6 |
|
| Accounts payable, accrued expenses and other liabilities | | 475.7 |
| | — |
| | — |
| | 475.7 |
|
| Accrued compensation and benefits | | 2,532.0 |
| | — |
| | — |
| | 2,532.0 |
|
| Due to affiliates | | 160.7 |
| | — |
| | — |
| | 160.7 |
|
| Deferred revenue | | 266.5 |
| | — |
| | — |
| | 266.5 |
|
| Deferred tax liabilities | | 78.0 |
| | — |
| | — |
| | 78.0 |
|
| Other liabilities of Consolidated Funds | | — |
| | 445.4 |
| | — |
| | 445.4 |
|
| Accrued giveback obligations | | 63.2 |
| | — |
| | — |
| | 63.2 |
|
| Total liabilities | | 5,134.5 |
| | 5,220.0 |
| | — |
| | 10,354.5 |
|
| | | | | | | | | |
| Total partners’ capital | | 3,078.5 |
| | 249.8 |
| | (249.1 | ) | | 3,079.2 |
|
| Total liabilities and partners’ capital | | $ | 8,213.0 |
| | $ | 5,469.8 |
| | $ | (249.1 | ) | | $ | 13,433.7 |
|
NOTES
Non-GAAP Financial Measures
This press release contains financial measures that are calculated and presented on the basis of methodologies other than in accordance with generally accepted accounting principles in the United States of America. These non-GAAP financial measures should be considered in addition to and not as a substitute for, or superior to, financial measures presented in accordance with U.S. GAAP. The reasons management believes that these non-GAAP financial measures provide useful information are set forth in our most recent Annual Report on Form 10-K filed with the SEC.
Note on Carlyle Consolidated GAAP Results (Page 2)
| |
| (1) | Income before provision for income taxes is the GAAP measure that is most directly comparable to both Economic Income (EI) and Distributable Earnings, both of which management uses to measure the performance of the business. In most periods, income before provision for income taxes will be lower than EI principally due to excluding from EI equity compensation from awards issued in conjunction with the initial public offering, acquisitions and strategic investments, as well as other acquisition-related charges, including amortization of intangibles and impairment, corporate actions, and infrequently occurring or unusual events. In periods of positive earnings, net income attributable to The Carlyle Group L.P. Common Unitholders typically will be lower than EI as net income attributable to The Carlyle Group L.P. Common Unitholders only includes the portion of earnings (approximately 32% before taxes as of September 30, 2018) that is attributable to the public unitholders whereas the calculation of EI reflects the adjusted earnings attributable to all unitholders. A full reconciliation is included on page 29. |
Notes on Non-GAAP Operating Results (Page 3)
| |
| (1) | Represents the implied provision for income taxes that was calculated using a similar methodology as that used in calculating the provision for income taxes for The Carlyle Group L.P., without any reduction for non-controlling interests and without the impact of the Tax Cuts and Jobs Act of 2017. |
| |
| (2) | Represents the implied provision for current income taxes that was calculated using a similar methodology as that used in calculating the provision for current income taxes for The Carlyle Group L.P., without any reduction for non-controlling interests. |
| |
| (3) | Represents current corporate income taxes payable on Distributable Earnings allocated to Carlyle Holdings I GP Inc. and estimated current Tax Receivable Agreement payments owed. |
Notes on Carry Fund Appreciation and Net Accrued Performance Revenues (Page 4)
| |
| (1) | Appreciation/(Depreciation) represents unrealized gain/(loss) for the period on a total return basis before fees and expenses. The percentage of return is calculated as: ending remaining investment fair market value plus net investment outflow (sales proceeds minus net purchases) minus beginning remaining investment fair market value divided by beginning remaining investment fair market value. Fund only, does not include co-investment. |
| |
| (2) | We generally earn performance revenues from our carry funds representing a 20% allocation of profits generated on third-party capital, and on which the general partner receives a special residual allocation of income from limited partners, which we refer to as performance allocations, or carried interest, in the event that specified investment returns are achieved by the fund. Disclosures referring to carry funds also include the impact of certain commitments that do not earn carried interest, but are either part of, or associated with our carry funds. The rate of carried interest, as well as the share of carried interest allocated to Carlyle, may vary across the carry fund platform. |
| |
| (3) | Natural Resources is comprised of NGP, infrastructure, power and international energy funds. |
| |
| (4) | Other primarily reflects the impact of foreign exchange translation. |
Note on Carlyle All Segment Results (Page 5)
| |
| (1) | Includes a $(25) million reduction to the reserve for ongoing litigation and contingencies taken in Q3 2017, which was allocated to the segments in the following manner: Corporate Private Equity $(13) million, Real Assets $(6) million, Global Credit $(4) million and Investment Solutions $(2) million. |
Note on Investment Solutions (Page 9)
| |
| (1) | Includes Mezzanine funds. |
Notes on Total Assets Under Management (Page 11)
| |
| (1) | Primarily comprised of expiring dry powder, the impact of capital calls for fees and expenses and changes in gross asset value for our business development companies. |
| |
| (2) | Available capital refers to the amount of capital commitments available to be called for investments, which may be reduced for equity invested that is funded via fund credit facility and expected to be called from investors at a later date, plus any additional assets/liabilities at the fund level other than active investments. Amounts previously called may be added back to available capital following certain distributions. |
| |
| (3) | Remaining Fair Value reflects the unrealized carrying value of investments for all carry funds, related co-investment vehicles and separately managed accounts, the aggregate collateral balance of our CLOs and the gross asset value of our business development companies. |
| |
| (4) | The In-Carry Ratio represents percentage of Remaining Fair Value in an accrued carry position. |
| |
| (5) | Reflects the percentage of Remaining Fair Value attributable to investments originated in Q3 2014 or prior. Investments that include follow-on tranches are fully recognized based on the date of the initial investment activity. |
Notes on Balance Sheet Highlights (Page 12)
| |
| (1) | Corporate Treasury Investments represent investments in U.S. Treasury and government agency obligations, commercial paper, certificates of deposit, other investment grade securities and other investments with original maturities of greater than three months when purchased. |
| |
| (2) | Included in our on-balance sheet investments is approximately $292.7 million of loans attributable to Carlyle Holdings used to finance our investments in CLOs. |
Notes on Total AUM Roll Forward (Page 21)
| |
| (1) | New Commitments reflects the impact of gross fundraising during the period. For funds or vehicles denominated in foreign currencies, this reflects translation at the average quarterly rate, while the separately reported Fundraising metric is translated at the spot rate for each individual closing. |
| |
| (2) | Outflows includes distributions in our carry funds and related co-investment vehicles, the NGP management fee funds and separately managed accounts, as well as runoff of CLO collateral balances. |
| |
| (3) | Market Appreciation/(Depreciation) generally represents realized and unrealized gains (losses) on portfolio investments in our carry funds and related co-investment vehicles, the NGP management fee funds and separately managed accounts. |
| |
| (4) | Represents the impact of foreign exchange rate fluctuations on the translation of our non-U.S. dollar denominated funds. Activity during the period is translated at the average rate for the period. Ending balances are translated at the spot rate as of the period end. |
| |
| (5) | Includes expiring available capital, the impact of capital calls for fees and expenses, change in gross asset value for our business development companies and other changes in AUM. |
| |
| (6) | The fair market values for our Investment Solutions carry funds are based on the latest available valuations of the underlying limited partnership interests (in most cases as of June 30, 2018) as provided by their general partners, plus the net cash flows since the latest valuation, up to September 30, 2018. |
Notes on Fee-Earning AUM Roll Forward (Page 21)
| |
| (7) | Inflows represent limited partner capital raised and capital invested by our carry funds and the NGP management fee funds outside the investment period, weighted-average investment period or commitment fee period. Inflows do not include funds raised of $11 billion, which are not yet earning fees. |
| |
| (8) | Outflows represent limited partner distributions from our carry funds and the NGP management fee funds, changes in basis for our carry funds where the investment period, weighted-average investment period or commitment fee period has expired, and reductions for funds that are no longer calling for fees. |
| |
| (9) | Represents the change in the aggregate Fee-earning collateral balances at par of our CLOs/structured products, as of the quarterly cut-off dates. |
| |
| (10) | Market Appreciation/(Depreciation) represents realized and unrealized gains (losses) on portfolio investments in our carry funds based on the lower of cost or fair value and net asset value. |
| |
| (11) | Includes activity of funds with fees based on gross asset value. Represents the impact of foreign exchange rate fluctuations on the translation of our non-U.S. dollar denominated funds. Activity during the period is translated at the average rate for the period. Ending balances are translated at the spot rate as of the period end. |
| |
| (12) | Energy III, Energy IV, and Renew II (collectively, the “Legacy Energy Funds”), are managed with Riverstone Holdings LLC and its affiliates. Affiliates of both Carlyle and Riverstone act as investment advisers to each of the Legacy Energy Funds. Carlyle has a minority representation on the management committees of Energy IV and Renew II. Carlyle and Riverstone each hold half of the seats on the management committee of Energy III, but the investment period for this fund has expired and the remaining investments in such fund are being disposed of in the ordinary course of business. |
Notes on Fund Performance Tables (Page 22)
| |
| (1) | The data presented herein that provides “inception to date” performance results of our segments relates to the period following the formation of the first fund within each segment. For our Corporate Private Equity segment our first fund was formed in 1990. For our Real Assets segment our first fund was formed in 1997. For our Global Credit segment our first carry fund was formed in 2004. |
| |
| (2) | Represents the original cost of investments since inception of the fund. |
| |
| (3) | Represents all realized proceeds combined with remaining fair value, before management fees, expenses and carried interest. |
| |
| (4) | Multiple of invested capital (“MOIC”) represents total fair value, before management fees, expenses and carried interest, divided by cumulative invested capital. |
| |
| (5) | An investment is considered realized when the investment fund has completely exited, and ceases to own an interest in, the investment. An investment is considered partially realized when the total amount of proceeds received in respect of such investment, including dividends, interest or other distributions and/or return of capital, represents at least 85% of invested capital and such investment is not yet fully realized. Because part of our value creation strategy involves pursuing best exit alternatives, we believe information regarding Realized/Partially Realized MOIC and Gross IRR, when considered together with the other investment performance metrics presented, provides investors with meaningful information regarding our investment performance by removing the impact of investments where significant realization activity has not yet occurred. Realized/Partially Realized MOIC and Gross IRR have limitations as measures of investment performance, and should not be considered in isolation. Such limitations include the fact that these measures do not include the performance of earlier stage and other investments that do not satisfy the criteria provided above. The exclusion of such investments will have a positive impact on Realized/Partially Realized MOIC and Gross IRR in instances when the MOIC and Gross IRR in respect of such investments are less than the aggregate MOIC and Gross IRR. Our measurements of Realized/Partially Realized MOIC and Gross IRR may not be comparable to those of other |
companies that use similarly titled measures. We do not present Realized/Partially Realized performance information separately for funds that are still in the investment period because of the relatively insignificant level of realizations for funds of this type. However, to the extent such funds have had realizations, they are included in the Realized/Partially Realized performance information presented for Total Corporate Private Equity and Total Real Assets.
| |
| (6) | Fully Invested funds are past the expiration date of the investment period as defined in the respective limited partnership agreement. In instances where a successor fund has had its first capital call, the predecessor fund is categorized as fully invested. |
| |
| (7) | Gross Internal Rate of Return (“Gross IRR”) represents the annualized IRR for the period indicated on Limited Partner invested capital based on contributions, distributions and unrealized value before management fees, expenses and carried interest. |
| |
| (8) | Net Internal Rate of Return (“Net IRR”) represents the annualized IRR for the period indicated on Limited Partner invested capital based on contributions, distributions and unrealized value after management fees, expenses and carried interest. Fund level IRRs are based on aggregate Limited Partner cash flows, and this blended return may differ from that of individual Limited Partners. As a result, certain funds may generate accrued performance revenues with a blended Net IRR that is below the preferred return hurdle for that fund. |
| |
| (9) | Aggregate includes the following funds: CP I, CMG, CVP I, CVP II, CUSGF III, CEVP, CETP I, CAVP I, CAVP II, CAGP III, CSABF, CPF I, Mexico, CBPF, and MENA. |
| |
| (10) | Includes coinvestments and certain other stand-alone investments arranged by us. |
| |
| (11) | Aggregate, which is considered not meaningful, includes the following funds and their respective commencement dates: CSSAF (April 2012) , CCI (December 2012), CETP III (May 2014), CAGP V (May 2016), CGFSP III (June 2017), and CBPF II (November 2017). |
| |
| (12) | For funds marked “NM,” IRR may be positive or negative, but is not considered meaningful because of the limited time since initial investment and early stage of capital deployment. For funds marked “Neg,” IRR is negative as of reporting period end. |
| |
| (13) | For purposes of aggregation, funds that report in foreign currency have been converted to U.S. dollars at the reporting period spot rate. |
| |
| (14) | Aggregate includes the following funds: CRP I, CRP II, CAREP I, CAREP II, CRCP I, CPOCP, Renew I and Energy I. |
| |
| (15) | Aggregate, which is not meaningful, includes NGP GAP, CCR, and CER. The investment period commenced in December 2013 for NGP GAP, October 2016 for CCR, and December 2017 for CER. |
| |
| (16) | Aggregate includes the following funds: CMP I, CMP II, CSP I, and CASCOF. |
| |
| (17) | Represents the original cost of investments net of investment level recallable proceeds which is adjusted to reflect recyclability of invested capital for the purpose of calculating the fund MOIC. |
| |
| (18) | Fully Committed funds are past the expiration date of the commitment period as defined in the respective limited partnership agreement. |
| |
| (19) | Includes private equity and mezzanine primary fund investments, secondary fund investments and co-investments originated by the AlpInvest team, as well as real estate primary fund investments, secondary fund investments and co-investments originated by the Metropolitan Real Estate team. Excluded from the performance information shown are a) investments that were not originated by AlpInvest, and b) Direct Investments, which was spun off from AlpInvest in 2005. As of September 30, 2018, these excluded investments represent $0.2 billion of AUM at AlpInvest. |
| |
| (20) | To exclude the impact of FX, all AlpInvest foreign currency cash flows have been converted to Euro at the reporting period spot rate. |
| |
| (21) | Gross Internal Rate of Return ("Gross IRR") represents the annualized IRR for the period indicated on Limited Partner invested capital based on investment contributions, distributions and unrealized value of the underlying investments, before management fees, expenses and carried interest at the AlpInvest/Metropolitan Real Estate level. |
| |
| (22) | Aggregate includes Main Fund VII - Fund Investments, Main Fund VIII - Fund Investments, Main Fund IX - Fund Investments, Main Fund I - Co-Investments, Main Fund I - Mezzanine Investments, Main Fund IV - Mezzanine Investments, Main Fund V - Mezzanine Investments, AlpInvest CleanTech Funds and funds which are not included as part of a main fund. |
| |
| (23) | Represents the U.S. dollar equivalent balance translated at the spot rate as of period end. |
Notes on Remaining Fair Value Analysis (Page 26)
| |
| (1) | Remaining Fair Value reflects the unrealized carrying value of investments for Corporate Private Equity, Real Assets and Global Credit carry funds and related co-investment vehicles. Significant funds with remaining fair value of greater than $100 million are listed individually. |
| |
| (2) | Unrealized multiple of invested capital (“MOIC”) represents remaining fair market value, before management fees, expenses and carried interest, divided by remaining investment cost. |
| |
| (3) | Total MOIC represents total fair value (realized proceeds combined with remaining fair value), before management fees, expenses and carried interest, divided by cumulative invested capital. For certain funds, represents the original cost of investments net of investment-level recallable proceeds, which is adjusted to reflect recyclability of invested capital for the purpose of calculating the fund MOIC. |
| |
| (4) | Represents cumulative invested capital as of the reporting period divided by total commitments. Amount can be greater than 100% due to the re-investment of recallable distributions to fund investors. |
| |
| (5) | Fund has a net accrued performance revenue balance/(giveback obligation) as of the current quarter end, driven by a significant portion of the fund’s asset base. |
| |
| (6) | Fund has generated realized net performance revenues/(realized giveback) in the last twelve months. |
| |
| (7) | Represents the date of the first capital contribution for management fees. |
| |
| (8) | Aggregate includes the following funds: CMG, CP I, CP II, CP III, CEP I, CEP II, CAP I, CAP II, CBPF, CBPF II, CJP I, CEVP, CETP I, CETP II, CETP III, CCI, CAVP I, CAVP II, CAGP III, CAGP V, Mexico, MENA, CSABF, CSSAF, CPF, CGFSP I, CGFSP III, CVP I, CVP II, and CUSGF III. In Accrued Carry/(Clawback) and LTM Realized Carry not indicated because the indicator does not apply to each fund within the aggregate. |
| |
| (9) | Includes co-investments, prefund investments and certain other stand-alone investments arranged by us. In Accrued Carry/(Clawback) and LTM Realized Carry not indicated because the indicator does not apply to each fund within the aggregate. |
| |
| (10) | Aggregate includes the following funds: CRP I, CRP II, CRCP I, CEREP I, CEREP II, CER, CAREP I, CAREP II, CCR, CPOCP, CGIOF, NGP GAP, Energy I, Energy II and Renew I. In Accrued Carry/(Clawback) and LTM Realized Carry not indicated because the indicator does not apply to each fund within the aggregate. |
| |
| (11) | Aggregate includes the following funds: CSP I, CSP II, CMP I, CMP II, CSC, CCOF, and CASCOF. In Accrued Carry/(Clawback) and LTM Realized Carry not indicated because the indicator does not apply to each fund within the aggregate. |
| |
| (12) | For purposes of aggregation, funds that report in foreign currency have been converted to U.S. dollars at the reporting period spot rate. |