united states
securities and exchange commission
washington, d.c. 20549
form n-csr
certified shareholder report of registered management
investment companies
Investment Company Act file number 811-22638
Arrow Investments Trust
(Exact name of registrant as specified in charter)
6100 Chevy Chase Drive Suite 100 , Laurel MD 20707
(Address of principal executive offices) (Zip code)
Corporation Service Company
251 Little Falls Drive
Wilmington, Delaware 19808
(Name and address of agent for service)
Registrant's telephone number, including area code: 631-470-2619
Date of fiscal year end: 7/31
Date of reporting period: 7/31/22
Item 1. Reports to Stockholders.
Arrow DWA Tactical: International ETF
DWCR
Annual Report
July 31, 2022
1-877-277-6933
1-877-ARROW-FD
www.ArrowFunds.com
Dear Shareholder:
We are pleased to present this annual report for the Arrow DWA Tactical: International ETF (“DWCR” or the “Fund”) for the one-year period ended July 31, 2022.
DWCR seeks investment results that correspond generally to the performance, before fees and expenses, of the Dorsey Wright Country and Stock Momentum Total Return Index (the “Index”).
DWCR seeks long-term capital appreciation by tracking the investment results of the Index. The Fund seeks to achieve this objective by investing in the component securities of the Index and investments that are substantially identical to the economic characteristics of such component securities (e.g., depositary receipts, exchange traded instruments). From time to time, the Fund’s holdings may not precisely replicate the Index due to factors including, but not limited to, the availability of the holdings, liquidity and other market factors. The Index selection methodology consists of long positions in the equity markets of foreign countries exhibiting relatively strong momentum characteristics among the foreign universe. The foreign universe will be comprised of countries from the developed and emerging markets, excluding the United States. The strategy of the Index will allocate among such countries depending on global price trends.
The Index selects at least 10 countries with the highest relative strength among the universe of 41 foreign countries on a quarterly basis. The countries identified are given equal weight. For each country identified, up to 10 equity securities within that country universe are selected with the highest relative strength. The securities identified are equally weighted. The Index looks at a company’s location and economic ties in determining its country designation. Relative strength involves buying securities that have appreciated in price more than the other securities in the country universe and holding those securities until they underperform. The strategy is entirely based on market movement of the countries and relative strength of the securities within those countries, and there is no company fundamental data involved in the analysis. The process is systematic and is repeated quarterly.
DWCR was launched on December 28, 2017 and first traded on December 29, 2017. Its net assets were approximately $11.4 million as of July 31, 2022.
Management’s Discussion of Fund Performance
All performance is based on net asset value (“NAV”) and assumes the reinvestment of distributions, without regard to individual taxes or withholdings. Index returns assume reinvestment of distributions, but do not include fees. Individual performance will vary due to a number of factors, including, but not limited to, trading commissions, bid/ask spreads, premium/discounts relative to the NAV, time of trading and other potential market factors—please refer to the Fund’s prospectus for more information.
Over the rolling 12 month period ending July 31, 2022, the Fund had a return of -18.61% while the MSCI ACWI Ex USA Index was down -15.27% over the same period. While the domestic stock market was also weak over the same period (S&P 500 down -4.64%), it is not a proxy for the Fund’s portfolio strategy since DWCR excludes the U.S. equity markets and has a much broader investment universe, as it seeks the highest relative strength throughout global markets.
During the year, performance was not concentrated within any particular region, although the Fund was most heavily invested in Asia and Europe. Netherlands (9.45%), Norway (3.01%) and Brazil (0.98%) were the top performing countries, while Finland (-24.98%), South Korea (-24.91%) and Philippines (-20.31%) fared the worst.
The Fund generally pays distributions quarterly. The Fund paid income distributions of $0.1027 per share on record date September 17, 2021 and $0.4482 per share on record date December 27, 2021 during the period. A distribution was not paid in the first quarter of 2022. Income distributions were also paid of $0.3799 on record date June 17, 2022. A total of $0.9308 per share was paid during the period.
For more information about current performance, holdings or historical premiums/discounts, please visit our website at www.arrowfunds.com. We are grateful for your investment and continued confidence in our company.
Sincerely,

Joseph J. Barrato
Chief Executive Officer
Arrow Investment Advisors, LLC
September 2022
AD-09272222
Arrow DWA Tactical: International ETF
PORTFOLIO REVIEW (Unaudited)
July 31, 2022
The Fund’s performance figures* for the periods ended July 31, 2022, as compared to its benchmarks:
| | | | |
| | | | Annualized |
| | | Annualized | Since Inception** - |
| | One Year | Three Year | July 31, 2022 |
| Arrow DWA Tactical: International ETF - NAV | (18.61)% | 3.28% | 0.55% |
| Arrow DWA Tactical: International ETF - Market Price | (22.04)% | 2.33% | (0.62)% |
| Dorsey Wright Country and Stock Momentum Total Return Index | (15.79)% | 6.89% | 3.81% |
| MSCI ACWI Ex USA Index USD | (15.27)% | 2.91% | 1.14% |
| MSCI Emerging Markets Investable Market Index (IMI) USD | (19.42)% | 1.99% | (0.20)% |
| * | Past performance does not guarantee future results. The investment return and principal value of an investment in the Fund will fluctuate so that an investor’s shares, when sold, may be worth more or less than their original cost. The returns shown do not reflect the deduction of taxes that a shareholder would pay on Fund distributions or on the sale of Fund shares. Current performance of the Fund may be lower or higher than the performance quoted. Performance data current to the most recent month end may be obtained by visiting www.ArrowFunds.com or by calling 1-877-277-6933. The Fund’s per share net asset value or “NAV” is the value of one share of the Fund as calculated in accordance with the standard formula for valuing mutual fund shares. The NAV return is based on the NAV of the Fund and the market return is based on the market price per share of the Fund. The price used to calculate market return (“Market Price”) is determined by using the market price or bid/ask as of close of market on the primary stock exchange on which shares of the Fund are listed for trading, as of the time that the Fund’s NAV is calculated. Market Price and NAV returns assume that dividends and capital gain distributions have been reinvested in the Fund at Market Price and NAV, respectively. Information detailing the number of days the Market Price of the Fund was greater than the Fund’s NAV and the number of days it was less than the Fund’s NAV can be obtained at www.arrowfunds.com. The Fund’s total annual operating expenses, before fee waivers and/or expense reimbursements, is 2.14% per the December 1, 2021 and the April 27, 2022 prospectus. After fee waivers and/or expense reimbursements, the Fund’s total annual expenses are 1.11% of net assets per the December 1, 2021 and the April 27, 2022 prospectus. The Fund’s total return would have been lower had the investment advisor not waived a portion of the Fund’s expenses. Please see the Financial Highlights for a more recent expense ratio. |
| ** | As of the commencement of operations on December 28, 2017. |
Dorsey Wright Country and Stock Momentum Total Return Index is constructed pursuant to Dorsey, Wright & Associates proprietary methodology. The index has a relative strength focus that looks for the 10 strongest performing countries among a universe of 41 countries. Once the country is identified, the index methodology is designed to identify 10 companies that demonstrate powerful relative strength characteristics within that country. The Fund and the index are equally weighted and rebalanced and reconstituted quarterly. Investors cannot invest directly in an index.
The MSCI ACWI ex USA Index USD captures large and mid cap representation across 22 of 23 Developed Markets countries (excluding the US) and 25 Emerging Markets countries. With 2,330 constituents, the index covers approximately 85% of the global equity opportunity set outside the US. Investors cannot invest directly in an index.
The MSCI Emerging Markets Investable Market Index (IMI) USD captures large, mid and small cap representation across 27 Emerging Markets (EM) countries. With 3,206 constituents, the index covers approximately 99% of the free float-adjusted market capitalization in each country. Investors cannot invest directly in an index.
Comparison of the Change in Value of a $10,000 Investment
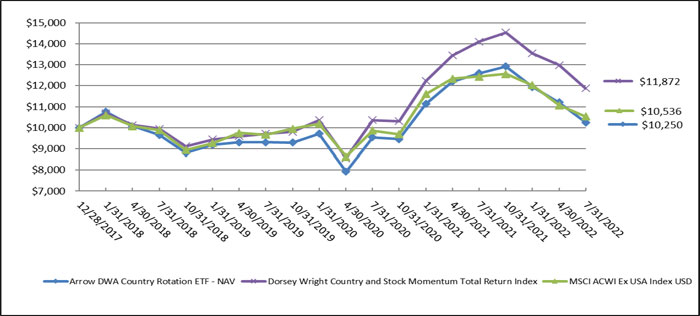
Arrow DWA Tactical: International ETF
PORTFOLIO REVIEW (Unaudited)(Continued)
July 31, 2022
The Fund’s Holdings by Asset Class and Country as of July 31, 2022 are as follows:
| Asset Class | | % of Net Assets | |
| Common Stocks | | | | |
| Financials | | | 34.8 | % |
| Materials | | | 12.3 | % |
| Industrials | | | 9.2 | % |
| Technology | | | 7.1 | % |
| Energy | | | 6.6 | % |
| Consumer Staples | | | 5.4 | % |
| Utilities | | | 4.4 | % |
| Consumer Discretionary | | | 3.4 | % |
| Real Estate | | | 3.1 | % |
| Communications | | | 2.3 | % |
| Health Care | | | 1.1 | % |
| Exchange Traded Fund Equity | | | 10.6 | % |
| Liabilities in Excess of Other Assets | | | -0.3 | % |
| | | | 100.0 | % |
| | | | | |
| Country Allocation | | % of Net Assets | |
| Australia | | | 10.7 | % |
| India | | | 10.6 | % |
| Canada | | | 10.3 | % |
| Indonesia | | | 10.1 | % |
| Mexico | | | 10.0 | % |
| Norway | | | 10.0 | % |
| Taiwan | | | 9.8 | % |
| Philippines | | | 9.4 | % |
| South Africa | | | 9.3 | % |
| Israel | | | 8.3 | % |
| Iceland | | | 1.8 | % |
| Chile | | | 0.0 | % * |
| Liabilities in Excess of Other Assets | | | -0.3 | % |
| | | | 100.0 | % |
Please refer to the Schedule of Investments in this Annual Report for a detailed listing of the Fund’s holdings.
| ARROW DWA TACTICAL: INTERNATIONAL ETF |
| SCHEDULE OF INVESTMENTS |
| July 31, 2022 |
| Shares | | | | | Fair Value | |
| | | | | COMMON STOCKS — 89.7% | | | | |
| | | | | AEROSPACE & DEFENSE - 1.8% | | | | |
| | 907 | | | Elbit Systems Ltd. | | $ | 206,739 | |
| | | | | | | | | |
| | | | | ASSET MANAGEMENT - 1.0% | | | | |
| | 3,235 | | | Ninety One Ltd. | | | 7,903 | |
| | 20,179 | | | PSG Group Ltd.(a), | | | 107,580 | |
| | | | | | | | 115,483 | |
| | | | | BANKING - 28.1% | | | | |
| | 10,625 | | | Absa Group Ltd. | | | 108,699 | |
| | 1 | | | Banco de Credito e Inversiones S.A. | | | 30 | |
| | 217,138 | | | Bank Central Asia Tbk P.T. | | | 107,588 | |
| | 21,058 | | | Bank Hapoalim BM | | | 192,963 | |
| | 19,736 | | | Bank Leumi Le-Israel BM | | | 188,509 | |
| | 205,074 | | | Bank Mandiri Persero Tbk P.T. | | | 114,399 | |
| | 197,128 | | | Bank Negara Indonesia Persero Tbk P.T. | | | 104,318 | |
| | 93,235 | | | Bank of the Philippine Islands | | | 156,598 | |
| | 388,800 | | | Bank Rakyat Indonesia Persero Tbk P.T. | | | 114,276 | |
| | 71,792 | | | BDO Unibank, Inc. | | | 154,942 | |
| | 843 | | | Capitec Bank Holdings Ltd. | | | 101,046 | |
| | 1,795 | | | Commonwealth Bank of Australia | | | 126,385 | |
| | 7,854 | | | DNB Bank ASA | | | 154,057 | |
| | 121,603 | | | E.Sun Financial Holding Company Ltd. | | | 111,406 | |
| | 19,466 | | | Grupo Financiero Banorte S.A.B. de C.V. | | | 110,947 | |
| | 63,521 | | | Grupo Financiero Inbursa S.A.B. de C.V.(a) | | | 117,387 | |
| | 20,258 | | | Investec Ltd. | | | 108,160 | |
| | 34,486 | | | Israel Discount Bank Ltd., Class A | | | 192,180 | |
| | 172,772 | | | Metropolitan Bank & Trust Company | | | 151,647 | |
| | 5,564 | | | Mizrahi Tefahot Bank Ltd. | | | 203,057 | |
| | 5,856 | | | National Australia Bank Ltd. | | | 125,205 | |
| | 8,032 | | | Nedbank Group Ltd. | | | 104,829 | |
| | 22,058 | | | Regional S.A.B. de C.V. | | | 120,786 | |
| | 1,123 | | | Royal Bank of Canada | | | 109,501 | |
| | 1,655 | | | Toronto-Dominion Bank (The) | | | 107,505 | |
| | | | | | | | 3,186,420 | |
See accompanying notes to financial statements.
| ARROW DWA TACTICAL: INTERNATIONAL ETF |
| SCHEDULE OF INVESTMENTS (Continued) |
| July 31, 2022 |
| Shares | | | | | Fair Value | |
| | | | | COMMON STOCKS — 89.7% (Continued) | | | | |
| | | | | BIOTECH & PHARMA - 1.1% | | | | |
| | 625 | | | CSL Ltd. | | $ | 126,572 | |
| | | | | | | | | |
| | | | | CHEMICALS - 5.5% | | | | |
| | 164,624 | | | Alfa S.A.B. de C.V. | | | 113,146 | |
| | 18,652 | | | ICL Group Ltd. | | | 166,088 | |
| | 48,751 | | | Incitec Pivot Ltd. | | | 122,627 | |
| | 4,287 | | | Sasol Ltd.(a), | | | 90,195 | |
| | 3,068 | | | Yara International ASA | | | 130,452 | |
| | | | | | | | 622,508 | |
| | | | | ELECTRIC UTILITIES - 3.3% | | | | |
| | 2,458 | | | Fortis, Inc. | | | 116,113 | |
| | 23,549 | | | Manila Electric Company | | | 144,602 | |
| | 28,218 | | | Origin Energy Ltd. | | | 117,115 | |
| | | | | | | | 377,830 | |
| | | | | ELECTRICAL EQUIPMENT - 1.0% | | | | |
| | 2,336 | | | Voltronic Power Technology Corporation | | | 113,621 | |
| | | | | | | | | |
| | | | | ENGINEERING & CONSTRUCTION - 1.0% | | | | |
| | 570,916 | | | Tower Bersama Infrastructure Tbk P.T. | | | 118,155 | |
| | | | | | | | | |
| | | | | FOOD - 2.4% | | | | |
| | 5,777 | | | Mowi ASA | | | 132,800 | |
| | 2,004 | | | Salmar ASA | | | 142,950 | |
| | | | | | | | 275,750 | |
| | | | | FORESTRY, PAPER & WOOD PRODUCTS - 1.9% | | | | |
| | 214,990 | | | Indah Kiat Pulp & Paper Corp Tbk P.T. | | | 110,147 | |
| | 31,963 | | | Sappi Ltd.(a), | | | 105,781 | |
| | | | | | | | 215,928 | |
| | | | | GAS & WATER UTILITIES - 1.1% | | | | |
| | 15,209 | | | APA Group | | | 123,802 | |
| | | | | | | | | |
| | | | | INDUSTRIAL REIT - 2.1% | | | | |
| | 1,823 | | | Granite Real Estate Investment Trust | | | 115,002 | |
See accompanying notes to financial statements.
| ARROW DWA TACTICAL: INTERNATIONAL ETF |
| SCHEDULE OF INVESTMENTS (Continued) |
| July 31, 2022 |
| Shares | | | | | Fair Value | |
| | | | | COMMON STOCKS — 89.7% (Continued) | | | | |
| | | | | INDUSTRIAL REIT - 2.1% (Continued) | | | | |
| | 44,353 | | | Prologis Property Mexico S.A. de CV | | $ | 124,220 | |
| | | | | | | | 239,222 | |
| | | | | INDUSTRIAL SUPPORT SERVICES - 2.1% | | | | |
| | 21,755 | | | Topco Scientific Company Ltd. | | | 111,612 | |
| | 59,328 | | | United Tractors Tbk P.T. | | | 129,183 | |
| | | | | | | | 240,795 | |
| | | | | INSTITUTIONAL FINANCIAL SERVICES - 2.1% | | | | |
| | 2,014 | | | ASX Ltd. | | | 124,201 | |
| | 6,626 | | | Computershare Ltd. | | | 115,649 | |
| | | | | | | | 239,850 | |
| | | | | INSURANCE - 3.6% | | | | |
| | 7,065 | | | Gjensidige Forsikring ASA | | | 147,205 | |
| | 24,598 | | | Qualitas Controladora S.A.B. de C.V. | | | 103,609 | |
| | 18,270 | | | Storebrand ASA | | | 152,383 | |
| | | | | | | | 403,197 | |
| | | | | LEISURE FACILITIES & SERVICES - 2.5% | | | | |
| | 60,926 | | | Alsea S.A.B. de C.V.(a) | | | 118,868 | |
| | 43,587 | | | Jollibee Foods Corporation | | | 158,384 | |
| | | | | | | | 277,252 | |
| | | | | METALS & MINING - 4.9% | | | | |
| | 561,573 | | | Adaro Energy Tbk P.T. | | | 123,036 | |
| | 3,927 | | | BHP Group Ltd. | | | 106,132 | |
| | 8,638 | | | Exxaro Resources Ltd. | | | 104,936 | |
| | 25,247 | | | Grupo Mexico S.A.B. de C.V. - Series B | | | 100,064 | |
| | 3,261 | | | Mineral Resources Ltd. | | | 122,447 | |
| | | | | | | | 556,615 | |
| | | | | MULTI ASSET CLASS REITS - 1.0% | | | | |
| | 474,508 | | | Redefine Properties Ltd. | | | 116,493 | |
| | | | | | | | | |
| | | | | OIL & GAS PRODUCERS - 6.6% | | | | |
| | 3,684 | | | Aker BP ASA | | | 127,259 | |
| | 5,759 | | | Cenovus Energy, Inc. | | | 109,736 | |
| | 3,851 | | | Equinor ASA | | | 147,011 | |
| | 12,627 | | | NuVista Energy Ltd.(a) | | | 112,315 | |
See accompanying notes to financial statements.
| ARROW DWA TACTICAL: INTERNATIONAL ETF |
| SCHEDULE OF INVESTMENTS (Continued) |
| July 31, 2022 |
| Shares | | | | | Fair Value | |
| | | | | COMMON STOCKS — 89.7% (Continued) | | | | |
| | | | | OIL & GAS PRODUCERS - 6.6% (Continued) | | | | |
| | 2,126 | | | Tourmaline Oil Corporation | | $ | 133,203 | |
| | 15,317 | | | Whitecap Resources, Inc. | | | 117,104 | |
| | | | | | | | 746,628 | |
| | | | | RETAIL - CONSUMER STAPLES - 3.0% | | | | |
| | 6,162 | | | Clicks Group Ltd. | | | 103,749 | |
| | 1,939 | | | Dollarama, Inc. | | | 117,519 | |
| | 32,654 | | | Wal-Mart de Mexico S.A.B. de C.V. | | | 118,720 | |
| | | | | | | | 339,988 | |
| | | | | RETAIL - DISCRETIONARY - 0.9% | | | | |
| | 249,103 | | | Astra International Tbk P.T. | | | 106,214 | |
| | | | | | | | | |
| | | | | SEMICONDUCTORS - 1.0% | | | | |
| | 6,675 | | | Taiwan Semiconductor Manufacturing Company Ltd. | | | 113,188 | |
| | | | | | | | | |
| | | | | SOFTWARE - 1.2% | | | | |
| | 77 | | | Constellation Software, Inc. | | | 130,989 | |
| | | | | | | | | |
| | | | | TECHNOLOGY HARDWARE - 4.9% | | | | |
| | 9,772 | | | Advantech Company Ltd. | | | 111,500 | |
| | 41,123 | | | Gold Circuit Electronics Ltd. | | | 111,380 | |
| | 4,676 | | | Lotes Company Ltd. | | | 108,733 | |
| | 115,318 | | | Qisda Corporation | | | 109,874 | |
| | 13,047 | | | Sinbon Electronics Company Ltd. | | | 120,835 | |
| | | | | | | | 562,322 | |
| | | | | TELECOMMUNICATIONS - 2.3% | | | | |
| | 4,881 | | | PLDT, Inc. | | | 145,981 | |
| | 401,782 | | | Telekomunikasi Indonesia Persero Tbk P.T. | | | 114,570 | |
| | | | | | | | 260,551 | |
| | | | | TRANSPORTATION & LOGISTICS - 3.3% | | | | |
| | 7,898 | | | Grupo Aeroportuario del Pacifico S.A.B. de C.V. | | | 106,919 | |
| | 44,202 | | | International Container Terminal Services, Inc. | | | 155,031 | |
| | 2,013 | | | Wan Hai Lines Ltd. | | | 7,174 | |
See accompanying notes to financial statements.
| ARROW DWA TACTICAL: INTERNATIONAL ETF |
| SCHEDULE OF INVESTMENTS (Continued) |
| July 31, 2022 |
| Shares | | | | | Fair Value | |
| | | | | | | |
| | | | | COMMON STOCKS — 89.7% (Continued) | | | | |
| | | | | TRANSPORTATION & LOGISTICS - 3.3% (Continued) | | | | |
| | 32,585 | | | Yang Ming Marine Transport Corporation | | $ | 97,265 | |
| | | | | | | | 366,389 | |
| | | | | | | | | |
| | | | | TOTAL COMMON STOCKS (Cost $10,832,692) | | | 10,182,501 | |
| | | | | | | | | |
| | | | | EXCHANGE-TRADED FUNDS — 10.6% | | | | |
| | | | | EQUITY - 10.6% | | | | |
| | 24,296 | | | iShares MSCI India ETF | | | 1,036,832 | |
| | 5,385 | | | WisdomTree India Earnings Fund | | | 171,997 | |
| | | | | TOTAL EXCHANGE-TRADED FUNDS (Cost $1,171,190) | | | 1,208,829 | |
| | | | | | | | | |
| | | | | TOTAL INVESTMENTS - 100.3% (Cost $12,003,882) | | $ | 11,391,330 | |
| | | | | LIABILITIES IN EXCESS OF OTHER ASSETS - (0.3)% | | | (37,045 | ) |
| | | | | NET ASSETS - 100.0% | | $ | 11,354,285 | |
| ETF | - Exchange-Traded Fund |
| MSCI | - Morgan Stanley Capital International |
| REIT | - Real Estate Investment Trust |
| S/A | - Société Anonyme SA de |
| CV | - Sociedad Anonima de Capital Variable |
| (a) | - Non-income producing security. |
See accompanying notes to financial statements.
| Arrow DWA Tactical: International ETF |
| STATEMENT OF ASSETS AND LIABILITIES |
| July 31, 2022 |
| ASSETS | | | | |
| Investment securities: | | | | |
| At cost | | $ | 12,003,882 | |
| At value | | $ | 11,391,330 | |
| Foreign cash (Cost $9,766) | | | 10,421 | |
| Dividends and interest receivable | | | 68,717 | |
| Due from Advisor | | | 527 | |
| TOTAL ASSETS | | | 11,470,995 | |
| | | | | |
| LIABILITIES | | | | |
| Due to custodian | | | 65,592 | |
| Custody fees payable | | | 27,006 | |
| Audit fees payable | | | 13,204 | |
| Payable to related parties | | | 9,289 | |
| Accrued expenses and other liabilities | | | 1,619 | |
| TOTAL LIABILITIES | | | 116,710 | |
| NET ASSETS | | $ | 11,354,285 | |
| | | | | |
| Net Assets Consist Of: | | | | |
| Paid in capital | | $ | 12,882,011 | |
| Accumulated deficit | | | (1,527,726 | ) |
| NET ASSETS | | $ | 11,354,285 | |
| | | | | |
| Net Asset Value Per Share: | | | | |
| Net Assets | | $ | 11,354,285 | |
| Shares of beneficial interest outstanding ($0 par value, unlimited shares authorized) | | | 400,000 | |
| Net asset value (Net Assets ÷ Shares Outstanding) | | $ | 28.39 | |
See accompanying notes to financial statements.
| Arrow DWA Tactical: International ETF |
| STATEMENT OF OPERATIONS |
| For the Year Ended July 31, 2022 |
| INVESTMENT INCOME | | | | |
| Dividends (net of foreign withholding tax of $88,312) | | $ | 476,751 | |
| TOTAL INVESTMENT INCOME | | | 476,751 | |
| | | | | |
| EXPENSES | | | | |
| Investment advisory fees | | | 104,585 | |
| Administrative services fees | | | 59,504 | |
| Custodian fees | | | 56,224 | |
| Transfer agent fees | | | 15,626 | |
| Audit Fees | | | 13,198 | |
| Legal Fees | | | 7,374 | |
| Printing and postage expenses | | | 6,137 | |
| Trustees fees and expenses | | | 4,687 | |
| Professional fees | | | 1,737 | |
| Insurance expenses | | | 629 | |
| Other expenses | | | 3,646 | |
| TOTAL EXPENSES | | | 273,347 | |
| Less: Fees waived/ expenses reimbursed by the Advisor | | | (115,505 | ) |
| NET EXPENSES | | | 157,842 | |
| | | | | |
| NET INVESTMENT INCOME | | | 318,909 | |
| | | | | |
| REALIZED AND UNREALIZED GAIN (LOSS) ON INVESTMENTS | | | | |
| Net realized gain (loss) on: | | | | |
| In-kind redemptions | | | (184,493 | ) |
| Investments | | | 181,133 | |
| Foreign currency transactions | | | (106,008 | ) |
| | | | (109,368 | ) |
| Net change in unrealized depreciation on: | | | | |
| Investments | | | (3,210,739 | ) |
| Foreign currency translations | | | (5,678 | ) |
| | | | (3,216,417 | ) |
| NET REALIZED AND UNREALIZED LOSS ON INVESTMENTS | | | (3,325,785 | ) |
| | | | | |
| NET DECREASE IN NET ASSETS RESULTING FROM OPERATIONS | | $ | (3,006,876 | ) |
See accompanying notes to financial statements.
| Arrow DWA Tactical: International ETF |
| STATEMENTS OF CHANGES IN NET ASSETS |
| | | For The | | | For The | |
| | | Year Ended | | | Year Ended | |
| | | July 31, 2022 | | | July 31, 2021 | |
| FROM OPERATIONS | | | | | | | | |
| Net investment income | | $ | 318,909 | | | $ | 83,205 | |
| Net realized gain (loss) on investments, in-kind redemptions, and foreign currency transactions | | | (109,368 | ) | | | 2,699,853 | |
| Net change in unrealized appreciation (depreciation) on investments and foreign currency translations | | | (3,216,417 | ) | | | 893,483 | |
| Net increase (decrease) in net assets resulting from operations | | | (3,006,876 | ) | | | 3,676,541 | |
| | | | | | | | | |
| DISTRIBUTIONS TO SHAREHOLDERS | | | | | | | | |
| Total distributions paid | | | (418,860 | ) | | | (99,325 | ) |
| Net decrease in net assets resulting from distributions to shareholders | | | (418,860 | ) | | | (99,325 | ) |
| | | | | | | | | |
| FROM SHARES OF BENEFICIAL INTEREST | | | | | | | | |
| Proceeds from shares sold | | | — | | | | 1,637,653 | |
| Cost of shares redeemed | | | (1,371,568 | ) | | | — | |
| Net increase (decrease) in net assets resulting from shares of beneficial interest | | | (1,371,568 | ) | | | 1,637,653 | |
| | | | | | | | | |
| TOTAL INCREASE (DECREASE) IN NET ASSETS | | | (4,797,304 | ) | | | 5,214,869 | |
| | | | | | | | | |
| NET ASSETS | | | | | | | | |
| Beginning of Year | | | 16,151,589 | | | | 10,936,720 | |
| End of Year | | $ | 11,354,285 | | | $ | 16,151,589 | |
| | | | | | | | | |
| SHARE ACTIVITY | | | | | | | | |
| Shares Sold | | | — | | | | 50,000 | |
| Shares Redeemed | | | (50,000 | ) | | | — | |
| Net increase (decrease) in shares of beneficial interest outstanding | | | (50,000 | ) | | | 50,000 | |
See accompanying notes to financial statements.
| Arrow DWA Tactical: International ETF |
| FINANCIAL HIGHLIGHTS |
Per Share Data and Ratios for a Share of Beneficial Interest Outstanding Throughout each Period
| | | For The | | | For The | | | For The | | | For The | | | For The | |
| | | Year Ended | | | Year Ended | | | Year Ended | | | Year Ended | | | Period Ended | |
| | | July 31, 2022 | | | July 31, 2021 | | | July 31, 2020 | | | July 31, 2019 | | | July 31, 2018 (1) | |
| Net asset value, beginning of period | | $ | 35.89 | | | $ | 27.34 | | | $ | 27.12 | | | $ | 28.97 | | | $ | 30.00 | |
| Activity from investment operations: | | | | | | | | | | | | | | | | | | | | |
| Net investment income (2) | | | 0.72 | | | | 0.20 | | | | 0.40 | | | | 0.59 | | | | 0.44 | |
| Net realized and unrealized gain (loss) on investments and foreign currency | | | (7.29 | ) | | | 8.58 | | | | 0.25 | | | | (1.69 | ) | | | (1.47 | ) |
| Total from investment operations | | | (6.57 | ) | | | 8.78 | | | | 0.65 | | | | (1.10 | ) | | | (1.03 | ) |
| Less distributions from: | | | | | | | | | | | | | | | | | | | | |
| Net investment income | | | (0.93 | ) | | | (0.23 | ) | | | (0.37 | ) | | | (0.75 | ) | | | — | |
| Return of capital | | | — | | | | — | | | | (0.06 | ) | | | — | | | | — | |
| Total distributions | | | (0.93 | ) | | | (0.23 | ) | | | (0.43 | ) | | | (0.75 | ) | | | — | |
| Net asset value, end of period | | $ | 28.39 | | | $ | 35.89 | | | $ | 27.34 | | | $ | 27.12 | | | $ | 28.97 | |
| Total return (4)(6) | | | (18.61 | )% | | | 32.14 | % | | | 2.43 | % | | | (3.61 | )% | | | (3.43 | )% |
| Net assets, at end of period (000s) | | $ | 11,354 | | | $ | 16,152 | | | $ | 10,937 | | | $ | 14,914 | | | $ | 20,279 | |
| Ratio of gross expenses to average net assets (3)(7)(9) | | | 1.83 | % (14) | | | 2.10 | % (13) | | | 2.18 | % (12) | | | 1.60 | % (11) | | | 1.86 | % (10) |
| Ratio of net expenses to average net assets (3)(7) | | | 1.06 | % (14) | | | 1.02 | % (13) | | | 1.15 | % (12) | | | 0.87 | % (11) | | | 0.79 | % (10) |
| Ratio of net investment income to average net assets (3)(7)(8) | | | 2.14 | % | | | 0.62 | % | | | 1.54 | % | | | 2.17 | % | | | 2.50 | % |
| Portfolio Turnover Rate (4)(5) | | | 164 | % | | | 176 | % | | | 182 | % | | | 146 | % | | | 136 | % |
| (1) | The Arrow DWA Tactical: International ETF commenced operations on December 28, 2017. |
| (2) | Per share amounts calculated using the average shares method, which more appropriately presents the per share data for the period. |
| (3) | Annualized for periods less than one year. |
| (4) | Not annualized for periods less than one year. |
| (5) | Portfolio turnover rate excludes portfolio securities received or delivered as a result of processing capital share transactions in Creation Units. |
| (6) | Total return is calculated assuming a purchase of shares at net asset value on the first day and a sale at net asset value on the last day of the period. Distributions are assumed, for the purpose of this calculation, to be reinvested at the ex-dividend date net asset value per share on their respective payment dates. Had Arrow Investment Advisors, LLC not waived fees or reimbursed a portion of the expenses, total returns would have been lower. |
| (7) | Does not include the Fund’s share of the expenses of the underlying investment companies in which the Fund invests. |
| (8) | The recognition of investment income by the Fund is affected by the timing and declaration of dividends by the underlying investment companies in which the Fund invests. |
| (9) | Represents the ratio of expenses to average net assets absent of fee waivers and/or expense reimbursements by Arrow Investment Advisors, LLC. |
| (10) | Includes 0.05% for the period ended July 31, 2018 attributed to interest expense, which is not subject to waiver by Arrow Investment Advisors, LLC. |
| (11) | Includes 0.12% for the year ended July 31, 2019 attributed to interest expense and foreign custody transaction costs, which are not subject to waiver by the Arrow Investment Advisors, LLC. |
| (12) | Includes 0.40% for the year ended July 31, 2020 attributed to interest expense and foreign custody transaction costs, which are not subject to waiver by the Arrow Investment Advisors, LLC. |
| (13) | Includes 0.12% for the year ended July 31, 2021 attributed to interest expense and foreign custody transaction costs, which are not subject to waiver by the Arrow Investment Advisors, LLC. |
| (14) | Includes 0.11% for the year ended July 31, 2022 attributed to interest expense and foreign custody transaction costs, which are not subject to waiver by the Arrow Investment Advisors, LLC. |
See accompanying notes to financial statements.
| Arrow DWA Tactical: International ETF |
| NOTES TO FINANCIAL STATEMENTS |
| July 31, 2022 |
The Arrow DWA Tactical: International ETF (the “Fund”), formerly Arrow DWA Country Rotation ETF, is a diversified series of Arrow Investments Trust, a statutory trust organized under the laws of the State of Delaware on August 2, 2011, and is registered under the Investment Company Act of 1940, as amended (the “1940 Act”), as an open-end management investment company. The Fund’s investment objective is to seek long-term capital appreciation by tracking the investment results of the Dorsey Wright Country and Stock Momentum Index (the “Index”). The investment objective is non-fundamental. The Fund commenced operations on December 28, 2017.
| 2. | SIGNIFICANT ACCOUNTING POLICIES |
The following is a summary of significant accounting policies followed by the Fund in preparation of its financial statements. These policies are in conformity with accounting principles generally accepted in the United States of America (“GAAP”). The preparation of financial statements requires management to make estimates and assumptions that affect the reported amounts of assets and liabilities and disclosure of contingent assets and liabilities at the date of the financial statements and the reported amounts of income and expenses for the period. Actual results could differ from those estimates. The Fund is an investment company and accordingly follows the investment company accounting and reporting guidance of the Financial Accounting Standards Board (“FASB”) Accounting Standards Codification Topic 946 “Financial Services-Investment Companies” including FASB Accounting Standards Update (“ASU”) 2013-08.
Securities valuation – Securities listed on an exchange (including exchange-traded funds (“ETFs”)) are valued at the last reported sale price at the close of the regular trading session of the exchange on the business day the value is being determined, or in the case of securities listed on NASDAQ at the NASDAQ Official Closing Price (“NOCP”). In the absence of a sale, such securities shall be valued at the last bid price on the day of valuation. Debt securities (other than short-term obligations) are valued each day by an independent pricing service approved by the Board of Trustees (the “Board”) using methods which include current market quotations from a major market maker in the securities and based on methods which include the consideration of yields or prices of securities of comparable quality, coupon, maturity and type. Investments valued in currencies other than the U.S. dollar are converted to U.S. dollars using exchange rates obtained from pricing services. If market quotations are not readily available or if Arrow Investment Advisors, LLC (the “Advisor”) believes the market quotations are not reflective of market value, securities will be valued at their fair value as determined in good faith by the Advisor and in accordance with the Trust’s Portfolio Securities Valuation Procedures (the “Procedures”), subject to review by the Board. The Board will review the fair value method in use for securities requiring a fair market value determination and supporting documentation from the Advisor at least quarterly for consistency with the Procedures. The Procedures consider, among others, the following factors to determine a security’s fair value: the nature and pricing history (if any) of the security; whether any dealer quotations for the security are available; and possible valuation methodologies that could be used to determine the fair value of the security. Fair value may also be used by the Board if extraordinary events occur after the close of the relevant world market but prior to the NYSE close. Short- term debt obligations having 60 days or less remaining until maturity, at time of purchase, may be valued at amortized cost.
| Arrow DWA Tactical: International ETF |
| NOTES TO FINANCIAL STATEMENTS (Continued) |
| July 31, 2022 |
Valuation of Fund of Funds – The Fund may invest in portfolios of open-end or closed-end investment companies (the “Underlying Funds”). Underlying Funds that are open-end funds (other than ETFs) are valued at their respective net asset values (“NAV”) as reported by such investment companies. The Underlying Funds value securities in their portfolios for which market quotations are readily available at their market values (generally the last reported sale price) and all other securities and assets at their fair value by the methods established by the boards of the Underlying Funds. The shares of many closed-end investment companies, after their initial public offering, frequently trade at a price per share, which is different than the net asset value per share. The difference represents a market premium or market discount of such shares. There can be no assurances that the market discount or market premium on shares of any Underlying Funds that are closed-end investment companies purchased by the Fund will not change.
Exchange Traded Funds – The Fund may invest in ETFs. An ETF is a type of open-end fund, however, unlike a mutual fund, its shares are bought and sold on a securities exchange at market price and only certain financial institutions called authorized participants may buy and redeem shares of the ETF at net asset value. ETF shares can trade at either a premium or discount to net asset value. Each ETF, like a mutual fund, is subject to specific risks depending on the type of strategy (actively managed or passively tracking an index) and the composition of its underlying holdings. Investing in an ETF involves substantially the same risks as investing directly in the ETF’s underlying holdings. ETFs pay fees and incur operating expenses, which reduce the total return earned by the ETFs from their underlying holdings. An ETF may not achieve its investment objective or execute its investment strategy effectively, which may adversely affect the Fund’s performance.
The Fund utilizes various methods to measure the fair value of all of its investments on a recurring basis.
GAAP establishes a hierarchy that prioritizes inputs to valuation methods. The three levels of input are:
Level 1 – Unadjusted quoted prices in active markets for identical assets and liabilities that the Fund has the ability to access.
Level 2 – Observable inputs other than quoted prices included in Level 1 that are observable for the asset or liability, either directly or indirectly. These inputs may include quoted prices for the identical instrument in an inactive market, prices for similar instruments, interest rates, prepayment speeds, credit risk, yield curves, default rates and similar data.
Level 3 – Unobservable inputs for the asset or liability, to the extent relevant observable inputs are not available, representing the Fund’s own assumptions about the assumptions a market participant would use in valuing the asset or liability, and would be based on the best information available.
The availability of observable inputs can vary from security to security and is affected by a wide variety of factors, including, for example, the type of security, whether the security is new and not yet established in the marketplace, the liquidity of markets, and other characteristics particular to the security. To the extent that valuation is based on models or inputs that are less observable or unobservable in the market, the determination of fair value requires more judgment. Accordingly, the degree of judgment exercised in determining fair value is greatest for instruments categorized in Level 3.
| Arrow DWA Tactical: International ETF |
| NOTES TO FINANCIAL STATEMENTS (Continued) |
| July 31, 2022 |
The inputs used to measure fair value may fall into different levels of the fair value hierarchy. In such cases, for disclosure purposes, the level in the fair value hierarchy within which the fair value measurement falls in its entirety, is determined based on the lowest level input that is significant to the fair value measurement in its entirety.
The inputs or methodology used for valuing securities are not necessarily an indication of the risk associated with investing in those securities. The following table summarizes the inputs used as of July 31, 2022 for the Fund’s assets measured at fair value:
| Assets * | | Level 1 | | | Level 2 | | | Level 3 | | | Total | |
| Common Stocks | | $ | 10,182,501 | | | $ | — | | | $ | — | | | $ | 10,182,501 | |
| Exchange Traded Funds | | | 1,208,829 | | | | — | | | | — | | | | 1,208,829 | |
| Total | | $ | 11,391,330 | | | $ | — | | | $ | — | | | $ | 11,391,330 | |
The Fund did not hold any Level 3 securities for the year ended July 31, 2022.
| * | See Schedule of Investments for classification. |
Security transactions and related income – Security transactions are accounted for on the trade date. Interest income is recognized on an accrual basis. Discounts are accreted and premiums are amortized on securities purchased over the lives of the respective securities. Dividend income is recorded on the ex-dividend date. Realized gains or losses from sales of securities are determined by comparing the identified cost of the security lot sold with the net sales proceeds.
Dividends and distributions to shareholders – Dividends from net investment income, if any, are generally declared and paid quarterly. Distributable net realized capital gains, if any, are declared and distributed annually. Dividends from net investment income and distributions from net realized gains are determined in accordance with federal income tax regulations, which may differ from GAAP. These “book/tax” differences are considered either temporary (e.g., deferred losses) or permanent in nature. To the extent these differences are permanent in nature, such amounts are reclassified within the composition of net assets based on their federal tax-basis treatment; temporary differences do not require reclassification. Dividends and distributions to shareholders are recorded on the ex-dividend date.
Federal Income Taxes – The Fund intends to continue to comply with the requirements of the Internal Revenue Code applicable to regulated investment companies and to distribute all of its taxable income to its shareholders. Therefore, no provision for federal income tax is required. The Fund recognizes the tax benefits of uncertain tax positions only where the position is “more likely than not” to be sustained assuming examination by tax authorities. Management has analyzed the Fund’s tax positions and has concluded that no liability for unrecognized tax benefits should be recorded related to uncertain tax positions taken on returns filed for the open tax years July 31, 2019 – July 31, 2021 or expected to be taken in the Fund’s July 31, 2022 tax return. The Fund identified its major tax jurisdictions as U.S. Federal and foreign jurisdictions where the Fund makes significant investments. The Fund is not aware of any tax positions for which it is reasonably possible that the total amounts of unrecognized tax benefits will change materially in the next twelve months.
| Arrow DWA Tactical: International ETF |
| NOTES TO FINANCIAL STATEMENTS (Continued) |
| July 31, 2022 |
Foreign Currency – The accounting records of the Fund are maintained in U.S. dollars. Investment securities and other assets and liabilities denominated in a foreign currency, and income receipts and expense payments are translated into U.S. dollars using the prevailing exchange rate at the London market close. Purchases and sales of securities are translated into U.S. dollars at the contractual currency rates established at the approximate time of the trade. Net realized gains and losses on foreign currency transactions represent net gains and losses from currency realized between the trade and settlement dates on securities transactions, gains and losses on the purchase and sale of foreign currencies and the difference between income accrued versus income received. The effects of changes in foreign currency exchange rates on investments in securities are included with the net realized and unrealized gain or loss on investment securities.
Expenses – Expenses of the Trust that are directly identifiable to a specific fund are charged to that fund. Expenses that are not readily identifiable to a specific fund, are allocated in such a manner as deemed equitable (as determined by the Board), taking into consideration the nature and type of expense and the relative sizes of the funds in the Trust.
Indemnification – The Trust indemnifies its officers and Trustees for certain liabilities that may arise from the performance of their duties to the Trust. Additionally, in the normal course of business, the Fund enters into contracts that contain a variety of representations and warranties and which provide general indemnities. The Fund’s maximum exposure under these arrangements is unknown, as this would involve future claims that may be made against the Fund that have not yet occurred. However, based on experience, the risk of loss due to these warranties and indemnities appears to be remote.
Time Deposits – Time deposits are issued by a depository institution in exchange for the deposit of funds. The issuer agrees to pay the amount deposited plus interest to the depositor on the date specified with respect to the deposit. Time deposits do not trade in the secondary market prior to maturity. However, some time deposits may be redeemable prior to maturity and may be subject to withdrawal penalties.
Foreign Investment Risk – Returns on investments in foreign securities could be more volatile than, or trail the returns on, investments in U.S. securities. Exposures to foreign securities entail special risks, including risks due to: (i) differences in information available about foreign issuers; (ii) differences in investor protection standards in other jurisdictions; (iii) capital controls risks, including the risk of a foreign jurisdiction imposing restrictions on the ability to repatriate or transfer currency or other assets; (iv) political, diplomatic and economic risks; (v) regulatory risks; and (vi) foreign market and trading risks, including the costs of trading and risks of settlement in foreign jurisdictions. In addition, the Fund’s investments in securities denominated in other currencies could decline due to changes in local currency relative to the value of the U.S. dollar, which may affect the Fund’s returns.
Emerging Markets Risk – In addition to all of the risks of investing in foreign developed markets, emerging market securities involve risks attendant to less mature and stable governments and economies, such as lower trading volume, trading suspension, security price volatility, repatriation restrictions, government confiscation, inflation, deflation, currency devaluation and adverse government regulations of industries or markets. As a result of these risks, the prices of emerging market securities tend to be more volatile than the securities of issuers located in developed markets.
| Arrow DWA Tactical: International ETF |
| NOTES TO FINANCIAL STATEMENTS (Continued) |
| July 31, 2022 |
Market Risk – The net asset value of the Fund will fluctuate based on changes in the value of the individual securities and ETFs in which the Fund invests. The increasing interconnectivity between global economies and financial markets increases the likelihood that events or conditions in one region or financial market may adversely impact issuers in a different country, region or financial market. Securities in the Fund’s portfolio may underperform due to inflation (or expectations for inflation), interest rates, global demand for particular products or resources, natural disasters, climate change and climate related events, pandemics, epidemics, terrorism, regulatory events and governmental or quasi-governmental actions. The occurrence of global events similar to those in recent years may result in market volatility and may have long term effects on both the U.S. and global financial markets. The current novel coronavirus (COVID-19) global pandemic and the aggressive responses taken by many governments, including closing borders, restricting international and domestic travel, and the imposition of prolonged quarantines or similar restrictions, as well as the forced or voluntary closure of, or operational changes to, many retail and other businesses, has had negative impacts, and in many cases severe negative impacts, on markets worldwide. It is not known how long such impacts, or any future impacts of other significant events described above, will or would last, but there could be a prolonged period of global economic slowdown, which may impact your Fund investment.
| 3. | INVESTMENT TRANSACTIONS |
For the year ended July 31, 2022, cost of purchases and proceeds from sales of portfolio securities (excluding in-kind transactions and short-term investments), amounted to $24,516,609 and $24,876,162, respectively.
For the year ended July 31, 2022, cost of purchases and proceeds from sales of portfolio securities for in-kind transactions amounted to $0 and $1,272,131, respectively.
| 4. | INVESTMENT ADVISORY AGREEMENT / TRANSACTIONS WITH RELATED PARTIES |
The business activities of the Fund are overseen by the Board, which is responsible for the overall management of the Fund. The Advisor serves as the Fund’s investment advisor pursuant to an investment advisory agreement with the Trust on behalf of the Fund (the “Advisory Agreement”). The Trust has entered into a Global Custody Agreement with Brown Brothers Harriman & Co. to serve as custodian and to act as transfer and shareholder services agent. The Trust has also entered into an ETF Distribution Agreement (the “Distribution Agreement”) with Northern Lights Distributors, LLC (“NLD” or the “Distributor”) to serve as the distributor for the Fund.
Archer Distributors, LLC, an affiliate of the Advisor is also a party to the Distribution Agreement and provides marketing services to the Fund, including responsibility for all the Fund’s marketing and advertising materials.
Pursuant to the Advisory Agreement, the Advisor, under the oversight of the Board, directs the daily operations of the Fund and supervises the performance of administrative and professional services provided by others. As compensation for its services and the related expenses borne by the Advisor, the Fund pays the Advisor a fee, computed and accrued daily and paid monthly, at an annual rate of 0.70% of the Fund’s average daily net assets.
| Arrow DWA Tactical: International ETF |
| NOTES TO FINANCIAL STATEMENTS (Continued) |
| July 31, 2022 |
Pursuant to a written contract (the “Waiver Agreement”), the Advisor has agreed, at least until December 31, 2022 to waive a portion of its advisory fee and has agreed to reimburse the Fund for other expenses to the extent necessary so that total expenses incurred (exclusive of any taxes, leverage interest, brokerage commissions, expenses incurred in connection with any merger or reorganization, dividend expense on securities sold short, underlying fund fees and expenses, foreign custody transaction costs and foreign account set-up fees, and extraordinary expenses such as litigation expenses) will not exceed 0.95% of the Fund’s average daily net assets. This amount will herein be referred to as the “Expense Limitation.”
If the Advisor waives any fee or reimburses any expenses pursuant to the Waiver Agreement, and the Fund’s operating expenses are subsequently lower than its Expense Limitation, the Advisor, on a rolling three year basis (within three years after the fees have been waived or reimbursed), shall be entitled to reimbursement by the Fund provided that such reimbursement does not cause the Fund’s operating expenses to exceed the lesser of the Expense Limitation at the time of waiver or recapture. Such expenses may only be reimbursed to the extent they were waived or paid after the effective date of the Waiver Agreement. The Board may terminate this expense reimbursement arrangement at any time.
If the Fund’s operating expenses subsequently exceed the Expense Limitation, the reimbursements for the Fund shall be suspended. For the year ended July 31, 2022, the Advisor waived fees and reimbursed expenses in the amount of $115,505, pursuant to the Waiver Agreement.
The following amounts are subject to recapture by the Advisor by the following dates:
| | July 31, 2023 | | | July 31, 2024 | | | July 31, 2025 | |
| | $ | 112,259 | | | $ | 146,115 | | | $ | 115,505 | |
The Trust, with respect to the Fund, has adopted a distribution and service plan (“Plan”) pursuant to Rule 12b-1 under the 1940 Act. Under the Plan, the Fund is authorized to pay distribution fees to the Distributor and other firms that provide distribution and shareholder services (“Service Providers”). If a Service Provider provides these services, the Fund may pay fees at an annual rate not to exceed 0.25% of average daily net assets, pursuant to Rule 12b-1 under the 1940 Act.
No distribution or service fees are currently paid by the Fund and there are no current plans to impose these fees. In the event Rule 12b-1 fees were charged, over time they would increase the cost of an investment in the Fund.
Ultimus Fund Solutions, LLC (“UFS”) – UFS, an affiliate of the Distributor, provides administration and fund accounting services to the Trust. Pursuant to separate servicing agreements with UFS, the Fund pays UFS customary fees for providing administration and fund accounting services to the Fund. Certain officers of the Trust are also officers of UFS, and are not paid any fees directly by the Fund for serving in such capacities.
| Arrow DWA Tactical: International ETF |
| NOTES TO FINANCIAL STATEMENTS (Continued) |
| July 31, 2022 |
Blu Giant, LLC (“Blu Giant”) – Blu Giant, an affiliate of UFS and the Distributor, provides EDGAR conversion and filing services as well as print management services for the Fund on an ad-hoc basis. For the provision of these services, Blu Giant receives customary fees from the Fund.
| 5. | CAPITAL SHARE TRANSACTIONS |
Shares are not individually redeemable and may be redeemed by the Fund at NAV only in large blocks known as “Creation Units.” Shares are created and redeemed by the Fund only in Creation Unit size aggregations of 50,000 shares. Only Authorized Participants are permitted to purchase or redeem Creation Units from the Fund. An Authorized Participant is either (i) a broker-dealer or other participant in the clearing process through the Continuous Net Settlement System of the National Securities Clearing Corporation or (ii) a DTC participant and, in each case, must have executed a Participant Agreement with the Distributor. Such transactions are generally permitted on an in-kind basis, with a balancing cash component to equate the transaction to the NAV per share of the Fund on the transaction date. Cash may be substituted equivalent to the value of certain securities generally when they are not available in sufficient quantity for delivery, not eligible for trading by the Authorized Participant or as a result of other market circumstances. In addition, the Fund may impose transaction fees on purchases and redemptions of Fund shares to cover the custodial and other costs incurred by the Fund in effecting trades. A fixed fee payable to the Custodian may be imposed on each creation and redemption transaction regardless of the number of Creation Units involved in the transaction (“Fixed Fee”). Transaction Fees may be used to cover the custodial and other costs incurred by the Fund or disclosed as capital shares for the Fund in the Statements of Changes in Net Assets.
The Transaction Fees for the Fund are listed in the table below:
| 6. | DISTRIBUTIONS TO SHAREHOLDERS AND TAX COMPONENTS OF CAPITAL |
The tax character of distributions paid during the following years was as follows:
| | | Fiscal Year Ended | | | Fiscal Year Ended | |
| | | July 31, 2022 | | | July 31, 2021 | |
| Ordinary Income | | $ | 396,339 | | | $ | 99,325 | |
| Long-Term Capital Gain | | | 22,521 | | | | — | |
| Return of Capital | | | — | | | | — | |
| | | $ | 418,860 | | | $ | 99,325 | |
As of July 31, 2022, the components of accumulated earnings/(deficit) on a tax basis were as follows:
| Undistributed | | | Undistributed | | | Post October Loss | | | Capital Loss | | | Other | | | Unrealized | | | Total | |
| Ordinary | | | Long-Term | | | and | | | Carry | | | Book/Tax | | | Appreciation/ | | | Distributable Earnings | |
| Income | | | Gains | | | Late Year Loss | | | Forwards | | | Differences | | | (Depreciation) | | | /(Accumulated Deficit) | |
| $ | — | | | $ | 508,864 | | | $ | (1,419,447 | ) | | $ | — | | | $ | — | | | $ | (617,143 | ) | | $ | (1,527,726 | ) |
| Arrow DWA Tactical: International ETF |
| NOTES TO FINANCIAL STATEMENTS (Continued) |
| July 31, 2022 |
The unrealized appreciation in the table above includes unrealized foreign currency losses of $(4,591).
Late year losses incurred after December 31 within the fiscal year are deemed to arise on the first business day of the following fiscal year for tax purposes. The Fund incurred and elected to defer such late year losses of $100,221.
Capital losses incurred after October 31 within the fiscal year are deemed to arise on the first business day of the following fiscal year for tax purposes. The Fund incurred and elected to defer such capital losses of $1,319,226.
The Fund utilized capital loss carry forwards for the year ended July 31, 2022 as follows:
| Short-Term | | | Long-Term | | | Total | | | CLCF Utilized | |
| $ | — | | | $ | — | | | $ | — | | | $ | 834,991 | |
Permanent book and tax differences, primarily attributable to the book/tax basis treatment of adjustments related to transfers in kind, resulted in reclassifications for the Funds for the fiscal year ended July 31, 2022 as follows:
| Paid | | | | |
| In | | | Accumulated | |
| Capital | | | Deficit | |
| $ | (184,493 | ) | | $ | 184,493 | |
| 7. | AGGREGATE UNREALIZED APPRECIATION AND DEPRECIATION – TAX BASIS |
| | | | Gross | | | Gross | | | | |
| | | | Unrealized | | | Unrealized | | | Net Unrealized | |
| Tax Cost | | | Appreciation | | | Depreciation | | | Appreciation/Depreciation | |
| $ | 12,003,882 | | | $ | 423,818 | | | $ | (1,036,370 | ) | | $ | (612,552 | )* |
| * | Excludes Foreign Currency Unrealized |
The beneficial ownership, either directly or indirectly, of more than 25% of the voting securities of the Fund, creates presumption of the control of the Fund, under Section 2(a)9 of the 1940 Act. As of July 31, 2022, Arrow DWA Tactical: Balanced Fund, an affiliate of the Fund, held 68.4% of the voting securities of the Fund.
Subsequent events after the date of the Statement of Assets and Liabilities have been evaluated through the date the financial statements were issued.
Management has determined that no events or transactions occurred requiring adjustment or disclosure in the financial statements.

REPORT OF INDEPENDENT REGISTERED PUBLIC ACCOUNTING FIRM
To the Board of Trustees of Arrow Investments Trust
and the Shareholders of Arrow DWA Tactical: International ETF
Opinion on the Financial Statements
We have audited the accompanying statement of assets and liabilities of Arrow DWA Tactical: International ETF, a series of shares of beneficial interest in Arrow Investments Trust (the “Fund”), including the portfolio of investments, as of July 31, 2022, and the related statement of operations for the year then ended, the statements of changes in net assets for each of the years in the two-year period then ended and the financial highlights for each of the years in the four-year period then ended and for the period December 28, 2017 (commencement of operations) through July 31, 2018, and the related notes (collectively referred to as the “financial statements”). In our opinion, the financial statements present fairly, in all material respects, the financial position of the Fund as of July 31, 2022, and the results of its operations for the year then ended, the changes in its net assets for each of the years in the two-year period then ended and its financial highlights for each of the years in the four-year period then ended and for the period December 28, 2017 through July 31, 2018, in conformity with accounting principles generally accepted in the United States of America.
Basis for Opinion
These financial statements are the responsibility of the Fund’s management. Our responsibility is to express an opinion on the Fund’s financial statements based on our audits. We are a public accounting firm registered with the Public Company Accounting Oversight Board (United States) (“PCAOB”) and are required to be independent with respect to the Fund in accordance with the U.S. federal securities law and the applicable rules and regulations of the Securities and Exchange Commission and the PCAOB.
We conducted our audits in accordance with the standards of the PCAOB. Those standards require that we plan and perform the audits to obtain reasonable assurance about whether the financial statements are free of material misstatement, whether due to error or fraud. The Fund is not required to have, nor were we engaged to perform, an audit of its internal control over financial reporting. As part of our audits we are required to obtain an understanding of internal control over financial reporting but not for the purpose of expressing an opinion on the effectiveness of the Fund’s internal control over financial reporting. Accordingly, we express no such opinion.
Our audits included performing procedures to assess the risk of material misstatement of the financial statements, whether due to error or fraud, and performing procedures that respond to those risks. Such procedures included examining, on a test basis, evidence regarding the amounts and disclosures in the financial statements. Our procedures included confirmation of securities owned as of July 31, 2022 by correspondence with the custodian. Our audits also included evaluating the accounting principles used and significant estimates made by management, as well as evaluating the overall presentation of the financial statements. We believe that our audits provide a reasonable basis for our opinion.
BBD, LLP
We have served as the auditor of one or more of the Funds in the Arrow Investments Trust since 2012. We also served as the auditor of one or more of the Funds in the Funds’ former trust from 2006 through 2012
Philadelphia, Pennsylvania
September 29, 2022
| Arrow DWA Tactical: International ETF |
| EXPENSE EXAMPLE (Unaudited) |
| July 31, 2022 |
As a shareholder of the Fund, you incur ongoing costs, including management fees and other Fund expenses. This example is intended to help you understand your ongoing costs (in dollars) of investing in the Fund and to compare these costs with the ongoing costs of investing in other exchange traded funds. This example does not take into account transaction costs, such as brokerage commissions that you may pay on your purchases and sales of shares of the Fund.
The example is based on an investment of $1,000 invested at the beginning of the period and held for the entire period from February 1, 2022 through July 31, 2022.
Actual Expenses
The “Actual” line in the table below provides information about actual account values and actual expenses. You may use the information below, together with the amount you invested, to estimate the expenses that you paid over the period. Simply divide your account value by $1,000 (for example, an $8,600 account value divided by $1,000 = 8.6), then multiply the result by the number in the table under the heading entitled “Expenses Paid During Period” to estimate the expenses you paid on your account during this period.
Hypothetical Example for Comparison Purposes
The “Hypothetical” line in the table below provides information about hypothetical account values and hypothetical expenses based on the Fund’s actual expense ratio and an assumed rate of return of 5% per year before expenses, which is not the Fund’s actual return. The hypothetical account values and expenses may not be used to estimate the actual ending account balances or expenses you paid for the period. You may use this information to compare this 5% hypothetical example with the 5% hypothetical examples that appear in the shareholder reports of other funds.
Please note that the expenses shown in the table are meant to highlight your ongoing costs only and do not reflect any transactional costs. Therefore, the table is useful in comparing ongoing costs only, and will not help you determine the relative total costs of owning different funds. In addition, if these transactional costs were included, your costs would have been higher.
| | | Beginning | | Ending | | Expenses Paid | | Expenses Paid |
| | | Account Value | | Account Value | | During Period* | | During Period** |
| | | 2/1/2022 | | 7/31/2022 | | 2/1/22 - 7/31/22 | | 2/1/22 - 7/31/22 |
| Actual | | $1,000.00 | | $859.20 | | $4.66 | | 1.01% |
| Hypothetical | | $1,000.00 | | $1,019.79 | | $5.06 | | 1.01% |
| (5% return before expenses) | | | | | | | | |
| * | Actual expense information for the Fund is for the period from February 1, 2022 to July 31, 2022. Actual expenses are equal to the Fund’s annualized net expense ratio multiplied by 181/365 (to reflect the period from February 1, 2022 to July 31, 2022). “Hypothetical” expense information for the Fund is presented on the basis of the full one-half year period to enable comparison to other funds. It is based on assuming the same net expense ratio and average account value over the period, but it is multiplied by 181/365 (to reflect the full half-year period). |
| Arrow DWA Tactical: International ETF |
| SUPPLEMENTAL INFORMATION (Unaudited) |
| July 31, 2022 |
LIQUIDITY RISK MANAGEMENT PROGRAM
The Funds have adopted and implemented a written liquidity risk management program as required by Rule 22e-4 (the “Liquidity Rule”) under the Investment Company Act. The program is reasonably designed to assess and manage the Funds’ liquidity risk, taking into consideration, among other factors, the Funds’ investment strategy and the liquidity of its portfolio investments during normal and reasonably foreseeable stressed conditions; its short and long-term cash flow projections; and its cash holdings and access to other funding sources.
During the year ended July 31, 2022, the Trust’s Liquidity Risk Management Program Committee (the “Committee”) reviewed the Funds’ investments and determined that the Funds held adequate levels of cash and highly liquid investments to meet shareholder redemption activities in accordance with applicable requirements. Accordingly, the Committee concluded that (i) the Funds’ liquidity risk management program is reasonably designed to prevent violations of the Liquidity Rule and (ii) the Funds’ liquidity risk management program has been effectively implemented.
Arrow DWA Tactical: International ETF
SUPPLEMENTAL INFORMATION (Unaudited)
July 31, 2022
Unless otherwise noted, the address of each Trustee and Officer is 6100 Chevy Chase Drive, Suite 100, Laurel, MD 20707. The following individuals serve as Trustees and officers of the Arrow Trust:
Independent Trustees:
Name, Address,
and Year of
Birth | Position(s)/Term
of Office(1) | Principal Occupation(s) During
the Past 5 Years | Number of
Portfolios in
Fund
Complex
Overseen by
Trustee(2) | Other Directorships
Held by Trustee |
Robert Andrialis
Born in 1944 | Trustee since 2014 | Independent Consultant (2016– present). | 8 | Arrow ETF Trust |
Paul Montgomery
Born in 1953 | Trustee since 2011 | Director of Research, Scotia Partners, LLC (2012–present). | 8 | Arrow ETF Trust |
Thomas Sarkany
Born in 1946 | Trustee since 2014 | Founder and President, TTS Consultants, LLC (2010– present). | 8 | Arrow ETF Trust; Northern Lights Fund Trust II; Northern Lights Fund Trust IV; Aquila Distributors, LLC |
| (1) | The term of office for each Trustee will continue indefinitely until the individual resigns or is removed. |
| (2) | The “Fund Complex” includes Arrow ETF Trust, a registered management investment company, in addition to the Trust. |
| Arrow DWA Tactical: International ETF |
| SUPPLEMENTAL INFORMATION (Unaudited)(Continued) |
July 31, 2022
Interested Trustees and Officers:
Name, Address,
and
Year of Birth | Position(s)/Term
of Office(1) | Principal Occupation(s) During
the
Past 5 Years | Number of
Funds in the
Fund
Complex
Overseen by
Trustee(2) | Other Directorships
Held
by Trustee |
Joseph Barrato*
Born in 1965 | Chairman of the Board, Trustee, President, and Principal Executive Officer since 2011 | Founder and Chief Executive Officer, Arrow Investment Advisors, LLC (2006–present). | 8 | Arrow ETF Trust |
Chris Lewis
Born in 1970 | Chief Compliance Officer since 2021; Previously from 2016–2018 | Chief Compliance Officer of Fund Complex(2) (2016–2018; 2021–present); Chief Compliance Officer, Arrow Investment Advisors, LLC (2017–2018; 2021–present); Founder, The Law Offices of Christopher H. Lewis (2019–present); General Counsel, Finitive LLC (2018). | N/A | N/A |
Timothy Burdick(3)
Born in 1986 | Secretary since 2020 | Assistant Vice President, Ultimus Fund Solutions, LLC (2019 – present); Senior Program Compliance Manager, CJ Affiliate (2016-2019) | N/A | N/A |
Sam Singh(3)
Born in 1976 | Principal Financial Officer and Treasurer since 2013 | Vice President, Ultimus Fund Solutions, LLC (2015–present). | N/A | N/A |
| * | Joseph Barrato is considered to be an “interested person” of the Trust, as that term is defined in the 1940 Act, because he is a controlling interest holder of the investment advisor to the Fund, Arrow Investment Advisors, LLC. |
| (1) | The term of office for each Trustee will continue indefinitely until the individual resigns or is removed. Officers of the Trust are elected annually. |
| (2) | The “Fund Complex” includes Arrow ETF Trust, a registered management investment company, in addition to the Trust. |
| (3) | The business address of this officer is 4221 North 203rd Street, Suite 100, Elkhorn, Nebraska 68022-3474. |
The Fund’s Statement of Additional Information includes additional information about the Trustees and is available free of charge, upon request, by calling toll-free at 1-877-277-6933.
PRIVACY NOTICE
Arrow Investments Trust
Rev. November 2011
| FACTS | WHAT DOES ARROW INVESTMENTS TRUST DO WITH YOUR PERSONAL INFORMATION? |
| | |
| Why? | Financial companies choose how they share your personal information. Federal law gives consumers the right to limit some, but not all sharing. Federal law also requires us to tell you how we collect, share, and protect your personal information. Please read this notice carefully to understand what we do. |
| | |
| What? | The types of personal information we collect and share depends on the product or service that you have with us. This information can include: ● Social Security number and wire transfer instructions ● account transactions and transaction history ● investment experience and purchase history When you are no longer our customer, we continue to share your information as described in this notice. |
| | |
| How? | All financial companies need to share customers’ personal information to run their everyday business. In the section below, we list the reasons financial companies can share their customers’ personal information; the reasons Arrow Investments Trust chooses to share; and whether you can limit this sharing. |
Reasons we can share your
personal information: | Does Arrow Investments
Trust share information? | Can you limit this
sharing? |
| For our everyday business purposes - such as to process your transactions, maintain your account(s), respond to court orders and legal investigations, or report to credit bureaus. | YES | NO |
| For our marketing purposes - to offer our products and services to you. | NO | We don’t share |
| For joint marketing with other financial companies. | NO | We don’t share |
| For our affiliates’ everyday business purposes - information about your transactions and records. | NO | We don’t share |
| For our affiliates’ everyday business purposes - information about your credit worthiness. | NO | We don’t share |
| For nonaffiliates to market to you | NO | We don’t share |
| QUESTIONS? | Call 1-877-277-6933 |
PRIVACY NOTICE
Arrow Investments Trust
| What we do: | |
How does Arrow Investments Trust protect my personal information? | To protect your personal information from unauthorized access and use, we use security measures that comply with federal law. These measures include computer safeguards and secured files and buildings. Our service providers are held accountable for adhering to strict policies and procedures to prevent any misuse of your nonpublic personal information. |
How does Arrow Investments Trust collect my personal information? | We collect your personal information, for example, when you ● open an account or deposit money ● direct us to buy securities or direct us to sell your securities ● seek advice about your investments We also collect your personal information from others, such as credit bureaus, affiliates, or other companies. |
| Why can’t I limit all sharing? | Federal law gives you the right to limit only: ● sharing for affiliates’ everyday business purposes – information about your creditworthiness. ● affiliates from using your information to market to you. ● sharing for nonaffiliates to market to you. State laws and individual companies may give you additional rights to limit sharing. |
| | |
| Definitions | |
| Affiliates | Companies related by common ownership or control. They can be financial and nonfinancial companies. ● Arrow Investments Trust does not share with our affiliates. |
| Nonaffiliates | Companies not related by common ownership or control. They can be financial and nonfinancial companies. ● Arrow Investments Trust does not share with nonaffiliates so they can market to you. |
| Joint marketing | A formal agreement between nonaffiliated financial companies that together market financial products or services to you. ● Arrow Investments Trust does not jointly market. |
PROXY VOTING POLICY
Information regarding how the Fund voted proxies relating to portfolio securities for the most recent twelve-month period ended June 30 as well as a description of the policies and procedures that the Fund uses to determine how to vote proxies is available without charge, upon request, by calling 1-877 -277-6933 or by referring to the Securities and Exchange Commission’s (“SEC”) website at http://www.sec.gov.
PORTFOLIO HOLDINGS
The Fund files a complete schedule of portfolio holdings with the SEC for the first and third quarters of each fiscal year as an exhibit to its reports on Form N-PORT, within sixty days after the end of the period. Form N-PORT reports are available at the SEC’s website at www.sec.gov.
| INVESTMENT ADVISOR |
| Arrow Investment Advisors, LLC |
| 6100 Chevy Chase Drive, Suite 100 |
| Laurel, MD 20707 |
| |
| ADMINISTRATOR |
| Ultimus Fund Solutions, LLC |
| 225 Pictoria Drive, Suite 450 |
| Cincinnati, OH 45246 |
| |
| |
| |
| |
| |
| |
| |
| |
| |
| |
| DWCR-AR22 |
Item 2. Code of Ethics.
(a) As of the end of the period covered by this report, the registrant has adopted a code of ethics that applies to the registrant's principal executive officer, principal financial officer, principal accounting officer or controller, or persons performing similar functions, regardless of whether these individuals are employed by the registrant or a third party.
(b) For purposes of this item, “code of ethics” means written standards that are reasonably designed to deter wrongdoing and to promote:
| (1) | Honest and ethical conduct, including the ethical handling of actual or apparent conflicts of interest between personal and professional relationships; |
| (2) | Full, fair, accurate, timely, and understandable disclosure in reports and documents that a registrant files with, or submits to, the Commission and in other public communications made by the registrant; |
(3) Compliance with applicable governmental laws, rules, and regulations;
| (4) | The prompt internal reporting of violations of the code to an appropriate person or persons identified in the code; and |
(5) Accountability for adherence to the code.
(c) Amendments: During the period covered by the report, there have not been any amendments to the provisions of the code of ethics.
(d) Waivers: During the period covered by the report, the registrant has not granted any express or implicit waivers from the provisions of the code of ethics.
(e) The Code of Ethics is not posted on Registrant’ website.
(f) A copy of the Code of Ethics is attached as an exhibit.
Item 3. Audit Committee Financial Expert.
The Registrant’s board of trustees has determined that Robert S. Andrialis is an audit committee financial expert, as defined in Item 3 of Form N-CSR. Mr. Andrialis is independent for purposes of this Item.
Item 4. Principal Accountant Fees and Services.
2022 - $11,000
2021 - $11,000
2020 – None
2019 – None
2022 - $ 2,200
2021 - $ 2,200
Preparation of Federal & State income tax returns, assistance with calculation of required income, capital gain and excise distributions and preparation of Federal excise tax returns.
2022 – None
2021 – None
| (e) | (1) Audit Committee’s Pre-Approval Policies |
The registrant’s Audit Committee is required to pre-approve all audit services and, when appropriate, any non-audit services (including audit-related, tax and all other services) to the registrant. The registrant’s Audit Committee also is required to pre-approve, when appropriate, any non-audit services (including audit-related, tax and all other services) to its adviser, or any entity controlling, controlled by or under common control with the adviser that provides ongoing services to the registrant, to the extent that the services may be determined to have an impact on the operations or financial reporting of the registrant. Services are reviewed on an engagement by engagement basis by the Audit Committee.
| (2) | Percentages of Services Approved by the Audit Committee |
| | | 2022 | | 2021 |
| Audit-Related Fees: | | | 0.00 | % | | | 0.00 | % |
| Tax Fees: | | | 0.00 | % | | | 0.00 | % |
| All Other Fees: | | | 0.00 | % | | | 0.00 | % |
| (f) | During the audit of registrant's financial statements for the most recent fiscal year, less than 50 percent of the hours expended on the principal accountant's engagement were attributed to work performed by persons other than the principal accountant's full-time, permanent employees. |
| (g) | The aggregate non-audit fees billed by the registrant's accountant for services rendered to the registrant, and rendered to the registrant's investment adviser (not including any sub-adviser whose role is primarily portfolio management and is subcontracted with or overseen by another investment adviser), and any entity controlling, controlled by, or under common control with the adviser that provides ongoing services to the registrant: |
2022 - $2,200
2021 - $2,200
(h) The registrant's audit committee has considered whether the provision of non-audit services to the registrant's investment adviser (not including any sub-adviser whose role is primarily portfolio management and is subcontracted with or overseen by another investment adviser), and any entity controlling, controlled by, or under common control with the investment adviser that provides ongoing services to the registrant, that were not pre-approved pursuant to paragraph (c)(7)(ii) of Rule 2-01 of Regulation S-X, is compatible with maintaining the principal accountant's independence.
Item 5. Audit Committee of Listed Companies. The registrant is an issuer as defined in Rule 10A-3 under the Securities Exchange Act of 1934, as amended (the “Exchange Act”) and has a separately-designated standing audit committee established in accordance with Section 3(a)(58)A of the Exchange Act. The registrant’s audit committee members are Robert S. Andrialis, Paul Montgomery and Thomas T. Sarkany.
Item 6. Schedule of Investments. See Item 1.
Item 7. Disclosure of Proxy Voting Policies and Procedures for Closed-End Funds. Not applicable to open-end investment companies.
Item 8. Portfolio Managers of Closed-End Management Investment Companies. Not applicable to open-end investment companies.
Item 9. Purchases of Equity Securities by Closed-End Funds. Not applicable to open-end investment companies.
Item 10. Submission of Matters to a Vote of Security Holders. There were no material changes to the procedures by which Shareholders may recommend nominees to the registrant’s Board of Trustees.
Item 11. Controls and Procedures.
(a) Based on an evaluation of the Registrant’s disclosure controls and procedures as of a date within 90 days of filing date of this Form N-CSR, the principal executive officer and principal financial officer of the Registrant have concluded that the disclosure controls and procedures of the Registrant are reasonably designed to ensure that the information required in filings on Form N-CSR is recorded, processed, summarized, and reported by the filing date, including that information required to be disclosed is accumulated and communicated to the Registrant’s management, including the Registrant’s principal executive officer and principal financial officer, as appropriate to allow timely decisions regarding required disclosure.
(b) There were no significant changes in the Registrant’s internal control over financial reporting that occurred during the period covered by this report that have materially affected, or are reasonably likely to materially affect, the Registrant’s internal control over financial reporting.
Item 12. Disclosure of Securities Lending Activities for Closed-End Management Investment Companies. - Not applicable to open-end investment companies.
Item 13. Exhibits.
(a)(1) Code of Ethics herewith.
(a)(2) Certifications required by Section 302 of the Sarbanes-Oxley Act of 2002 (and Item 11(a)(2) of Form N-CSR) are filed herewith.
(a)(3) Not applicable for open-end investment companies.
(b) Certifications required by Section 906 of the Sarbanes-Oxley Act of 2002 (and Item 11(b) of Form N-CSR) are filed herewith.
SIGNATURES
Pursuant to the requirements of the Securities Exchange Act of 1934 and the Investment Company Act of 1940, the registrant has duly caused this report to be signed on its behalf by the undersigned, thereunto duly authorized.
(Registrant) Arrow Investments Trust
By (Signature and Title)
/s/ Joseph Barrato
Joseph Barrato, Principal Executive Officer/ President
Date 10/7/22
Pursuant to the requirements of the Securities Exchange Act of 1934 and the Investment Company Act of 1940, this report has been signed below by the following persons on behalf of the registrant and in the capacities and on the dates indicated.
By (Signature and Title)
/s/ Joseph Barrato
Joseph Barrato, Principal Executive Officer/ President
Date 10/7/22
By (Signature and Title)
/s/ Sam Singh
Sam Singh, Principal Financial Officer/ Treasurer
Date 10/7/22