2

• • • • • • • Note: As of June 30, 2020. 1 At Athene’s target Risk-Based Capital of 370%, Athene would need to hold an additional ~$535mm of capital. 2 Excess capital is presented net of future expected deployment to fund Jackson transaction announced in June 2020. Untapped debt capacity assumes capacity of 25% debt to capitalization and is subject to general availability and market conditions. 3
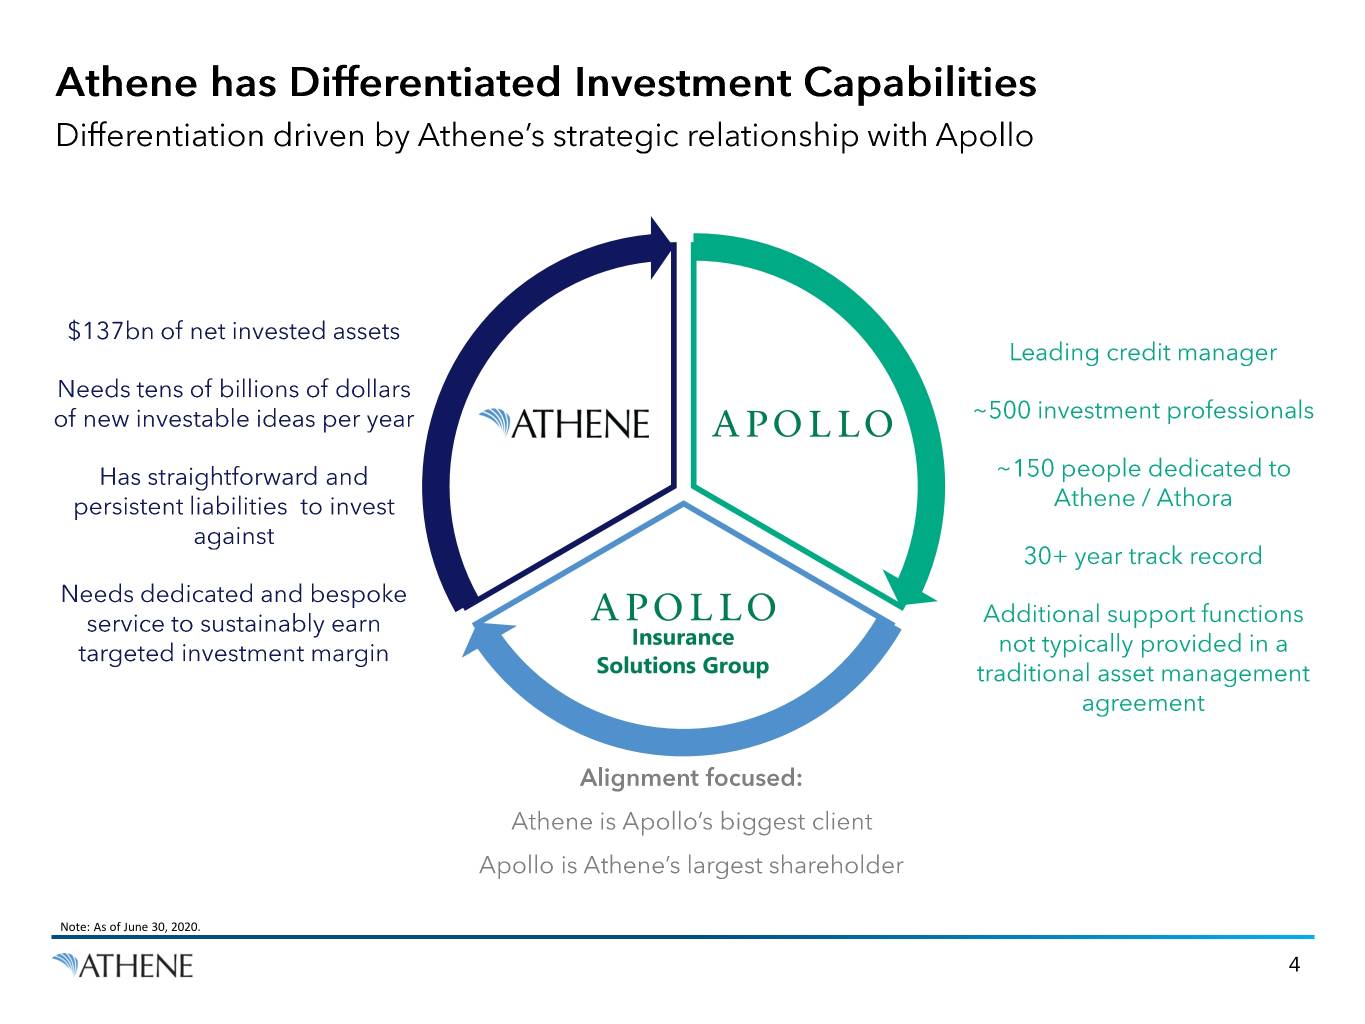
Insurance Solutions Group Note: As of June 30, 2020.
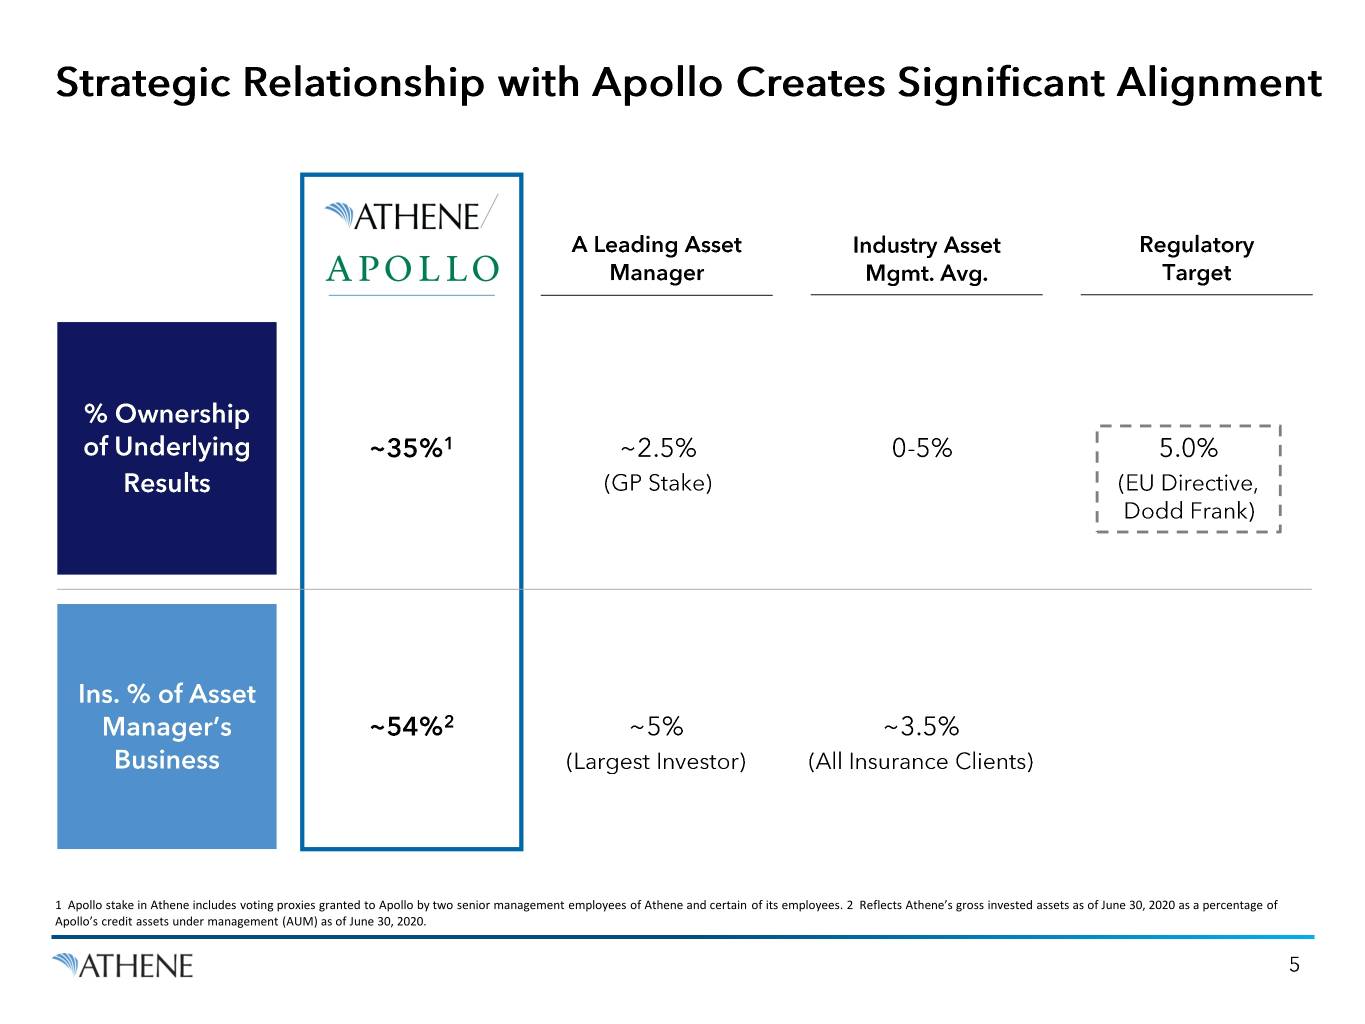
1 Apollo stake in Athene includes voting proxies granted to Apollo by two senior management employees of Athene and certain of its employees. 2 Reflects Athene’s gross invested assets as of June 30, 2020 as a percentage of Apollo’s credit assets under management (AUM) as of June 30, 2020.
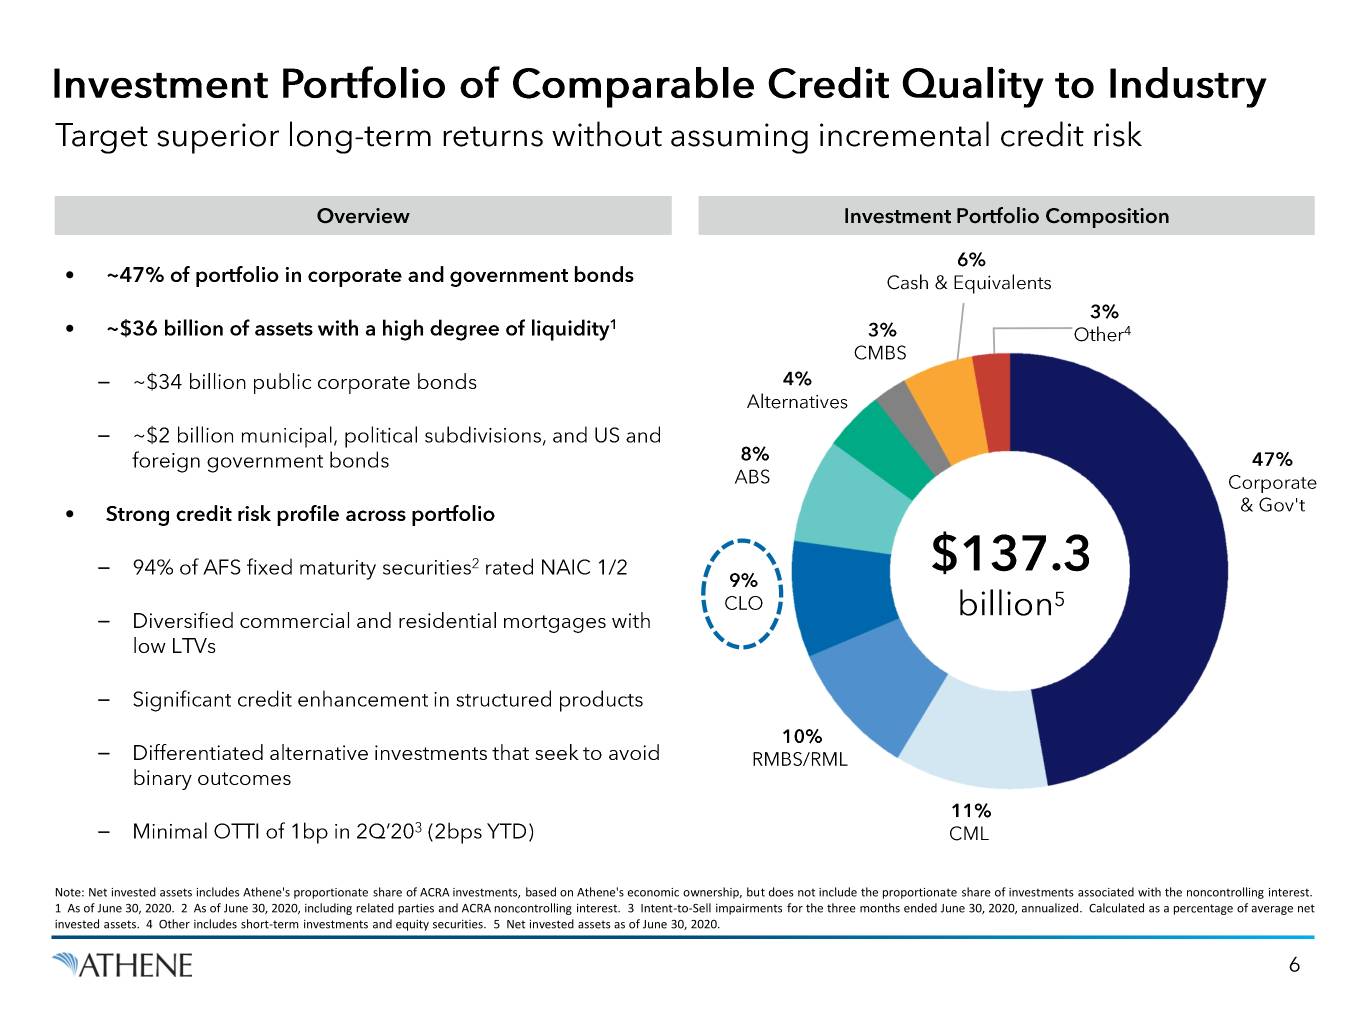
• • – – • – – – – – Note: Net invested assets includes Athene's proportionate share of ACRA investments, based on Athene's economic ownership, but does not include the proportionate share of investments associated with the noncontrolling interest. 1 As of June 30, 2020. 2 As of June 30, 2020, including related parties and ACRA noncontrolling interest. 3 Intent-to-Sell impairments for the three months ended June 30, 2020, annualized. Calculated as a percentage of average net invested assets. 4 Other includes short-term investments and equity securities. 5 Net invested assets as of June 30, 2020.
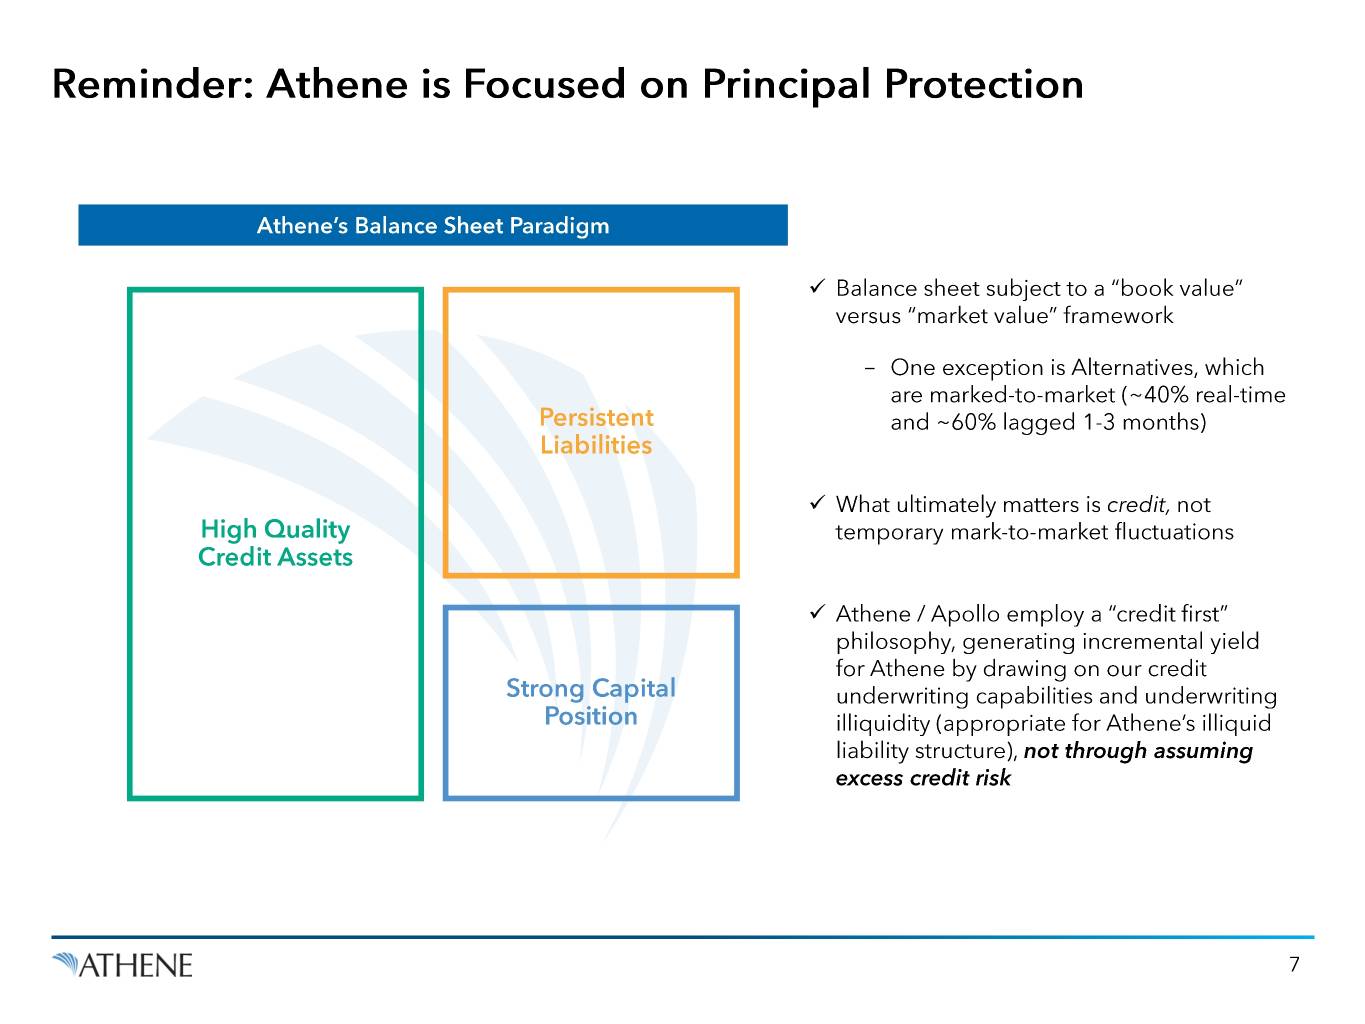
✓ - ✓ ✓
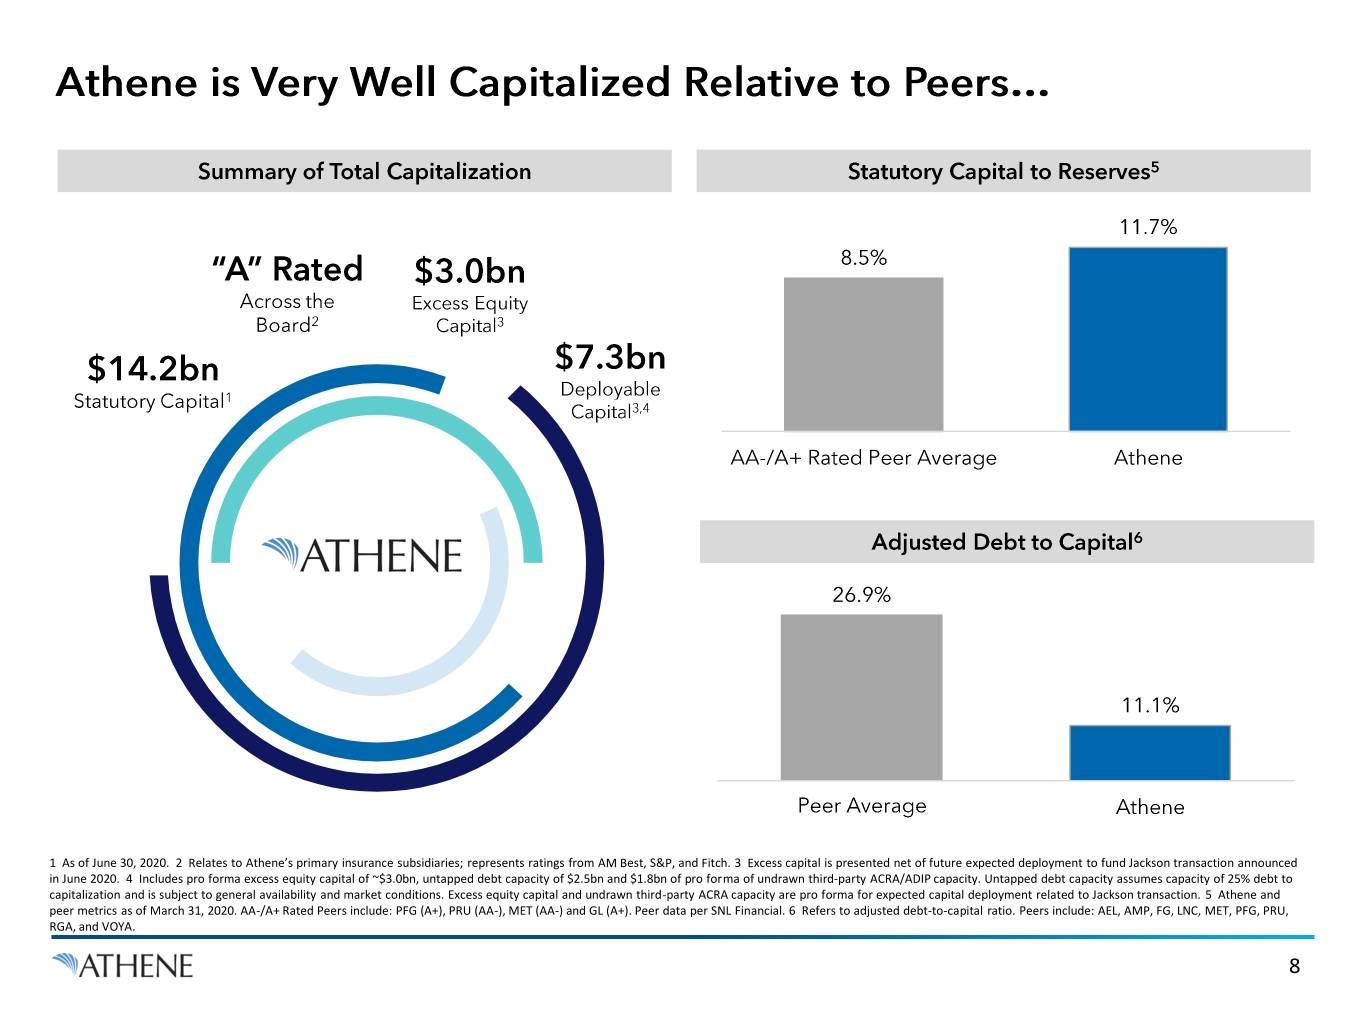
1 As of June 30, 2020. 2 Relates to Athene’s primary insurance subsidiaries; represents ratings from AM Best, S&P, and Fitch. 3 Excess capital is presented net of future expected deployment to fund Jackson transaction announced in June 2020. 4 Includes pro forma excess equity capital of ~$3.0bn, untapped debt capacity of $2.5bn and $1.8bn of pro forma of undrawn third-party ACRA/ADIP capacity. Untapped debt capacity assumes capacity of 25% debt to capitalization and is subject to general availability and market conditions. Excess equity capital and undrawn third-party ACRA capacity are pro forma for expected capital deployment related to Jackson transaction. 5 Athene and peer metrics as of March 31, 2020. AA-/A+ Rated Peers include: PFG (A+), PRU (AA-), MET (AA-) and GL (A+). Peer data per SNL Financial. 6 Refers to adjusted debt-to-capital ratio. Peers include: AEL, AMP, FG, LNC, MET, PFG, PRU, RGA, and VOYA. 8
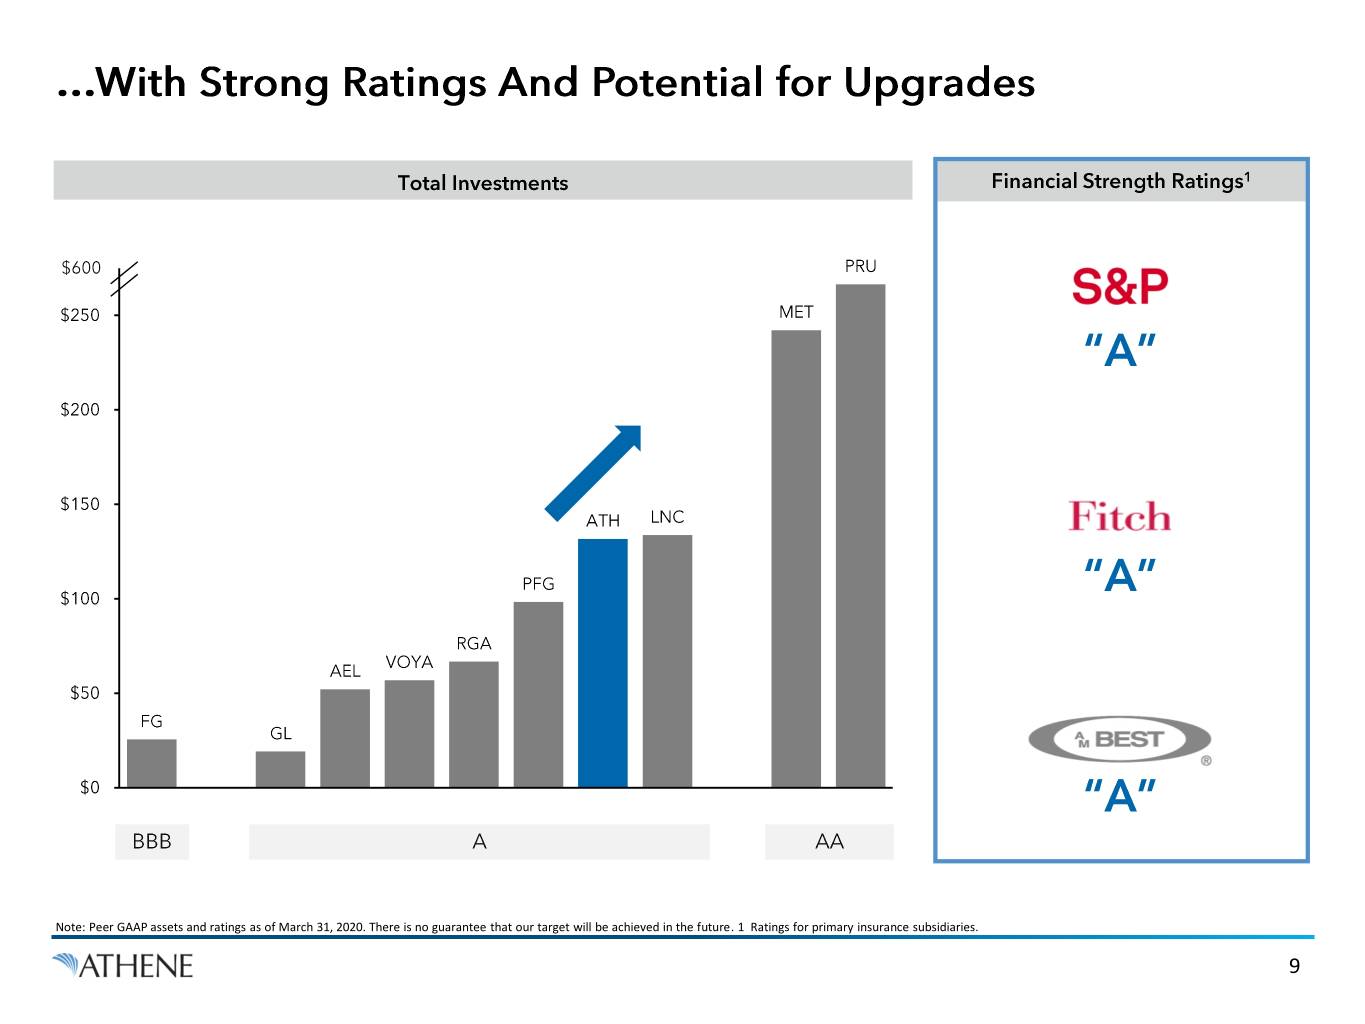
Note: Peer GAAP assets and ratings as of March 31, 2020. There is no guarantee that our target will be achieved in the future. 1 Ratings for primary insurance subsidiaries. 9
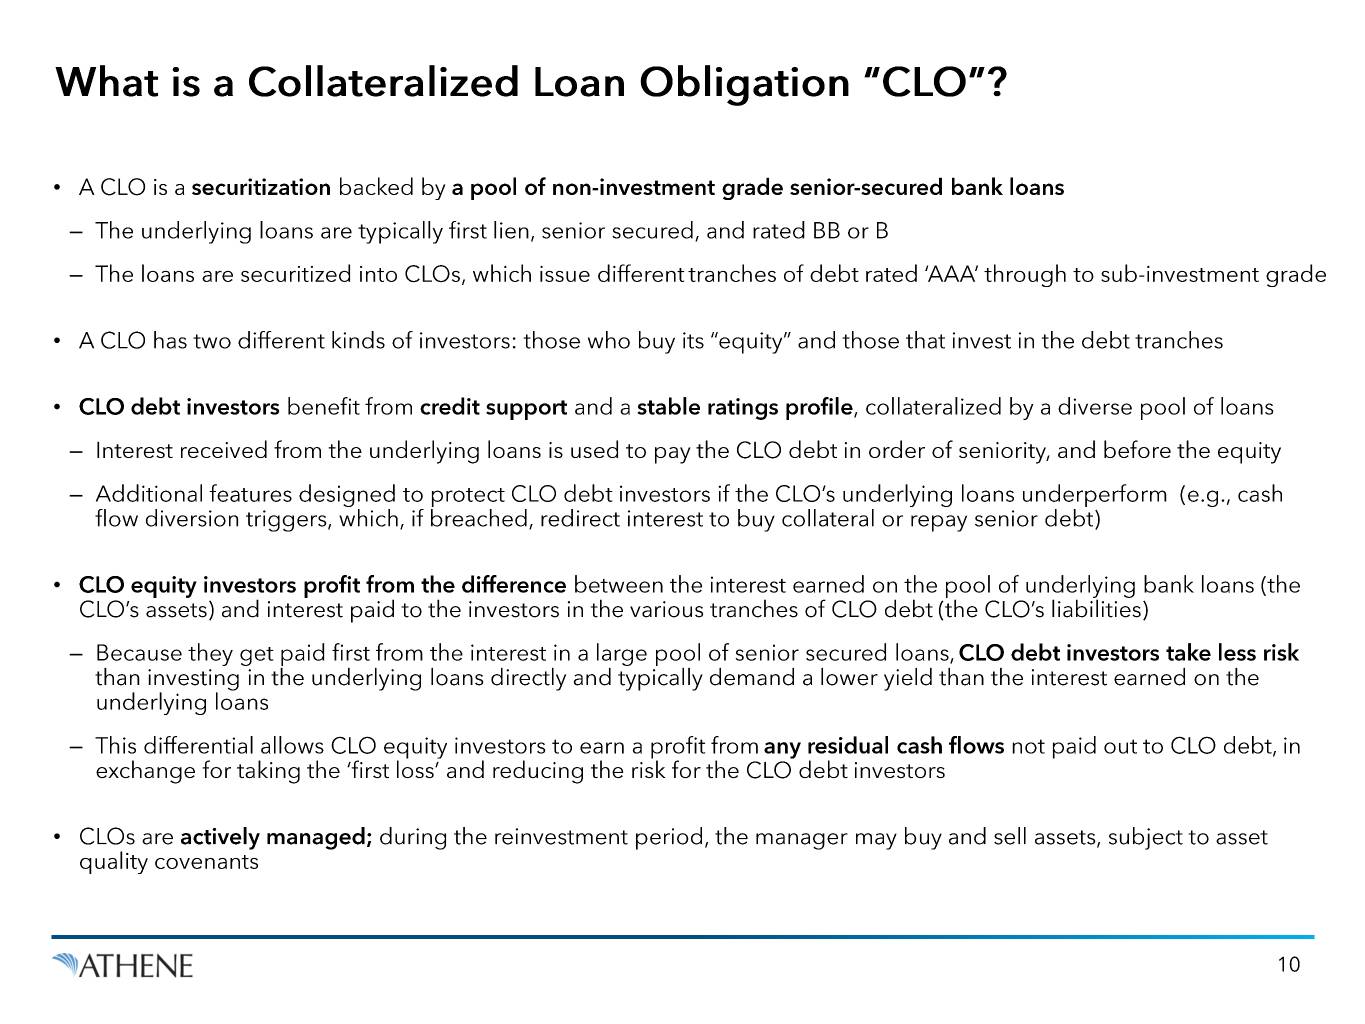
• ‒ ‒ • • ‒ ‒ • ‒ ‒ •
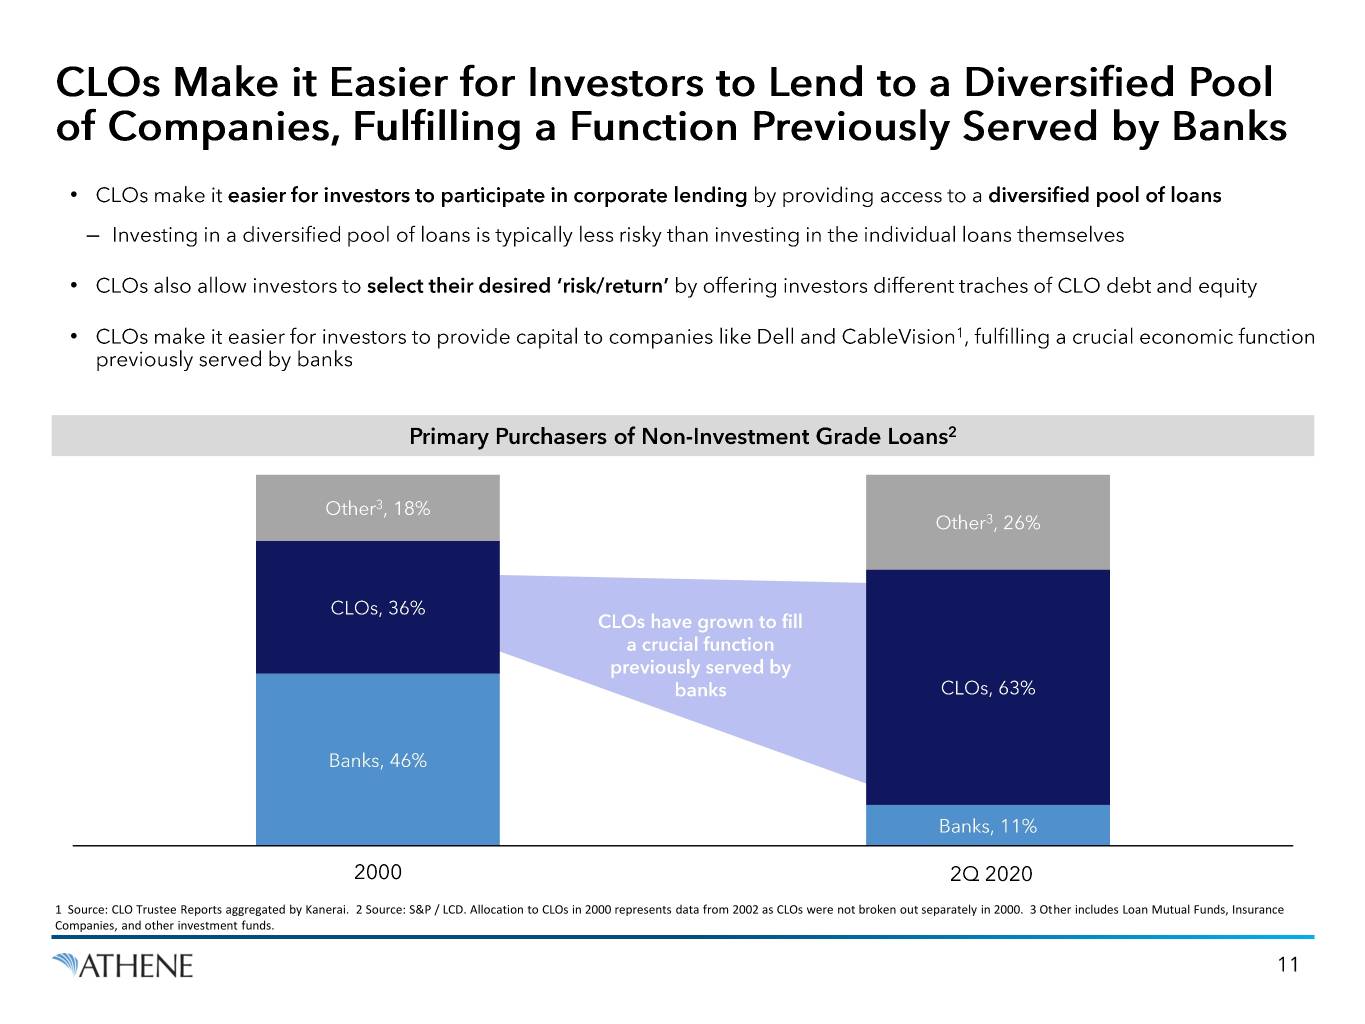
• ‒ • • 1 Source: CLO Trustee Reports aggregated by Kanerai. 2 Source: S&P / LCD. Allocation to CLOs in 2000 represents data from 2002 as CLOs were not broken out separately in 2000. 3 Other includes Loan Mutual Funds, Insurance Companies, and other investment funds.
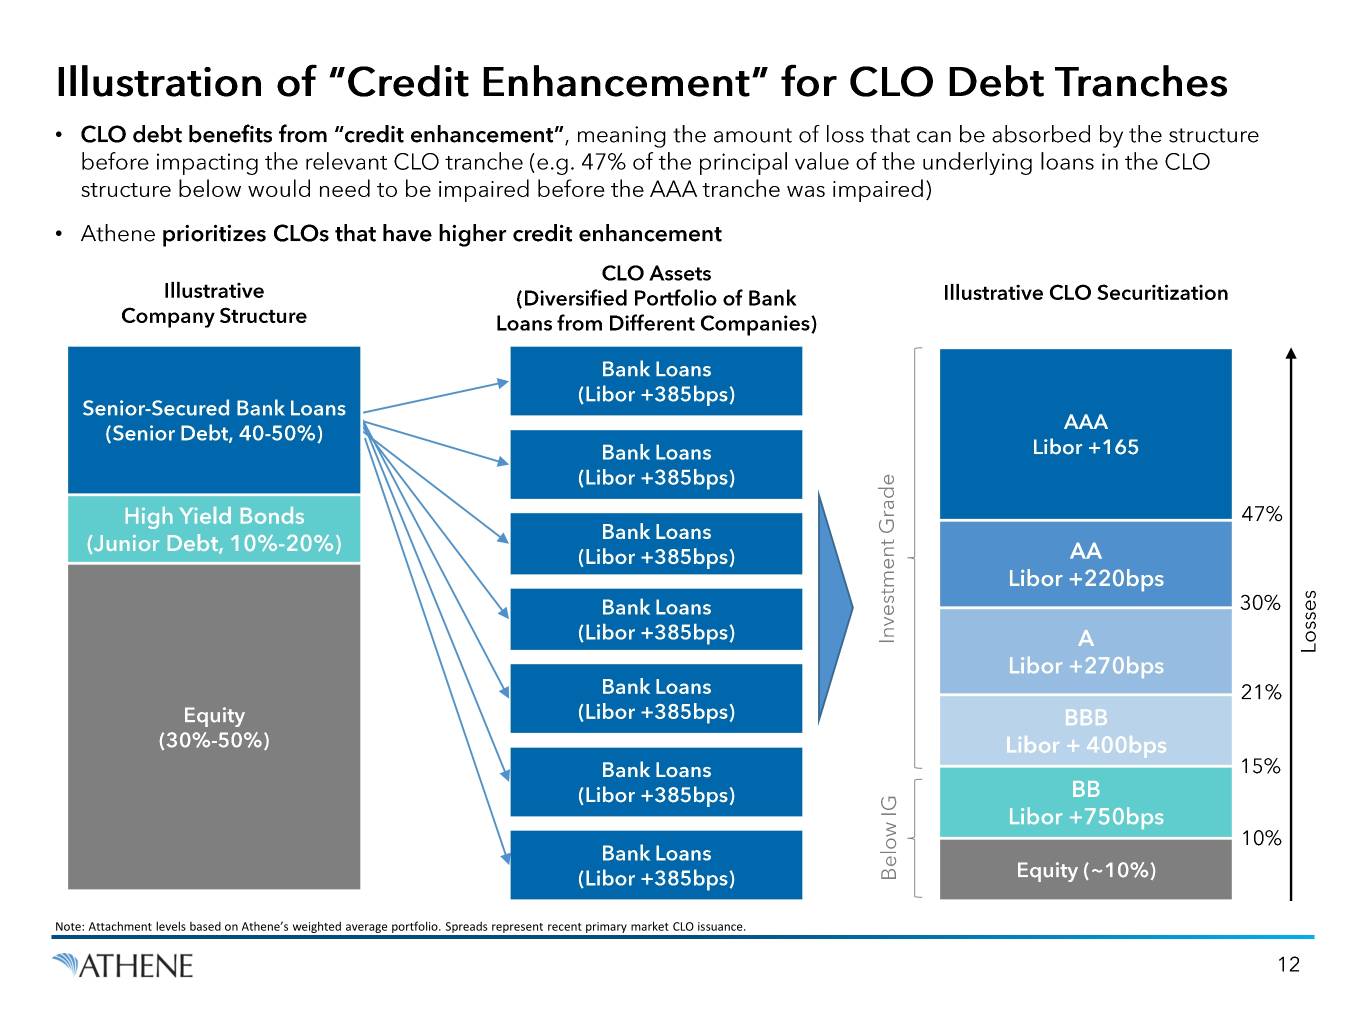
• • Note: Attachment levels based on Athene’s weighted average portfolio. Spreads represent recent primary market CLO issuance.

• • ‒ • • ‒ 1 “Loss Rates” refer to default rate net of recoveries. Source: Moody’s The Performance of Moody’s structured finance ratings – Q2 2020 (July 2020). 2 Source: Moody’s Impairment and loss rates of structured finance securities: 2009-19 (May 2020). 3 Net of fees, based on market spreads to swap rates as of June 30, 2020 for a portfolio of CLOs with the same ratings profile as Athene’s existing CLO portfolio compared to corporate bonds with a 5-year duration and same ratings profile. 4 Source: NAIC, Intex, and Wall Street Research. 5 Data for leveraged loans is from JP Morgan and references data from and 1998 to 2019.
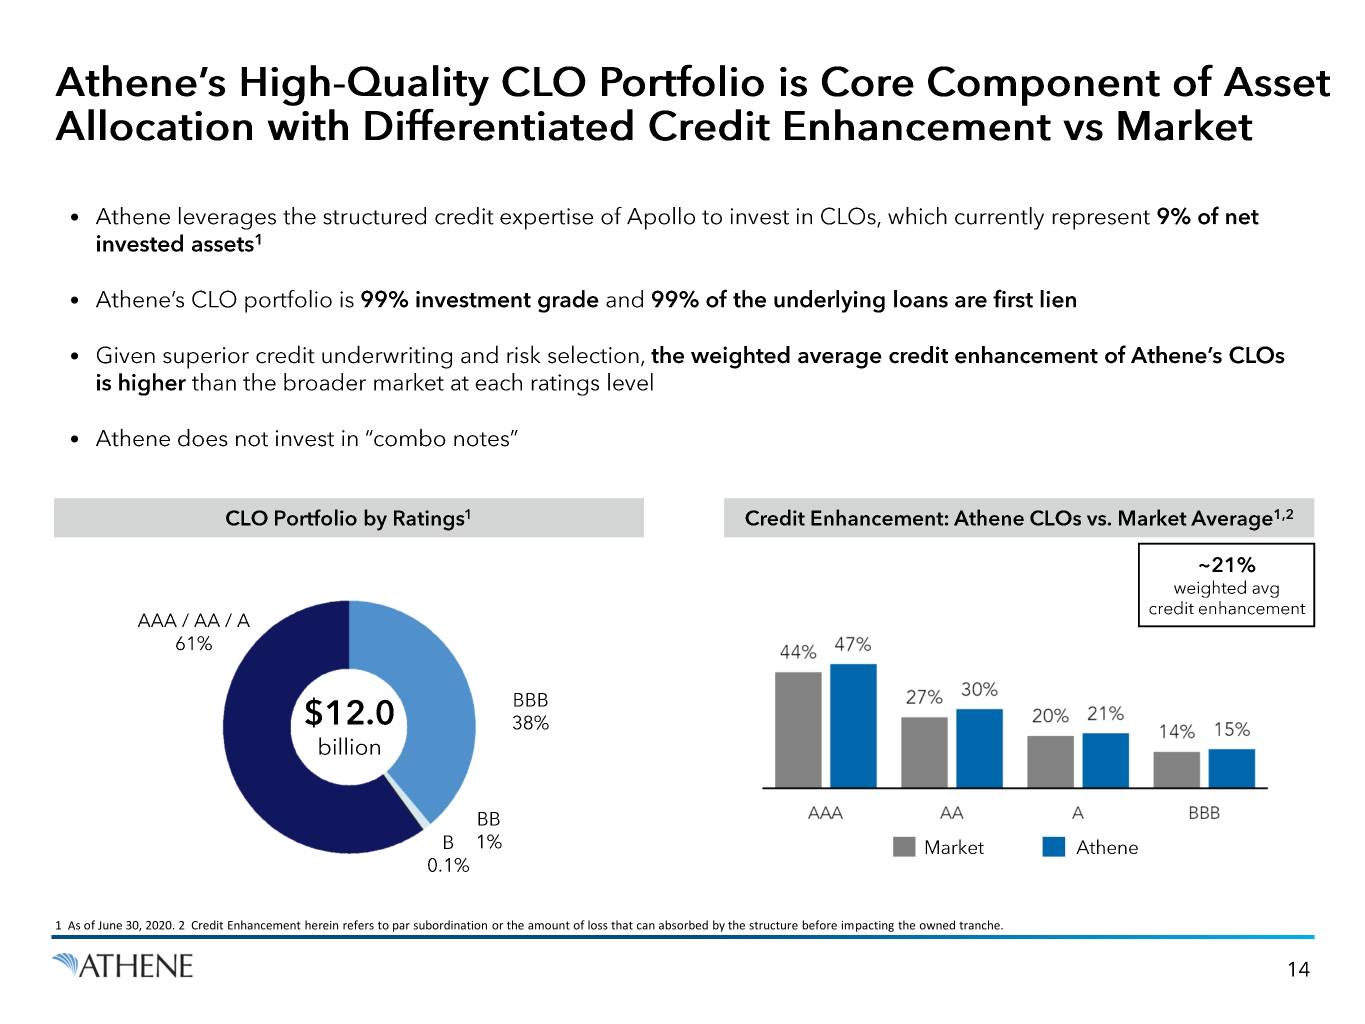
• • • • 1 As of June 30, 2020. 2 Credit Enhancement herein refers to par subordination or the amount of loss that can absorbed by the structure before impacting the owned tranche.
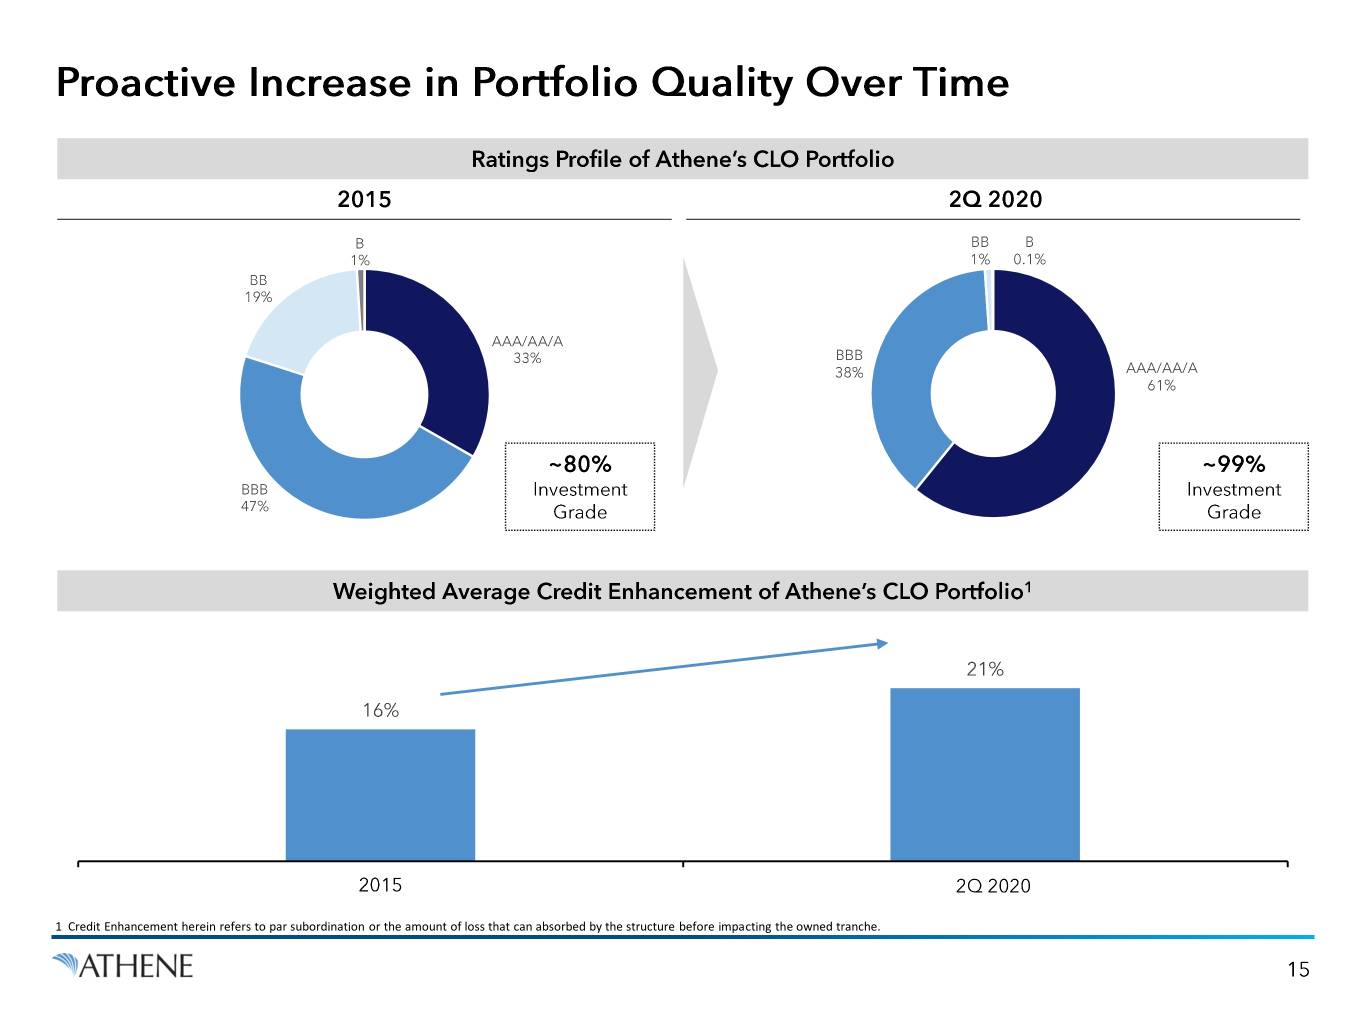
1 Credit Enhancement herein refers to par subordination or the amount of loss that can absorbed by the structure before impacting the owned tranche.
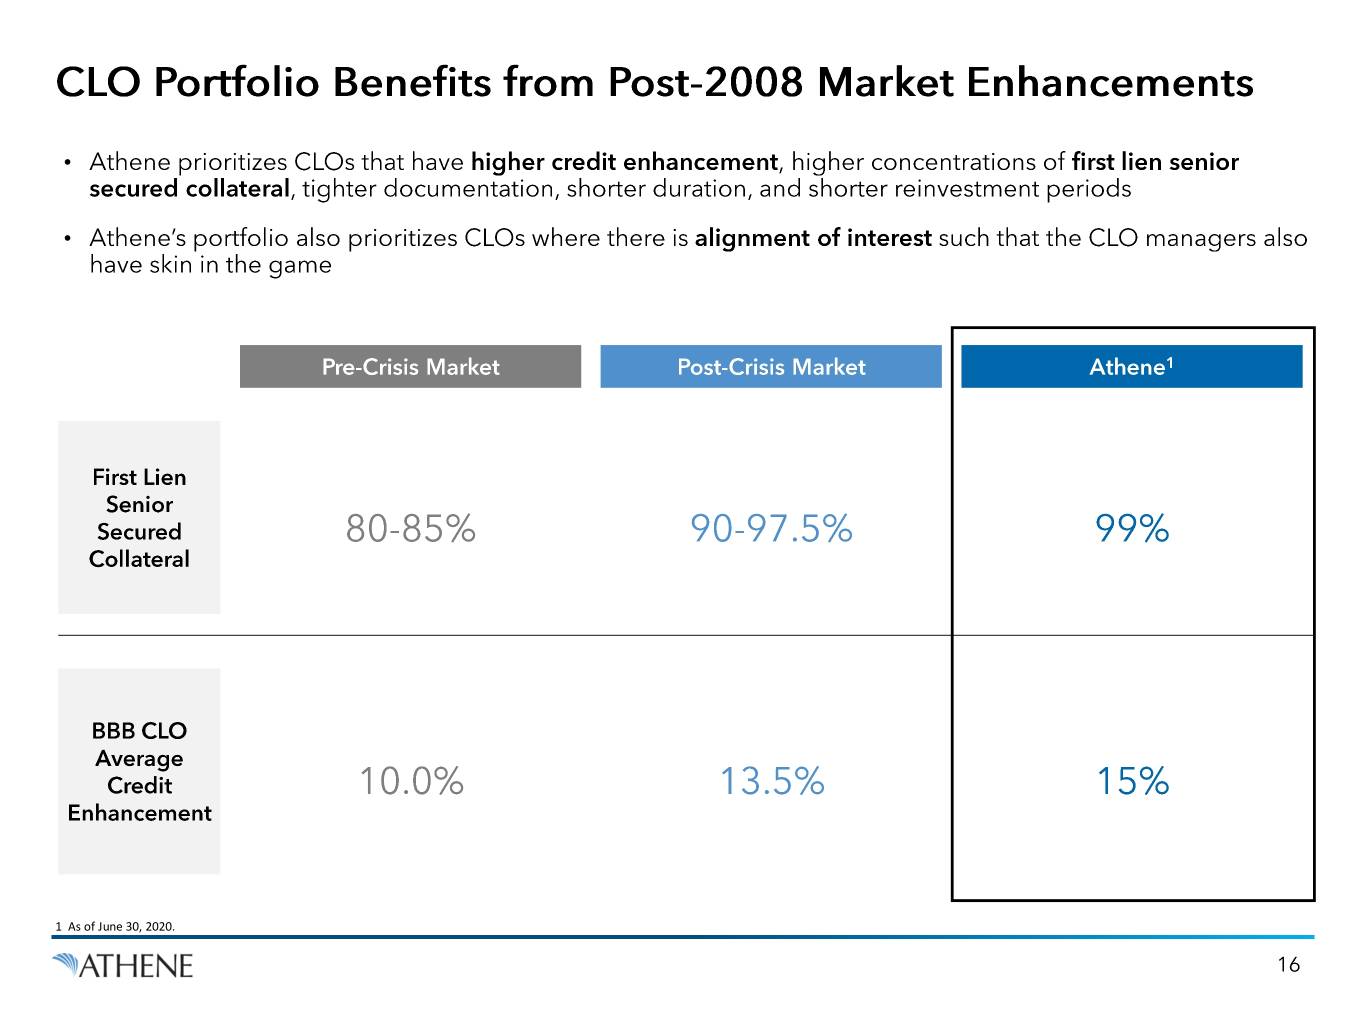
• • 1 As of June 30, 2020.
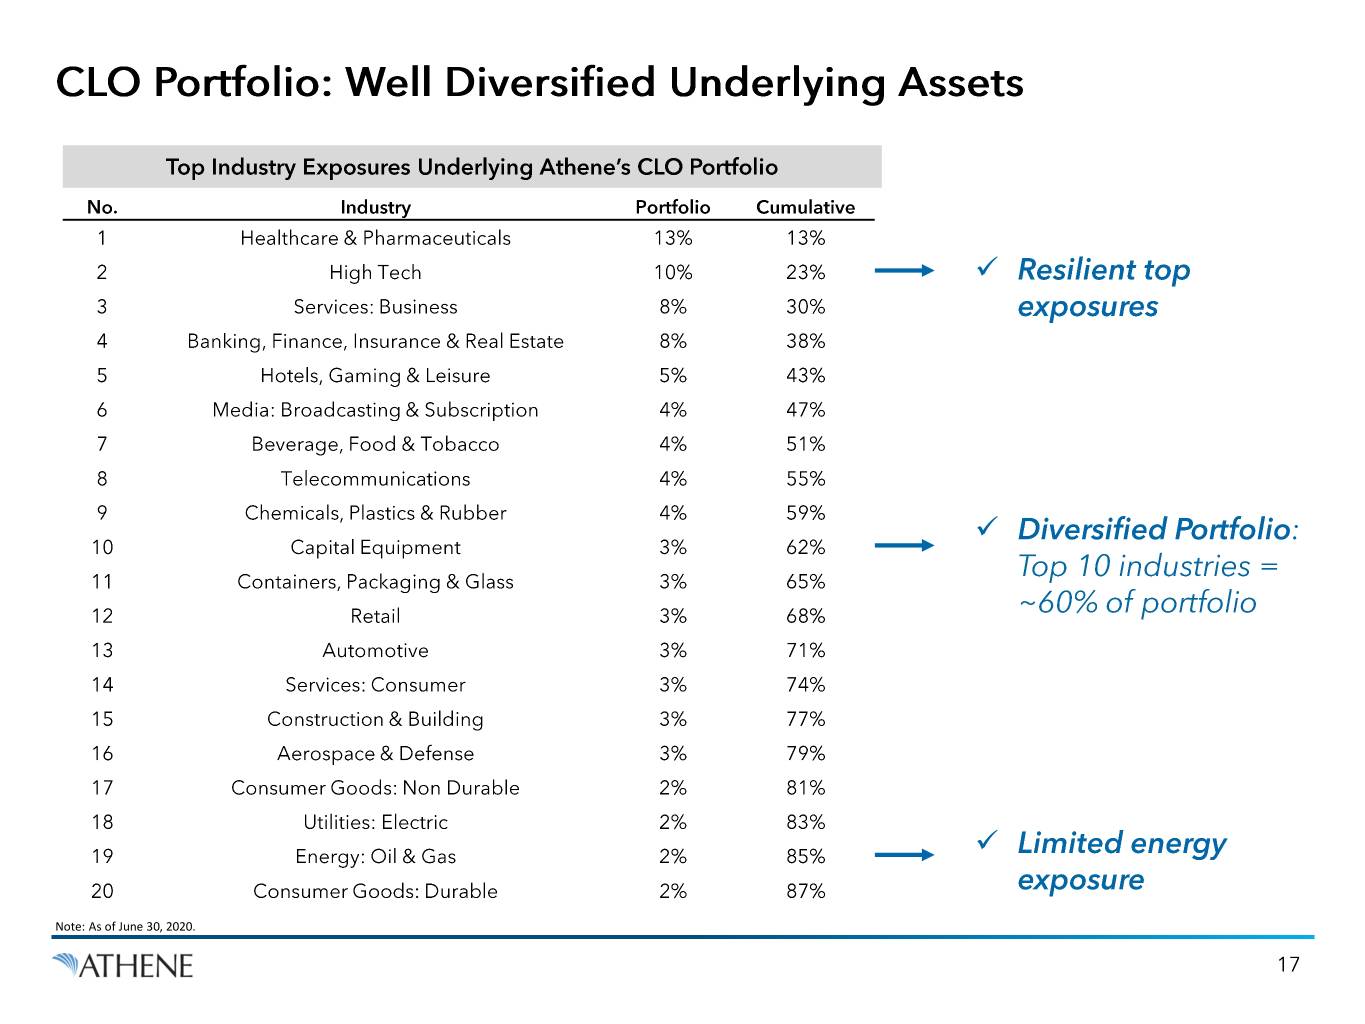
✓ ✓ ✓ Note: As of June 30, 2020.
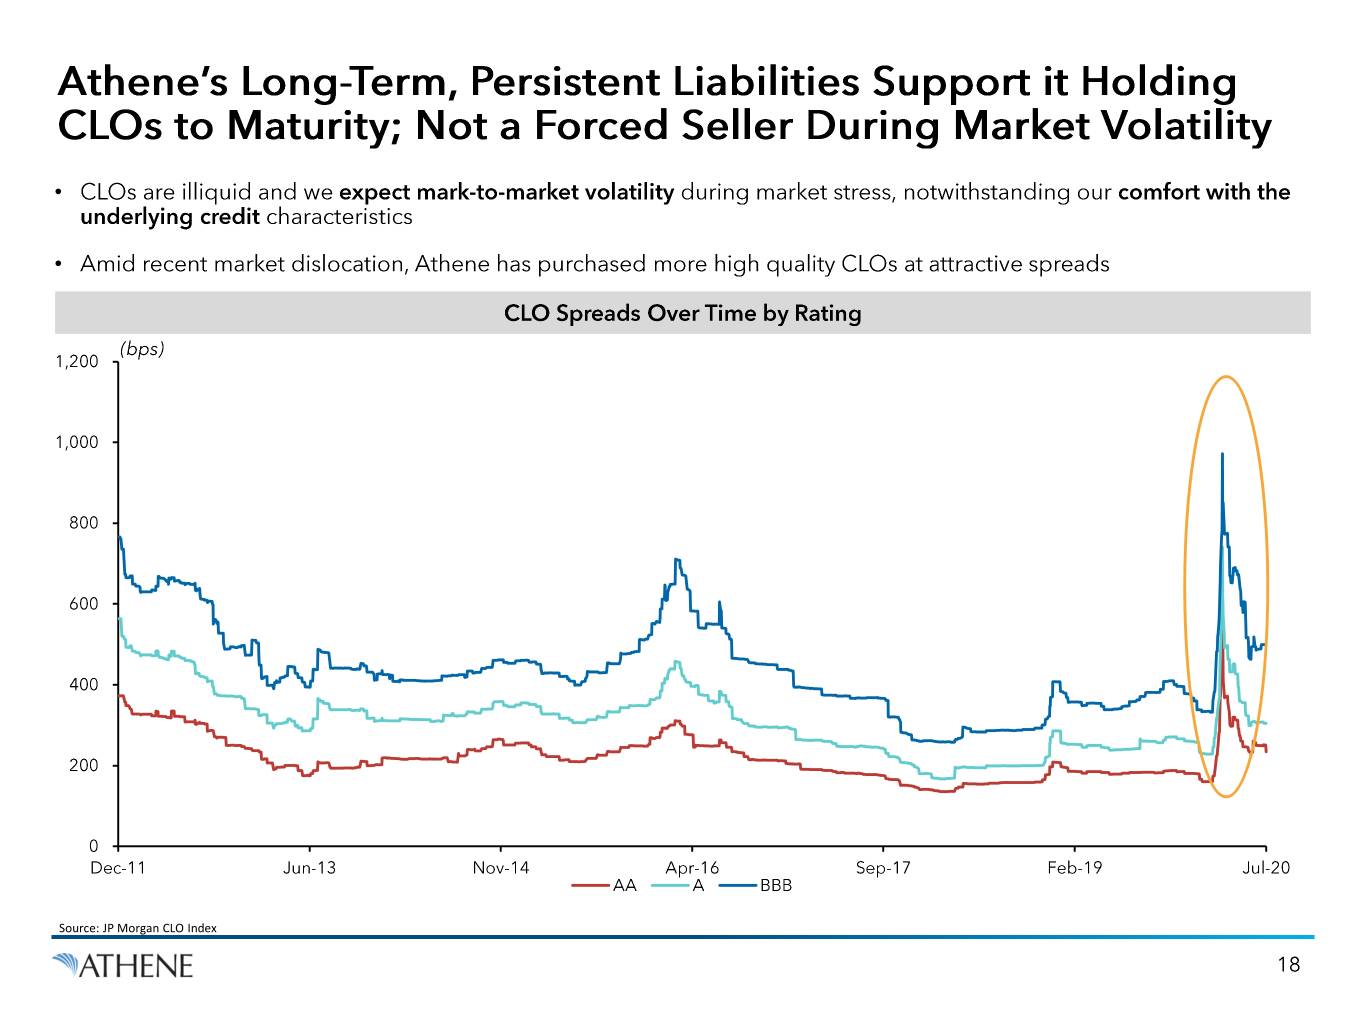
• • Source: JP Morgan CLO Index

• • 1 Based on internal estimates. 2 Source: LCD, Intex, S&P, Moody’s, Wells Fargo Securities.
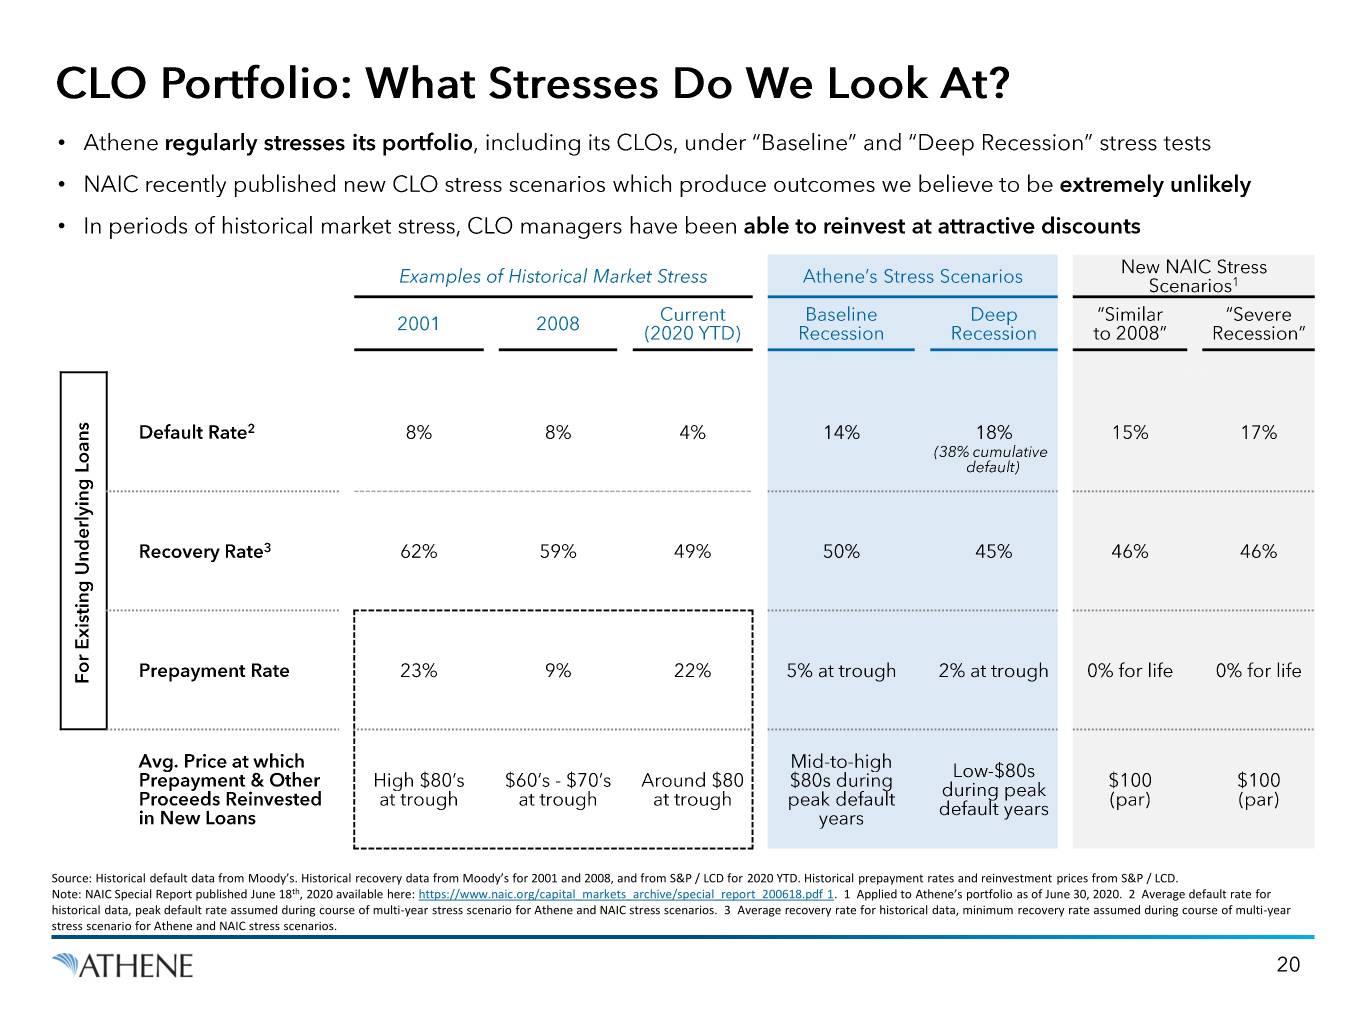
• • • Source: Historical default data from Moody’s. Historical recovery data from Moody’s for 2001 and 2008, and from S&P / LCD for 2020 YTD. Historical prepayment rates and reinvestment prices from S&P / LCD. Note: NAIC Special Report published June 18th, 2020 available here: https://www.naic.org/capital_markets_archive/special_report_200618.pdf 1. 1 Applied to Athene’s portfolio as of June 30, 2020. 2 Average default rate for historical data, peak default rate assumed during course of multi-year stress scenario for Athene and NAIC stress scenarios. 3 Average recovery rate for historical data, minimum recovery rate assumed during course of multi-year stress scenario for Athene and NAIC stress scenarios.
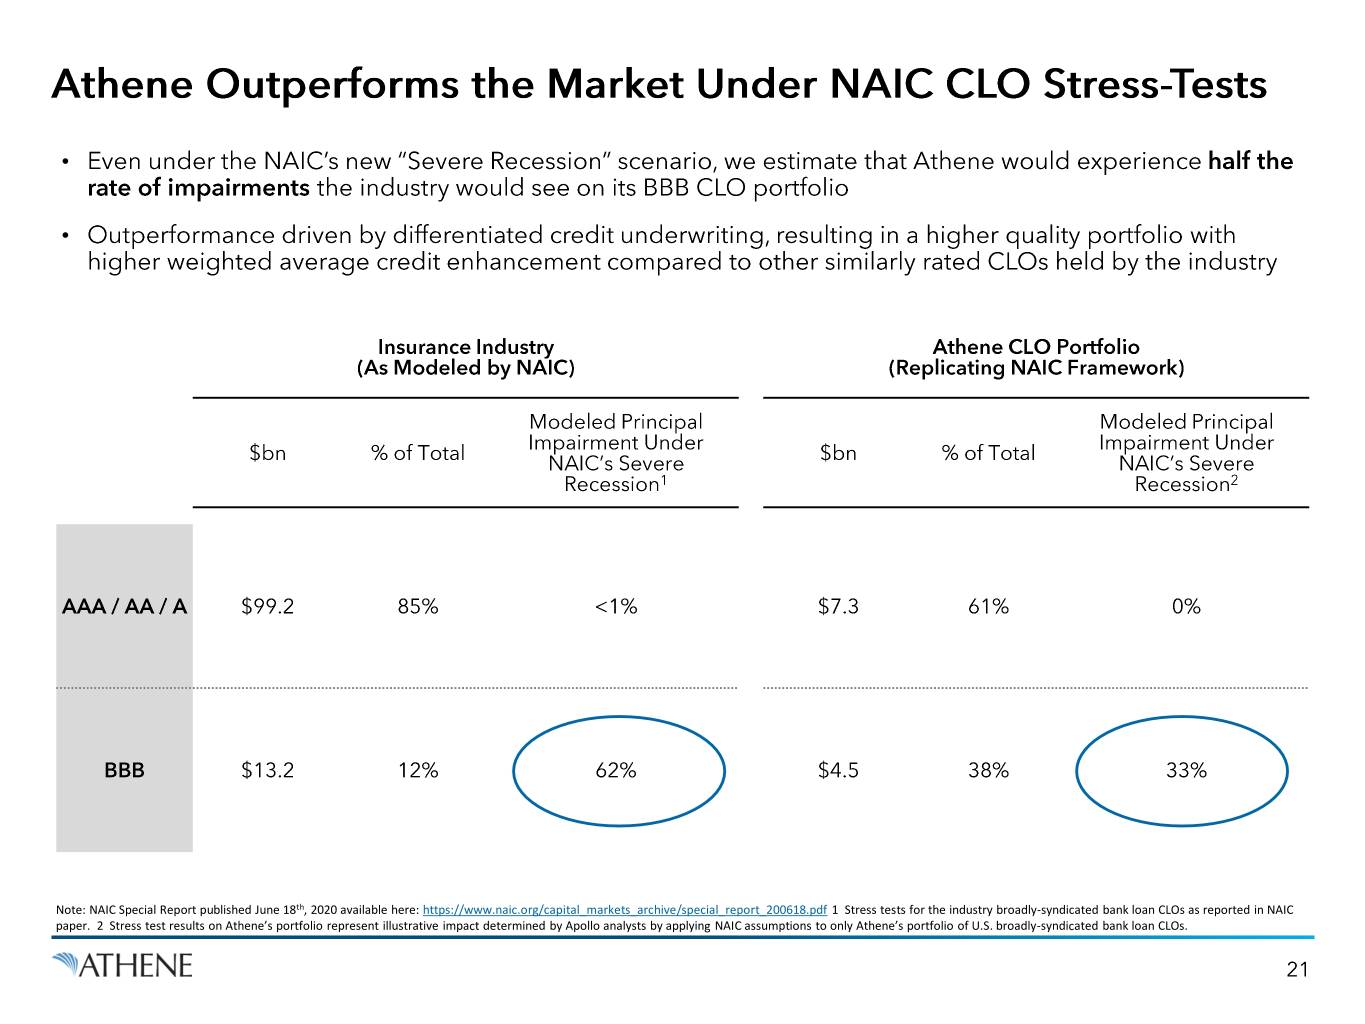
• • Note: NAIC Special Report published June 18th, 2020 available here: https://www.naic.org/capital_markets_archive/special_report_200618.pdf 1 Stress tests for the industry broadly-syndicated bank loan CLOs as reported in NAIC paper. 2 Stress test results on Athene’s portfolio represent illustrative impact determined by Apollo analysts by applying NAIC assumptions to only Athene’s portfolio of U.S. broadly-syndicated bank loan CLOs.
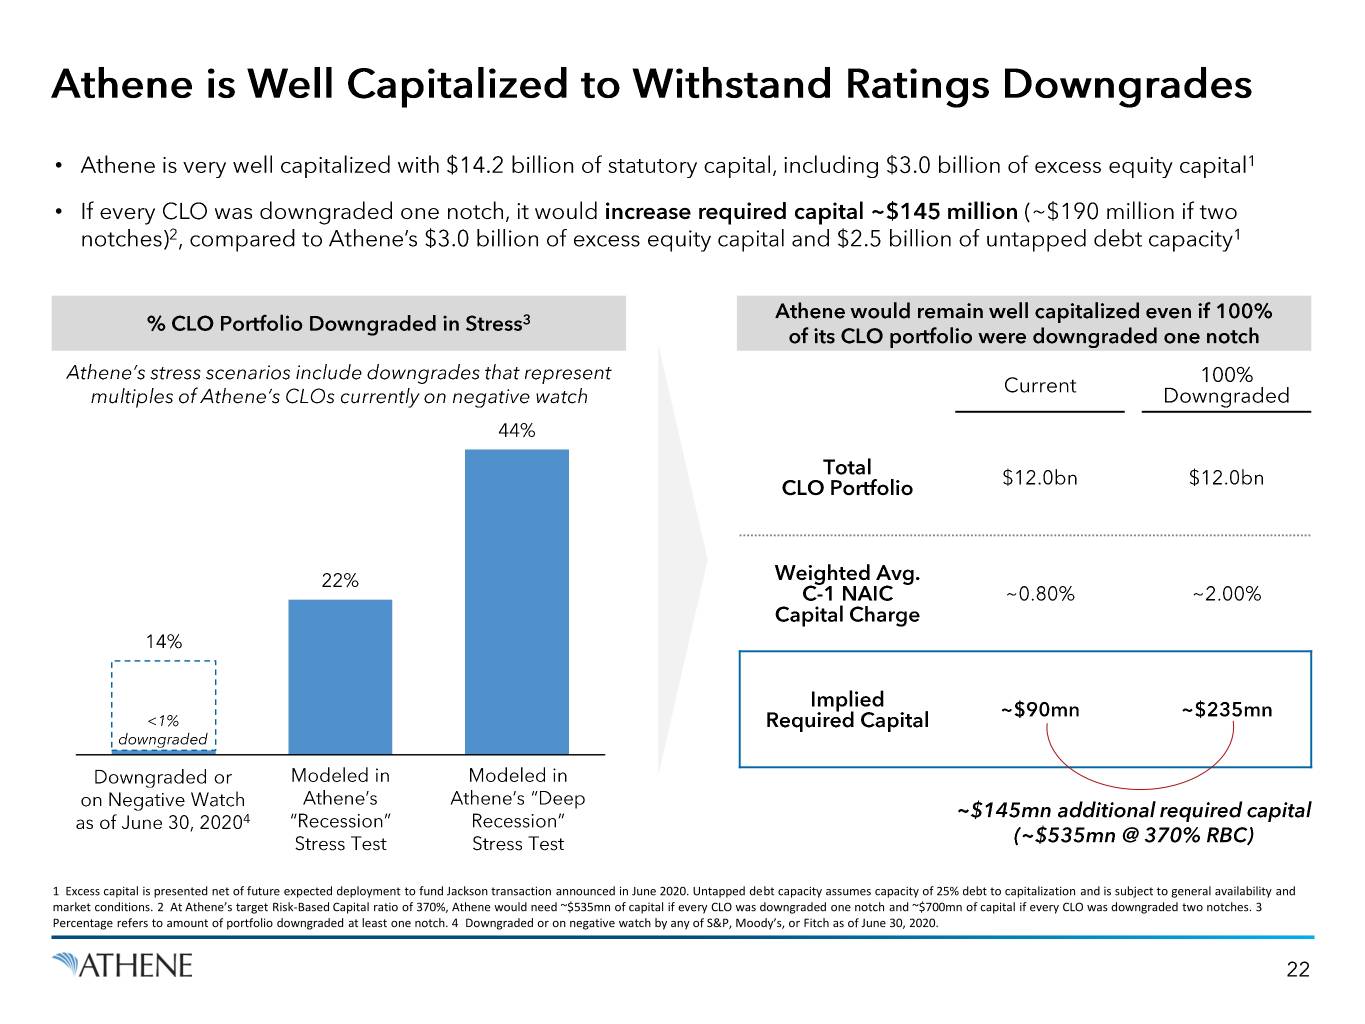
• • 1 Excess capital is presented net of future expected deployment to fund Jackson transaction announced in June 2020. Untapped debt capacity assumes capacity of 25% debt to capitalization and is subject to general availability and market conditions. 2 At Athene’s target Risk-Based Capital ratio of 370%, Athene would need ~$535mn of capital if every CLO was downgraded one notch and ~$700mn of capital if every CLO was downgraded two notches. 3 Percentage refers to amount of portfolio downgraded at least one notch. 4 Downgraded or on negative watch by any of S&P, Moody’s, or Fitch as of June 30, 2020.
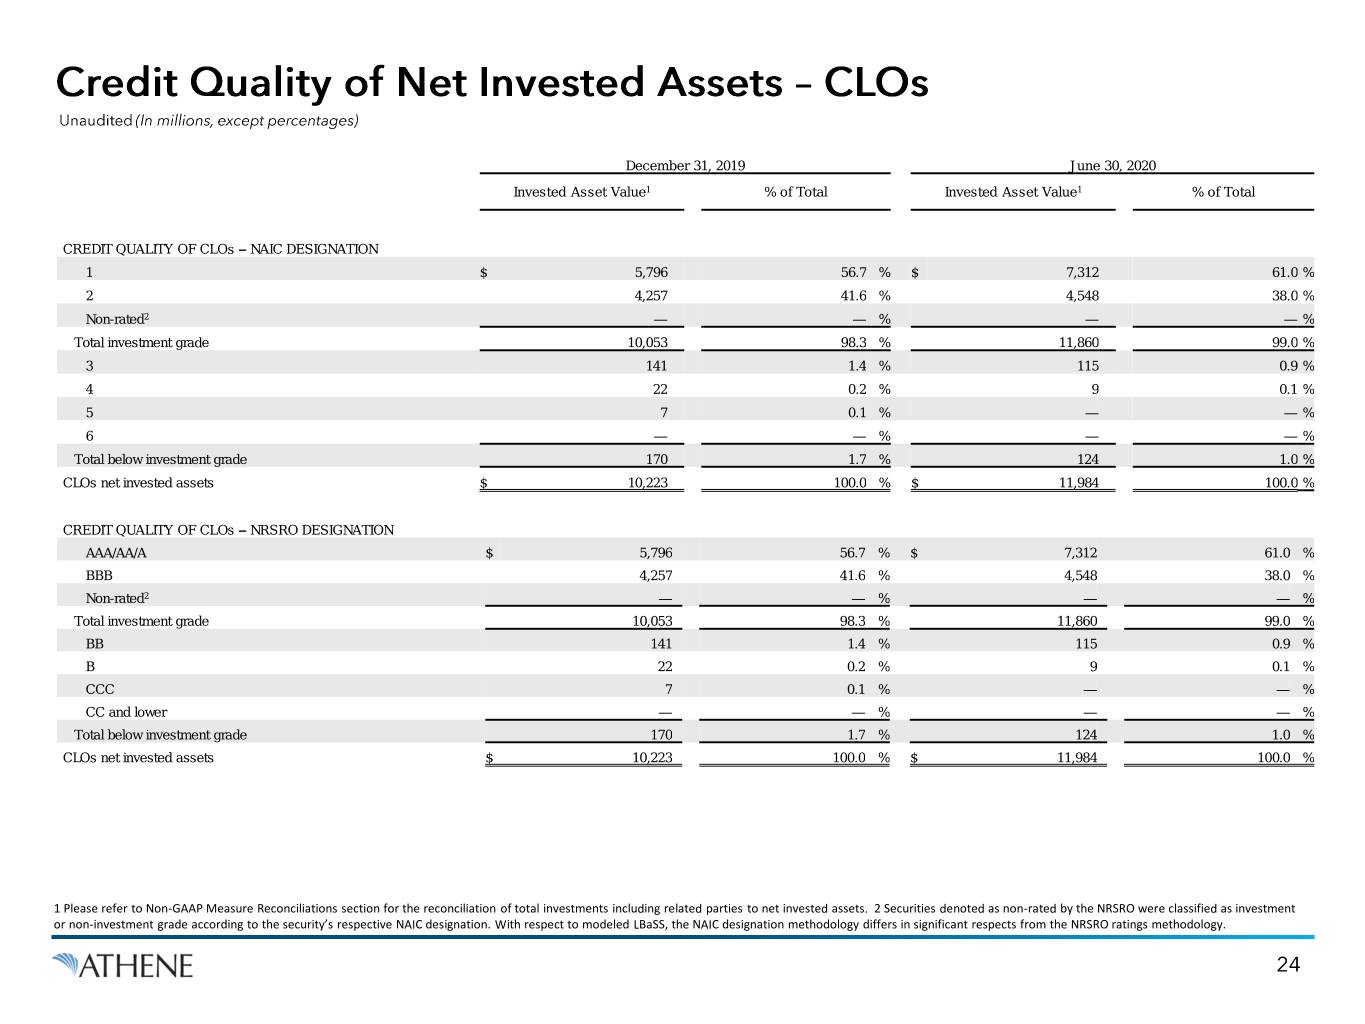
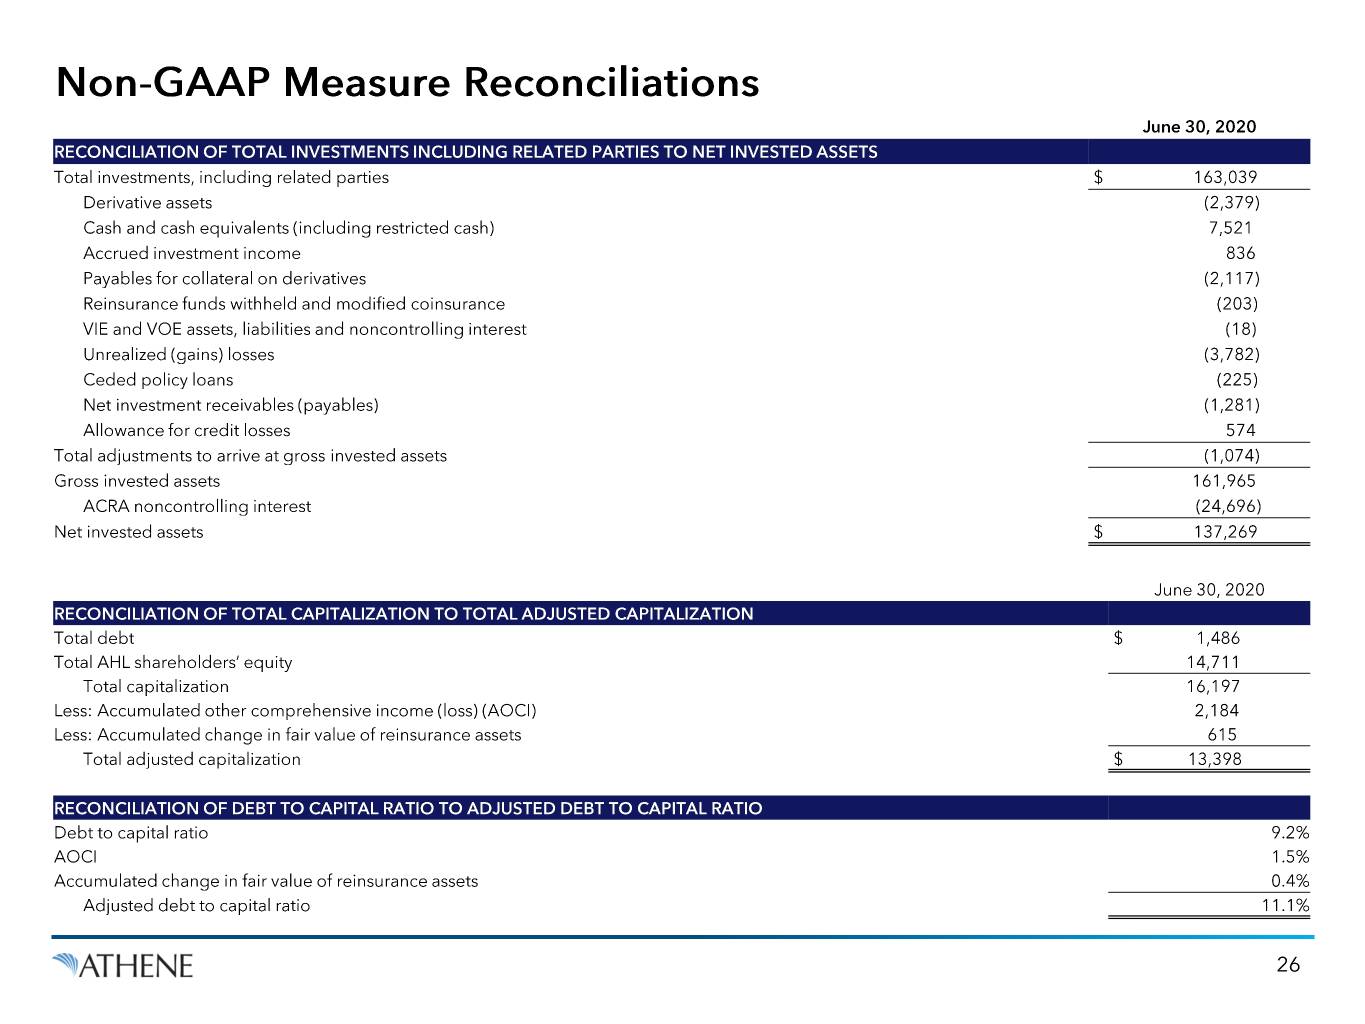
December 31, 2019 June 30, 2020 Invested Asset Value1 % of Total Invested Asset Value1 % of Total CREDIT QUALITY OF CLOs – NAIC DESIGNATION 1 $ 5,796 56.7 % $ 7,312 61.0 % 2 4,257 41.6 % 4,548 38.0 % Non-rated2 — — % — — % Total investment grade 10,053 98.3 % 11,860 99.0 % 3 141 1.4 % 115 0.9 % 4 22 0.2 % 9 0.1 % 5 7 0.1 % — — % 6 — — % — — % Total below investment grade 170 1.7 % 124 1.0 % CLOs net invested assets $ 10,223 100.0 % $ 11,984 100.0 % CREDIT QUALITY OF CLOs – NRSRO DESIGNATION AAA/AA/A $ 5,796 56.7 % $ 7,312 61.0 % BBB 4,257 41.6 % 4,548 38.0 % Non-rated2 — — % — — % Total investment grade 10,053 98.3 % 11,860 99.0 % BB 141 1.4 % 115 0.9 % B 22 0.2 % 9 0.1 % CCC 7 0.1 % — — % CC and lower — — % — — % Total below investment grade 170 1.7 % 124 1.0 % CLOs net invested assets $ 10,223 100.0 % $ 11,984 100.0 % 1 Please refer to Non-GAAP Measure Reconciliations section for the reconciliation of total investments including related parties to net invested assets. 2 Securities denoted as non-rated by the NRSRO were classified as investment or non-investment grade according to the security’s respective NAIC designation. With respect to modeled LBaSS, the NAIC designation methodology differs in significant respects from the NRSRO ratings methodology.
