UNITED STATES
SECURITIES AND EXCHANGE COMMISSION
Washington, D.C. 20549
____________
Form 6-K
____________
REPORT OF FOREIGN PRIVATE ISSUER PURSUANT TO RULE 13a-16 OR 15d-16 UNDER THE SECURITIES EXCHANGE ACT OF 1934
August 13, 2020
Commission File Number: 333-177693
Reynolds Group Holdings Limited
(Translation of registrant’s name into English)
Reynolds Group Holdings Limited
Level Nine
148 Quay Street
Auckland 1010 New Zealand
(Address of principal executive office)
Indicate by check mark whether the registrant files or will file annual reports under cover of Form 20-F or Form 40-F:
Form 20-F x Form 40-F ¨
Indicate by check mark if the registrant is submitting the Form 6-K in paper as permitted by Regulation S-T Rule 101(b)(1): ¨
Indicate by check mark if the registrant is submitting the Form 6-K in paper as permitted by Regulation S-T Rule 101(b)(7): ¨
QUARTERLY REPORT
For the three and six month periods ended June 30, 2020
REYNOLDS GROUP HOLDINGS LIMITED
New Zealand
(Jurisdiction of incorporation or organization)
Reynolds Group Holdings Limited
Level Nine
148 Quay Street
Auckland 1010 New Zealand
Attention: Joseph Doyle
Tel: +1 847 482 2409
SIGNATURES
Pursuant to the requirements of the Securities Exchange Act of 1934, the registrant has duly caused this report to be signed on its behalf by the undersigned, thereunto duly authorized.
| Reynolds Group Holdings Limited | ||
| (Registrant) | ||
| By: | /s/ ALLEN HUGLI | |
| Allen Hugli | ||
| Chief Financial Officer | ||
| August 13, 2020 | ||
Table of Contents
| PART I - FINANCIAL INFORMATION | |||||||
| ITEM 1. FINANCIAL STATEMENTS | |||||||
| ITEM 2. MANAGEMENT’S DISCUSSION AND ANALYSIS OF FINANCIAL CONDITION AND RESULTS OF OPERATIONS | |||||||
| Overview | |||||||
| Key Factors Influencing Our Financial Condition and Results of Operations | |||||||
| Results of Operations | |||||||
| Liquidity and Capital Resources | |||||||
| Accounting Principles | |||||||
| Critical Accounting Policies | |||||||
| Recently Issued Accounting Pronouncements | |||||||
| ITEM 3. QUANTITATIVE AND QUALITATIVE DISCLOSURES ABOUT MARKET RISK | |||||||
| ITEM 4. CONTROLS AND PROCEDURES | |||||||
| PART II - OTHER INFORMATION | |||||||
| ITEM 1. LEGAL PROCEEDINGS | |||||||
| ITEM 1A. RISK FACTORS | |||||||
| ITEM 2. UNREGISTERED SALES OF EQUITY SECURITIES AND USE OF PROCEEDS | |||||||
| ITEM 3. DEFAULTS UPON SENIOR SECURITIES | |||||||
| ITEM 4. MINE SAFETY DISCLOSURE | |||||||
| ITEM 5. OTHER INFORMATION | |||||||
| ITEM 6. EXHIBITS | |||||||
1
Introductory Note
In this quarterly report, references to “we,” “us,” “our” or the “RGHL Group” are to Reynolds Group Holdings Limited (“RGHL”) and its consolidated subsidiaries, unless otherwise indicated.
Certain financial information that is normally included in annual financial statements, including certain financial statement notes, is not required for interim reporting purposes and has been condensed or omitted in this quarterly report. Our annual report on Form 20-F for the year ended December 31, 2019 filed with the U.S. Securities and Exchange Commission (the “SEC”) on March 10, 2020 (the “Annual Report”) also includes certain other information about our business, including risk factors and more detailed descriptions of our businesses, which is not included in this quarterly report. This quarterly report should be read in conjunction with the Annual Report, including the consolidated financial statements and notes thereto included therein. The SEC maintains an internet site at https://www.sec.gov, from which interested persons can electronically access the Annual Report including the exhibits thereto. The Annual Report can also be found at www.reynoldsgroupholdings.com, or a copy will be provided free of charge upon written request to Mr. Joseph Doyle, RGHL Group Legal Counsel, 1900 West Field Court, Lake Forest, Illinois, 60045.
We have prepared this quarterly report pursuant to (i) the requirements of the indentures governing certain of our outstanding notes, and (ii) the credit agreement with our lenders governing our senior secured credit facilities (the “Credit Agreement”). Our outstanding notes include the 5.125% Senior Secured Notes due 2023 (the “Reynolds Senior Secured Notes”), the 7.000% Senior Notes due 2024 (the “Reynolds Senior Notes”, and together with the Reynolds Senior Secured Notes the “Reynolds Notes”), and the 7.950% Debentures due 2025 and the 8.375% Debentures due 2027 (together, the “Pactiv Debentures”).
The indentures governing these notes, as well as our Credit Agreement, are described more fully in our Annual Report. Additionally, refer to “Part I - Financial Information — Item 2. Management's Discussion and Analysis of Financial Condition and Results of Operations — Recent Developments” and notes 12 and 16 of the RGHL Group’s interim unaudited condensed consolidated financial statements included elsewhere in this quarterly report for more information.
Non-GAAP Financial Measures
In this quarterly report, we utilize certain non-GAAP financial measures and ratios, including earnings before interest, tax, depreciation and amortization (“EBITDA”) and Adjusted EBITDA. Adjusted EBITDA, a measure used by our management to measure operating performance, is defined as EBITDA, adjusted to exclude certain items of a significant or unusual nature, including but not limited to acquisition costs, non-cash pension income or expense, restructuring costs, related party management fees, unrealized gains or losses on derivatives, gains or losses on the sale of non-strategic assets, asset impairments and write-downs, strategic review costs and equity method profit not distributed in cash. These measures are presented because we believe that they and similar measures are widely used in the markets in which we operate as a means of evaluating a company’s operating performance and financing structure and, in certain cases, because those measures are used to determine compliance with covenants in our debt agreements and compensation of certain management. They may not be comparable to other similarly titled measures of other companies and are not measurements under International Financial Reporting Standards (“IFRS”), as issued by the International Accounting Standards Board (“IASB”), generally accepted accounting principles in the United States of America (“U.S. GAAP”), or other generally accepted accounting principles, are not measures of financial condition, liquidity or profitability and should not be considered as an alternative to profit from operations for the period or operating cash flows determined in accordance with IFRS, nor should they be considered as substitutes for the information contained in our financial statements prepared in accordance with IFRS included in this quarterly report. Additionally, EBITDA and Adjusted EBITDA are not intended to be measures of free cash flow, as they do not take into account certain items such as interest and principal payments on our indebtedness, working capital needs, tax payments and capital expenditures. We believe that the inclusion of EBITDA and Adjusted EBITDA in this quarterly report is appropriate to provide additional information to investors about our operating performance and to provide a measure of operating results unaffected by differences in capital structures, capital investment cycles and ages of related assets among otherwise comparable companies. We believe that issuers of high yield debt securities present EBITDA and Adjusted EBITDA because investors, analysts and rating agencies consider these measures useful. For additional information regarding the segment performance measures used by management, refer to note 4 of the RGHL Group’s interim unaudited condensed consolidated financial statements included elsewhere in this quarterly report.
Forward-Looking Statements
This quarterly report includes forward-looking statements. Forward-looking statements include statements regarding our goals, beliefs, plans or current expectations, taking into account the information currently available to our management. Forward-looking statements are not statements of historical fact. For example, when we use words such as “believe,” “anticipate,” “expect,” “estimate,” “plan,” “intend,” “should,” “would,” “could,” “may,” “might,” “will” or other words that convey uncertainty of future events or outcomes, we are making forward-looking statements. We have based these forward-looking statements on our management’s current view with respect to future events and financial performance and future business and economic conditions more generally. These views reflect the best judgment of our management, but involve a number of risks and uncertainties which could cause actual results to differ materially from those predicted in our forward-looking statements and from past results, performance or achievements. Although we believe that the estimates and the projections reflected in the forward-looking statements are reasonable, such estimates and projections may prove to be incorrect, and our actual results may differ from those described in our forward-looking statements as a result of the following risks, uncertainties and assumptions, among others:
| • | risks related to the COVID-19 pandemic, including the associated effect of heightening many of the other risks disclosed in our Annual Report; |
| • | risks related to future costs of raw materials, energy and freight, including the impact of tariffs, trade sanctions and similar matters affecting our importation of certain raw materials; |
| • | risks related to economic downturns in our target markets; |
| • | risks related to changes in consumer lifestyle, eating habits, nutritional preferences and health-related and environmental concerns that may harm our business and financial performance; |
2
| • | risks related to complying with environmental, health and safety laws or as a result of satisfying any liability or obligation imposed under such laws; |
| • | risks related to the impact of a loss of any of our key manufacturing facilities; |
| • | risks related to our dependence on key management and other highly skilled personnel; |
| • | risks related to the consolidation of our customer bases, loss of a significant customer, competition and pricing pressure; |
| • | risks related to any potential supply of faulty or contaminated products; |
| • | risks related to exchange rate fluctuations; |
| • | risks related to dependence on the protection of our intellectual property and the development of new products; |
| • | risks related to pension plans sponsored by us and others in our control group; |
| • | risks related to strategic transactions, including completed and future acquisitions or dispositions; |
| • | risks related to our hedging activities which may result in significant losses and in period-to-period earnings volatility; |
| • | risks related to our suppliers of raw materials and any interruption in our supply of raw materials; |
| • | risks related to information security, including a cybersecurity breach or a failure of one or more of our information technology systems, networks, processes or service providers; |
| • | risks related to related party transactions entered into with Reynolds Consumer Products Inc. (“RCPI”) and its subsidiaries (“Reynolds Consumer Products”); |
| • | risks related to the tax-free distribution of our interest in RCPI to our shareholder, Packaging Finance Limited (“PFL”); |
| • | risks related to our substantial indebtedness and our ability to service our current and future indebtedness; |
| • | risks related to restrictive covenants in certain of our outstanding notes and our other indebtedness which could adversely affect our business by limiting our operating and strategic flexibility; and |
| • | risks related to increases in interest rates which would increase the cost of servicing our variable rate debt instruments. |
The risks described above and the risks disclosed in or referred to in “Part II - Other Information — Item 1A. Risk Factors” in this quarterly report and in “Part I — Item 3. Key Information — Risk Factors” of our Annual Report are not exhaustive. Other sections of this quarterly report describe additional factors that could adversely affect our business, financial condition or results of operations. Moreover, we operate in a very competitive and rapidly changing environment. New risk factors emerge from time to time and it is not possible for us to predict all such risk factors, nor can we assess the impact of all such risk factors on our business or the extent to which any factor, or combination of factors, may cause actual results to differ materially from those contained in any forward-looking statements. Given these risks and uncertainties, you are cautioned not to place undue reliance on these forward-looking statements, which speak only as of the date hereof. Except as required by law, we undertake no obligation to publicly update or revise any forward-looking statement, whether as a result of new information, future events or otherwise. All subsequent written and oral forward-looking statements attributable to us or to persons acting on our behalf are expressly qualified in their entirety by the cautionary statements referred to above and included elsewhere in this quarterly report.
PART I - FINANCIAL INFORMATION
ITEM 1. FINANCIAL STATEMENTS.
Refer to the attached F pages of this quarterly report for our interim unaudited condensed consolidated financial statements and notes thereto for the three and six month periods ended June 30, 2020 and June 30, 2019.
3
ITEM 2. MANAGEMENT’S DISCUSSION AND ANALYSIS OF FINANCIAL CONDITION AND RESULTS OF OPERATIONS.
Recent developments
Separate financing of Graham Packaging
On August 4, 2020, the legal entities that comprise the Graham Packaging segment (“GPC”) were designated as unrestricted subsidiaries under the Credit Agreement and the Reynolds Notes and the relevant GPC entities were released as a borrower under, and guarantors of, the Credit Agreement and released as guarantors of the Reynolds Notes. The security granted by such entities was also released.
On August 4, 2020 GPC entered into a credit agreement (the “GPC Credit Agreement”), which provides for a $1,475 million senior secured term loan facility maturing in August 2027 and a $100 million revolving facility maturing in August 2025. The term loan was fully drawn on August 4, 2020 and bears interest at the LIBO Rate, subject to a 0.75% floor, plus a margin of 3.75%. The revolving facility has been utilized in the amount of approximately $4 million for letters of credit.
The obligations under the GPC Credit Agreement are guaranteed by certain subsidiaries in GPC and are secured by substantially all the assets of the borrower and the guarantors.
On August 4, 2020, GPC also issued $510 million of 7.125% senior notes maturing in August 2028 (together with the GPC term loans under the GPC Credit Agreement, the “GPC Borrowings”). The senior notes are guaranteed by the same entities that guarantee the obligations under the GPC Credit Agreement.
The terms of the GPC Borrowings restrict distributions of cash or assets from GPC to the rest of the RGHL Group. No entities outside of GPC have provided any guarantees or security in relation to the GPC Borrowings.
The net proceeds from the GPC Borrowings were distributed to certain non-GPC members of the RGHL Group and were partially used to repay certain of the borrowings described below.
Repayment of borrowings
Subsequent to June 30, 2020, we have repaid an aggregate of $2,094 million principal amount of borrowings, and we have issued a conditional notice of redemption to redeem an additional $150 million of senior notes as described below.
On July 31, 2020, we repaid the $380 million of principal outstanding under the Securitization Facility and terminated this facility.
On August 4, 2020, we: (i) satisfied and discharged the $749 million aggregate principal amount outstanding under the Floating Rate Senior Secured Notes due 2021 at par; (ii) repaid in full the €236 million ($265 million) of borrowings under the European Term Loan and all obligations under this tranche terminated; and (iii) repaid $700 million of borrowings under the U.S. Term Loans.
On July 30, 2020, we issued a conditional redemption notice to redeem $150 million aggregate principal amount of the 7.000% senior notes due 2024 at price of 101.750%. The conditions for the redemption were satisfied on August 4, 2020 with the redemption scheduled to occur on August 29, 2020.
On a pro forma basis, following the repayment of the borrowings described above we have $7,213 million of borrowings outstanding. This comprises $1,987 million of borrowings with Graham Packaging and $5,226 million in the rest of the RGHL Group.
Other
On August 4, 2020, we announced that we have confidentially submitted a draft registration statement on Form S-1 to the SEC relating to the proposed initial public offering of our common stock. The number of shares to be offered and the price range for the proposed offering have not yet been determined. The initial public offering is expected to commence after the SEC completes its review process, subject to market and other conditions. If the initial public offering proceeds, our present intention is to convert into a Delaware corporation with the name Pactiv Evergreen Inc. Furthermore, immediately prior to such initial public offering, we will distribute to our shareholder, PFL, our Graham Packaging business. There is no assurance that the initial public offering will be completed.
Overview
RGHL was incorporated on May 30, 2006 under the Companies Act 1993 of New Zealand. We are a leading global manufacturer and supplier of consumer and foodservice products and beverage containers. We sell our products to customers globally, including to a diversified mix of leading multinational companies, large national and regional companies, and small local businesses. We primarily serve the consumer food, beverage and foodservice market segments. On February 4, 2020, we distributed our former Reynolds Consumer Products segment to our shareholder. Following this transaction, we revised our segments on March 31, 2020. We operate through four reportable segments: Foodservice, Food Merchandising, Evergreen and Graham Packaging. Our previously reported Pactiv Foodservice segment is now two segments, Foodservice and Food Merchandising.
In addition to our four reportable segments, we have other operations which do not meet the quantitative threshold for reportable segments. These are reported as Other. We also have an Unallocated category that includes holding companies and certain debt issuer companies which support the entire RGHL Group and which are not part of a specific segment, as well as corporate functions such as finance, tax and legal, the impact of the Reynolds Group Pension Plan (“RGPP”) and eliminations of transactions between segments.
4
Our Segments
Foodservice
Foodservice manufactures a broad range of products that enable consumers to eat and drink where they want and when they want with convenience. Foodservice manufactures food containers, hot and cold cups and lids, dinnerware items and other products which make eating on-the-go more enjoyable and easy to do. Foodservice has a large customer base and operates in North America.
Food Merchandising
Food Merchandising manufactures products that protect and attractively display food while preserving freshness. Food Merchandising products include clear rigid-display containers, containers for prepared and ready-to-eat food, trays for meat and poultry and molded fiber cartons. Food Merchandising has a large customer base and operates primarily in North America.
Evergreen
Evergreen manufactures cartons for fresh refrigerated beverage products, primarily serving dairy (including plant-based, organic and specialties), juice and other specialty beverage end-markets. Evergreen manufactures and supplies integrated fresh carton systems, which include printed cartons, spouts and filling machinery. Evergreen also produces fiber-based liquid packaging board for its internal requirements and to sell to other fresh beverage carton manufacturers, as well as a range of paper-based products which it sells to paper and packaging converters. Evergreen has a large customer base and operates primarily in North America.
Graham Packaging
Graham Packaging is a designer and manufacturer of value-added, custom blow-molded plastic containers for consumer products. Graham Packaging has a large global customer base with its largest presence in North America.
Distribution of Reynolds Consumer Products
On February 4, 2020, we distributed our interest in the operations that represented the Reynolds Consumer Products segment to our shareholder, PFL. The distribution was effected in a manner that is intended to qualify as tax-free to us and to PFL. The distribution occurred prior to and in preparation for the initial public offering ("IPO") of shares of common stock of RCPI, which was completed on February 4, 2020. The distribution of Reynolds Consumer Products triggered the presentation of this operation as a discontinued operation in our interim unaudited condensed consolidated financial statements.
Repayment of Borrowings
On February 4, 2020, we repaid in full all of the $3.1 billion aggregate principal amount outstanding of our 5.750% Senior Secured Notes due 2020 at face value plus accrued and unpaid interest. During the six month period ended June 30, 2020, we also repaid an aggregate of $38 million of borrowings using the proceeds from the sale of our former North American and Japanese closures businesses and reduced the borrowings outstanding under the Securitization Facility by $40 million.
Key Factors Influencing Our Financial Condition and Results of Operations
The following discussion should be read in conjunction with “Key Factors Influencing Our Financial Condition and Results of Operations” in “Part I — Item 5. Operating and Financial Review and Prospects” of our Annual Report, which discusses further key factors influencing our financial condition and results of operations.
COVID-19
On March 11, 2020, the COVID-19 outbreak was declared a pandemic by the World Health Organization, which recommended containment and mitigation measures worldwide. Our business has been impacted by the pandemic, and we expect that impact to continue.
Although many jurisdictions implemented, for various periods of time, stay-at-home, closures or similar measures designed to limit the spread of COVID-19, resulting in the temporary closing of many businesses, these orders included exemptions for “essential businesses.” All of our operations fall within those exemptions and have remained open. We have implemented several policies designed to protect our employees and our customers including screening employees for symptoms of COVID-19 (including increased temperature checking), ensuring social distancing is observed, providing physical barriers and personal protective equipment where employees work closely together, tracking and tracing of COVID-19 positive employees and contractors to identify close contacts and locations frequented, engagement of third-party vendors to deep-clean and sanitize facilities, enhanced pay policies, and enhanced leave policies to ensure employees experiencing symptoms of COVID-19 stay at home. As the pandemic continues, we remain committed to adapting our policies and procedures to ensure the safety of our employees and compliance with federal, state and local regulations.
Some of our facilities operate in communities that have had high incident rates of COVID-19, resulting in many persons out sick or in quarantine, which has impacted production at some plants. Moreover, additional cleaning, implementation of employee screening processes and enhanced employee leave policies, and similar actions in response to the pandemic, have increased our costs. We have taken actions to reduce non-essential spending, including the furlough of certain of our employees, reducing working capital in areas affected by lower sales and reducing non-essential capital spending.
The COVID-19 pandemic had a significant impact on the results of operations in the second quarter, particularly in our Foodservice segment, with lesser impacts in our Food Merchandising, Evergreen and Graham Packaging segments. Our Foodservice segment has experienced a significant decline in revenue due to the closure or reduced activity of restaurants. Our Food Merchandising segment has experienced a decline in demand for the products typically used in many of the group gatherings that were either canceled or scaled back during the second quarter, while many of
5
our other Food Merchandising products, such as meat trays, continue to have strong market demand as people continue to eat more at home. Within our Evergreen segment, sales of fresh beverage cartons have remained relatively constant with declines in sales of school milk cartons being offset by higher demand in the retail segment, while sales in the paper markets have declined due to a decrease in demand of printed publications and advertising. Our Graham Packaging segment has experienced a minimal net positive impact with an increase in demand for containers used for food, beverages and disinfectants offset by a decrease in demand for containers used in the automotive markets as a result of people driving less. We expect that the COVID-19 pandemic will continue to impact our results of operations in future periods as the macroeconomic environment changes and consumer behavior continues to evolve.
In facilities that manufacture, warehouse and distribute products with softening demand, we have taken measures to reduce spending and production accordingly. To date, we have not experienced significant issues within our supply chain, including the sourcing of materials and logistics service providers. However, this may change the longer the pandemic continues.
We believe the increased demand for certain of our products results from more people eating at home and increased cleaning due to the pandemic. We cannot predict if, or for how long, such increased demand will continue. For those products with decreased demand, we do not expect to recover the sales lost during the pandemic, and certain industries we serve, primarily the restaurant industry, are experiencing severe impacts and may not return to pre-pandemic strength for a significant period of time. The duration of the COVID-19 pandemic remains unknown, and its ongoing impact on our operations may not be consistent with our experiences to date.
In addition, we have experienced volatility in the net liability for our pension plans, with the value of the plan assets and liabilities impacted by changes in financial markets in connection with the COVID-19 pandemic.
As of June 30, 2020, we had $1,609 million of cash on hand and $255 million available for drawing under the revolving facility of our Credit Agreement. Following the $2,094 million repayment of borrowings discussed above in “— Recent Developments,” our next significant near term maturity of outstanding borrowings are the U.S. Term Loans under our Credit Agreement which mature in February 2023. Our revolving credit facility, which is currently used for letters of credit, matures in August 2021. We do not currently anticipate that the COVID-19 pandemic will materially impact our liquidity over the next 12 months.
CARES Act
The Coronavirus Aid, Relief and Economic Security (“CARES”) Act was enacted in March 2020. Retroactive provisions of the CARES Act enable us to utilize additional allowable interest deductions, which lower our taxable income for the year ended December 31, 2019. The CARES Act also increases the allowable interest deductions for the year ending December 31, 2020. As a result of the CARES Act, we have recognized in the six month period ended June 30, 2020 a tax benefit of $90 million in respect of our taxable income for the year ended December 31, 2019. This estimate will be updated when the U.S. federal and state tax returns for the year ended December 31, 2019 are finalized and filed. For the year ending December 31, 2020, we expect further tax benefits from the CARES Act, including a tax benefit of approximately $31 million from the utilization of additional allowable interest deductions. This benefit has been recognized in the six month period ended June 30, 2020 at an amount higher than the expected result for the year ending December 31, 2020 because of the impact of the annualized effective tax rate. These estimates for 2019 and 2020 are also subject to further revision as result of regulations issued subsequent to June 30, 2020. For further information, refer to note 9 of the RGHL Group’s interim unaudited condensed consolidated financial statements included elsewhere in this quarterly report.
Substantial Leverage
The four segments in which we operate have all been acquired through a series of transactions. Our results of operations, financial position and cash flows are significantly impacted by the effects of these acquisitions, which were financed primarily through borrowings. In addition, from time to time, we refinance our borrowings which also can have a significant impact on our results of operations.
As of June 30, 2020, on a pro forma basis after the financing transactions discussed above in “— Recent Developments,” the outstanding principal amount of our borrowings was $7,213 million. As reflected in our consolidated statement of financial position as of June 30, 2020, we had total borrowings of $7,441 million, consisting of total indebtedness net of unamortized transaction costs, original issue discounts and embedded derivatives. For more information regarding our external borrowings, including the transactions subsequent to June 30, 2020, refer to notes 12 and 16 of the RGHL Group’s interim unaudited condensed consolidated financial statements included elsewhere in this quarterly report. Our future results of operations, including our net financial expenses, will be significantly affected by our substantial indebtedness. The servicing of this indebtedness has had and will continue to have an impact on our cash flows and cash balance. For more information, refer to “— Liquidity and Capital Resources.”
Raw Materials and Energy Prices
Our results of operations, and the gross margins corresponding to each of our segments, are impacted by changes in the costs of our raw materials and energy prices. The primary raw materials used to manufacture our products are plastic resins, fiber (principally raw wood and wood chips) and paperboard (principally cartonboard and cupstock). We also use commodity chemicals, steel and energy, including fuel oil, electricity, natural gas and coal, to manufacture our products.
Principal raw materials used by each of our segments are as follows (in order of cost significance):
| • | Foodservice — resin, paperboard |
| • | Food Merchandising — resin |
| • | Evergreen — fiber (principally raw wood and wood chips), resin |
| • | Graham Packaging — resin |
6
The prices of raw wood and wood chips may fluctuate due to external conditions such as weather, product scarcity and commodity market fluctuations and changes in governmental policies and regulations. Resin prices can fluctuate significantly with fluctuations in crude oil and natural gas prices, as well as changes in refining capacity and the demand for other petroleum-based products.
Historical index prices of resin for the past two years are shown in the chart below. The chart presents index prices and does not represent the prices at which we purchased resin.
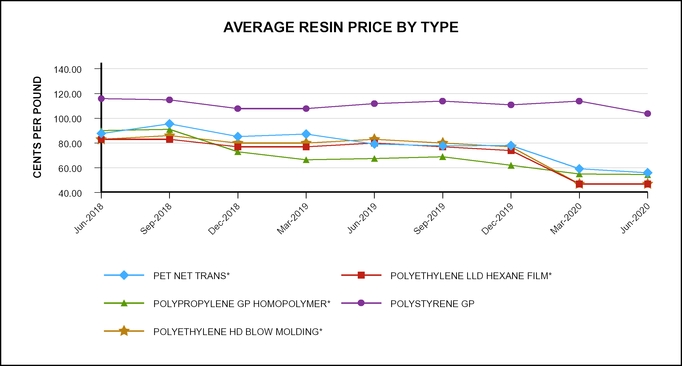
Source: IHS Inc.
| * | In Q1 2020, there was a non-market index price reduction due to a change in methodology. |
7
Results of Operations
The following discussion should be read in conjunction with our interim unaudited condensed consolidated financial statements included elsewhere in this quarterly report.
The comparative information presented in the RGHL Group consolidated results reflects the classification of two businesses as discontinued operations. On December 20, 2019, we completed the sale of our North American and Japanese closures businesses. These operations represent substantially all of our former Closures segment. On February 4, 2020, we distributed our former Reynolds Consumer Products segment to PFL.
Three month period ended June 30, 2020 compared to the three month period ended June 30, 2019
RGHL Group
| For the three month period ended June 30, | ||||||||||||||||||
| (In $ million, except for %) | 2020 | % of revenue | 2019(2) | % of revenue | Change | % change | ||||||||||||
| Total revenue | 1,569 | 100 | % | 1,806 | 100 | % | (237 | ) | (13 | )% | ||||||||
| Cost of sales | (1,337 | ) | (85 | )% | (1,503 | ) | (83 | )% | 166 | 11 | % | |||||||
| Gross profit | 232 | 15 | % | 303 | 17 | % | (71 | ) | (23 | )% | ||||||||
| Selling, marketing and distribution expenses/General and administration expenses | (178 | ) | (11 | )% | (186 | ) | (10 | )% | 8 | 4 | % | |||||||
| Net other income (expenses) | 29 | 2 | % | (32 | ) | (2 | )% | 61 | NM | |||||||||
| Profit from operating activities | 83 | 5 | % | 85 | 5 | % | (2 | ) | (2 | )% | ||||||||
| Financial income | 4 | — | % | 13 | 1 | % | (9 | ) | (69 | )% | ||||||||
| Financial expenses | (174 | ) | (11 | )% | (117 | ) | (6 | )% | (57 | ) | (49 | )% | ||||||
| Net financial income (expenses) | (170 | ) | (11 | )% | (104 | ) | (6 | )% | (66 | ) | (63 | )% | ||||||
| Profit (loss) from continuing operations before income tax | (87 | ) | (6 | )% | (19 | ) | (1 | )% | (68 | ) | NM | |||||||
| Income tax (expense) benefit | (128 | ) | (8 | )% | (9 | ) | — | % | (119 | ) | NM | |||||||
| Profit (loss) from continuing operations | (215 | ) | (14 | )% | (28 | ) | (2 | )% | (187 | ) | NM | |||||||
| Profit (loss) from discontinued operations, net of income tax | — | NM | 105 | NM | (105 | ) | (100 | )% | ||||||||||
| Profit (loss) for the period | (215 | ) | NM | 77 | NM | (292 | ) | NM | ||||||||||
| Depreciation and amortization from continuing operations | 155 | 10 | % | 147 | 8 | % | (8 | ) | (5 | )% | ||||||||
RGHL Group Adjusted EBITDA(1) from continuing operations | 250 | 16 | % | 299 | 17 | % | (49 | ) | (16 | )% | ||||||||
| RGHL Group Adjusted EBITDA from discontinued operations | — | NM | 222 | NM | (222 | ) | (100 | )% | ||||||||||
| Total Adjusted EBITDA | 250 | NM | 521 | NM | (271 | ) | (52 | )% | ||||||||||
NM indicates that the calculation is not meaningful.
| (1) | Refer to page 2 under the heading “Non-GAAP Financial Measures” for additional information related to this financial measure. |
| (2) | The information presented has been revised to reflect the Reynolds Consumer Products business and the North American and Japanese closures businesses as discontinued operations. Refer to notes 2.2 and 7 of the RGHL Group’s interim unaudited condensed consolidated financial statements included elsewhere in this quarterly report for additional information. |
Revenue. Revenue decreased by $237 million, or 13%. The decrease was primarily due to lower sales volume in our Foodservice, Evergreen and Food Merchandising segments, including an unfavorable impact from the COVID-19 pandemic, as well as lower pricing, mainly due to lower raw material costs passed through to customers.
Cost of Sales. Cost of sales decreased by $166 million, or 11%. The decrease was primarily due to lower sales volume and lower raw material costs, partially offset by higher manufacturing costs.
Selling, Marketing and Distribution Expenses/General and Administration Expenses. Selling, marketing and distribution expenses and general and administration expenses decreased by $8 million, or 4%. The decrease was primarily due to lower employee-related costs, partially offset by higher strategic review costs. The strategic review costs have been included in the RGHL Group’s Adjusted EBITDA calculation.
Net Other. Net other changed by $61 million, resulting in net other income of $29 million. The change was primarily due to a $19 million favorable change in unrealized gains and losses on derivatives, lower asset impairment charges of $16 million, a favorable change of $14 million in gains and losses on sale of businesses and non-current assets and an increase of $5 million in income from providing transition services. All of these items, other than income from transition services, have been included in the RGHL Group’s Adjusted EBITDA calculation.
Net Financial Income (Expenses). Net financial expenses increased by $66 million to $170 million. The increase was primarily due to a $58 million unfavorable foreign currency impact and an unfavorable change of $24 million in the fair value of derivatives, partially offset by a $23 million decrease in interest expense. For more information regarding financial income (expenses) and borrowings, refer to notes 8 and 12, respectively, of the RGHL Group’s interim unaudited condensed consolidated financial statements included elsewhere in this quarterly report.
8
Income Tax. We recognized income tax expense of $128 million on a loss before income tax of $87 million in the three month period ended June 30, 2020, compared to income tax expense of $9 million on a loss before income tax of $19 million for the three month period ended June 30, 2019. Factors that have contributed to the effective tax rate include (i) the impact of revised forecasts on our U.S. annualized effective tax rate, (ii) the resulting impact of the change in annualized tax rate on previously recognized tax benefits from CARES Act legislative changes and (iii) the mix of book income and losses taxed at varying rates among the jurisdictions in which the RGHL Group operates. For further information, including a reconciliation of income tax expense, refer to note 9 of the RGHL Group’s interim unaudited condensed consolidated financial statements included elsewhere in this quarterly report.
Profit (Loss) from Discontinued Operations, Net of Income Tax. Profit from discontinued operations, net of income tax, which represents the results of the Reynolds Consumer Products business and the results of the North American and Japanese closures businesses, decreased by $105 million. The current period result includes the finalization of the working capital adjustment on the sale of the closures business. The current period did not include any results from operations whereas the prior period includes three months of operations of both Reynolds Consumer Products and the sold closures businesses. For more information regarding discontinued operations, refer to notes 2.2 and 7 of the RGHL Group’s interim unaudited condensed consolidated financial statements included elsewhere in this quarterly report.
Impact of IFRS 16. The adoption of the lease accounting standard IFRS 16 “Leases” on January 1, 2019 has resulted in a portion of operating lease expense being classified as depreciation and interest expense. The following table sets out the benefit to Adjusted EBITDA by segment for the three month periods ended June 30, 2020 and 2019:
| For the three month period ended June 30, | ||||||
| (In $ million) | 2020 | 2019(1) | ||||
| Foodservice | 8 | 6 | ||||
| Food Merchandising | 5 | 4 | ||||
| Evergreen | 3 | 2 | ||||
| Graham Packaging | 8 | 8 | ||||
| Other/Unallocated | — | 1 | ||||
| Total impact of IFRS 16 on RGHL Group Adjusted EBITDA from continuing operations | 24 | 21 | ||||
| Total impact of IFRS 16 on RGHL Group Adjusted EBITDA from discontinued operations | — | 4 | ||||
| Total impact of IFRS 16 on RGHL Group Adjusted EBITDA | 24 | 25 | ||||
| (1) | The information presented has been revised to reflect the Reynolds Consumer Products business and the North American and Japanese closures businesses as discontinued operations. Refer to notes 2.2 and 7 of the RGHL Group’s interim unaudited condensed consolidated financial statements included elsewhere in this quarterly report for additional information. |
9
EBITDA/Adjusted EBITDA Reconciliation
The reconciliation of profit from operating activities to EBITDA and Adjusted EBITDA for the RGHL Group is as follows:
| For the three month period ended June 30, | ||||||
| (In $ million) | 2020 | 2019(2) | ||||
| Profit from operating activities | 83 | 85 | ||||
| Depreciation and amortization from continuing operations | 155 | 147 | ||||
RGHL Group EBITDA(1) from continuing operations | 238 | 232 | ||||
| Included in the RGHL Group EBITDA: | ||||||
| Asset impairment charges, net of reversals | — | 17 | ||||
| (Gain) loss on sale of businesses and non-current assets | — | 14 | ||||
| Non-cash pension expense | 12 | 18 | ||||
| Operational process engineering-related consultancy costs | 2 | 6 | ||||
| Restructuring costs, net of reversals | 6 | 6 | ||||
| Strategic review costs | 11 | 1 | ||||
| Unrealized (gain) loss on derivatives | (20 | ) | (1 | ) | ||
| Other | 1 | 6 | ||||
RGHL Group Adjusted EBITDA(1) from continuing operations | 250 | 299 | ||||
| Segment detail of Adjusted EBITDA: | ||||||
| Foodservice | 42 | 107 | ||||
| Food Merchandising | 65 | 57 | ||||
| Evergreen | 42 | 52 | ||||
| Graham Packaging | 104 | 95 | ||||
| Other/Unallocated | (3 | ) | (12 | ) | ||
RGHL Group Adjusted EBITDA from continuing operations | 250 | 299 | ||||
| RGHL Group Adjusted EBITDA from discontinued operations | — | 222 | ||||
| Total Adjusted EBITDA | 250 | 521 | ||||
| (1) | Refer to page 2 under the heading “Non-GAAP Financial Measures” for additional information related to these financial measures. |
| (2) | The information presented has been revised to reflect the Reynolds Consumer Products business and the North American and Japanese closures businesses as discontinued operations. Refer to notes 2.2 and 7 of the RGHL Group’s interim unaudited condensed consolidated financial statements included elsewhere in this quarterly report for additional information. |
Foodservice Segment
| For the three month period ended June 30, | ||||||||||||
| (In $ million, except for %) | 2020 | 2019 | Change | % change | ||||||||
| Total segment revenue | 405 | 560 | (155 | ) | (28 | )% | ||||||
| Segment Adjusted EBITDA | 42 | 107 | (65 | ) | (61 | )% | ||||||
| Segment Adjusted EBITDA – % of segment revenue | 10 | % | 19 | % | ||||||||
Revenue. Total segment revenue decreased by $155 million, or 28%. The decrease was primarily due to lower sales volume due to the impact of the COVID-19 pandemic, as well as lower pricing primarily due to lower raw material costs passed through to customers.
Adjusted EBITDA. Adjusted EBITDA decreased by $65 million to $42 million. The decrease was primarily due to lower sales volume due to the impact of the COVID-19 pandemic, higher manufacturing costs due to measures put in place to continue to operate during the pandemic and lower production, as well as an unfavorable impact from raw material hedges. These items were partially offset by lower logistics costs due to lower sales volume and favorable freight rates.
Food Merchandising Segment
| For the three month period ended June 30, | ||||||||||||
| (In $ million, except for %) | 2020 | 2019 | Change | % change | ||||||||
| Total segment revenue | 348 | 346 | 2 | 1 | % | |||||||
| Segment Adjusted EBITDA | 65 | 57 | 8 | 14 | % | |||||||
| Segment Adjusted EBITDA – % of segment revenue | 19 | % | 16 | % | ||||||||
10
Revenue. Total segment revenue increased by $2 million, or 1%. The increase was primarily due to favorable pricing and product mix, partially offset by lower sales volume in most product categories due to the impact of the COVID-19 pandemic, as well as an unfavorable foreign currency impact.
Adjusted EBITDA. Adjusted EBITDA increased by $8 million to $65 million. The increase was primarily due to favorable pricing and product mix, lower manufacturing costs driven by controlled spending and more efficient production and lower logistics costs due to favorable freight rates, partially offset by lower sales volumes largely from the impact of COVID-19 and an unfavorable foreign currency impact.
Evergreen Segment
| For the three month period ended June 30, | ||||||||||||
| (In $ million, except for %) | 2020 | 2019 | Change | % change | ||||||||
| Total segment revenue | 348 | 389 | (41 | ) | (11 | )% | ||||||
| Segment Adjusted EBITDA | 42 | 52 | (10 | ) | (19 | )% | ||||||
| Segment Adjusted EBITDA – % of segment revenue | 12 | % | 13 | % | ||||||||
Revenue. Total segment revenue decreased by $41 million, or 11%. The decrease was primarily due to lower sales volume and lower pricing due to the impact of the COVID-19 pandemic.
Adjusted EBITDA. Adjusted EBITDA decreased by $10 million to $42 million. The decrease was primarily due to lower sales volume and lower pricing due to the impact of the COVID-19 pandemic, as well as higher manufacturing costs due to mill production outage timing and production inefficiencies. These items were partially offset by lower raw material costs, driven by wood supply as markets have returned to historical normalized levels from prior year weather-related increases.
Graham Packaging Segment
| For the three month period ended June 30, | ||||||||||||
| (In $ million, except for %) | 2020 | 2019 | Change | % change | ||||||||
| Total segment revenue | 462 | 499 | (37 | ) | (7 | )% | ||||||
| Segment Adjusted EBITDA | 104 | 95 | 9 | 9 | % | |||||||
| Segment Adjusted EBITDA – % of segment revenue | 23 | % | 19 | % | ||||||||
Revenue. Total segment revenue decreased by $37 million, or 7%. The decrease was primarily due to lower pricing as a result of lower raw material costs passed through to customers and an unfavorable foreign currency impact.
Adjusted EBITDA. Adjusted EBITDA increased by $9 million to $104 million. The increase was primarily due to lower raw material costs, net of lower raw material costs passed through to customers, and lower manufacturing costs.
11
Six month period ended June 30, 2020 compared to the six month period ended June 30, 2019
RGHL Group
| For the six month period ended June 30, | ||||||||||||||||||
| (In $ million, except for %) | 2020 | % of revenue | 2019(2) | % of revenue | Change | % change | ||||||||||||
| Total revenue | 3,259 | 100 | % | 3,594 | 100 | % | (335 | ) | (9 | )% | ||||||||
| Cost of sales | (2,761 | ) | (85 | )% | (3,028 | ) | (84 | )% | 267 | 9 | % | |||||||
| Gross profit | 498 | 15 | % | 566 | 16 | % | (68 | ) | (12 | )% | ||||||||
| Selling, marketing and distribution expenses/General and administration expenses | (363 | ) | (11 | )% | (363 | ) | (10 | )% | — | — | % | |||||||
| Net other income (expenses) | 3 | — | % | (29 | ) | (1 | )% | 32 | NM | |||||||||
| Profit from operating activities | 138 | 4 | % | 174 | 5 | % | (36 | ) | (21 | )% | ||||||||
| Financial income | 47 | 1 | % | 85 | 2 | % | (38 | ) | (45 | )% | ||||||||
| Financial expenses | (285 | ) | (9 | )% | (235 | ) | (7 | )% | (50 | ) | (21 | )% | ||||||
| Net financial income (expenses) | (238 | ) | (7 | )% | (150 | ) | (4 | )% | (88 | ) | (59 | )% | ||||||
| Profit (loss) from continuing operations before income tax | (100 | ) | (3 | )% | 24 | 1 | % | (124 | ) | NM | ||||||||
| Income tax (expense) benefit | 174 | 5 | % | (35 | ) | (1 | )% | 209 | NM | |||||||||
| Profit (loss) from continuing operations | 74 | 2 | % | (11 | ) | — | % | 85 | NM | |||||||||
| Profit (loss) from discontinued operations, net of income tax | 7 | NM | 156 | NM | (149 | ) | NM | |||||||||||
| Profit (loss) for the period | 81 | NM | 145 | NM | (64 | ) | (44 | )% | ||||||||||
| Depreciation and amortization from continuing operations | 303 | 9 | % | 290 | 8 | % | (13 | ) | (4 | )% | ||||||||
RGHL Group Adjusted EBITDA(1) from continuing operations | 514 | 16 | % | 561 | 16 | % | (47 | ) | (8 | )% | ||||||||
| RGHL Group Adjusted EBITDA from discontinued operations | 36 | NM | 365 | NM | (329 | ) | (90 | )% | ||||||||||
| Total Adjusted EBITDA | 550 | NM | 926 | NM | (376 | ) | (41 | )% | ||||||||||
NM indicates that the calculation is not meaningful.
| (1) | Refer to page 2 under the heading “Non-GAAP Financial Measures” for additional information related to this financial measure. |
| (2) | The information presented has been revised to reflect the Reynolds Consumer Products business and the North American and Japanese closures businesses as discontinued operations. Refer to notes 2.2 and 7 of the RGHL Group’s interim unaudited condensed consolidated financial statements included elsewhere in this quarterly report for additional information. |
Revenue. Revenue decreased by $335 million, or 9%. The decrease was primarily due to lower sales volume in our Foodservice, Evergreen and Food Merchandising segments, including an unfavorable impact from the COVID-19 pandemic, as well as lower pricing, mainly due to lower raw material costs passed through to customers.
Cost of Sales. Cost of sales decreased by $267 million, or 9%. The decrease was primarily due to lower sales volume and lower raw material costs, partially offset by higher manufacturing costs.
Selling, Marketing and Distribution Expenses/General and Administration Expenses. Selling, marketing and distribution expenses and general and administration expenses remained flat at $363 million, primarily due to higher strategic review costs of $18 million, which have been included in the RGHL Group’s Adjusted EBITDA calculation, offset by lower employee-related costs.
Net Other. Net other changed by $32 million, resulting in net other income of $3 million. The change was primarily due to lower asset impairment charges of $20 million, a favorable change of $13 million in gains and losses on sale of businesses and non-current assets and an increase of $9 million in income from providing transition services, partially offset by an unfavorable foreign currency impact. The asset impairment charges and gains and losses on sale of businesses and non-current assets have been included in the RGHL Group’s Adjusted EBITDA calculation.
Net Financial Income (Expenses). Net financial expenses increased by $88 million to $238 million. The increase was primarily due to an unfavorable change of $155 million in the fair value of derivatives, partially offset by a $38 million decrease in interest expense and a $34 million favorable foreign currency impact. For more information regarding financial income (expenses) and borrowings, refer to notes 8 and 12, respectively, of the RGHL Group’s interim unaudited condensed consolidated financial statements included elsewhere in this quarterly report.
Income Tax. We recognized an income tax benefit of $174 million on a loss before income tax of $100 million in the six month period ended June 30, 2020, compared to income tax expense of $35 million on income before income tax of $24 million for the six month period ended June 30, 2019. Factors that have contributed to the effective tax rate include (i) tax benefits from CARES Act legislative changes and (ii) the mix of book income and losses taxed at varying rates among the jurisdictions in which the RGHL Group operates. For further information, including a reconciliation of income tax expense, refer to note 9 of the RGHL Group’s interim unaudited condensed consolidated financial statements included elsewhere in this quarterly report.
Profit (Loss) from Discontinued Operations, Net of Income Tax. Profit from discontinued operations, net of income tax, which represents the results of the Reynolds Consumer Products business and the results of the North American and Japanese closures businesses, decreased by $149 million
12
to a profit of $7 million. The results for the current period include approximately one month of operations for the Reynolds Consumer Products business whereas the prior period includes six months of operations of both Reynolds Consumer Products and the sold closures businesses. The profit from discontinued operations also includes the finalization of the working capital adjustment on the sale of the closures businesses. For more information regarding discontinued operations, refer to notes 2.2 and 7 of the RGHL Group’s interim unaudited condensed consolidated financial statements included elsewhere in this quarterly report.
Impact of IFRS 16. The adoption of the lease accounting standard IFRS 16 “Leases” on January 1, 2019 has resulted in a portion of operating lease expense being classified as depreciation and interest expense. The following table sets out the benefit to Adjusted EBITDA by segment for the six month periods ended June 30, 2020 and 2019:
| For the six month period ended June 30, | ||||||
| (In $ million) | 2020 | 2019(1) | ||||
| Foodservice | 15 | 12 | ||||
| Food Merchandising | 9 | 7 | ||||
| Evergreen | 6 | 4 | ||||
| Graham Packaging | 16 | 16 | ||||
| Other/Unallocated | 1 | 1 | ||||
| Total impact of IFRS 16 on RGHL Group Adjusted EBITDA from continuing operations | 47 | 40 | ||||
| Total impact of IFRS 16 on RGHL Group Adjusted EBITDA from discontinued operations | 1 | 9 | ||||
| Total impact of IFRS 16 on RGHL Group Adjusted EBITDA | 48 | 49 | ||||
| (1) | The information presented has been revised to reflect the Reynolds Consumer Products business and the North American and Japanese closures businesses as discontinued operations. Refer to notes 2.2 and 7 of the RGHL Group’s interim unaudited condensed consolidated financial statements included elsewhere in this quarterly report for additional information. |
EBITDA/Adjusted EBITDA Reconciliation
The reconciliation of profit from operating activities to EBITDA and Adjusted EBITDA for the RGHL Group is as follows:
| For the six month period ended June 30, | ||||||
| (In $ million) | 2020 | 2019(2) | ||||
| Profit from operating activities | 138 | 174 | ||||
| Depreciation and amortization from continuing operations | 303 | 290 | ||||
RGHL Group EBITDA(1) from continuing operations | 441 | 464 | ||||
| Included in the RGHL Group EBITDA from continuing operations: | ||||||
| Asset impairment charges, net of reversals | (3 | ) | 17 | |||
| (Gain) loss on disposal of businesses and non-current assets | 1 | 14 | ||||
| Non-cash pension expense | 25 | 37 | ||||
| Operational process engineering-related consultancy costs | 9 | 13 | ||||
| Related party management fee | 8 | 8 | ||||
| Restructuring costs, net of reversals | 12 | 8 | ||||
| Strategic review costs | 19 | 1 | ||||
| Unrealized (gains) losses on derivatives | (2 | ) | (7 | ) | ||
| Other | 4 | 6 | ||||
RGHL Group Adjusted EBITDA(1) from continuing operations | 514 | 561 | ||||
| Segment detail of Adjusted EBITDA: | ||||||
| Foodservice | 107 | 186 | ||||
| Food Merchandising | 123 | 113 | ||||
| Evergreen | 93 | 100 | ||||
| Graham Packaging | 204 | 190 | ||||
| Other/Unallocated | (13 | ) | (28 | ) | ||
| RGHL Group Adjusted EBITDA from continuing operations | 514 | 561 | ||||
| RGHL Group Adjusted EBITDA from discontinued operations | 36 | 365 | ||||
| Total Adjusted EBITDA | 550 | 926 | ||||
| (1) | Refer to page 2 under the heading “Non-GAAP Financial Measures” for additional information related to these financial measures. |
| (2) | The information presented has been revised to reflect the Reynolds Consumer Products business and the North American and Japanese closures businesses as discontinued operations. Refer to notes 2.2 and 7 of the RGHL Group’s interim unaudited condensed consolidated financial statements included elsewhere in this quarterly report for additional information. |
13
Foodservice Segment
| For the six month period ended June 30, | ||||||||||||
| (In $ million, except for %) | 2020 | 2019 | Change | % change | ||||||||
| Total segment revenue | 878 | 1,084 | (206 | ) | (19 | )% | ||||||
| Segment Adjusted EBITDA | 107 | 186 | (79 | ) | (42 | )% | ||||||
| Segment Adjusted EBITDA – % of segment revenue | 12 | % | 17 | % | ||||||||
Revenue. Total segment revenue decreased by $206 million, or 19%. The decrease was primarily due to lower sales volume due to market contraction from the impact of the COVID-19 pandemic, as well as lower pricing primarily due to lower raw material costs passed through to customers.
Adjusted EBITDA. Adjusted EBITDA decreased by $79 million to $107 million. The decrease was primarily due to lower sales volume due to the impact of the COVID-19 pandemic, higher manufacturing costs due to measures put in place to continue to operate during the pandemic and lower production, as well as an unfavorable impact from raw material hedges. These items were partially offset by lower logistics costs due to lower sales volume and favorable freight rates.
Food Merchandising Segment
| For the six month period ended June 30, | ||||||||||||
| (In $ million, except for %) | 2020 | 2019 | Change | % change | ||||||||
| Total segment revenue | 692 | 686 | 6 | 1 | % | |||||||
| Segment Adjusted EBITDA | 123 | 113 | 10 | 9 | % | |||||||
| Segment Adjusted EBITDA – % of segment revenue | 18 | % | 16 | % | ||||||||
Revenue. Total segment revenue increased by $6 million, or 1%. The increase was primarily due to favorable pricing, partially offset by lower sales volume and an unfavorable foreign currency impact. The lower sales volume was primarily driven by lower demand from certain large customers that had increased inventory levels due to accelerated purchases in the fourth quarter of 2019 and an unfavorable net impact from the COVID-19 pandemic.
Adjusted EBITDA. Adjusted EBITDA increased by $10 million to $123 million. The increase was primarily due to favorable material costs, net of lower costs passed through to customers, and higher pricing, partially offset by an unfavorable foreign currency impact and lower sales volume.
Evergreen Segment
| For the six month period ended June 30, | ||||||||||||
| (In $ million, except for %) | 2020 | 2019 | Change | % change | ||||||||
| Total segment revenue | 745 | 787 | (42 | ) | (5 | )% | ||||||
| Segment Adjusted EBITDA | 93 | 100 | (7 | ) | (7 | )% | ||||||
| Segment Adjusted EBITDA – % of segment revenue | 12 | % | 13 | % | ||||||||
Revenue. Total segment revenue decreased by $42 million, or 5%. The decrease was primarily due to lower sales volume and lower pricing due to the impact of the COVID-19 pandemic.
Adjusted EBITDA. Adjusted EBITDA decreased by $7 million to $93 million. The decrease was primarily due to increased manufacturing costs due to production inefficiencies and mill production outage timing, as well as lower pricing and lower sales volume due to the impact of the COVID-19 pandemic. These items were partially offset by lower raw material costs, driven by wood supply as markets have returned to historical normalized levels from prior year weather-related increases.
Graham Packaging Segment
| For the six month period ended June 30, | ||||||||||||
| (In $ million, except for %) | 2020 | 2019 | Change | % change | ||||||||
| Total segment revenue | 940 | 1,012 | (72 | ) | (7 | )% | ||||||
| Segment Adjusted EBITDA | 204 | 190 | 14 | 7 | % | |||||||
| Segment Adjusted EBITDA – % of segment revenue | 22 | % | 19 | % | ||||||||
Revenue. Total segment revenue decreased by $72 million, or 7%. The decrease was primarily due to lower pricing, mainly due to lower raw material costs passed through to customers, an unfavorable foreign currency impact and the impact of business divestitures.
14
Adjusted EBITDA. Adjusted EBITDA increased by $14 million to $204 million. The increase was primarily due to lower raw material costs, net of lower raw material costs passed through to customers, and lower manufacturing costs, partially offset by a decline in pricing due to contractual price movements.
Liquidity and Capital Resources
Historical Cash Flows
The following table discloses the RGHL Group’s cash flows for the periods presented:
| For the six month period ended June 30, | ||||||
| (In $ million) | 2020 | 2019 | ||||
| Net cash flows from (used in) operating activities | 196 | 271 | ||||
| Net cash flows from (used in) investing activities | (201 | ) | (270 | ) | ||
| Net cash flows from (used in) financing activities | 330 | (57 | ) | |||
| Net increase (decrease) in cash and cash equivalents | 325 | (56 | ) | |||
Cash Flows from (used in) Operating Activities
Cash provided by operating activities was $196 million compared to $271 million in the prior year period. Cash flows from operating activities during the six month period ended June 30, 2020 include amounts associated with Reynolds Consumer Products through February 4, 2020. The comparative period reflects six months of operating cash flows associated with Reynolds Consumer Products and the closures operations sold in December 2019. The lower contribution from Reynolds Consumer Products was partially offset by a $74 million decrease in interest paid, primarily due to the repayment of various notes and a decrease in interest rates on our Credit Agreement, as well as a $33 million reduction in income taxes paid, primarily due to a decrease in U.S. taxes paid as a result of provisions in the CARES Act.
Cash Flows from (used in) Investing Activities
Cash used in investing activities was $201 million compared to $270 million in the prior year period. The current year period includes a decrease of $74 million in capital expenditures. Refer to “— Capital Expenditures” for additional information regarding expenditures on property, plant and equipment and intangible assets.
Cash Flows from (used in) Financing Activities
The net cash flows associated with financing activities during each respective period is summarized in the following table. Immediately prior to its distribution, Reynolds Consumer Products incurred borrowings and related transaction costs under its new facilities. Refer to notes 7, 12 and 16 of the RGHL Group’s interim unaudited condensed consolidated financial statements included elsewhere in this quarterly report for additional information related to the Reynolds Consumer Products borrowings and our borrowings.
| For the six month period ended June 30, | ||||||
| (In $ million) | 2020 | 2019 | ||||
| Drawdown of Reynolds Consumer Products borrowings | 3,640 | — | ||||
| Repayment of borrowings | (3,215 | ) | (18 | ) | ||
| Repayment of lease liabilities | (39 | ) | (38 | ) | ||
| Payment of Reynolds Consumer Products debt transaction costs | (24 | ) | — | |||
| Cash held by Reynolds Consumer Products at the time of distribution | (31 | ) | — | |||
| Other | (1 | ) | (1 | ) | ||
| Net cash inflow (outflow) | 330 | (57 | ) | |||
Capital Expenditures
Capital expenditures were $214 million compared to $288 million in the prior year period. The decrease reflects lower investments made in the current year period. Capital expenditures incurred in the current and prior year periods include $5 million and $59 million, respectively, related to discontinued operations.
We incurred $624 million in capital expenditures in 2019, and we expect to incur approximately $475 million in capital expenditures during 2020 (excluding acquisitions) largely to support business growth, cost reduction and business maintenance. We expect to fund these expenditures with cash flows from operations. Actual capital expenditures may differ.
Liquidity and Capital Resources
We have substantial debt and debt service obligations. As of June 30, 2020, the total principal amount outstanding of our borrowings was $7,472 million. On a pro forma basis, after the financing transactions described above in “— Recent Developments,” the outstanding principal amount of our borrowings was $7,213 million.
15
Our sources of liquidity for the future are expected to be our existing cash resources and cash flows from operations. In addition, we may utilize borrowing capacity available under the revolving credit facility of our Credit Agreement and local working capital facilities. In addition to our cash and cash equivalents, as of June 30, 2020, we had $255 million available for drawing under our revolving credit facility. This facility matures in August 2021. We believe that these sources will be adequate to meet our future liquidity needs for the next 12 months. Following the $2,094 million repayment of borrowings discussed above in “— Recent Developments,” our next significant near term maturity of outstanding borrowings are the U.S. Term Loans under our Credit Agreement which mature in February 2023. Our revolving facility under our Credit Agreement, which is currently used for letters of credit, matures in August 2021. We do not currently anticipate that the COVID-19 pandemic will materially impact our liquidity over the next 12 months. We are currently in compliance with the covenants under the Credit Agreement, the indentures governing the Reynolds Notes and our other outstanding indebtedness. We expect to remain in compliance with our covenants.
Our ability to borrow under the revolving facility under our Credit Agreement or our other local working capital facilities may be limited by the terms of such indebtedness or other indebtedness (including the Reynolds Notes and Credit Agreement), including financial covenants.
On a pro forma basis, after the financing transactions described above in “— Recent Developments,” our annualized cash interest obligations on our outstanding indebtedness are expected to be approximately $343 million, assuming interest on our floating rate debt continues to accrue at the current applicable interest rates. We expect to meet our debt service obligations with our existing cash resources and cash flows from operations. Refer to notes 12 and 16 of the RGHL Group’s interim unaudited condensed consolidated financial statements included elsewhere in this quarterly report for details related to our borrowings and related repayment terms and transactions subsequent to June 30, 2020.
Under the indentures governing the Reynolds Notes, we may incur additional indebtedness either by satisfying certain incurrence tests or by incurring such additional indebtedness under certain specific categories of permitted debt. Indebtedness may be incurred under the incurrence tests if the fixed charge coverage ratio is at least 2.00 to 1.00 on a pro forma basis and (i) under the indenture governing the Reynolds Senior Secured Notes, the liens securing first lien secured indebtedness do not exceed a 4.50 to 1.00 senior secured first lien leverage ratio, and (ii) under the indenture governing our Reynolds Senior Notes, the liens securing any secured indebtedness do not exceed a 4.50 to 1.00 secured leverage ratio.
Under the Credit Agreement, we may incur additional indebtedness either by satisfying certain incurrence tests or by incurring such additional indebtedness under certain specific categories of permitted debt. Incremental senior secured indebtedness under the Credit Agreement and senior secured or unsecured notes in lieu thereof are permitted to be incurred up to an aggregate principal amount of $750 million subject to pro forma compliance with the Credit Agreement’s total secured leverage ratio covenant. In addition, we may incur incremental senior secured indebtedness under the Credit Agreement and senior secured notes in an unlimited amount so long as our total secured leverage ratio does not exceed 4.50 to 1.00 on a pro forma basis and (in the case of incremental senior secured indebtedness under the Credit Agreement only) we are in pro forma compliance with the Credit Agreement’s total secured leverage ratio covenant. The incurrence of unsecured indebtedness, including the issuance of senior notes, and unsecured subordinated indebtedness is also permitted if the fixed charge coverage ratio is at least 2.00 to 1.00 on a pro forma basis.
The Credit Agreement and the indentures governing the Reynolds Notes generally allow subsidiaries of RGHL to transfer funds in the form of cash dividends, loans or advances within the RGHL Group.
In January 2020, we completed the process to offer to certain lenders the net proceeds from the sale of our North American and Japanese closures businesses. As a result of this process, in January 2020 we repaid an aggregate of $38 million of borrowings, at face value plus accrued and unpaid interest. This repayment was comprised of: (i) $18 million of borrowings under the Credit Agreement; (ii) $18 million aggregate principal amount of 5.750% Senior Secured Notes due 2020; (iii) $1 million aggregate principal amount of Floating Rate Senior Secured Notes due 2021; and (iv) $1 million aggregate principal amount of 5.125% Senior Secured Notes due 2023.
Prior to the distribution of the Reynolds Consumer Products segment, all the legal entities within Reynolds Consumer Products were designated as “Unrestricted Subsidiaries” under the Credit Agreement and the indentures governing the Reynolds Notes. As a consequence, on February 4, 2020, the relevant legal entities within Reynolds Consumer Products were released as borrowers under the Credit Agreement and released as guarantors of the Credit Agreement and the Reynolds Notes. In connection with such releases, the security granted by such entities was also released. Prior to the distribution, Reynolds Consumer Products also ceased to participate in the Securitization Facility, and consequently in January 2020 the size of this facility was reduced from $600 million to $450 million.
Immediately prior to its distribution and the IPO, Reynolds Consumer Products incurred $2,475 million of term loan borrowings under its new credit facilities and $1,168 million of borrowings under an IPO settlement facility. We have not provided any guarantees or security in relation to Reynolds Consumer Products’ external borrowings. The cash proceeds from these new credit facilities, net of transaction costs and original issue discount, along with cash on-hand, were used to settle various intercompany balances between Reynolds Consumer Products and us. We contributed the remaining intercompany balance owing by Reynolds Consumer Products as additional paid-in capital without the issuance of shares.
On February 4, 2020, we repaid in full all of the remaining $3.1 billion aggregate principal amount outstanding of our 5.750% Senior Secured Notes due 2020 at face value plus accrued and unpaid interest.
Our future operating performance and our ability to service or refinance the Credit Agreement, our outstanding notes and other indebtedness are subject to economic conditions and financial, business and other factors, many of which are beyond our control.
We may from time to time seek to issue additional indebtedness depending on market conditions, our liquidity requirements and other considerations.
We or our affiliates may from time to time seek to retire or repurchase our outstanding indebtedness in open market purchases, privately negotiated transactions or otherwise. Such transactions, if any, will depend on prevailing market conditions, our liquidity requirements, contractual restrictions and other considerations.
Embedded Derivatives
We have separately recognized embedded derivative assets in relation to the early call feature on certain borrowings. Embedded derivatives are measured at fair value with changes in fair value recognized through net financial income (expenses) in the statement of comprehensive income
16
as a component of profit or loss. As of June 30, 2020, our non-current derivative asset associated with embedded derivatives was $78 million. The fair value of the embedded derivatives is calculated using industry standard models that consider various assumptions, such as quoted market prices, time value and volatility factors for the underlying instruments. Changes in any one or more of these assumptions could have a significant impact on the value of embedded derivatives. For further information, refer to note 3 of the RGHL Group’s interim unaudited condensed consolidated financial statements included elsewhere in this quarterly report.
Contractual Obligations
The following table summarizes our material contractual obligations as of June 30, 2020:
| Payments, due by period, as of June 30, 2020 | |||||||||||||||
| (In $ million) | Total | Less than one year | One to three years | Three to five years | Greater than five years | ||||||||||
| Trade and other payables | 625 | 625 | — | — | — | ||||||||||
Financial liabilities(1)(3) | 8,538 | 735 | 4,680 | 2,602 | 521 | ||||||||||
Lease liabilities(2) | 468 | 107 | 176 | 110 | 75 | ||||||||||
| Unconditional capital expenditure obligations | 160 | 160 | — | — | — | ||||||||||
| Total contractual obligations | 9,791 | 1,627 | 4,856 | 2,712 | 596 | ||||||||||
| (1) | Total repayments of financial liabilities consist of the principal amounts, fixed and floating rate interest obligations and the cash flows associated with commodity and other derivative instruments. The exchange rate on euro-denominated borrowings and non-U.S. dollar-denominated lease liabilities and the interest rates on the floating rate debt balances have been assumed to be the same as the respective rates in effect as of June 30, 2020. |
| (2) | Total repayments of lease liabilities exclude short-term and low-value leases, which were not significant in the aggregate. |
| (3) | Refer to “— Recent Developments” above for details regarding changes in our borrowings subsequent to June 30, 2020. |
As of June 30, 2020, our liabilities for pensions, post-employment benefits and uncertain tax positions totaled $1,160 million. We are unable to determine the ultimate timing of these liabilities; therefore, we have excluded these amounts from the contractual obligations table above. We expect to make a $121 million contribution to the Reynolds Group Pension Plan in 2020. Future contributions will be dependent on future plan asset returns and interest rates and are highly sensitive to changes.
The RGHL Group is required to make annual prepayments of term loans with up to 50% of excess cash flow (which will be reduced to 25% or 0% if specified senior secured first lien leverage ratios are met) as determined in accordance with the Credit Agreement. No excess cash flow prepayments are due in 2020 for the year ended December 31, 2019.
Contingent Liabilities
The RGHL Group’s financing agreements permit the payment to related parties of management, consulting, monitoring and advising fees (the “Management Fee”) of up to 1.5% of the RGHL Group’s Adjusted EBITDA (as defined in the financing agreements) for the previous year. The Credit Agreement permits the RGHL Group to pay an additional Management Fee of up to $22 million in respect of the 2009 and 2010 financial years. No amount has been accrued in respect of the remaining 2009 and 2010 permitted Management Fee.
As part of the agreements for the sale of various businesses, the RGHL Group has provided certain warranties and indemnities to the respective purchasers as set out in the respective sale agreements. These warranties and indemnities are subject to various terms and conditions affecting the duration and total amount of the indemnities. As of June 30, 2020, the RGHL Group is not aware of any material claims under these agreements that would give rise to an additional liability. However, if such claims arise in the future, they could have a material effect on the RGHL Group’s financial position, results of operations and cash flows.
Off-Balance Sheet Arrangements
Other than short-term and low-value leases entered into in the normal course of business, we have no material off-balance sheet obligations.
Accounting Principles
Our interim unaudited condensed consolidated financial statements have been prepared in accordance with International Accounting Standard 34 “Interim Financial Reporting.”
Critical Accounting Policies
For a summary of our critical accounting policies, refer to “Part I — Item 5. Operating and Financial Review and Prospects — Critical Accounting Policies” of our Annual Report. Our critical accounting policies have not changed from those disclosed in our Annual Report.
Recently Issued Accounting Pronouncements
Refer to note 2.3 of the RGHL Group’s interim unaudited condensed consolidated financial statements included elsewhere in this quarterly report for information regarding new and revised accounting standards and interpretations.
ITEM 3. QUANTITATIVE AND QUALITATIVE DISCLOSURES ABOUT MARKET RISK.
In the normal course of business we are subject to risks from adverse fluctuations in interest and foreign currency exchange rates and commodity prices. We manage these risks through a combination of an appropriate mix between variable rate and fixed rate borrowings, interest rate swaps and natural offsets of foreign currency receipts and payments, supplemented by forward foreign currency exchange contracts and commodity derivatives. Derivative contracts are not used for trading or speculative purposes. The extent to which we use derivative instruments is dependent
17
upon our access to them in the financial markets, the costs associated with entering into such arrangements and our use of other risk management methods, such as netting exposures for foreign currency exchange risk and establishing sales arrangements that permit the pass-through of changes in commodity prices to customers. Our objective in managing our exposure to market risk is to limit the impact on earnings and cash flow.
Interest Rate Risk
We had significant debt commitments outstanding as of June 30, 2020 and on a pro forma basis following the transactions described in “Item 2. Management’s Discussion and Analysis of Financial Condition and Results of Operations — Recent Developments.” These on-balance sheet financial instruments, to the extent they accrue interest at variable interest rates, expose us to interest rate risk. Following the transactions described in “Item 2. Management’s Discussion and Analysis of Financial Condition and Results of Operations — Recent Developments,” our interest rate risk arises primarily on the U.S. dollar-denominated term loan that is drawn under our Credit Agreement and the GPC Credit Agreement term loan.
As of June 30, 2020, the Credit Agreement included a LIBOR floor of 0.00% per annum on the U.S. Term Loans and the revolving loans. The underlying rate for our Credit Agreement is the one-month LIBOR, and as of June 30, 2020, the applicable rate was 0.18%. Based on our outstanding U.S. Term Loan debt commitments as of June 30, 2020, a one-year timeframe and all other variables remaining constant, a 100 basis point increase in interest rates would result in a $32 million increase in interest expense on the U.S. Term Loans. A 100 basis point decrease in interest rates would result in a $6 million decrease in interest expense on the U.S. Term Loans.
The underlying rate for the GPC Credit Agreement term loans is the one-month LIBOR, and as of August 4, 2020, the applicable rate was 0.15%. The GPC Credit Agreement term loans also have a LIBOR floor of 0.75%. Based on our outstanding debt commitment as of August 4, 2020, a one-year timeframe and all other variables remaining constant, a 100 basis point increase in interest rates would result in a $6 million increase in interest expense and a 100 basis point decrease in interest rates would have no impact on interest expense due to the LIBOR floor under this facility.
Foreign Currency Exchange Rate Risk
As a result of our foreign operations, we are exposed to foreign currency exchange risk arising from sales, purchases, assets and borrowings that are denominated in currencies other than the functional currencies of the respective entities. We are also exposed to foreign currency exchange risk on U.S. dollar cash balances held by entities with a non-U.S. dollar functional currency and certain intercompany borrowings between certain of our entities with different functional currencies.
In accordance with our treasury policy, we take advantage of natural offsets to the extent possible. On a limited basis, we use contracts to hedge residual foreign currency exchange risk arising from receipts and payments denominated in foreign currencies. We generally do not hedge our exposure to translation gains or losses in respect of our non-U.S. dollar functional currency assets or liabilities. Additionally, when considered appropriate, we may enter into forward exchange contracts to hedge foreign currency exchange risk arising from specific transactions. We had no outstanding foreign currency derivative contracts as of June 30, 2020.
Commodity Risk
We are exposed to commodity and other price risk principally from the purchase of resin, natural gas, ethylene, propylene, benzene, diesel and polyethylene. We use various strategies to manage cost exposures on certain raw material purchases with the objective of obtaining more predictable costs for these commodities. We generally enter into commodity financial instruments or derivatives to hedge commodity prices related to resin (and its components), diesel and natural gas.
We enter into futures and swaps to reduce our exposure to commodity price fluctuations. These derivatives are implemented to either (a) mitigate the impact of the lag in timing between when raw material costs change and when we can pass on these raw material costs changes to our customers or (b) fix our input costs for a period of time. The following table provides the details of our outstanding commodity derivative contracts as of June 30, 2020.
| Type | Unit of measure | Contracted volume | Contracted price range | Contracted date of maturity | ||||
| Natural gas swaps | million BTU | 2,635,505 | $2.33 - $2.77 | Aug 2020 - Nov 2021 | ||||
| Polymer-grade propylene swaps | pound | 49,659,218 | $0.29 - $0.36 | Jul 2020 - Dec 2020 | ||||
| Benzene swaps | U.S. liquid gallon | 3,977,432 | $1.08 - $ 2.61 | Aug 2020 - Apr 2021 | ||||
| Diesel swaps | U.S. liquid gallon | 1,913,206 | $2.41 - $3.26 | Jul 2020 - May 2021 | ||||
| Low-density polyethylene swaps | pound | 6,000,000 | $0.52 | Jul 2020 - Dec 2020 | ||||
| High-density polyethylene swaps | pound | 3,750,000 | $0.45 | Jul 2020 - Nov 2020 | ||||
| Ethylene swaps | pound | 2,915,000 | $0.26 | Jul 2020 - Apr 2021 | ||||
The fair values of the commodity derivative contracts are derived from inputs based on quoted market prices or traded exchange market prices and represent the estimated amounts that we would pay or receive to terminate the contracts. As of June 30, 2020, the estimated fair values of the outstanding commodity derivative contracts were a net liability of $2 million. During the six month period ended June 30, 2020, we recognized a $2 million unrealized gain in net other income (expenses) in the profit or loss component of the statement of comprehensive income and a $22 million realized loss as a component of cost of sales in the statement of comprehensive income related to commodity derivatives.
A 10% upward (downward) movement in the price curve used to value the commodity derivative contracts, applied as of June 30, 2020, would have resulted in a change of less than $1 million in the unrealized loss on derivatives recognized in the statement of comprehensive income, assuming all other variables remain constant.
18
ITEM 4. CONTROLS AND PROCEDURES.
Evaluation of Disclosure Controls and Procedures
Our disclosure controls and procedures (as defined in Exchange Act Rules 13a-15(e) and 15d-15(e)) are designed to ensure that information required to be disclosed by us in reports we file or submit under the Securities Exchange Act of 1934, as amended, is recorded, processed, summarized and reported within the appropriate time periods, and that such information is accumulated and communicated to the Chief Executive Officer and Chief Financial Officer, as appropriate, to allow timely discussions regarding required disclosure. We, under the supervision of and with the participation of our management, including our Chief Executive Officer and Chief Financial Officer, have evaluated the effectiveness of our disclosure controls and procedures. Based on that evaluation, our Chief Executive Officer and Chief Financial Officer concluded that the design and operation of our disclosure controls and procedures were effective as of June 30, 2020.
Changes in Internal Control over Financial Reporting
There have not been any changes in our internal control over financial reporting during the three month period ended June 30, 2020 that have materially affected, or are reasonably likely to materially affect, our internal control over financial reporting.
PART II - OTHER INFORMATION
ITEM 1. LEGAL PROCEEDINGS.
We are involved in legal proceedings from time to time in the ordinary course of business. We believe that the outcome of these proceedings will not have a material effect on our financial condition, results of operations or cash flows. There have been no material changes to the legal proceedings disclosed in our Annual Report.
ITEM 1A. RISK FACTORS.
The COVID-19 pandemic and associated responses could adversely impact our business and results of operations.
The COVID-19 pandemic has significantly impacted economic activity and markets throughout the world. In response, governmental authorities have implemented numerous measures in an attempt to contain the virus, such as travel bans and restrictions, quarantines, ”stay-at-home” orders and business shutdowns. The pandemic and the measures instituted by governmental authorities and associated responses to the COVID-19 pandemic could adversely impact our business and results of operations in a number of ways, including but not limited to:
| • | impacts on our operations, including possible total or partial shutdowns of one or more of our manufacturing, warehousing or distribution facilities, including but not limited to, as a result of illness, government restrictions or other workforce disruptions; |
| • | the failure of third parties on which we rely, including but not limited to, those that supply our raw materials and other necessary operating materials, co-manufacturers and independent contractors, to meet their obligations to us, or significant disruptions in their ability to do so; |
| • | a strain on our supply chain, which could result from continued increased retailer and consumer demand for our products; |
| • | a disruption to our distribution capabilities or to our distribution channels, including those of our suppliers, manufacturers, logistics service providers or distributors; |
| • | new or escalated government or regulatory responses in markets where we manufacture, sell or distribute our products, or in the markets of third parties on which we rely, which could prevent or disrupt our business operations; |
| • | higher employee compensation costs, as well as incremental costs associated with newly added health screenings, temperature checks and enhanced cleaning and sanitation protocols to protect our employees; |
| • | significant reductions or volatility in demand for one or more of our products, which may be caused by, among other things: lower customer demand as a result of the temporary inability of consumers to purchase items that use our products due to illness, quarantine or other travel restrictions, or financial hardship; customers modifying their inventory, fulfillment or shipping practices; governmental restrictions and business closings; or pantry-loading activity or other changes in buying patterns; |
| • | local, regional, national or international economic slowdowns; and |
| • | volatility in the net liability for our pension plans, with the value of plan assets and liabilities both impacted by changes in financial markets. |
These and other impacts of the COVID-19 pandemic could have the effect of heightening many of the other risk factors disclosed in our Annual Report. The ultimate impact depends on the severity and duration of the current COVID-19 pandemic and actions taken by governmental authorities and other third parties in response, each of which is uncertain, rapidly changing and difficult to predict. Any of these disruptions could adversely impact our business and results of operations.
There have been no other material changes in the risk factors disclosed in our Annual Report.
ITEM 2. UNREGISTERED SALES OF EQUITY SECURITIES AND USE OF PROCEEDS.
Not applicable.
19
ITEM 3. DEFAULTS UPON SENIOR SECURITIES.
Not applicable.
ITEM 4. MINE SAFETY DISCLOSURE.
Not applicable.
ITEM 5. OTHER INFORMATION.
Not applicable.
ITEM 6. EXHIBITS.
Exhibit Number | Description of Exhibit | |
| 31.1 | Certification of Principal Executive Officer pursuant to Section 302 of the Sarbanes-Oxley Act of 2002. | |
| 31.2 | Certification of Principal Financial Officer pursuant to Section 302 of the Sarbanes-Oxley Act of 2002. | |
| 32.1 | Certification of Principal Executive Officer pursuant to section 1350 of Title 18 of the United States Code, as adopted by Section 906 of the Sarbanes-Oxley Act of 2002. | |
| 32.2 | Certification of Principal Financial Officer pursuant to section 1350 of Title 18 of the United States Code, as adopted by Section 906 of the Sarbanes-Oxley Act of 2002. | |
20
31.1 Rule 13a-14(a) Certification
I, Thomas Degnan, certify that:
1. I have reviewed this quarterly report of Reynolds Group Holdings Limited (“the company”);
2. Based on my knowledge, this report does not contain any untrue statement of a material fact or omit to state a material fact necessary to
make the statements made, in light of the circumstances under which such statements were made, not misleading with respect to the period
covered by this report;
3. Based on my knowledge, the financial statements, and other financial information included in this report, fairly present in all material respects
the financial condition, results of operations and cash flows of the company as of, and for, the periods presented in this report;
4. The company’s other certifying officer and I are responsible for establishing and maintaining disclosure controls and procedures (as defined
in Exchange Act Rules 13a-15(e) and 15d-15(e)) and internal control over financial reporting (as defined in Exchange Act Rules 13a-15(f) and 15d-15(f)) for the company and have:
(a) Designed such disclosure controls and procedures, or caused such disclosure controls and procedures to be designed under our supervision, to ensure that material information relating to the company, including its consolidated subsidiaries, is made known to us by others within those entities, particularly during the period in which this report is being prepared;
(b) Designed such internal control over financial reporting, or caused such internal control over financial reporting to be designed under our supervision, to provide reasonable assurance regarding the reliability of financial reporting and the preparation of financial statements for external purposes in accordance with generally accepted accounting principles;
(c) Evaluated the effectiveness of the company’s disclosure controls and procedures and presented in this report our conclusions about the effectiveness of the disclosure controls and procedures, as of the end of the period covered by this report based on such evaluation; and
(d) Disclosed in this report any change in the company’s internal control over financial reporting that occurred during the company’s most recent fiscal quarter (the company’s fourth fiscal quarter in the case of an annual report) that has materially affected, or is reasonably likely to materially affect, the company’s internal control over financial reporting; and
5. The company’s other certifying officer and I have disclosed, based on our most recent evaluation of internal control over financial reporting, to the company’s auditors and the audit committee of the company’s board of directors (or persons performing the equivalent functions):
(a) All significant deficiencies and material weaknesses in the design or operation of internal control over financial reporting which are reasonably likely to adversely affect the company’s ability to record, process, summarize and report financial information; and
(b) Any fraud, whether or not material, that involves management or other employees who have a significant role in the company’s internal control over financial reporting.
| /s/ THOMAS DEGNAN | |
| Thomas Degnan | |
| Chief Executive Officer | |
| August 13, 2020 | |
21
31.2 Rule 13a-14(a) Certification
I, Allen Hugli, certify that:
1. I have reviewed this quarterly report of Reynolds Group Holdings Limited (the “company”);
2. Based on my knowledge, this report does not contain any untrue statement of a material fact or omit to state a material fact necessary to
make the statements made, in light of the circumstances under which such statements were made, not misleading with respect to the period
covered by this report;
3. Based on my knowledge, the financial statements, and other financial information included in this report, fairly present in all material
respects the financial condition, results of operations and cash flows of the company as of, and for, the periods presented in this report;
4. The company’s other certifying officer and I are responsible for establishing and maintaining disclosure controls and procedures (as defined in Exchange Act Rules 13a-15(e) and 15d-15(e)) and internal control over financial reporting (as defined in Exchange Act Rules 13a-15(f) and 15d-15(f)) for the company and have:
(a) Designed such disclosure controls and procedures, or caused such disclosure controls and procedures to be designed under our supervision, to ensure that material information relating to the company, including its consolidated subsidiaries, is made known to us by others within those entities, particularly during the period in which this report is being prepared;
(b) Designed such internal control over financial reporting, or caused such internal control over financial reporting to be designed under our supervision, to provide reasonable assurance regarding the reliability of financial reporting and the preparation of financial statements for external purposes in accordance with generally accepted accounting principles;
(c) Evaluated the effectiveness of the company’s disclosure controls and procedures and presented in this report our conclusions about the effectiveness of the disclosure controls and procedures, as of the end of the period covered by this report based on such evaluation; and
(d) Disclosed in this report any change in the company’s internal control over financial reporting that occurred during the company’s most recent fiscal quarter (the company’s fourth fiscal quarter in the case of an annual report) that has materially affected, or is reasonably likely to materially affect, the company’s internal control over financial reporting; and
5. The company’s other certifying officer and I have disclosed, based on our most recent evaluation of internal control over financial reporting,
to the company’s auditors and the audit committee of the company’s board of directors (or persons performing the equivalent functions):
(a) All significant deficiencies and material weaknesses in the design or operation of internal control over financial reporting which are reasonably likely to adversely affect the company’s ability to record, process, summarize and report financial information; and
(b) Any fraud, whether or not material, that involves management or other employees who have a significant role in the company’s internal control over financial reporting.
| /s/ ALLEN HUGLI | |
| Allen Hugli | |
| Chief Financial Officer | |
| August 13, 2020 | |
22
32.1 CERTIFICATION PURSUANT TO 18 U.S.C. SECTION 1350, AS ADOPTED PURSUANT
TO SECTION 906 OF THE SARBANES-OXLEY ACT OF 2002
In connection with the quarterly report of Reynolds Group Holdings Limited for the period ended June 30, 2020 as furnished with the Securities and Exchange Commission on the date hereof, I, Thomas Degnan, as Chief Executive Officer of the company, hereby certify, pursuant to 18 U.S.C. § 1350, as adopted pursuant to § 906 of the Sarbanes-Oxley Act of 2002, that, to the best of my knowledge:
(1) The quarterly report fully complies with the requirements of section 13(a) or 15(d) of the Securities Exchange Act of 1934; and
(2) The information contained in the quarterly report fairly presents, in all material respects, the financial condition and results of operations of the company.
| /s/ THOMAS DEGNAN | |
| Thomas Degnan | |
| Chief Executive Officer | |
| August 13, 2020 | |
23
32.2 CERTIFICATION PURSUANT TO 18 U.S.C. SECTION 1350, AS ADOPTED PURSUANT
TO SECTION 906 OF THE SARBANES-OXLEY ACT OF 2002
In connection with the quarterly report of Reynolds Group Holdings Limited for the period ended June 30, 2020 as furnished with the Securities and Exchange Commission on the date hereof, I, Allen Hugli, as Chief Financial Officer of the company, hereby certify, pursuant to 18 U.S.C. § 1350, as adopted pursuant to § 906 of the Sarbanes-Oxley Act of 2002, that, to the best of my knowledge:
(1) The quarterly report fully complies with the requirements of section 13(a) or 15(d) of the Securities Exchange Act of 1934; and
(2) The information contained in the quarterly report fairly presents, in all material respects, the financial condition and results of operations of the company.
| /s/ ALLEN HUGLI | |
| Allen Hugli | |
| Chief Financial Officer | |
| August 13, 2020 | |
24
Reynolds Group Holdings Limited
Interim unaudited condensed consolidated financial statements
for the three and six month periods ended
June 30, 2020 and 2019
Reynolds Group Holdings Limited
Contents
Index to the Financial Statements
| Reynolds Group Holdings Limited interim unaudited condensed consolidated financial statements for the three and six month periods ended June 30, 2020 and 2019 | |
| Interim unaudited condensed consolidated statements of comprehensive income | |
| Interim unaudited condensed consolidated statements of financial position | |
| Interim unaudited condensed consolidated statements of changes in equity | |
| Interim unaudited condensed consolidated statements of cash flows | |
| Notes to the interim unaudited condensed consolidated financial statements | |
F-1
Reynolds Group Holdings Limited
Interim unaudited condensed consolidated statements of comprehensive income
| For the three month period ended June 30, | For the six month period ended June 30, | |||||||||||||
| (In $ million) | Note | 2020 | 2019(1) | 2020 | 2019(1) | |||||||||
| Total revenue | 13 | 1,569 | 1,806 | 3,259 | 3,594 | |||||||||
| Cost of sales | (1,337 | ) | (1,503 | ) | (2,761 | ) | (3,028 | ) | ||||||
| Gross profit | 232 | 303 | 498 | 566 | ||||||||||
| Selling, marketing and distribution expenses | (19 | ) | (27 | ) | (42 | ) | (50 | ) | ||||||
| General and administration expenses | (159 | ) | (159 | ) | (321 | ) | (313 | ) | ||||||
| Net other income (expenses) | 6 | 29 | (32 | ) | 3 | (29 | ) | |||||||
| Profit from operating activities | 83 | 85 | 138 | 174 | ||||||||||
| Financial income | 8 | 4 | 13 | 47 | 85 | |||||||||
| Financial expenses | 8 | (174 | ) | (117 | ) | (285 | ) | (235 | ) | |||||
| Net financial income (expenses) | (170 | ) | (104 | ) | (238 | ) | (150 | ) | ||||||
| Profit (loss) from continuing operations before income tax | (87 | ) | (19 | ) | (100 | ) | 24 | |||||||
| Income tax (expense) benefit | 9 | (128 | ) | (9 | ) | 174 | (35 | ) | ||||||
| Profit (loss) from continuing operations | (215 | ) | (28 | ) | 74 | (11 | ) | |||||||
| Profit (loss) from discontinued operations, net of income tax | 7 | — | 105 | 7 | 156 | |||||||||
| Profit (loss) for the period | (215 | ) | 77 | 81 | 145 | |||||||||
| Other comprehensive income (loss), net of income tax | ||||||||||||||
| Items that may be reclassified into profit (loss) | ||||||||||||||
| Exchange differences on translating foreign operations | 72 | (1 | ) | (95 | ) | 10 | ||||||||
| Reclassification from foreign currency translation reserve | (1 | ) | 7 | — | 7 | |||||||||
| Items that will not be reclassified into profit (loss) | ||||||||||||||
| Remeasurement of defined benefit plans | (12 | ) | (19 | ) | (275 | ) | 86 | |||||||
| Total other comprehensive income (loss), net of income tax | 59 | (13 | ) | (370 | ) | 103 | ||||||||
| Total comprehensive income (loss) | (156 | ) | 64 | (289 | ) | 248 | ||||||||
| Profit (loss) attributable to: | ||||||||||||||
| Equity holder of the Group - continuing operations | (216 | ) | (29 | ) | 73 | (12 | ) | |||||||
| Equity holder of the Group - discontinued operations | — | 105 | 7 | 156 | ||||||||||
| Non-controlling interests | 1 | 1 | 1 | 1 | ||||||||||
| (215 | ) | 77 | 81 | 145 | ||||||||||
| Total comprehensive income (loss) attributable to: | ||||||||||||||
| Equity holder of the Group - continuing operations | (157 | ) | (40 | ) | (297 | ) | 88 | |||||||
| Equity holder of the Group - discontinued operations | — | 103 | 7 | 159 | ||||||||||
| Non-controlling interests | 1 | 1 | 1 | 1 | ||||||||||
| (156 | ) | 64 | (289 | ) | 248 | |||||||||
| (1) | The information presented has been revised to reflect the presentation of certain businesses as discontinued operations. Refer to notes 2.2 and 7 for additional information. |
The interim unaudited condensed consolidated statements of comprehensive income should be read in conjunction with the notes to the interim unaudited condensed consolidated financial statements.
F-2
Reynolds Group Holdings Limited
Interim unaudited condensed consolidated statements of financial position
| (In $ million) | Note | As of June 30, 2020 | As of December 31, 2019 | |||||
| Assets | ||||||||
| Cash and cash equivalents | 1,609 | 1,291 | ||||||
| Trade and other receivables, net | 796 | 993 | ||||||
| Inventories | 11 | 903 | 1,312 | |||||
| Current tax assets | 9 | 48 | 9 | |||||
| Assets held for sale | 11 | 11 | ||||||
| Derivatives | 2 | 6 | ||||||
| Other assets | 66 | 93 | ||||||
| Total current assets | 3,435 | 3,715 | ||||||
| Related party and other non-current receivables | 423 | 415 | ||||||
| Investments in associates and joint ventures | 26 | 24 | ||||||
| Deferred tax assets | 9 | 27 | ||||||
| Property, plant and equipment | 2,755 | 3,277 | ||||||
| Intangible assets | 5,446 | 8,561 | ||||||
| Derivatives | 78 | 151 | ||||||
| Other assets | 79 | 87 | ||||||
| Total non-current assets | 8,816 | 12,542 | ||||||
| Total assets | 12,251 | 16,257 | ||||||
| Liabilities | ||||||||
| Trade and other payables | 714 | 975 | ||||||
| Borrowings | 12 | 415 | 3,587 | |||||
| Lease liabilities | 83 | 81 | ||||||
| Current tax liabilities | 16 | 30 | ||||||
| Derivatives | 9 | 5 | ||||||
| Employee benefits | 137 | 187 | ||||||
| Provisions | 29 | 42 | ||||||
| Total current liabilities | 1,403 | 4,907 | ||||||
| Non-current payables | 38 | 36 | ||||||
| Borrowings | 12 | 7,026 | 7,053 | |||||
| Lease liabilities | 310 | 295 | ||||||
| Deferred tax liabilities | 9 | 533 | 1,025 | |||||
| Derivatives | 2 | — | ||||||
| Employee benefits | 14 | 1,231 | 895 | |||||
| Provisions | 67 | 69 | ||||||
| Total non-current liabilities | 9,207 | 9,373 | ||||||
| Total liabilities | 10,610 | 14,280 | ||||||
| Net assets | 1,641 | 1,977 | ||||||
| Equity | ||||||||
| Share capital | 1,616 | 1,664 | ||||||
| Reserves | (1,353 | ) | (1,237 | ) | ||||
| Retained profits | 1,375 | 1,547 | ||||||
| Equity attributable to equity holder of the Group | 1,638 | 1,974 | ||||||
| Non-controlling interests | 3 | 3 | ||||||
| Total equity | 1,641 | 1,977 | ||||||
The interim unaudited condensed consolidated statements of financial position should be read in conjunction with the notes to the interim unaudited condensed consolidated financial statements.
F-3
Reynolds Group Holdings Limited
Interim unaudited condensed consolidated statements of changes in equity
| (In $ million) | Share capital | Translation of foreign operations | Other reserves(1) | Retained profits | Equity attributable to equity holder of the Group | Non-controlling interests | Total | ||||||||||||||
| Balance at the beginning of the period (January 1, 2019) | 1,664 | (442 | ) | (1,292 | ) | 1,687 | 1,617 | 9 | 1,626 | ||||||||||||
| Total comprehensive income (loss) for the period: | |||||||||||||||||||||
| Profit (loss) after income tax | — | — | — | 144 | 144 | 1 | 145 | ||||||||||||||
| Remeasurement of defined benefit plans, net of income tax | — | — | 86 | — | 86 | — | 86 | ||||||||||||||
| Foreign currency translation reserve | — | 10 | — | — | 10 | — | 10 | ||||||||||||||
| Reclassification of foreign currency translation reserve upon disposal of businesses | — | 7 | — | — | 7 | — | 7 | ||||||||||||||
| Total comprehensive income (loss) for the period | — | 17 | 86 | 144 | 247 | 1 | 248 | ||||||||||||||
| Change upon sale of businesses | — | — | 1 | (1 | ) | — | (4 | ) | (4 | ) | |||||||||||
| Dividends paid to non-controlling interests | — | — | — | — | — | (1 | ) | (1 | ) | ||||||||||||
| Balance as of June 30, 2019 | 1,664 | (425 | ) | (1,205 | ) | 1,830 | 1,864 | 5 | 1,869 | ||||||||||||
| Balance at the beginning of the period (January 1, 2020) | 1,664 | (354 | ) | (883 | ) | 1,547 | 1,974 | 3 | 1,977 | ||||||||||||
| Total comprehensive income (loss) for the period: | |||||||||||||||||||||
| Profit (loss) after income tax | — | — | — | 80 | 80 | 1 | 81 | ||||||||||||||
| Remeasurement of defined benefit plans, net of income tax | — | — | (275 | ) | — | (275 | ) | — | (275 | ) | |||||||||||
| Foreign currency translation reserve | — | (95 | ) | — | — | (95 | ) | — | (95 | ) | |||||||||||
| Total comprehensive income (loss) for the period | — | (95 | ) | (275 | ) | 80 | (290 | ) | 1 | (289 | ) | ||||||||||
| Change upon distribution of Reynolds Consumer Products | (48 | ) | 2 | 252 | (252 | ) | (46 | ) | — | (46 | ) | ||||||||||
| Dividends paid to non-controlling interests | — | — | — | — | — | (1 | ) | (1 | ) | ||||||||||||
| Balance as of June 30, 2020 | 1,616 | (447 | ) | (906 | ) | 1,375 | 1,638 | 3 | 1,641 | ||||||||||||
| (1) | The balance as of June 30, 2020 includes the cumulative reduction in equity of $1,048 million from businesses acquired under common control transactions with the remainder consisting of the cumulative remeasurement of defined benefit plans. During the six month period ended June 30, 2020, $272 million of the common control reserve, net of $20 million of the cumulative remeasurement of defined benefit plans reserve, was transferred into retained profits as a result of the distribution of Reynolds Consumer Products. |
The interim unaudited condensed consolidated statements of changes in equity should be read in conjunction with the notes to the interim unaudited condensed consolidated financial statements.
F-4
Reynolds Group Holdings Limited
Interim unaudited condensed consolidated statements of cash flows
| For the six month period ended June 30, | ||||||
| (In $ million) | 2020 | 2019 | ||||
| Cash flows from (used in) operating activities | ||||||
| Profit (loss) | 81 | 145 | ||||
| Adjustments for: | ||||||
| Depreciation and amortization | 311 | 366 | ||||
| Asset impairment charges, net of reversals | (3 | ) | 18 | |||
| Change in fair value of derivatives | (1 | ) | (14 | ) | ||
| (Gain) loss on sale or disposal of businesses and non-current assets | (13 | ) | 14 | |||
| Share of profit of associates and joint ventures, net of income tax | (2 | ) | (2 | ) | ||
| Net financial (income) expenses | 258 | 243 | ||||
| Interest paid on borrowings | (235 | ) | (309 | ) | ||
| Interest paid on lease liabilities | (13 | ) | (15 | ) | ||
| Income tax expense (benefit) | (169 | ) | 71 | |||
| Income taxes paid, net of refunds received | (16 | ) | (49 | ) | ||
| Change in trade and other receivables | 15 | (131 | ) | |||
| Change in inventories | (47 | ) | (106 | ) | ||
| Change in trade and other payables | (22 | ) | 25 | |||
| Change in provisions and employee benefits | 43 | 41 | ||||
| Change in other assets and liabilities | 9 | (26 | ) | |||
| Net cash from (used in) operating activities | 196 | 271 | ||||
| Cash flows from (used in) investing activities | ||||||
| Acquisition of property, plant and equipment and intangible assets | (214 | ) | (288 | ) | ||
| Proceeds from sale of property, plant and equipment and other assets | — | 13 | ||||
| Disposal of business, net of cash disposed | 9 | (2 | ) | |||
| Proceeds from related party loan repayment | — | 5 | ||||
| Other | 4 | 2 | ||||
| Net cash from (used in) investing activities | (201 | ) | (270 | ) | ||
| Cash flows from (used in) financing activities | ||||||
| Drawdown of Reynolds Consumer Products borrowings (refer to note 7) | 3,640 | — | ||||
| Repayment of borrowings | (3,215 | ) | (18 | ) | ||
| Repayment of lease liabilities | (39 | ) | (38 | ) | ||
| Payment of Reynolds Consumer Products debt transaction costs | (24 | ) | — | |||
| Cash held by Reynolds Consumer Products at the time of distribution | (31 | ) | — | |||
| Other | (1 | ) | (1 | ) | ||
| Net cash from (used in) financing activities | 330 | (57 | ) | |||
| Net increase (decrease) in cash and cash equivalents | 325 | (56 | ) | |||
| Cash and cash equivalents at the beginning of the period | 1,291 | 783 | ||||
| Effect of exchange rate fluctuations on cash and cash equivalents | (7 | ) | 1 | |||
| Cash and cash equivalents at the end of the period | 1,609 | 728 | ||||
| Cash and cash equivalents are comprised of: | ||||||
| Cash and cash equivalents | 1,609 | 728 | ||||
| Cash and cash equivalents classified as assets held for sale | — | — | ||||
| Cash and cash equivalents at the end of the period | 1,609 | 728 | ||||
Significant non-cash financing and investing activities
During the six month period ended June 30, 2020, the Company repurchased and canceled 35,791,985 shares from PFL in exchange for transferring 100% of the shares in RCPI to PFL. Refer to note 7 for additional information.
During the six month period ended June 30, 2019, right-of-use assets and lease liabilities were recognized upon adoption of the new lease accounting policy. In addition, $113 million and $41 million of right-of-use assets and lease liabilities were recorded during the six month periods ended June 30, 2020 and 2019, respectively.
The interim unaudited condensed consolidated statements of cash flows should be read in conjunction with the notes to the interim unaudited condensed consolidated financial statements.
F-5
Reynolds Group Holdings Limited
Notes to the interim unaudited condensed consolidated financial statements
For the three and six month periods ended June 30, 2020
1.Reporting entity
Reynolds Group Holdings Limited (the “Company”) is a company domiciled in New Zealand and registered under the Companies Act 1993.
The interim unaudited condensed consolidated financial statements of the Company as of June 30, 2020 and for the three and six month periods ended June 30, 2020 and June 30, 2019 comprise the Company and its subsidiaries and their interests in associates and jointly controlled entities. Collectively, these entities are referred to as the “Group.”
The address of the registered office of the Company is c/o: Rank Group Limited, Level 9, 148 Quay Street, Auckland 1010, New Zealand.
2. Basis of preparation
2.1 Statement of compliance
The interim unaudited condensed consolidated financial statements have been prepared in accordance with International Accounting Standard 34 “Interim Financial Reporting.” The disclosures required for interim financial statements are less extensive than the disclosure requirements for annual financial statements and should be read in conjunction with the annual financial statements of the Group for the year ended December 31, 2019. The December 31, 2019 statement of financial position as presented in the interim unaudited condensed consolidated financial statements was derived from the Group’s audited financial statements for the year ended December 31, 2019, but does not include all of the disclosures required by International Financial Reporting Standards as issued by the International Accounting Standards Board.
The interim unaudited condensed consolidated financial statements were approved by the Board of Directors (the “Directors”) on August 12, 2020 in Chicago, Illinois (August 13, 2020 in Auckland, New Zealand).
2.2 Comparative information
Reynolds Consumer Products distribution and sale of closures businesses
On February 4, 2020, the Group effected a number of distributions to transfer its interest in the operations that represented the Reynolds Consumer Products segment to its shareholder, Packaging Finance Limited (“PFL”). These distributions occurred prior to and in preparation for the initial public offering (“IPO”) of shares of common stock of Reynolds Consumer Products Inc. (“RCPI”), which was completed on February 4, 2020. The results of Reynolds Consumer Products have been presented as discontinued operations for all periods presented. The statement of financial position as of December 31, 2019 includes balances related to Reynolds Consumer Products. Refer to note 7.
On December 20, 2019, the Group completed the sale of its North American and Japanese closures businesses. These operations represent substantially all of the Group's former Closures segment. The results of the North American and Japanese closures businesses have been presented as discontinued operations for all periods presented. Refer to note 7. The Group retained and continues to operate the remaining closures businesses, the results of which are presented as continuing operations.
Revision of previously-issued March 31, 2020 interim financial statements
Provision for income taxes
In connection with the preparation of its June 30, 2020 interim financial statements, the Group identified errors in its computation of the tax impact of the recently enacted Coronavirus Aid, Relief and Economic Security (“CARES”) Act, which resulted in an overstatement of the tax benefit in its previously-issued March 31, 2020 interim financial statements. The errors resulted from certain distinct matters associated with the application of the tax impacts of the CARES Act.
The Group evaluated the effect of these errors on the previously-issued March 31, 2020 interim financial statements and determined the amounts were not material to the previously-issued financial statements. The Group has, however, determined that it is appropriate to revise the previously-issued March 31, 2020 interim financial statements to correct for these tax errors, which revision will be effected in connection with the Group’s issuance in the future of the March 31, 2021 interim financial statements.
The following tables present the correction of these tax errors on the affected financial statement line items. The errors did not have an impact on any of the subtotals of operating, investing or financing cash flows or total changes in cash and cash equivalents within the statement of cash flows for the three month period ended March 31, 2020.
F-6
Reynolds Group Holdings Limited
Notes to the interim unaudited condensed consolidated financial statements
For the three and six month periods ended June 30, 2020
Interim unaudited condensed consolidated statement of comprehensive income
| For the three month period ended March 31, 2020 | |||||||||
| (In $ million) | As previously reported | Adjustments | As revised | ||||||
| Income tax (expense) benefit | 352 | (50 | ) | 302 | |||||
| Profit (loss) from continuing operations | 339 | (50 | ) | 289 | |||||
| Profit (loss) from discontinued operations, net of income tax | (4 | ) | 11 | 7 | |||||
| Profit (loss) for the period | 335 | (39 | ) | 296 | |||||
| Total comprehensive income (loss) | (94 | ) | (39 | ) | (133 | ) | |||
| Profit (loss) attributable to: | |||||||||
| Equity holder of the Group - continuing operations | 339 | (50 | ) | 289 | |||||
| Equity holder of the Group - discontinued operations | (4 | ) | 11 | 7 | |||||
| 335 | (39 | ) | 296 | ||||||
| Total comprehensive income (loss) attributable to: | |||||||||
| Equity holder of the Group - continuing operations | (90 | ) | (50 | ) | (140 | ) | |||
| Equity holder of the Group - discontinued operations | (4 | ) | 11 | 7 | |||||
| (94 | ) | (39 | ) | (133 | ) | ||||
Interim unaudited condensed consolidated statement of financial position
| As of March 31, 2020 | |||||||||
| (In $ million) | As previously reported | Adjustments | As revised | ||||||
| Current tax assets | 44 | 9 | 53 | ||||||
| Total current assets | 3,395 | 9 | 3,404 | ||||||
| Related party and other non-current receivables | 394 | (9 | ) | 385 | |||||
| Total non-current assets | 8,826 | (9 | ) | 8,817 | |||||
| Total assets | 12,221 | — | 12,221 | ||||||
| Deferred tax liabilities | 354 | 39 | 393 | ||||||
| Total non-current liabilities | 8,984 | 39 | 9,023 | ||||||
| Total liabilities | 10,385 | 39 | 10,424 | ||||||
| Net assets | 1,836 | (39 | ) | 1,797 | |||||
| Retained profits | 1,630 | (39 | ) | 1,591 | |||||
| Equity attributable to equity holder of the Group | 1,834 | (39 | ) | 1,795 | |||||
| Total equity | 1,836 | (39 | ) | 1,797 | |||||
Interim unaudited condensed consolidated statement of changes in equity
| For the three month period ended March 31, 2020 | |||||||||
| (In $ million) | As previously reported | Adjustments | As revised | ||||||
| Profit (loss) after income tax | 335 | (39 | ) | 296 | |||||
| Total comprehensive income (loss) for the period | (94 | ) | (39 | ) | (133 | ) | |||
| Total equity as of March 31, 2020 | 1,836 | (39 | ) | 1,797 | |||||
Reportable segment assets
The Graham Packaging reportable segment assets as of March 31, 2020 disclosed in note 4 in the previously-issued March 31, 2020 interim financial statements should have been $1,177 million compared to the $1,358 million that was disclosed. In addition, total reportable segment assets as of March 31, 2020 disclosed in note 4 in the previously-issued March 31, 2020 interim financial statements should have been $4,001 million compared to the $4,182 million that was disclosed, and the Unallocated amount of assets as of March 31, 2020 should have been $8,162 compared to the $7,981 million that was disclosed.
F-7
Reynolds Group Holdings Limited
Notes to the interim unaudited condensed consolidated financial statements
For the three and six month periods ended June 30, 2020
2.3 Accounting policies and recently issued accounting pronouncements
Accounting policies
The accounting policies applied by the Group in the interim unaudited condensed consolidated financial statements are consistent with those applied by the Group in the annual consolidated financial statements for the year ended December 31, 2019.
Standards and amendments to existing standards that are not yet effective and have not been adopted by the Group
There have been no material changes to any previously issued accounting pronouncements or to the Group’s evaluation of the related impact as disclosed by the Group in the annual consolidated financial statements for the year ended December 31, 2019.
2.4 Use of estimates and judgments
The preparation of the interim unaudited condensed consolidated financial statements requires the Directors and management to make judgments, estimates and assumptions that affect the application of accounting policies and the reported amounts of assets and liabilities, income and expenses and disclosure of contingent assets and liabilities. The estimates and associated assumptions are based on historical experience and various other factors that are believed to be reasonable under the circumstances. Actual results may differ from these estimates. These estimates and underlying assumptions are reviewed on an ongoing basis. Revisions to accounting estimates are recognized in the period in which the estimate is revised if the revision affects only that period or in the period of the revision and future periods if the revision affects both the current and future periods. The key estimates and assumptions used in the preparation of the interim unaudited condensed consolidated financial statements are consistent with those disclosed by the Group in the annual consolidated financial statements for the year ended December 31, 2019.
During the year ended December 31, 2018, the Group recognized an impairment expense in respect of goodwill at Graham Packaging. Based on the Group’s assessment of goodwill recoverability for the year ended December 31, 2019, no further impairment of goodwill at Graham Packaging was identified. However, the estimated recoverable amount of Graham Packaging exceeds the carrying value of this business by only a limited amount. While no triggering events for a further impairment were recognized during the six month period ended June 30, 2020, a reasonably possible unexpected deterioration in financial performance or adverse change in the earnings multiple may result in a further impairment in a future period.
Although the Group’s current estimates contemplate current conditions, including the impact of the COVID-19 pandemic, and how the Group expects them to change in the future, as appropriate, it is reasonably possible that actual conditions could differ from what was anticipated in those estimates, which could materially affect the Group’s results of operations and financial condition. On March 11, 2020, the COVID-19 outbreak was declared a pandemic by the World Health Organization, which recommended containment and mitigation measures worldwide. The outbreak and the response of governmental and public health organizations in dealing with the pandemic included restricting general activity levels within communities, the economy and operations of the Group’s customers. The Group has experienced a significant impact to its results of operations as a result of the COVID-19 pandemic, and it may also have additional far-reaching impacts on many aspects of the Group’s operations, including the impact on customer behaviors, business and manufacturing operations, the Group’s employees and the market in general. The extent to which the COVID-19 pandemic ultimately impacts the Group’s business, financial condition, results of operations, cash flows and liquidity may differ from management’s current estimates due to inherent uncertainties regarding the duration and further spread of the outbreak, actions taken to contain the virus, as well as how quickly and to what extent normal economic and operating conditions can resume.
3. Financial risk management
3.1 Liquidity risk
The following table sets out contractual cash flows for borrowings and lease liabilities:
| (In $ million) | Financial liabilities | Less than one year | One to three years | Three to five years | Greater than five years | ||||||||||
| As of June 30, 2020* | |||||||||||||||
| Borrowings, including interest | 8,538 | 735 | 4,680 | 2,602 | 521 | ||||||||||
| Lease liabilities | 468 | 107 | 176 | 110 | 75 | ||||||||||
| As of December 31, 2019* | |||||||||||||||
| Borrowings, including interest | 12,127 | 4,043 | 1,513 | 6,031 | 540 | ||||||||||
| Lease liabilities | 453 | 105 | 168 | 102 | 78 | ||||||||||
| * | The exchange rate on euro-denominated borrowings and non-U.S. dollar lease liabilities and the interest rates on the floating rate debt balances have been assumed to be the same as the respective rates as of June 30, 2020 and December 31, 2019. |
If the Group exercised all extension options not currently included in lease liabilities, it could have a material impact.
There are no significant commitments for leases not commenced as of June 30, 2020.
Trade and other payables, excluding accrued interest, that are due in less than one year were $625 million and $839 million as of June 30, 2020 and December 31, 2019, respectively.
Refer to note 16 for information on borrowings transactions which occurred subsequent to June 30, 2020.
F-8
Reynolds Group Holdings Limited
Notes to the interim unaudited condensed consolidated financial statements
For the three and six month periods ended June 30, 2020
3.2 Fair value measurements recognized in the statements of comprehensive income
The Group’s derivative financial instruments are measured subsequent to initial recognition at fair value and are grouped into levels based on the degree to which the fair value is observable.
| • | Level 1 fair value measurements are those derived from quoted prices (unadjusted) in active markets for identical assets |
| • | Level 2 fair value measurements are those derived from inputs other than quoted prices included within Level 1 that are observable for the asset or liability, either directly (i.e., as prices) or indirectly (i.e., derived from prices) |
| • | Level 3 fair value measurements are those derived from valuation techniques that include inputs for the asset or liability that are not based on observable market data (unobservable inputs) |
Refer to the Group’s annual financial statements for further details regarding models and other valuation methodologies associated with Level 2 and Level 3 inputs.
The following table summarizes the valuation of the Group’s assets and liabilities measured at fair value on a recurring basis as of June 30, 2020 and December 31, 2019:
| (In $ million) | Level 1 | Level 2 | Level 3 | Total | ||||||||
| As of June 30, 2020 | ||||||||||||
| Financial assets at fair value through profit or loss: | ||||||||||||
| Derivative financial assets (liabilities): | ||||||||||||
| Commodity derivatives, net | — | (2 | ) | — | (2 | ) | ||||||
| Interest rate swap derivatives, net | — | (7 | ) | — | (7 | ) | ||||||
| Embedded derivatives | — | — | 78 | 78 | ||||||||
| Total | — | (9 | ) | 78 | 69 | |||||||
| As of December 31, 2019 | ||||||||||||
| Financial assets at fair value through profit or loss: | ||||||||||||
| Derivative financial assets (liabilities): | ||||||||||||
| Commodity derivatives, net | — | (4 | ) | — | (4 | ) | ||||||
| Interest rate swap derivatives, net | — | 7 | — | 7 | ||||||||
| Embedded derivatives | — | — | 149 | 149 | ||||||||
| Total | — | 3 | 149 | 152 | ||||||||
The table below presents changes in fair value for all assets and liabilities categorized as Level 3 as of June 30, 2020:
| (In $ million) | Embedded derivatives | ||
| Balance as of December 31, 2019 | 149 | ||
| Net gains (losses) recognized in net financial income (expenses) | (71 | ) | |
| Balance as of June 30, 2020 | 78 | ||
4. Segment reporting
Following the distribution of the Group’s former Reynolds Consumer Products segment in February 2020, the Group realigned its reportable segments as of March 31, 2020, resulting in four reportable segments: Foodservice, Food Merchandising, Evergreen and Graham Packaging. These reportable segments reflect the change in the Group’s operating structure and the manner in which the Group’s Chief Operating Decision Maker (“CODM”) assesses information for decision-making purposes.
The key factors used to identify these reportable segments are the organization and alignment of the Group’s internal operations and the nature of its products. This reflects how the Group’s CODM monitors performance, allocates capital and makes strategic and operational decisions.
The Group’s reportable business segments are as follows:
| • | Foodservice — Foodservice manufactures a broad range of products that enable consumers to eat and drink where they want and when they want with convenience. Foodservice manufactures food containers, hot and cold cups and lids, dinnerware items and other products which make eating on-the-go more enjoyable and easy to do. |
| • | Food Merchandising — Food Merchandising manufactures products that protect and attractively display food while preserving freshness. Food Merchandising products include clear rigid-display containers, containers for prepared and ready-to-eat food, trays for meat and poultry and molded fiber cartons. |
F-9
Reynolds Group Holdings Limited
Notes to the interim unaudited condensed consolidated financial statements
For the three and six month periods ended June 30, 2020
| • | Evergreen — Evergreen manufactures cartons for fresh refrigerated beverage products, primarily serving dairy (including plant-based, organic and specialties), juice and other specialty beverage end-markets. Evergreen manufactures and supplies integrated fresh carton systems, which include printed cartons, spouts and filling machinery. It also produces fiber-based liquid packaging board for its internal requirements and to sell to other fresh beverage carton manufacturers, as well as a range of paper-based products which it sells to paper and packaging converters. |
| • | Graham Packaging — Graham Packaging is a designer and manufacturer of value-added, custom blow-molded plastic containers for consumer products. |
In addition to the above, the Group has other operations which do not meet the threshold for presentation as a reportable segment:
| • | Other — Other primarily includes the operations of the remaining former closures business, which generate revenue from the sale of caps and closures. |
| • | Unallocated — Unallocated includes corporate costs, primarily relating to group wide functions such as finance, tax and legal and the effects of the RGPP. |
The Group’s CODM does not review the business activities of the Group based on geography.
The accounting policies applied by each segment are the same as the Group’s accounting policies. Segment performance excludes the allocation of certain central administrative revenues and expenses, financial income and expenses, and income tax benefit or expense.
The performance of the operating segments is assessed by the Group’s CODM based on Adjusted EBITDA. Adjusted EBITDA is defined as net profit before income tax expense or benefit, net financial income or expenses, depreciation and amortization, adjusted to exclude certain items of a significant or unusual nature, including but not limited to non-cash pension income or expense, restructuring costs, related party management fees, unrealized gains or losses on derivatives, gains or losses on the sale of non-strategic assets, asset impairments and write-downs, strategic review costs and equity method profit not distributed in cash.
Reportable segment assets represent net external trade receivables, inventory, property plant and equipment (less right-of-use assets) and software. Reportable segment liabilities represent external trade payables.
Business segment reporting
| For the three month period ended June 30, 2020 | |||||||||||||||
| (In $ million) | Foodservice | Food Merchandising | Evergreen | Graham Packaging | Total reportable segments | ||||||||||
| Total reportable segment revenue | 405 | 348 | 348 | 462 | 1,563 | ||||||||||
| Reportable segment Adjusted EBITDA | 42 | 65 | 42 | 104 | 253 | ||||||||||
| For the six month period ended June 30, 2020 | |||||||||||||||
| (In $ million) | Foodservice | Food Merchandising | Evergreen | Graham Packaging | Total reportable segments | ||||||||||
| Total reportable segment revenue | 878 | 692 | 745 | 940 | 3,255 | ||||||||||
| Reportable segment Adjusted EBITDA | 107 | 123 | 93 | 204 | 527 | ||||||||||
| Reportable segment assets as of June 30, 2020 | 1,059 | 722 | 1,001 | 1,184 | 3,966 | ||||||||||
| Reportable segment liabilities as of June 30, 2020 | 73 | 62 | 108 | 130 | 373 | ||||||||||
| For the three month period ended June 30, 2019 | |||||||||||||||
| (In $ million) | Foodservice | Food Merchandising | Evergreen | Graham Packaging | Total reportable segments | ||||||||||
| Total reportable segment revenue | 560 | 346 | 389 | 499 | 1,794 | ||||||||||
| Reportable segment Adjusted EBITDA | 107 | 57 | 52 | 95 | 311 | ||||||||||
F-10
Reynolds Group Holdings Limited
Notes to the interim unaudited condensed consolidated financial statements
For the three and six month periods ended June 30, 2020
| For the six month period ended June 30, 2019 | |||||||||||||||
| (In $ million) | Foodservice | Food Merchandising | Evergreen | Graham Packaging | Total reportable segments | ||||||||||
| Total reportable segment revenue | 1,084 | 686 | 787 | 1,012 | 3,569 | ||||||||||
| Reportable segment Adjusted EBITDA | 186 | 113 | 100 | 190 | 589 | ||||||||||
| Reportable segment assets as of December 31, 2019 | 1,087 | 724 | 971 | 1,136 | 3,918 | ||||||||||
| Reportable segment liabilities as of December 31, 2019 | 94 | 69 | 128 | 109 | 400 | ||||||||||
The following table reconciles the Group’s reportable segment Adjusted EBITDA from continuing operations to profit (loss) from continuing operations before income tax:
| For the three month period ended June 30, | For the six month period ended June 30, | |||||||||||
| (In $ million) | 2020 | 2019 | 2020 | 2019 | ||||||||
| Reportable segment Adjusted EBITDA | 253 | 311 | 527 | 589 | ||||||||
| Other | 3 | 4 | 5 | 7 | ||||||||
| Unallocated | (6 | ) | (16 | ) | (18 | ) | (35 | ) | ||||
| 250 | 299 | 514 | 561 | |||||||||
| Adjustments to reconcile to profit from continuing operations before income tax: | ||||||||||||
| Depreciation and amortization from continuing operations | (155 | ) | (147 | ) | (303 | ) | (290 | ) | ||||
| Net financial income (expenses) | (170 | ) | (104 | ) | (238 | ) | (150 | ) | ||||
| Asset impairment charges, net of reversals | — | (17 | ) | 3 | (17 | ) | ||||||
| Gain (loss) on disposal of businesses and non-current assets | — | (14 | ) | (1 | ) | (14 | ) | |||||
| Non-cash pension expense | (12 | ) | (18 | ) | (25 | ) | (37 | ) | ||||
| Operational process engineering-related consultancy costs | (2 | ) | (6 | ) | (9 | ) | (13 | ) | ||||
| Related party management fee | (3 | ) | (4 | ) | (8 | ) | (8 | ) | ||||
| Restructuring costs, net of reversals | (6 | ) | (6 | ) | (12 | ) | (8 | ) | ||||
| Strategic review costs | (11 | ) | (1 | ) | (19 | ) | (1 | ) | ||||
| Unrealized gains (losses) on derivatives | 20 | 1 | 2 | 7 | ||||||||
| Other | 2 | (2 | ) | (4 | ) | (6 | ) | |||||
| Profit (loss) from continuing operations before income tax | (87 | ) | (19 | ) | (100 | ) | 24 | |||||
The following table presents a reconciliation of reportable segment assets and liabilities to total assets and liabilities:
| (In $ million) | As of June 30, 2020 | As of December 31, 2019 | ||||
| Reportable segment assets | 3,966 | 3,918 | ||||
| Other | 58 | 64 | ||||
Unallocated(1) | 8,227 | 12,275 | ||||
| Total assets | 12,251 | 16,257 | ||||
| Reportable segment liabilities | 373 | 400 | ||||
| Other | 13 | 17 | ||||
Unallocated(2) | 10,224 | 13,863 | ||||
| Total liabilities | 10,610 | 14,280 | ||||
| (1) | Comprised of unallocated assets, which are cash and cash equivalents, current tax assets, other current assets, assets held for sale or distribution, entity-wide property, plant and equipment, right-of-use assets, goodwill, intangible assets, deferred income taxes, related party receivables, derivatives and other assets. |
| (2) | Comprised of unallocated liabilities, which are other payables, current tax liabilities, borrowings, lease liabilities, derivatives, employee benefits, provisions, non-current payables and deferred tax liabilities. |
Information about geographic area
The Group operates primarily in North America. For each of the three and six month periods ended June 30, 2020, the percentage of revenue from sales originating in the United States was 87% (each of the three and six month periods ended June 30, 2019: 86%). For the three and six month periods ended June 30, 2020, the percentage of revenue from sales originating in other locations in North America was 6% and 7%, respectively (each of the three and six month periods ended June 30, 2019: 7%).
F-11
Reynolds Group Holdings Limited
Notes to the interim unaudited condensed consolidated financial statements
For the three and six month periods ended June 30, 2020
There was no revenue from external customers in New Zealand, where the Company is domiciled, for any period presented.
Information about major product lines
Supplemental information on net sales by major product line is set forth below:
| For the three month period ended June 30, | For the six month period ended June 30, | |||||||||||
| (In $ million) | 2020 | 2019 | 2020 | 2019 | ||||||||
| Foodservice | ||||||||||||
| Cups and lids | 163 | 242 | 362 | 449 | ||||||||
| Containers | 187 | 200 | 362 | 391 | ||||||||
| Dinnerware | 30 | 55 | 74 | 105 | ||||||||
| Other | 25 | 63 | 80 | 139 | ||||||||
| Food Merchandising | ||||||||||||
| Meat trays | 99 | 87 | 194 | 171 | ||||||||
| Dinnerware | 82 | 72 | 169 | 152 | ||||||||
| Bakery, snack, produce and fruit containers | 79 | 85 | 143 | 158 | ||||||||
| Prepared food trays | 28 | 41 | 62 | 82 | ||||||||
| Egg cartons | 24 | 23 | 50 | 49 | ||||||||
| Other | 36 | 38 | 74 | 74 | ||||||||
| Evergreen | ||||||||||||
| Cartons for fresh beverage products | 198 | 193 | 398 | 388 | ||||||||
| Liquid packaging board | 89 | 112 | 204 | 226 | ||||||||
| Paper products | 61 | 84 | 143 | 173 | ||||||||
| Graham Packaging | ||||||||||||
| Food and beverage containers | 346 | 350 | 692 | 710 | ||||||||
| All other plastic containers | 116 | 149 | 248 | 302 | ||||||||
| Other/Unallocated | ||||||||||||
| Caps and closures | 25 | 41 | 57 | 83 | ||||||||
| Other | — | 2 | — | 7 | ||||||||
| Inter-segment eliminations | (19 | ) | (31 | ) | (53 | ) | (65 | ) | ||||
| Total revenue | 1,569 | 1,806 | 3,259 | 3,594 | ||||||||
5. Seasonality
The Group’s business is impacted by seasonal fluctuations.
Foodservice
Foodservice’s operations are moderately seasonal, with favorable weather leading to increased consumption and a greater level of sales in the second and third quarters.
Food Merchandising
Food Merchandising’s operations are moderately seasonal, with favorable weather and the harvest season leading to increased consumption and a greater level of sales in the second and third quarters.
Evergreen
Evergreen’s operations are moderately seasonal. Evergreen’s customers are principally engaged in providing products that are generally less sensitive to seasonal effects, although Evergreen does experience some seasonality as a result of increased consumption of milk by school children during the North American academic year. Evergreen therefore typically experiences a greater level of carton product sales in the first and fourth quarters when North American schools are in session.
Graham Packaging
Graham Packaging’s operations are slightly seasonal with higher levels of unit volume sales of bottled beverages during the summer months, most significantly in North America.
F-12
Reynolds Group Holdings Limited
Notes to the interim unaudited condensed consolidated financial statements
For the three and six month periods ended June 30, 2020
6. Net other income (expenses)
| For the three month period ended June 30, | For the six month period ended June 30, | |||||||||||
| (In $ million) | 2020 | 2019 | 2020 | 2019 | ||||||||
| Asset impairment (charges) reversals, net | — | (16 | ) | 3 | (17 | ) | ||||||
| Gain (loss) on disposal of businesses and non-current assets | — | (14 | ) | (1 | ) | (14 | ) | |||||
| Net foreign currency exchange gains (losses) | 2 | — | (6 | ) | 1 | |||||||
| Related party management fee (refer to note 15) | (3 | ) | (4 | ) | (8 | ) | (8 | ) | ||||
| Unrealized gain (loss) on derivatives | 20 | 1 | 2 | 7 | ||||||||
| Transition service agreement income | 6 | 1 | 10 | 1 | ||||||||
| Other income (expenses) | 4 | — | 3 | 1 | ||||||||
| Net other income (expenses) | 29 | (32 | ) | 3 | (29 | ) | ||||||
7. Discontinued operations and assets and liabilities held for sale
On February 4, 2020, the Group effected a number of distributions to transfer its interest in the operations that represented the Reynolds Consumer Products segment to its shareholder, PFL. These distributions occurred prior to and in preparation for the IPO of shares of common stock of RCPI, which was completed on February 4, 2020. The results of Reynolds Consumer Products have been presented as discontinued operations for all periods presented.
The distribution of RCPI by the Company to PFL occurred by way of a share buy-back. The Company repurchased and canceled 35,791,985 shares from PFL in exchange for transferring 100% of the shares in RCPI to PFL. As a result, the Company’s fully paid outstanding shares decreased from 71,500,004 shares as of December 31, 2019 to 35,708,019 shares as of June 30, 2020. Following the distribution, both RCPI and the Group continue to be controlled by Mr. Graeme Hart. Accordingly, the Group has elected to account for the distribution of RCPI using the carrying value of the net assets that have been distributed, and this reduction in the Group’s net assets has been presented as a change in share capital.
On December 20, 2019, the Group completed the sale of its North American and Japanese closures businesses, pending the finalization of the working capital adjustment. These operations represent substantially all of the Group's former Closures segment. The results of the North American and Japanese closures businesses have been presented as discontinued operations in the comparative period. The Group retained and continues to operate the remaining closures businesses. In June 2020, the working capital adjustment was finalized and the Group received additional cash sale proceeds of $8 million.
The following tables present summarized information in relation to the results and cash flows of the discontinued operations, as well as the net assets of Reynolds Consumer Products as of the date of distribution.
| For the three month period ended June 30, | For the six month period ended June 30, | |||||||||||
| (In $ million) | 2020 | 2019 | 2020 | 2019 | ||||||||
Results of discontinued operations(a) | ||||||||||||
| Revenue | — | 842 | 174 | 1,525 | ||||||||
| Expenses | — | (713 | ) | (176 | ) | (1,333 | ) | |||||
| Profit (loss) before income tax | — | 129 | (2 | ) | 192 | |||||||
| Income tax benefit (expense) | (12 | ) | (24 | ) | (5 | ) | (36 | ) | ||||
| Profit (loss) from discontinued operations prior to gain on disposal | (12 | ) | 105 | (7 | ) | 156 | ||||||
| Gain (loss) on disposal | 12 | — | 14 | — | ||||||||
| Tax benefit (expense) on disposal | — | — | — | — | ||||||||
| Gain (loss) on disposal, net of tax | 12 | — | 14 | — | ||||||||
| Profit (loss) from discontinued operations | — | 105 | 7 | 156 | ||||||||
| Cash flows from (used in) discontinued operations | ||||||||||||
| Net cash from (used in) operating activities | (14 | ) | 95 | |||||||||
| Net cash from (used in) investing activities | (5 | ) | (59 | ) | ||||||||
| Net cash from (used in) financing activities | 478 | (6 | ) | |||||||||
| Net cash from (used in) discontinued operations | 459 | 30 | ||||||||||
| (a) | Intercompany sales to Reynolds Consumer Products, prior to the distribution on February 4, 2020, are presented in continuing operations and are eliminated in the results of discontinued operations. Sales for the six month period ended June 30, 2020 were $27 million (three and six month periods ended June 30, 2019: $66 million and $141 million, respectively). |
F-13
Reynolds Group Holdings Limited
Notes to the interim unaudited condensed consolidated financial statements
For the three and six month periods ended June 30, 2020
| (In $ million) | As of February 4, 2020 | ||
| Details of net assets distributed: | |||
| Cash and cash equivalents | 31 | ||
| Trade and other receivables, net | 246 | ||
| Inventories | 447 | ||
| Property, plant and equipment | 578 | ||
| Intangible assets | 3,043 | ||
| Other assets | 15 | ||
| Trade and other payables | (240 | ) | |
| Borrowings | (3,617 | ) | |
| Lease liabilities | (52 | ) | |
| Deferred tax liabilities | (285 | ) | |
| Employee benefits | (110 | ) | |
| Provisions | (10 | ) | |
| Net assets distributed | 46 | ||
Immediately prior to its distribution and the IPO, Reynolds Consumer Products incurred $2,475 million of term loan borrowings under its new credit facilities and $1,168 million of borrowings under an IPO settlement facility. The Group has not provided any guarantees or security in relation to Reynolds Consumer Products’ external borrowings. The cash proceeds from these new credit facilities, net of transaction costs and original issue discount, along with cash on-hand, were used to settle various intercompany balances between Reynolds Consumer Products and the Group.
8. Financial income and expenses
| For the three month period ended June 30, | For the six month period ended June 30, | |||||||||||
| (In $ million) | 2020 | 2019 | 2020 | 2019 | ||||||||
| Interest income | 1 | 3 | 5 | 6 | ||||||||
| Interest income on related party loans | 3 | 4 | 7 | 8 | ||||||||
| Net gain in fair value of derivatives | — | 5 | — | 70 | ||||||||
| Net foreign currency exchange gain | — | 1 | 35 | 1 | ||||||||
| Financial income | 4 | 13 | 47 | 85 | ||||||||
| Interest expense: | ||||||||||||
| Securitization Facility | (3 | ) | (4 | ) | (6 | ) | (9 | ) | ||||
| Credit Agreement | (28 | ) | (45 | ) | (66 | ) | (90 | ) | ||||
| Reynolds Notes: | ||||||||||||
| 6.875% Senior Secured Notes due 2021 | — | (6 | ) | — | (12 | ) | ||||||
| Floating Rate Senior Secured Notes due 2021 | (9 | ) | (9 | ) | (18 | ) | (18 | ) | ||||
| 5.125% Senior Secured Notes due 2023 | (20 | ) | (20 | ) | (41 | ) | (41 | ) | ||||
| 7.000% Senior Notes due 2024 | (14 | ) | (14 | ) | (28 | ) | (28 | ) | ||||
| Pactiv Debentures: | ||||||||||||
| 7.950% Debentures due 2025 | (5 | ) | (5 | ) | (11 | ) | (11 | ) | ||||
| 8.375% Debentures due 2027 | (4 | ) | (4 | ) | (8 | ) | (8 | ) | ||||
| Lease liabilities | (7 | ) | (6 | ) | (13 | ) | (12 | ) | ||||
| Amortization of: | ||||||||||||
| Transaction costs and original issue discount | (8 | ) | (3 | ) | (10 | ) | (5 | ) | ||||
| Embedded derivatives | 1 | 1 | 2 | 2 | ||||||||
| Net loss in fair value of derivatives | (19 | ) | — | (85 | ) | — | ||||||
| Net foreign currency exchange loss | (57 | ) | — | — | — | |||||||
| Other | (1 | ) | (2 | ) | (1 | ) | (3 | ) | ||||
| Financial expenses | (174 | ) | (117 | ) | (285 | ) | (235 | ) | ||||
| Net financial income (expenses) from continuing operations | (170 | ) | (104 | ) | (238 | ) | (150 | ) | ||||
F-14
Reynolds Group Holdings Limited
Notes to the interim unaudited condensed consolidated financial statements
For the three and six month periods ended June 30, 2020
| For the three month period ended June 30, | For the six month period ended June 30, | |||||||||||
| (In $ million) | 2020 | 2019 | 2020 | 2019 | ||||||||
| Net gain in fair value of derivatives | — | 2 | — | 2 | ||||||||
| Interest expense: | ||||||||||||
| 5.750% Senior Secured Notes due 2020 | — | (45 | ) | (17 | ) | (90 | ) | |||||
| Lease liabilities | — | (2 | ) | — | (3 | ) | ||||||
| Amortization of: | ||||||||||||
| Transaction costs | — | (1 | ) | (1 | ) | (3 | ) | |||||
| Embedded derivatives | — | — | — | 1 | ||||||||
| Net foreign currency exchange loss | — | — | — | (2 | ) | |||||||
Loss on extinguishment of debt(a) | — | — | (3 | ) | — | |||||||
| Other | — | 1 | 1 | 2 | ||||||||
| Net financial income (expenses) from discontinued operations | — | (45 | ) | (20 | ) | (93 | ) | |||||
| (a) | The loss on extinguishment of debt for the six month period ended June 30, 2020 of $3 million represents the write-off of unamortized debt issue costs and unamortized embedded derivatives. |
Refer to note 12 for information on the Group’s borrowings.
9. Income tax
Reconciliation of income tax expense
| For the three month period ended June 30, | For the six month period ended June 30, | |||||||||||
| (In $ million) | 2020 | 2019 | 2020 | 2019 | ||||||||
| Profit (loss) before income tax | (87 | ) | (19 | ) | (100 | ) | 24 | |||||
| Income tax using the New Zealand tax rate of 28% | 24 | 6 | 28 | (7 | ) | |||||||
| Effect of tax rates in foreign jurisdictions | 6 | (4 | ) | 15 | (5 | ) | ||||||
| Non-deductible expenses and permanent differences | 14 | (2 | ) | (18 | ) | (3 | ) | |||||
| Withholding tax | (1 | ) | (1 | ) | (3 | ) | (3 | ) | ||||
| Change in unrecognized deferred tax assets | (120 | ) | (9 | ) | 67 | (16 | ) | |||||
| Legislative changes | (52 | ) | — | 88 | — | |||||||
| Other | 1 | 1 | (3 | ) | (1 | ) | ||||||
| Total income tax (expense) benefit | (128 | ) | (9 | ) | 174 | (35 | ) | |||||
The effective tax rates for the three and six month periods ended June 30, 2020 and 2019 represent the Group’s estimate of the effective rates expected to be applicable for the respective full fiscal years, adjusted for any discrete events which are recorded in the period that they occur.
The unusual effective tax rate for the six month period ended June 30, 2020 is primarily attributable to the combination of the enactment of the CARES Act in March 2020 and the mix of book income and losses among the jurisdictions in which the Group operates. The unusual effective tax rate for the three month period ended June 30, 2020 is primarily attributable to the impact of revised forecasts on the Group’s U.S. annualized effective tax rate, the resulting impact of the change in annualized tax rate on previously recognized tax benefits from CARES Act legislative changes and the mix of book income and losses taxed at varying rates among the jurisdictions in which the Group operates.
Retroactive provisions of the CARES Act enable the Group to utilize additional allowable interest deductions, which lowers taxable income for both the year ended December 31, 2019 and the year ending December 31, 2020. The Group has recognized in the six month period ended June 30, 2020 a tax benefit of $90 million in respect of its taxable income for the year ended December 31, 2019. This estimate will be updated when the U.S. federal and state tax returns for the year ended December 31, 2019 are finalized and filed. The estimated annualized effective tax rate when applied to the year-to-date loss resulted in a higher tax benefit during the six month period ended June 30, 2020 than expected for the full year. The interim tax benefit will largely reverse as additional tax expense during the remainder of the year ending December 31, 2020. These estimates for 2019 and 2020 are also subject to further revision as result of regulations issued subsequent to June 30, 2020.
In addition to the above amounts, for the three and six month periods ended June 30, 2020, the Group has recognized a tax benefit of $5 million and $91 million, respectively, directly in other comprehensive income in relation to movements in pensions and post-employment benefits (three and six month periods ended June 30, 2019: tax benefit of $6 million and $29 million, respectively).
F-15
Reynolds Group Holdings Limited
Notes to the interim unaudited condensed consolidated financial statements
For the three and six month periods ended June 30, 2020
10. Depreciation and amortization expenses
Property, plant and equipment
Depreciation expense related to property, plant and equipment is recognized in the following components in the statements of comprehensive income:
| For the three month period ended June 30, | For the six month period ended June 30, | |||||||||||
| (In $ million) | 2020 | 2019 | 2020 | 2019 | ||||||||
| Cost of sales | 105 | 99 | 204 | 196 | ||||||||
| General and administration expenses | 3 | 3 | 6 | 6 | ||||||||
| Discontinued operations | — | 28 | 5 | 52 | ||||||||
| Total depreciation expense | 108 | 130 | 215 | 254 | ||||||||
Intangible assets
Amortization expense related to intangible assets is recognized in the following components in the statements of comprehensive income:
| For the three month period ended June 30, | For the six month period ended June 30, | |||||||||||
| (In $ million) | 2020 | 2019 | 2020 | 2019 | ||||||||
| Cost of sales | 11 | 11 | 21 | 21 | ||||||||
| General and administration expenses | 36 | 34 | 72 | 67 | ||||||||
| Discontinued operations | — | 11 | 3 | 24 | ||||||||
| Total amortization expense | 47 | 56 | 96 | 112 | ||||||||
11. Inventories
| (In $ million) | As of June 30, 2020 | As of December 31, 2019 | ||||
| Raw materials and consumables | 190 | 340 | ||||
| Work in progress | 120 | 178 | ||||
| Finished goods | 517 | 699 | ||||
| Engineering and maintenance materials | 100 | 126 | ||||
| Provision against inventories | (24 | ) | (31 | ) | ||
| Total inventories | 903 | 1,312 | ||||
During the three and six month periods ended June 30, 2020, the raw materials elements of inventories recognized in continuing operations in the statements of comprehensive income as a component of cost of sales totaled approximately $0.6 billion and $1.3 billion, respectively (three and six month periods ended June 30, 2019: $0.7 billion and $1.4 billion, respectively).
There were no cost of sales recognized for discontinued operations during the three month period ended June 30, 2020. During the six month period ended June 30, 2020, the raw materials elements of inventories in cost of sales recognized as part of discontinued operations in the statements of comprehensive income totaled $0.1 billion (three and six month periods ended June 30, 2019: $0.4 billion and $0.8 billion, respectively).
F-16
Reynolds Group Holdings Limited
Notes to the interim unaudited condensed consolidated financial statements
For the three and six month periods ended June 30, 2020
12. Borrowings
As of June 30, 2020, the Group was in compliance with all of its covenants.
The Group’s borrowings are detailed below.
| (In $ million) | As of June 30, 2020 | As of December 31, 2019 | ||||
| Securitization Facility | 380 | 420 | ||||
| Credit Agreement | 3,452 | 3,487 | ||||
| Reynolds Notes: | ||||||
| 5.750% Senior Secured Notes due 2020 | — | 3,137 | ||||
| Floating Rate Senior Secured Notes due 2021 | 749 | 750 | ||||
| 5.125% Senior Secured Notes due 2023 | 1,599 | 1,600 | ||||
| 7.000% Senior Notes due 2024 | 800 | 800 | ||||
| Pactiv Debentures: | ||||||
| 7.950% Debentures due 2025 | 276 | 276 | ||||
| 8.375% Debentures due 2027 | 200 | 200 | ||||
| Other | 16 | 15 | ||||
| Total principal amount of borrowings | 7,472 | 10,685 | ||||
| Transaction costs | (27 | ) | (41 | ) | ||
| Embedded derivatives | 12 | 16 | ||||
| Original issue discounts, net of premiums | (2 | ) | (5 | ) | ||
| Less: | ||||||
| Finance leases classified as lease liabilities | (14 | ) | (15 | ) | ||
| Carrying value | 7,441 | 10,640 | ||||
| Current borrowings | 415 | 3,587 | ||||
| Non-current borrowings | 7,026 | 7,053 | ||||
| Total borrowings | 7,441 | 10,640 | ||||
Refer to note 16 for information on borrowing transactions which occurred subsequent to June 30, 2020.
12.1 Securitization Facility
The $450 million securitization facility (the “Securitization Facility”) matures on March 22, 2022. The amount that can be borrowed is calculated by reference to a funding base determined by the amount of eligible trade receivables. Prior to its distribution, Reynolds Consumer Products ceased to participate in the Group’s Securitization Facility, and consequently, in January 2020, the size of this facility was reduced from $600 million to $450 million. The Securitization Facility is secured by all of the assets of the borrower, which are primarily the eligible trade receivables and cash. The terms of the arrangement do not result in the derecognition of the trade receivables by the Group. The Securitization Facility has an interest rate equal to one-month LIBOR with a 0.0% floor, plus a margin of 1.75% per annum.
12.2 Credit Agreement
The Company and certain members of the Group are parties to a senior secured credit agreement dated August 5, 2016, as amended (the “Credit Agreement”). The Credit Agreement comprises the following term and revolving tranches:
| Currency | Maturity date | Current facility value (in million) | Value drawn or utilized as of June 30, 2020 (in million) | Applicable interest rate as of June 30, 2020 | ||||||||
| Term Tranches | ||||||||||||
| U.S. Term Loans | $ | February 5, 2023 | 3,187 | LIBOR (floor of 0.000%) + 2.750% | ||||||||
| European Term Loans | € | February 5, 2023 | 236 | EURIBOR (floor of 0.000%) + 3.250% | ||||||||
Revolving Tranche(1) | ||||||||||||
| U.S. Revolving Loans | $ | August 5, 2021 | 302 | 47 | — | |||||||
| (1) | The Revolving Tranche was utilized in the form of letters of credit. |
Indebtedness under the Credit Agreement may be voluntarily repaid in whole or in part and must be mandatorily repaid in certain circumstances. The borrowers also make quarterly amortization payments of 0.25% of the principal amount of the term loans outstanding on February 7, 2017. The borrowers are required to make annual prepayments of term loans with up to 50% of excess cash flow (which will be reduced to 25% or 0% if
F-17
Reynolds Group Holdings Limited
Notes to the interim unaudited condensed consolidated financial statements
For the three and six month periods ended June 30, 2020
specified senior secured first lien leverage ratios are met) as determined in accordance with the Credit Agreement. No excess cash flow prepayments were due in 2019 for the year ended December 31, 2018 or are due in 2020 for the year ended December 31, 2019.
In connection with the distribution of Reynolds Consumer Products on February 4, 2020, the relevant legal entities within Reynolds Consumer Products were released as borrowers under the Credit Agreement and released as guarantors of the Credit Agreement. In connection with such releases, the security granted by such entities was also released. Other than these releases, the guarantee and security arrangements and the covenants under the Credit Agreement are unchanged from December 31, 2019.
In January 2020, the Group repaid $18 million of borrowings under the Credit Agreement with the net proceeds from the sale of its North American and Japanese closures businesses.
12.3 Reynolds Notes
The maturity and interest payment dates of the Group’s outstanding borrowings as of June 30, 2020 issued by Reynolds Group Issuer LLC, Reynolds Group Issuer Inc. and Reynolds Group Issuer (New Zealand) Limited are summarized below:
| Maturity date | Interest payment dates | |||
Floating Rate Senior Secured Notes due 2021(1) | July 15, 2021 | January 15, April 15, July 15 and October 15 | ||
5.125% Senior Secured Notes due 2023(2) | July 15, 2023 | January 15 and July 15 | ||
| 7.000% Senior Notes due 2024 | July 15, 2024 | January 15 and July 15 | ||
| (1) | The Floating Rate Senior Secured Notes due 2021 have an interest rate equal to three-month U.S. LIBOR plus 3.500% reset quarterly. In July 2016, the Group entered into an interest rate swap agreement to mitigate the interest rate risk exposure of the Floating Rate Senior Secured Notes due 2021. While the Group has elected not to adopt hedge accounting, the economic effect of this derivative is that the effective interest rate on the Floating Rate Senior Secured Notes due 2021 is 4.670% from October 15, 2016. |
| (2) | $250 million aggregate principal amount of 5.125% Senior Secured Notes due 2023 were issued at an issue price of 103.500%. |
In January 2020, the Group repaid (i) $18 million aggregate principal amount of 5.750% Senior Secured Notes due 2020; (ii) $1 million aggregate principal amount of Floating Rate Senior Secured Notes due 2021; and (iii) $1 million aggregate principal amount of 5.125% Senior Secured Notes due 2023, at face value plus accrued and unpaid interest, with the net proceeds from the sale of its North American and Japanese closures businesses.
On February 4, 2020, the Group repaid in full all of the $3.1 billion aggregate principal amount outstanding of its 5.750% Senior Secured Notes due 2020 at face value plus accrued and unpaid interest. The repayment of these borrowings resulted in a $3 million loss on extinguishment of debt.
Assets pledged as security for borrowings
The shares in Beverage Packaging Holdings I ("BP I") (a wholly owned subsidiary of the Company) have been pledged as collateral to support the obligations under the Credit Agreement and the Reynolds Senior Secured Notes. In addition, the Company, BP I and certain subsidiaries of BP I have pledged substantially all of their assets as collateral to support the obligations under the Credit Agreement and the Reynolds Senior Secured Notes.
Additional information regarding the Reynolds Notes
As a result of the distribution of Reynolds Consumer Products on February 4, 2020, the relevant legal entities within Reynolds Consumer Products were released as guarantors of the Reynolds Notes. In connection with such releases, the security granted by such entities was also released. Other than these releases, the guarantee and security arrangements, indenture restrictions, early redemption options and change in control provisions for the Reynolds Notes are unchanged from December 31, 2019.
12.4 Pactiv Debentures
The maturity and interest payment dates of the Group’s outstanding borrowings as of June 30, 2020 issued by Pactiv LLC are summarized as follows:
| Maturity date | Semi-annual interest payment dates | |||
| 7.950% Debentures due 2025 | December 15, 2025 | June 15 and December 15 | ||
| 8.375% Debentures due 2027 | April 15, 2027 | April 15 and October 15 | ||
The guarantee arrangements, indenture restrictions and redemption terms for the Pactiv Debentures are unchanged from December 31, 2019.
12.5 Other
As of June 30, 2020, in addition to the Securitization Facility, the Credit Agreement, the Reynolds Notes and the Pactiv Debentures, the Group had a number of unsecured working capital facilities extended to certain operating companies of the Group. These facilities bear interest at floating or fixed rates.
As of June 30, 2020, the Group had local working capital facilities in a number of jurisdictions which are secured by the collateral under the Credit Agreement and the Reynolds Senior Secured Notes and by certain other assets. These facilities rank pari passu with the obligations under the Credit Agreement and under the Reynolds Senior Secured Notes.
F-18
Reynolds Group Holdings Limited
Notes to the interim unaudited condensed consolidated financial statements
For the three and six month periods ended June 30, 2020
13. Related parties
Related party entities, transaction values and outstanding balances are detailed below. All related parties detailed below have a common ultimate shareholder, except for the joint ventures.
| Transaction value for the three month period ended June 30, | Transaction value for the six month period ended June 30, | Balance outstanding as of | ||||||||||||||||
| (In $ million) | 2020 | 2019 | 2020 | 2019 | June 30, 2020 | December 31, 2019 | ||||||||||||
| Balances and transactions with joint ventures | ||||||||||||||||||
| Included in trade and other receivables, net | 11 | 8 | ||||||||||||||||
Sale of goods and services(a) | 7 | 6 | 18 | 16 | ||||||||||||||
| Balances and transactions with other entities controlled by Mr. Graeme Hart | ||||||||||||||||||
| Included in trade and other receivables, net | 63 | — | ||||||||||||||||
Sale of goods and services(b) | 84 | 66 | 171 | 141 | ||||||||||||||
Transition services agreement and rental income(b) | 5 | — | 8 | — | ||||||||||||||
| Recharges | 1 | 2 | 1 | 4 | ||||||||||||||
| Tax loss transfer | — | — | 13 | — | ||||||||||||||
Included in related party and other non-current receivables(c) | 330 | 339 | ||||||||||||||||
| Interest income | 3 | 4 | 6 | 8 | ||||||||||||||
| Included in trade and other payables | (48 | ) | (30 | ) | ||||||||||||||
Purchase of goods(b) | (24 | ) | (38 | ) | (63 | ) | (78 | ) | ||||||||||
Recharges(d) | (4 | ) | (5 | ) | (10 | ) | (10 | ) | ||||||||||
Management fee(e) | (3 | ) | (8 | ) | (8 | ) | (13 | ) | ||||||||||
| Tax loss transfer | — | (2 | ) | (1 | ) | (2 | ) | |||||||||||
| (a) | All transactions with joint ventures are settled in cash. Sales of goods and services are negotiated on a cost-plus basis allowing a margin ranging from 3% to 6%. All amounts are unsecured, non-interest bearing and repayable on demand. |
| (b) | Following the distribution of Reynolds Consumer Products on February 4, 2020, the Group continues to trade with Reynolds Consumer Products, selling and purchasing various goods and services under contractual arrangements that expire over a variety of periods through to 2024. Effective February 4, 2020 and thereafter, these transactions are related party transactions and are included in the table above. Prior to February 4, 2020, these transactions were intercompany transactions that eliminated on consolidation. As part of the separation process, the Group has entered into two lease arrangements with Reynolds Consumer Products and entered into a transition services agreement to provide ongoing agreed services to Reynolds Consumer Products, as requested. |
| (c) | The loan receivable due from Rank Group Limited accrues interest at a rate based on the average 90-day New Zealand bank bill rate, set quarterly, plus a margin of 3.25%. Interest is only charged or accrued if demanded by the Company. During the three and six month periods ended June 30, 2020, interest was charged at 3.458% and 3.458% to 4.275%, respectively (three and six month periods ended June 30, 2019: 4.962% and 4.962% to 5.149%, respectively). The loan is unsecured and repayable on demand. |
| (d) | Represents certain costs paid by Rank Group Limited or Rank Group North America, Inc. on behalf of the Group that were subsequently recharged to the Group. These charges are for various costs incurred including services provided, financing and other activities. All amounts are unsecured, non-interest bearing and settled on normal trade terms. |
| (e) | The Group’s financing agreements permit the payment to related parties of a management fee, as defined below, of up to 1.5% of the Group’s Adjusted EBITDA (as defined in the financing agreements) for the previous year. Of the management fee expense in the table above, $4 million and $8 million for the three and six month periods ended June 30, 2019, respectively, was recognized in continuing operations, with the remainder included in discontinued operations. All of the management fee expense for the three and six month periods ended June 30, 2020 was recognized in continuing operations. |
14. Employee benefits
The Group has various defined benefit pension plans and post-employment medical benefit plans. The Group’s non-current employee benefits liability increased by $336 million during the six month period ended June 30, 2020, driven mainly by a $212 million increase in the pension plan liability from a decrease of 44 basis points in the discount rate and a decrease of $150 million in the fair values of pension plan assets. Additionally, there was a decrease of $51 million related to a plan that was distributed with Reynolds Consumer Products. A significant portion of the net increase in the pension liability has been recognized directly in equity.
15. Contingencies
Management fee
The Group’s financing agreements permit the payment to related parties of management, consulting, monitoring, and advising fees (the “Management Fee”) of up to 1.5% of the Group’s Adjusted EBITDA (as defined in the financing agreements) for the previous year.
F-19
Reynolds Group Holdings Limited
Notes to the interim unaudited condensed consolidated financial statements
For the three and six month periods ended June 30, 2020
The Credit Agreement permits the Group to pay an additional Management Fee of up to $22 million in respect of the 2009 and 2010 financial years. No amount has been accrued in respect of the remaining 2009 and 2010 permitted Management Fee.
Other matters
The Group is party to litigation, legal proceedings and tax examinations arising from its operations. The Group establishes provisions for claims and proceedings that constitute a present obligation when it is probable that an outflow of resources will be required to settle the obligation and a reliable estimate of such obligation can be made. While it is not possible to predict the outcome of any of these matters, based on management's assessment of the facts and circumstances now known, management does not believe any of these matters, individually or in the aggregate, will have a material adverse effect on the Group's financial position, results of operations or cash flows. However, actual outcomes may differ from those expected and could have a material effect on the Group's financial position, results of operations or cash flows in a particular future period. As of June 30, 2020, except for amounts provided, there were no legal proceedings pending other than those for which the Group has determined that the possibility of a material outflow is remote.
As part of the agreements for the sale of various businesses, the Group has provided certain warranties and indemnities to the respective purchasers as set out in the respective sale agreements. These warranties and indemnities are subject to various terms and conditions affecting the duration and total amount of the indemnities. As of June 30, 2020, the Group is not aware of any material claims under these agreements that would give rise to an additional liability. However, if such claims arise in the future, they could have a material effect on the Group’s financial position, results of operations and cash flows.
16. Subsequent events
Separate financing of Graham Packaging
On August 4, 2020, the legal entities that comprise the Graham Packaging segment (“GPC”) were designated as unrestricted subsidiaries under the Credit Agreement and the Reynolds Notes and the relevant GPC entities were released as a borrower under, and guarantors of, the Credit Agreement and released as guarantors of the Reynolds Notes. The security granted by such entities was also released.
On August 4, 2020 GPC entered into a credit agreement (the “GPC Credit Agreement”), which provides for a $1,475 million senior secured term loan facility maturing in August 2027 and a $100 million revolving facility maturing in August 2025. The term loans were fully drawn on August 4, 2020 and bear interest at the LIBO Rate, subject to a 0.75% floor, plus a margin of 3.75%. The revolving facility has been utilized in the amount of approximately $4 million for letters of credit.
The obligations under the GPC Credit Agreement are guaranteed by certain subsidiaries in GPC and are secured by substantially all the assets of the borrower and the guarantors.
On August 4, 2020, GPC also issued $510 million of 7.125% senior notes maturing in August 2028 (together with the GPC term loans under the GPC Credit Agreement, the “GPC Borrowings”). The senior notes are guaranteed by the same entities that guarantee the obligations under the GPC Credit Agreement.
The terms of the GPC Borrowings restrict distributions of cash or assets from GPC to the rest of the Group. No entities outside of GPC have provided any guarantees or security in relation to the GPC Borrowings.
The net proceeds from the GPC Borrowings were distributed to certain non-GPC members of the Group and were partially used to repay certain of the borrowings described below.
Repayment of borrowings
Subsequent to June 30, 2020, the Group has repaid an aggregate of $2,094 million principal amount of borrowings, and the Group has issued a conditional notice of redemption to redeem an additional $150 million of senior notes as described below.
On July 31, 2020, the Group repaid the $380 million of principal outstanding under the Securitization Facility and terminated this facility. The early repayment of these borrowings resulted in a loss on extinguishment of debt of $2 million in respect of the write-off of unamortized deferred transaction costs.
On August 4, 2020, the Group satisfied and discharged the $749 million aggregate principal amount outstanding under the Floating Rate Senior Secured Notes due 2021 at par. The early repayment of these notes resulted in a loss on extinguishment of debt of $4 million in respect of the write-off of unamortized deferred transaction costs and original issue discount. On August 7, 2020, the Group terminated and settled the outstanding interest rate swap related to the Floating Rate Senior Secured Notes Due 2021, resulting in the payment of $7 million to settle the liability.
On August 4, 2020, the Group repaid in full the €236 million ($265 million) of borrowings under the European Term Loan and all obligations under this tranche terminated. The early repayment of these borrowings resulted in a loss on extinguishment of debt of less than $1 million in respect of the write-off of unamortized deferred transaction costs.
On August 4, 2020, the Group repaid $700 million of borrowings under the U.S. Term Loans. The early repayment of these borrowings resulted in a loss on extinguishment of debt of less than $1 million in respect of a proportional write-off of unamortized deferred transaction costs.
On July 30, 2020, the Group issued a conditional redemption notice to redeem $150 million aggregate principal amount of the 7.000% senior notes due 2024 at price of 101.750%. The conditions for the redemption were satisfied on August 4, 2020 with the redemption scheduled to occur on August 29, 2020.
F-20
Reynolds Group Holdings Limited
Notes to the interim unaudited condensed consolidated financial statements
For the three and six month periods ended June 30, 2020
Other
On August 4, 2020, the Group announced that it has confidentially submitted a draft registration statement on Form S-1 to the U.S. Securities and Exchange Commission (the “SEC”) relating to the Company’s proposed initial public offering of its common stock. The number of shares to be offered and the price range for the proposed offering have not yet been determined. The initial public offering is expected to commence after the SEC completes its review process, subject to market and other conditions. If the initial public offering proceeds, the Company’s present intention is to convert into a Delaware corporation with the name Pactiv Evergreen Inc. Furthermore, immediately prior to such initial public offering, it will distribute to its shareholder, PFL, the Company’s Graham Packaging business. There is no assurance that the initial public offering will be completed.
There have been no other events subsequent to June 30, 2020 which would require accrual or disclosure in these interim unaudited condensed consolidated financial statements.
F-21